


方案详情
文
苜蓿RuBisCO(核酮糖-1,5-二磷酸羧化酶加氧酶)去除叶绿体材料时的超分子结构修饰Supramolecular structure modification of RuBisCO from alfalfa during removal of chloroplastic materials
方案详情

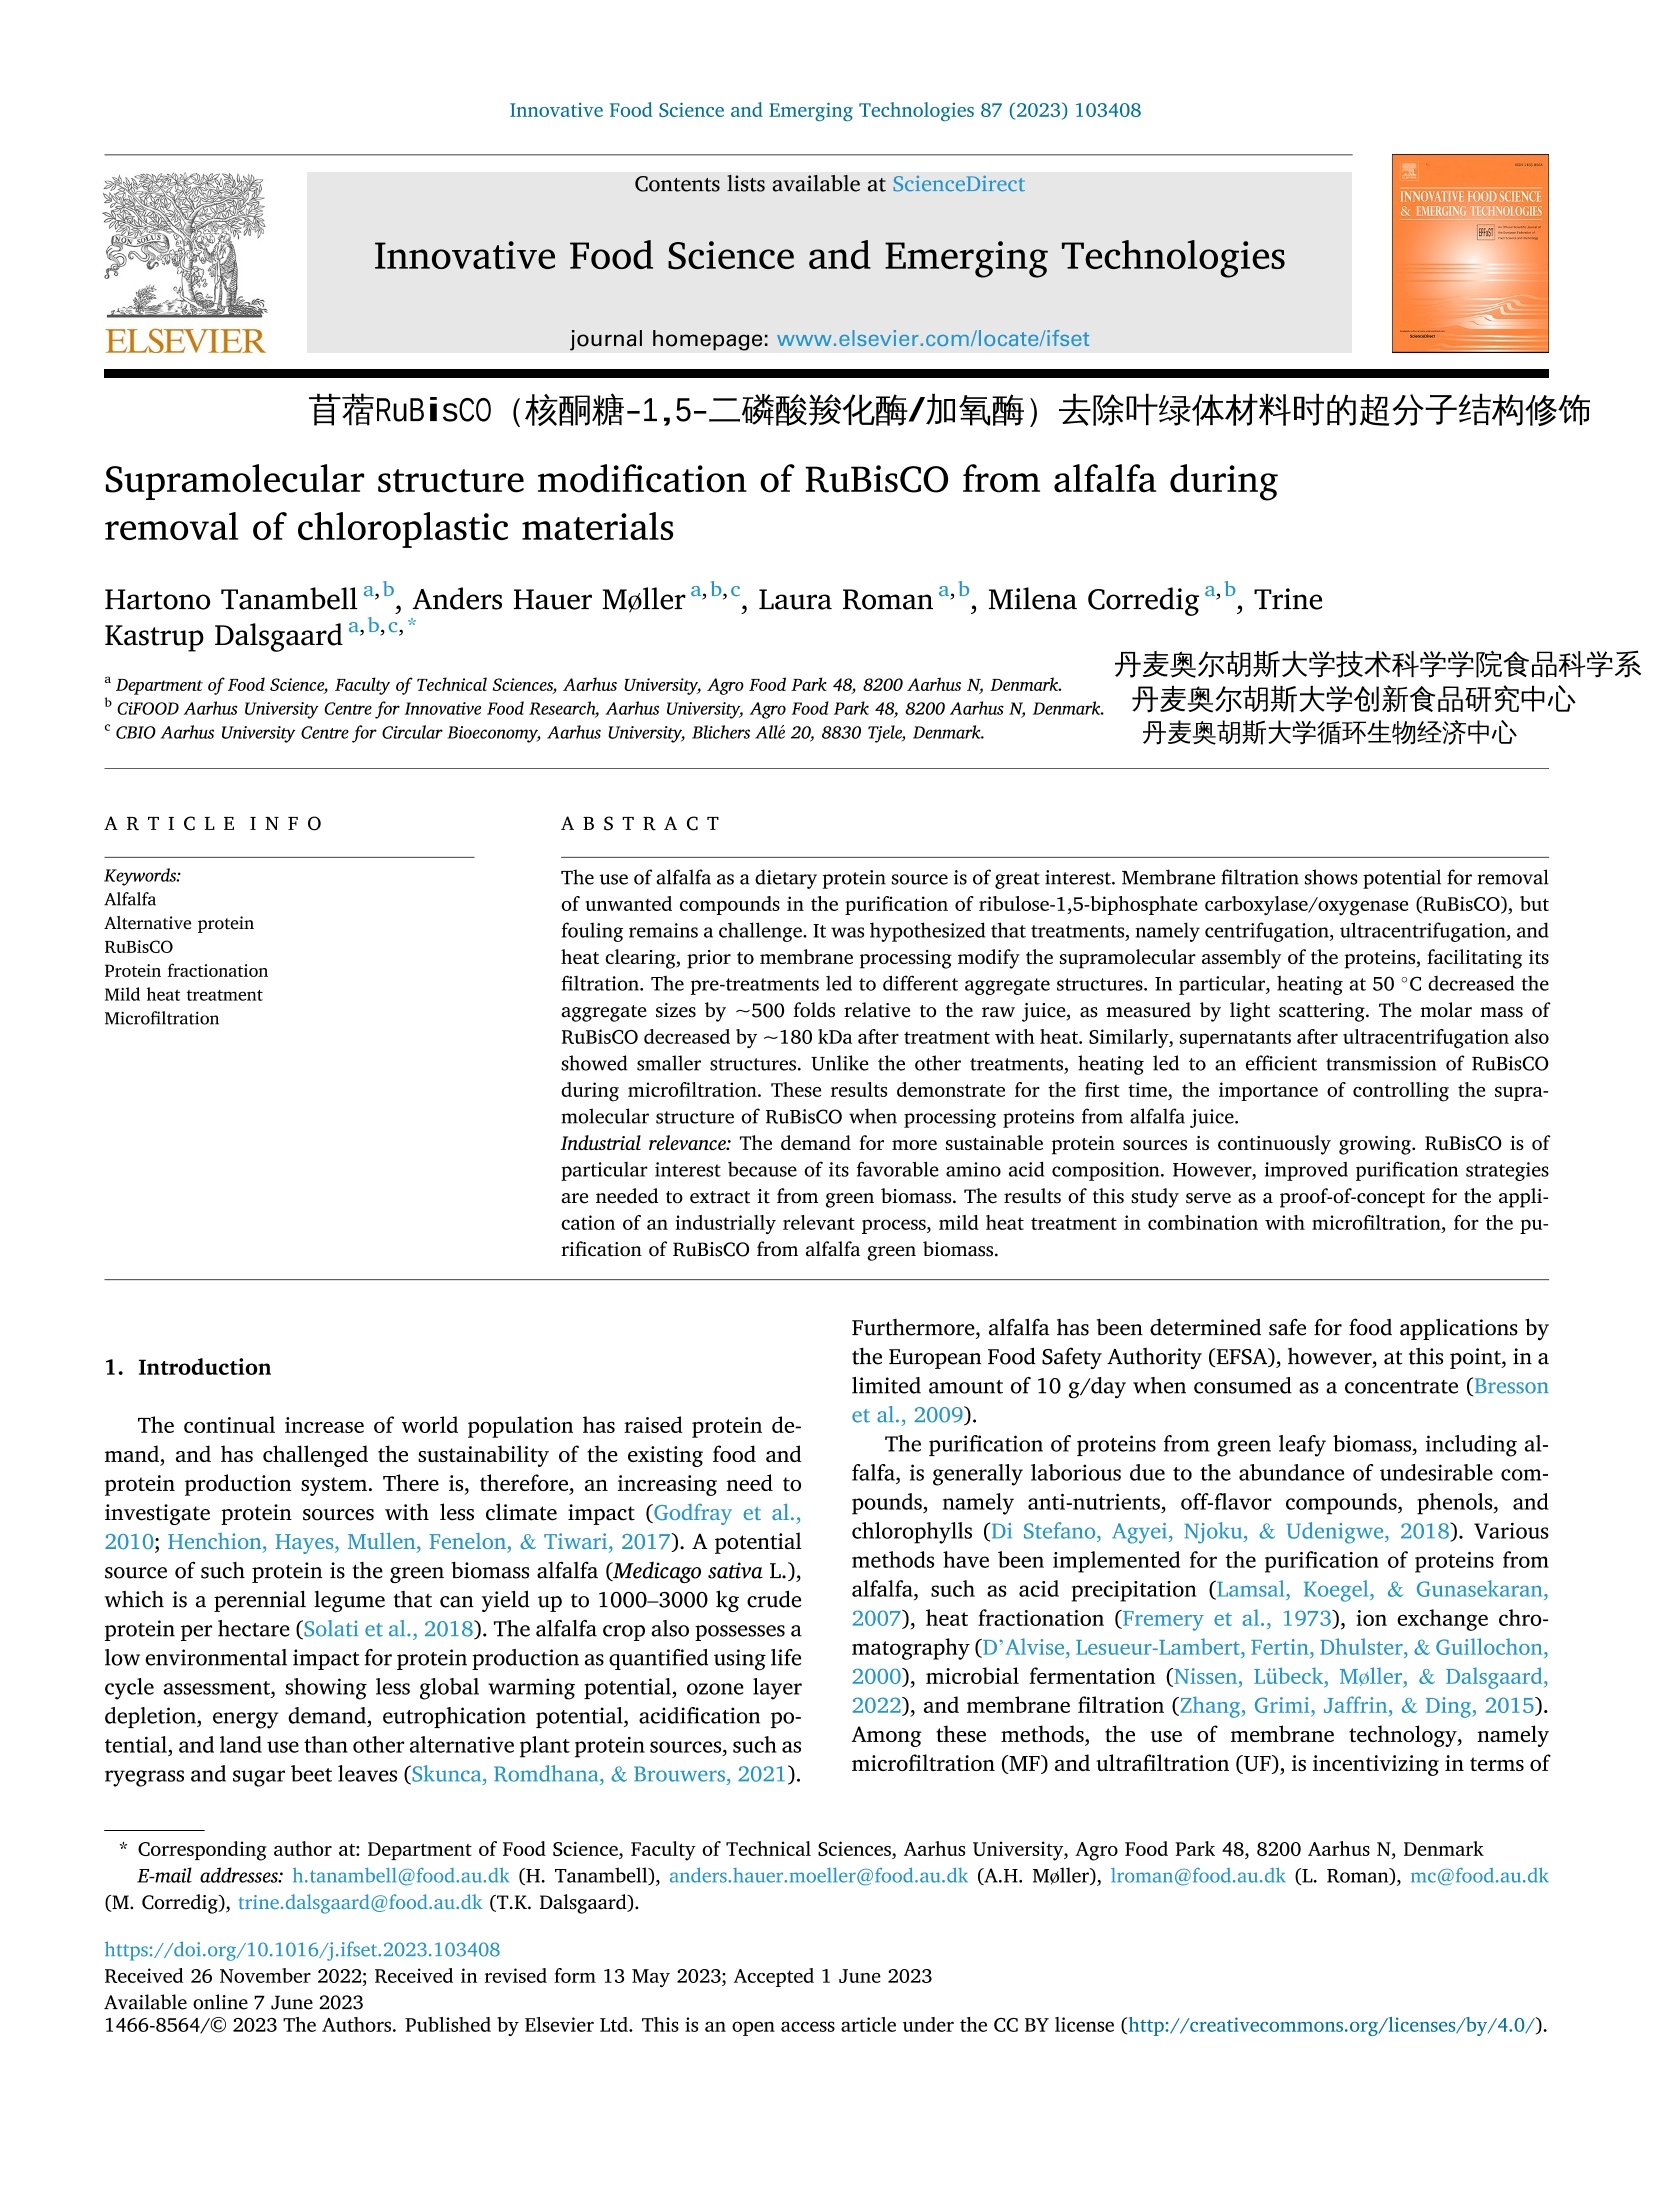
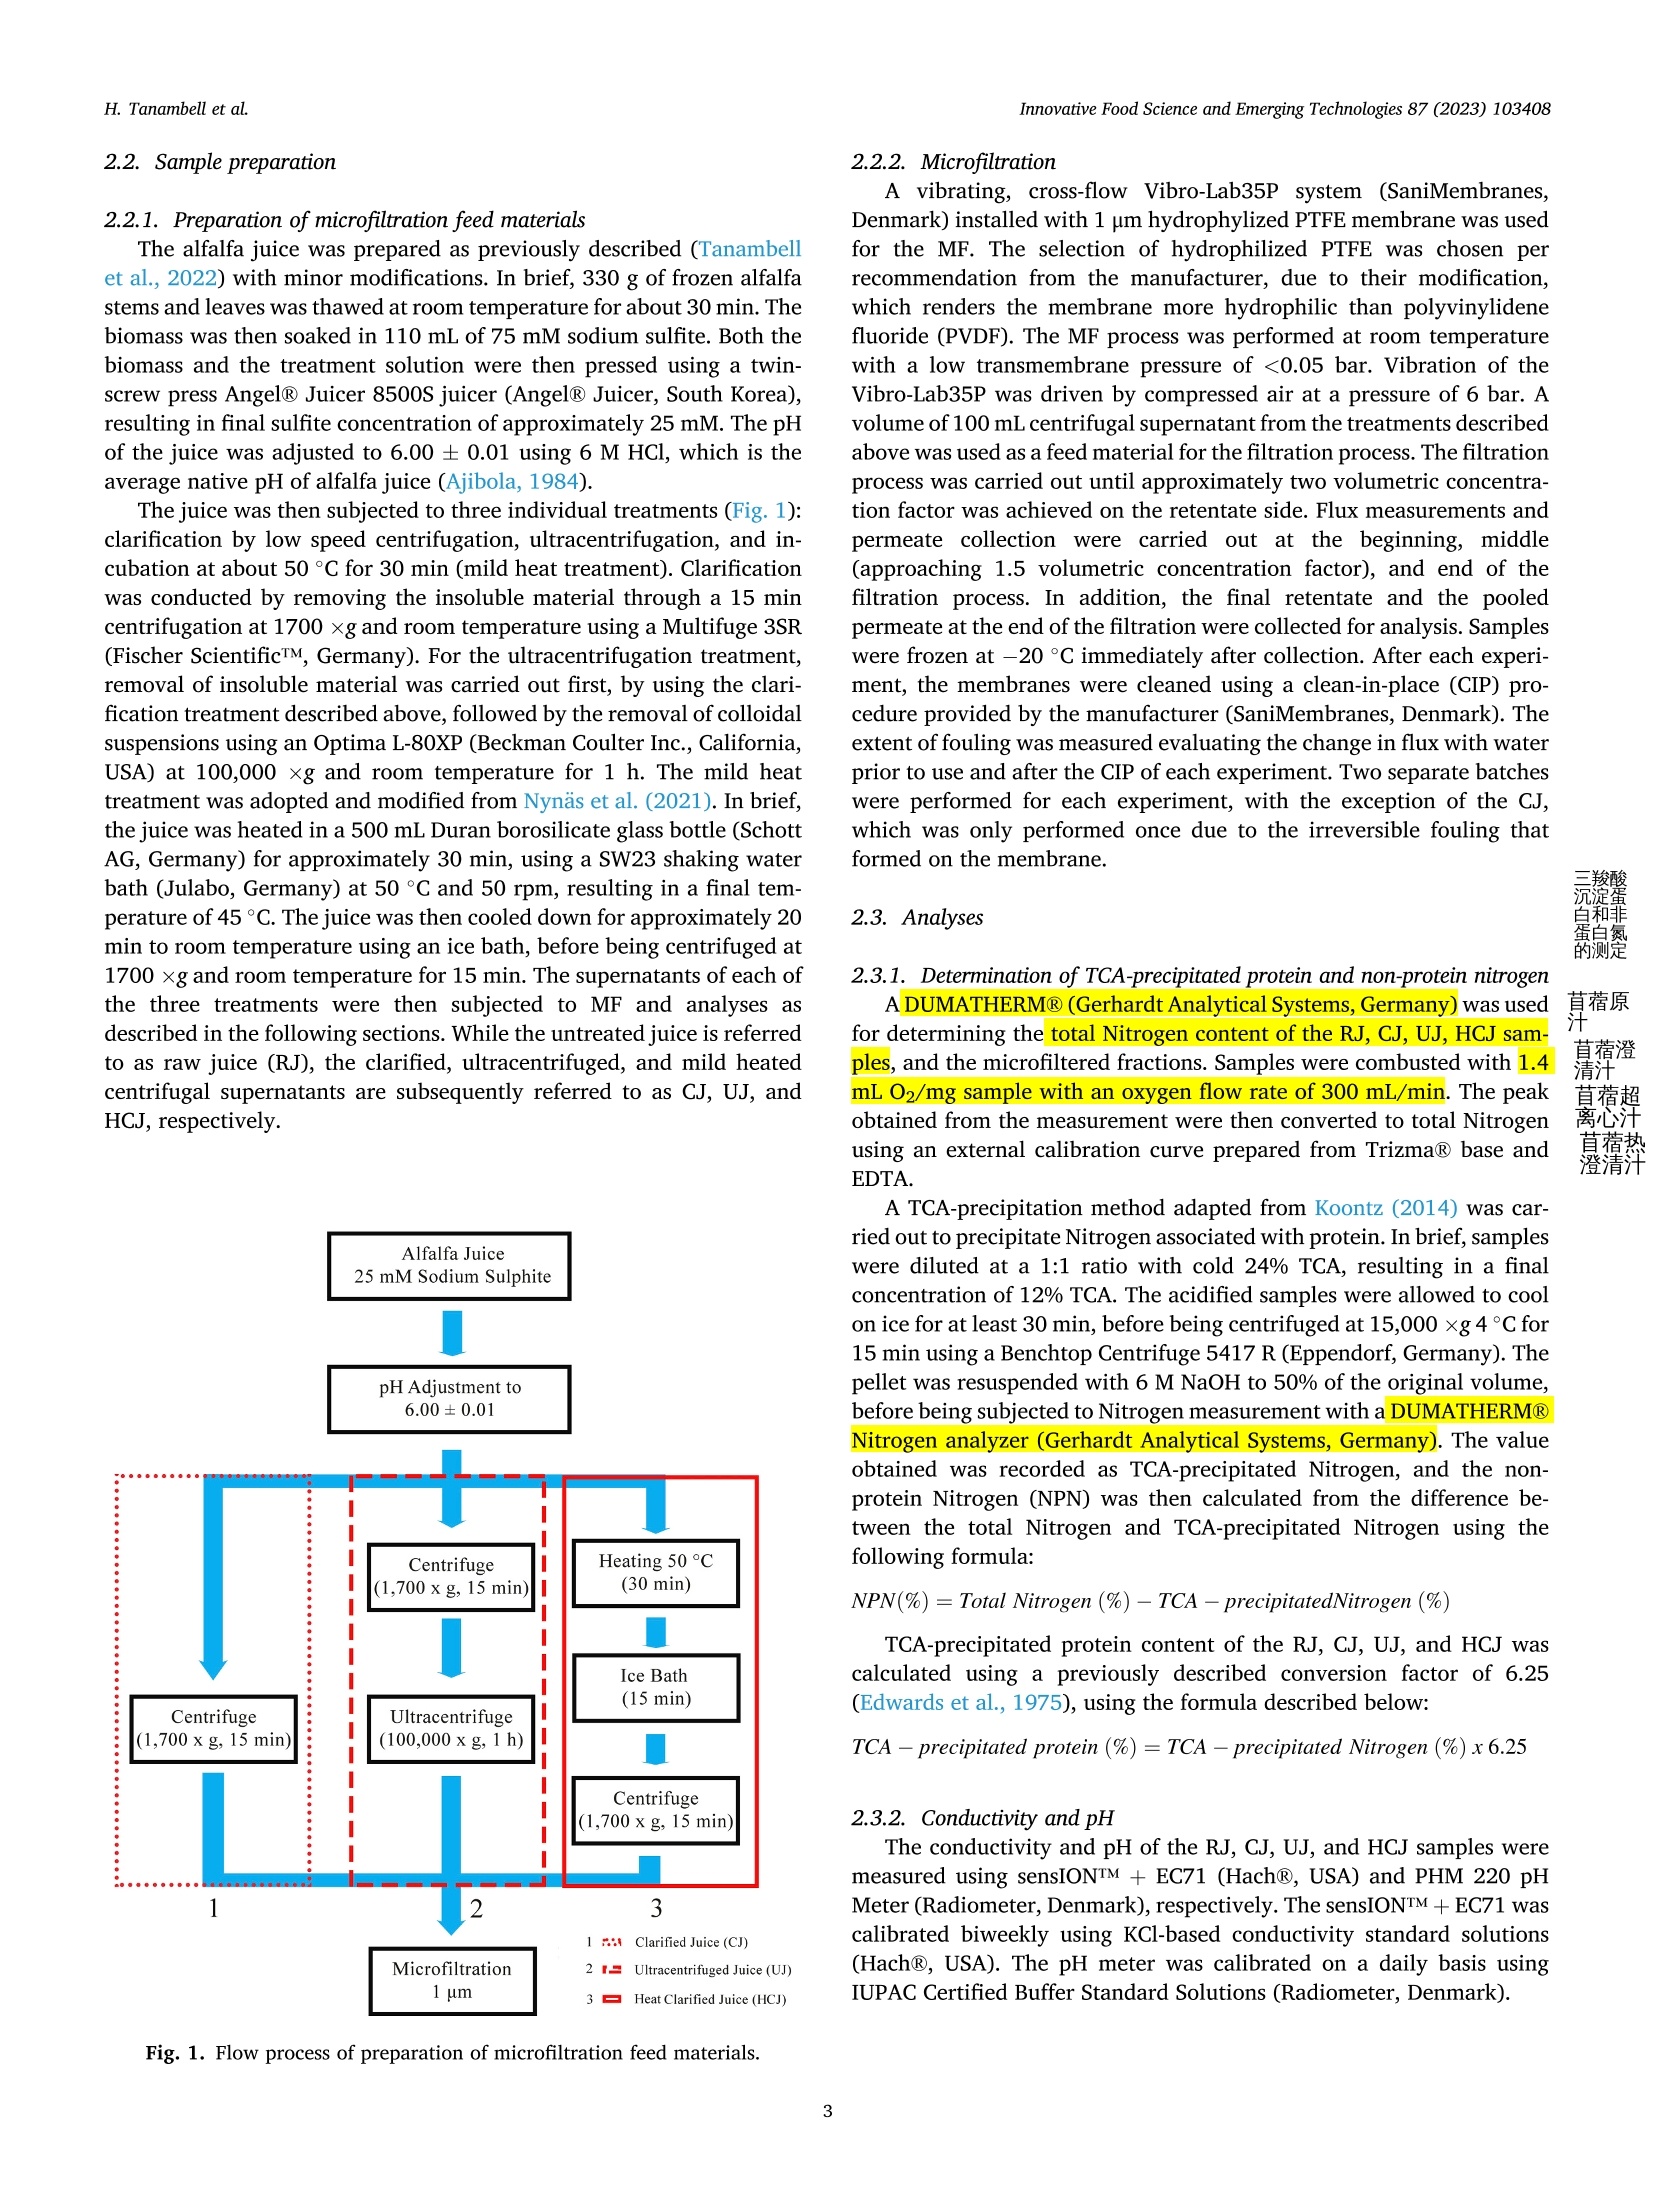
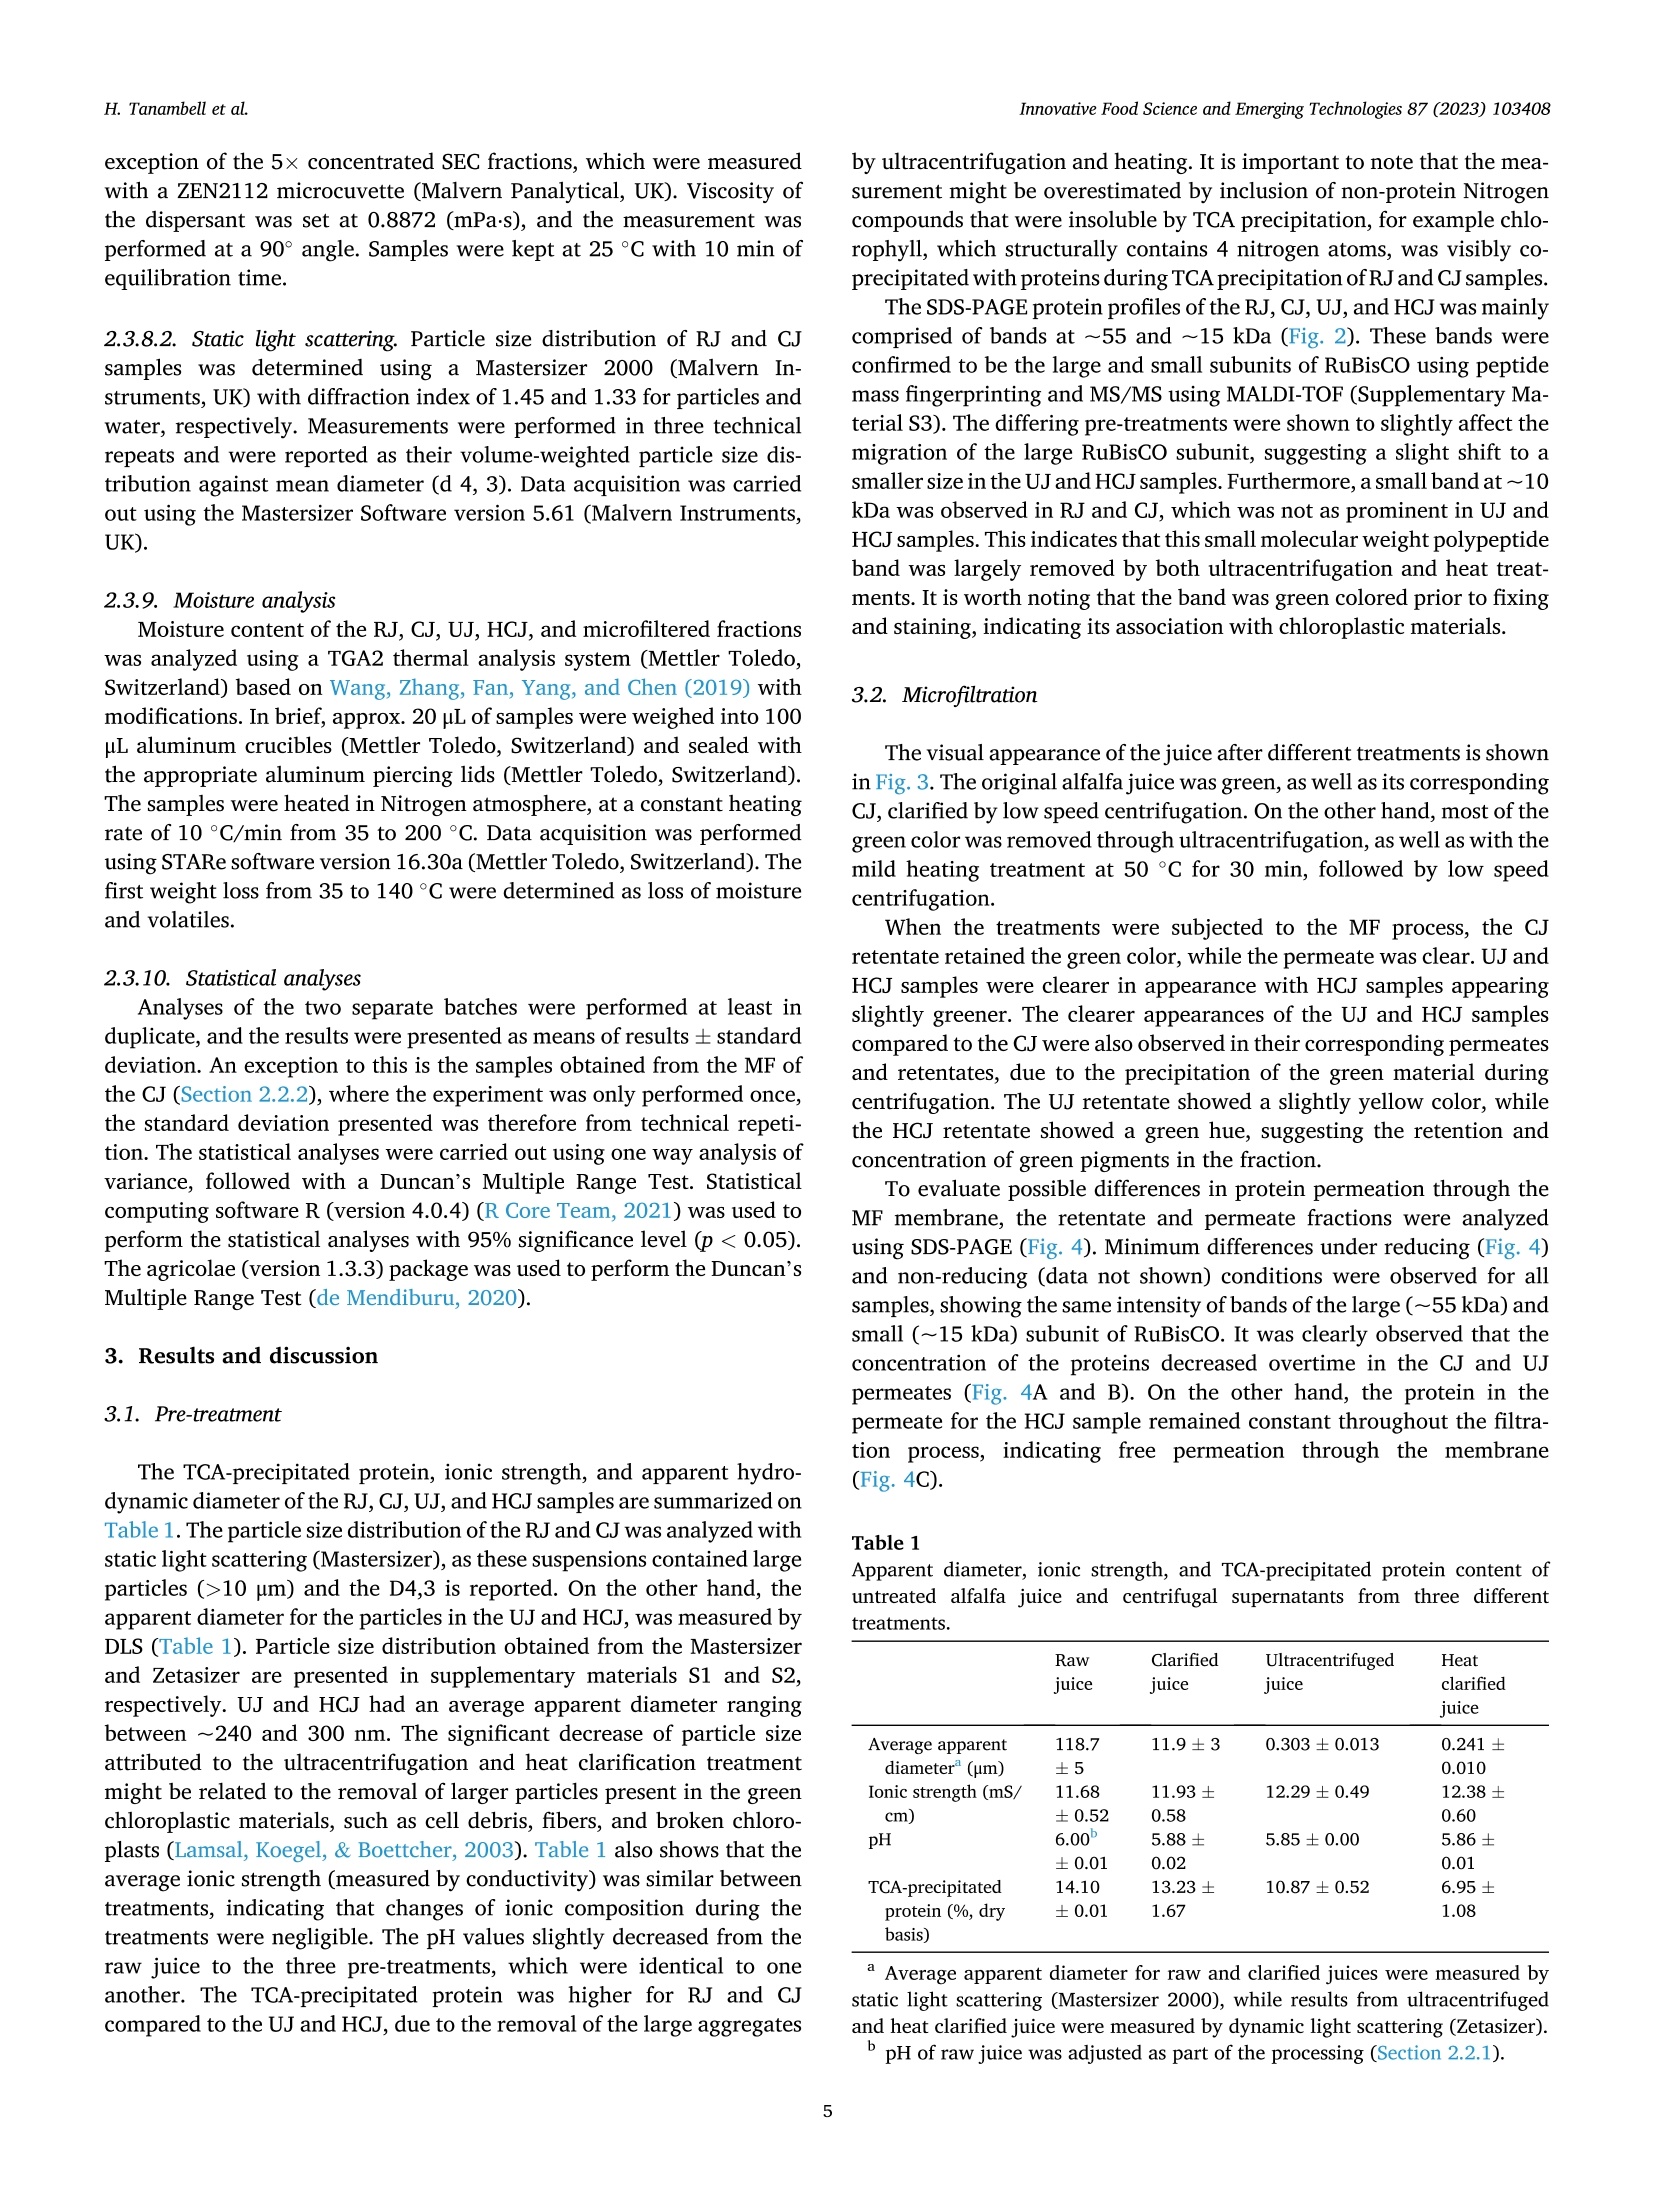
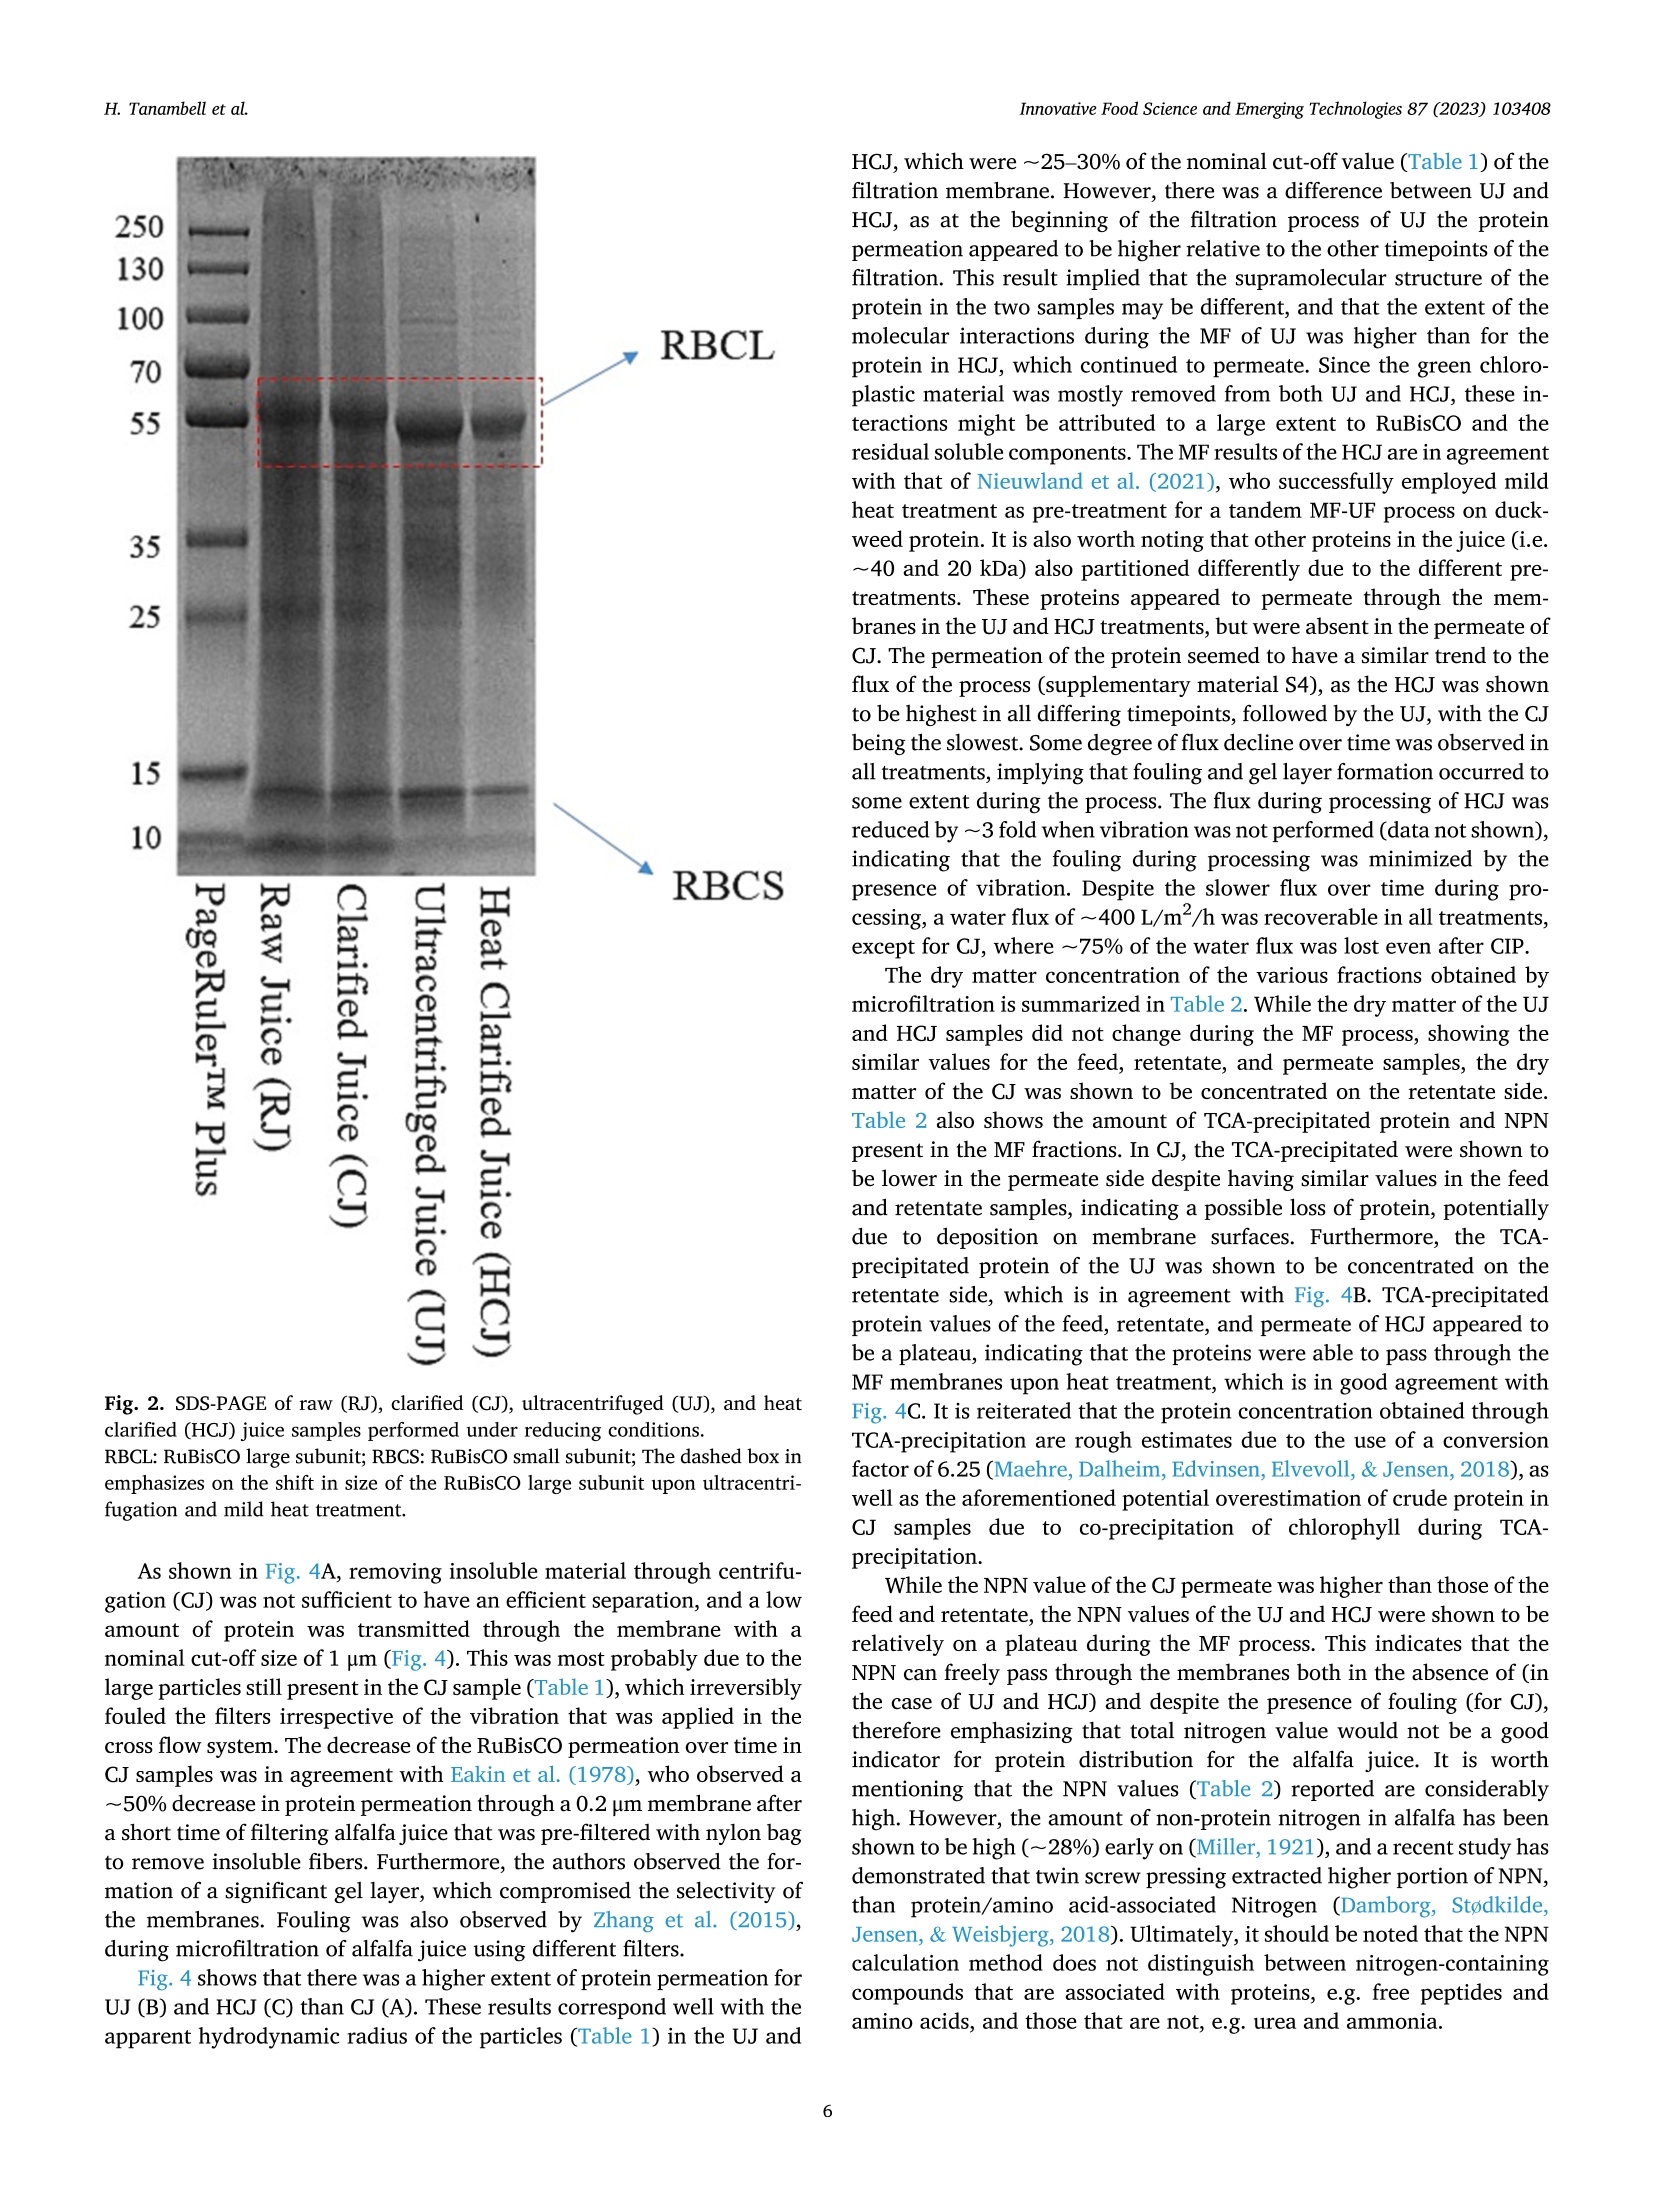
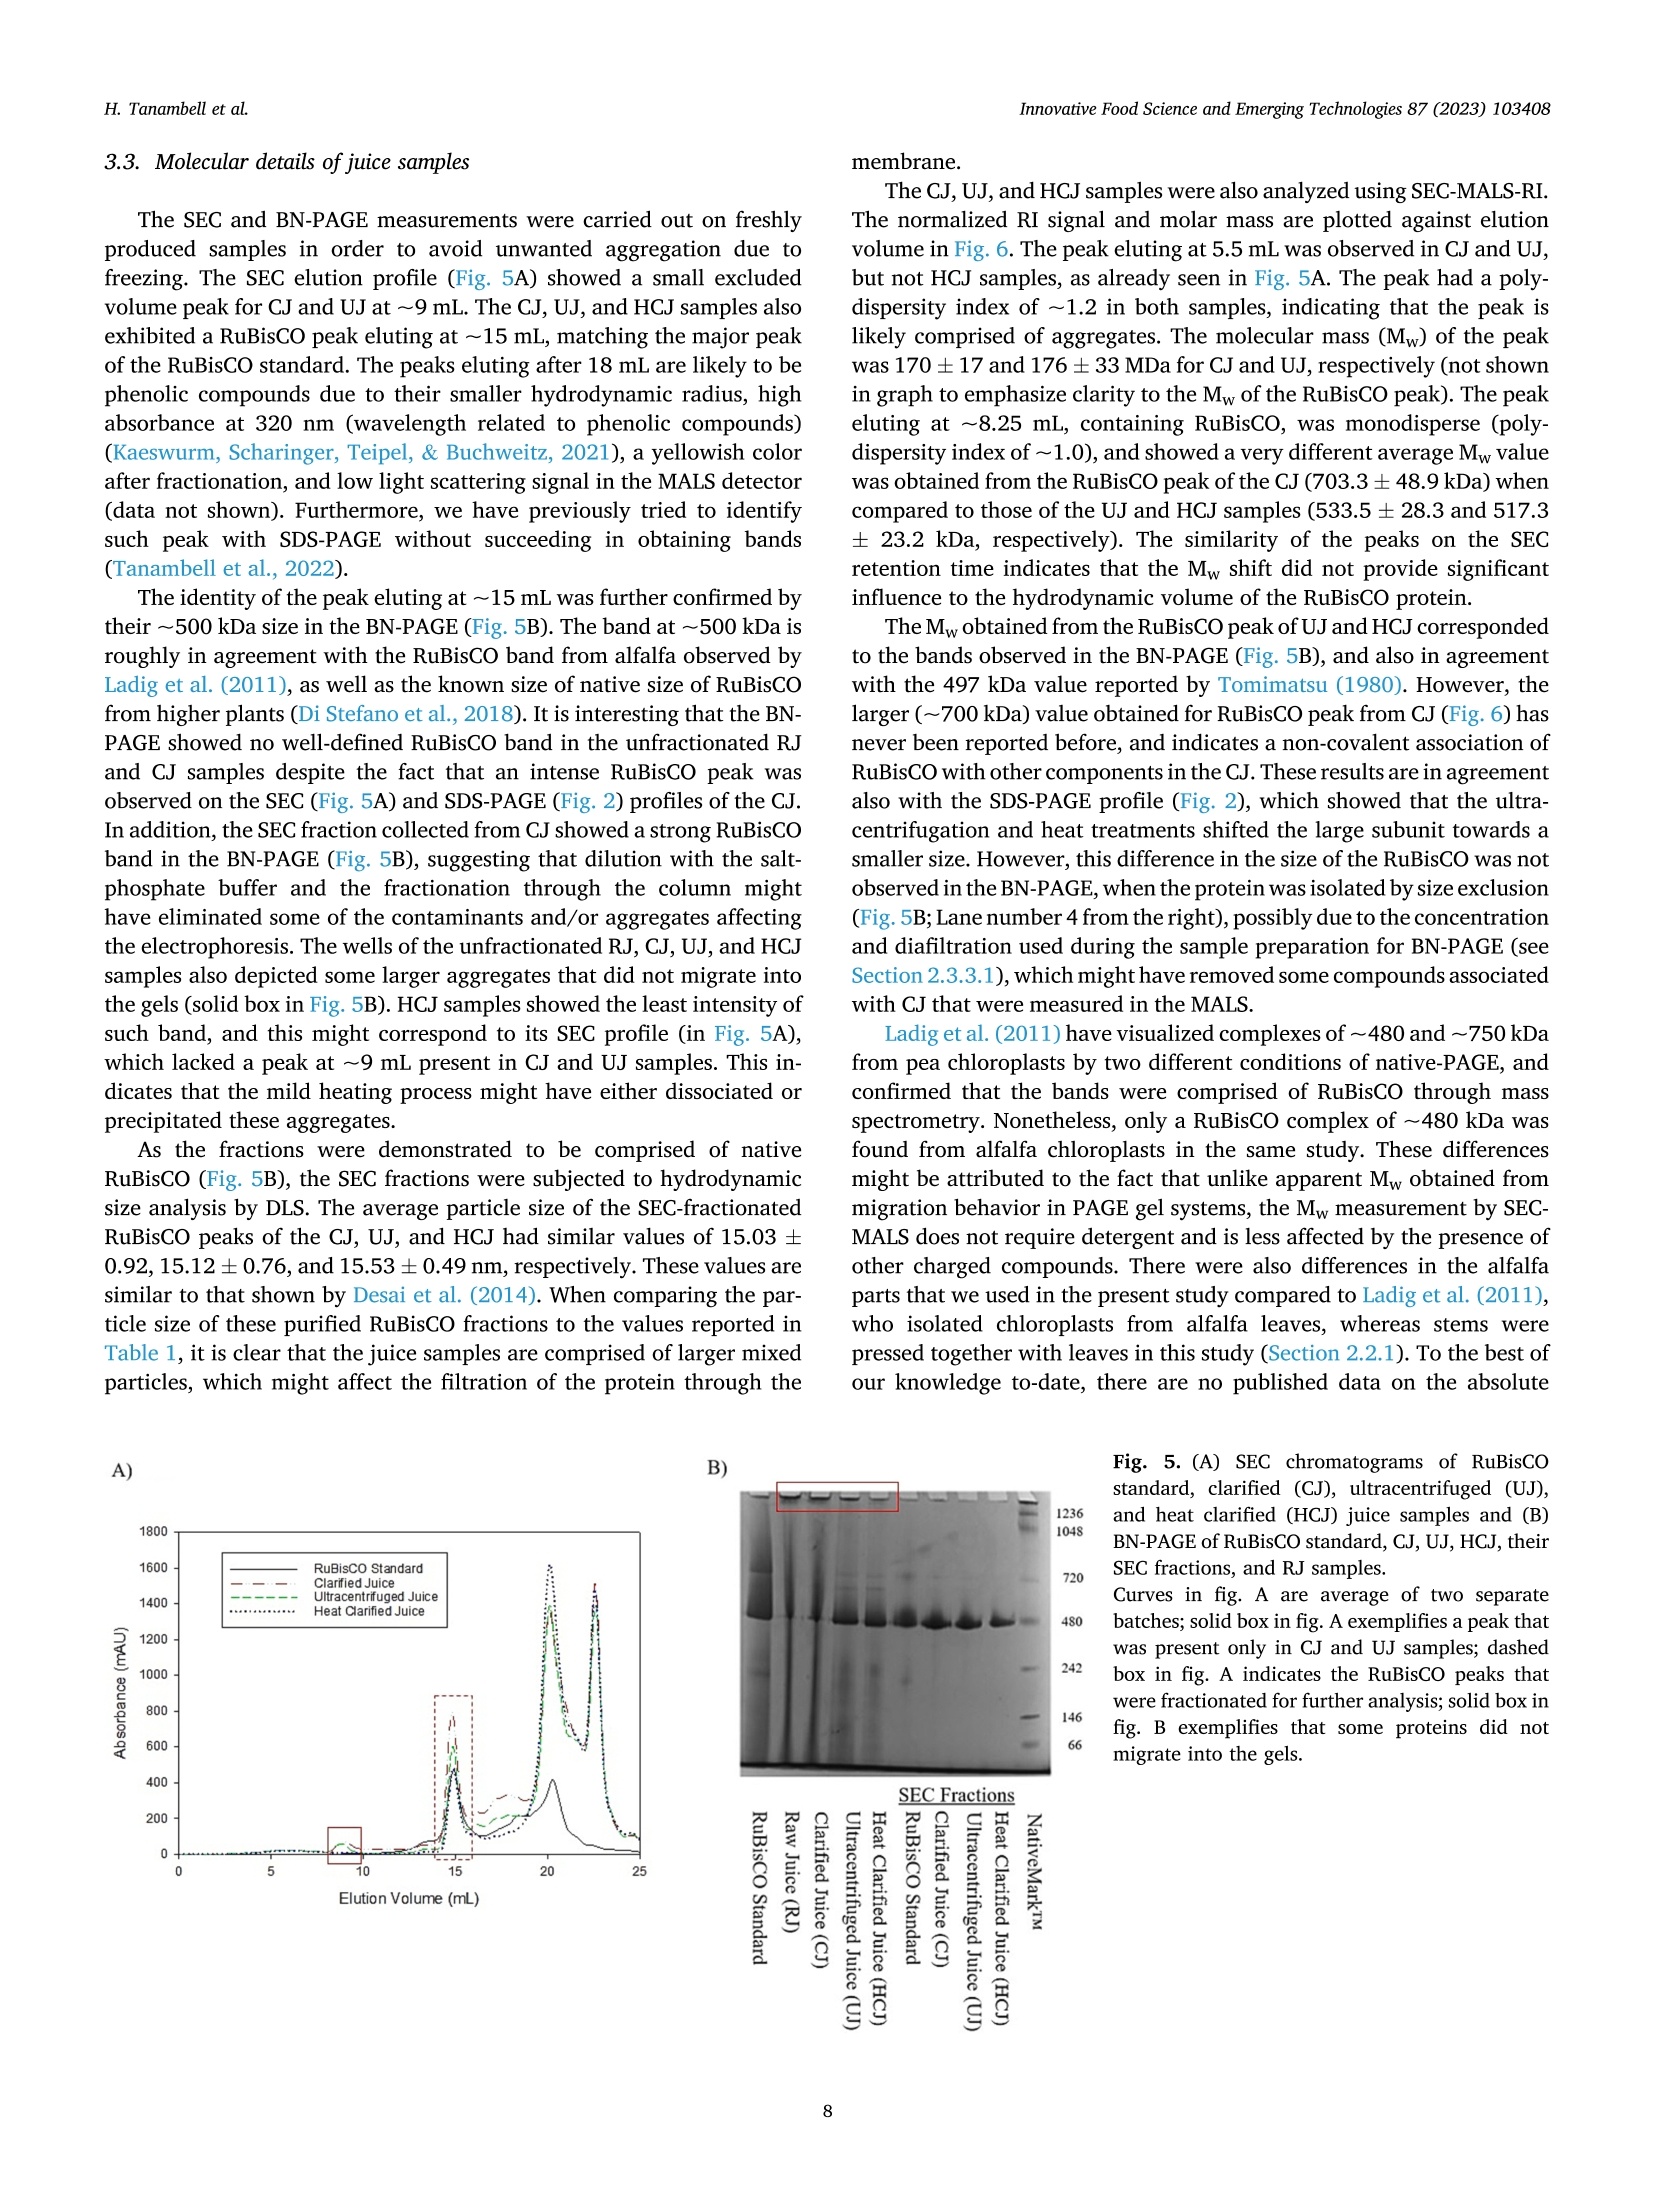
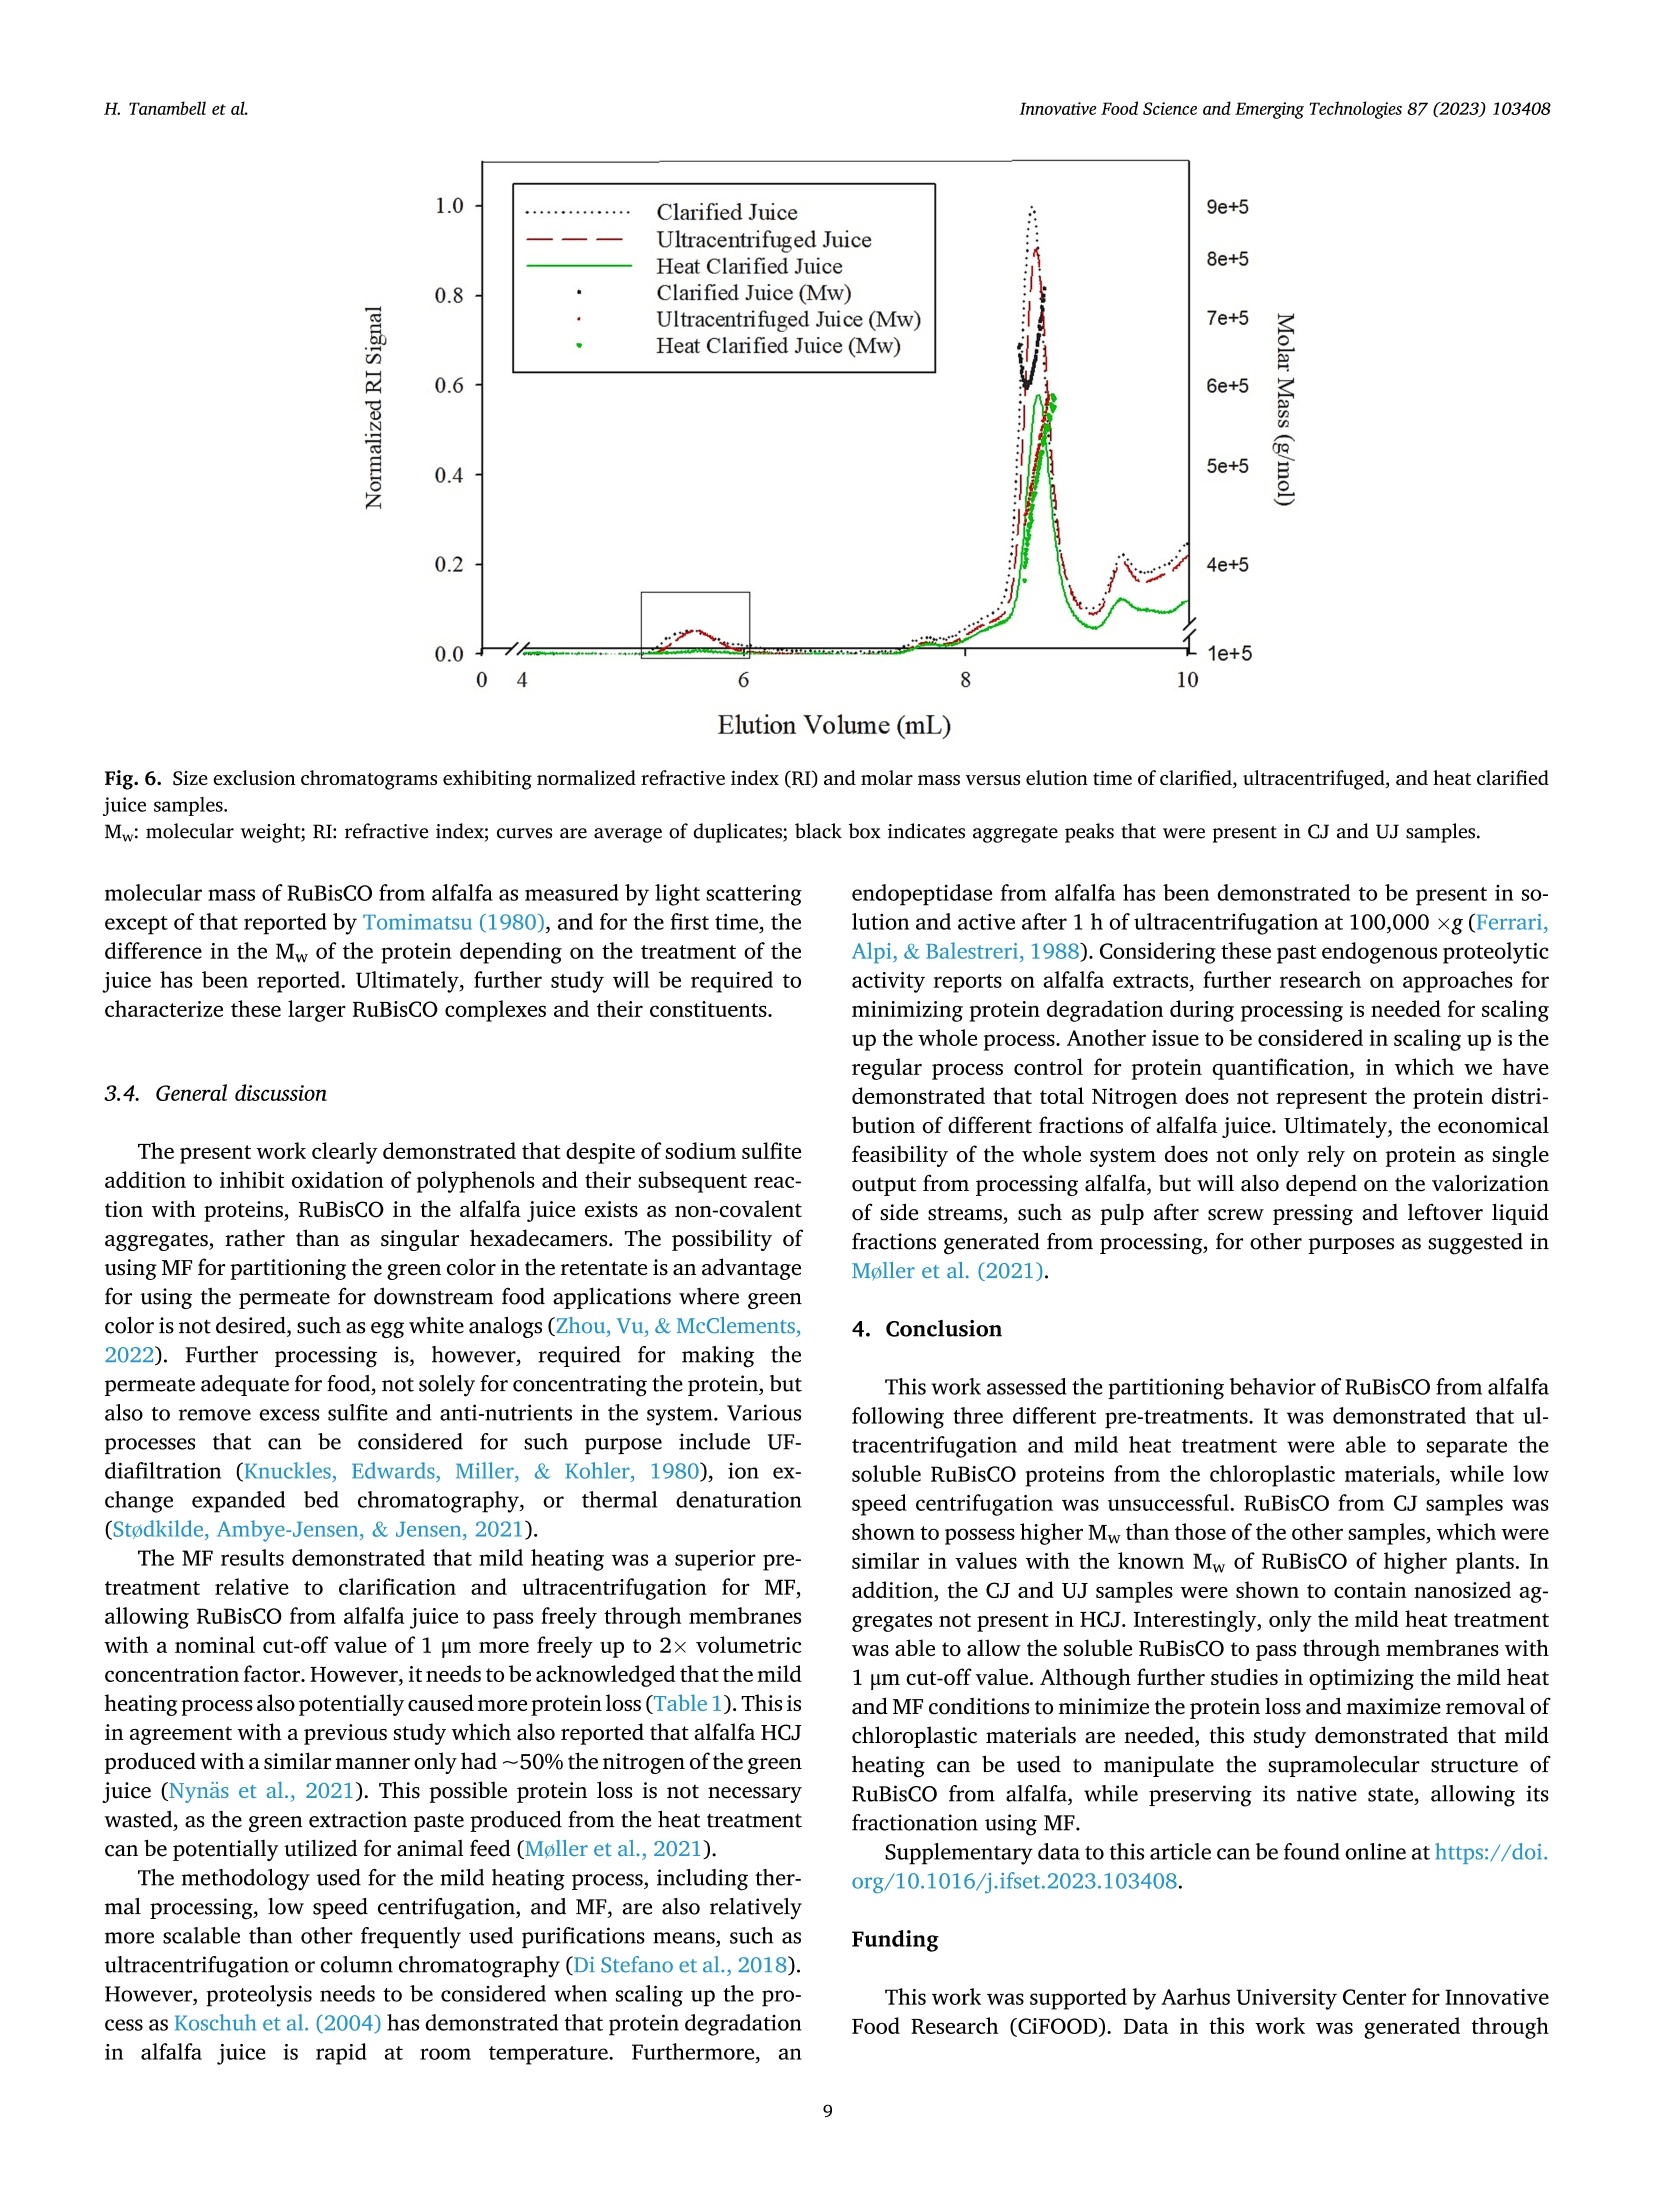
苜蓿RuBisCO(核酮糖-1,5-二磷酸羧化酶加氧酶)去除叶绿体材料时的超分子结构修饰Supramolecular structure modification of RuBisCO from alfalfa during removal of chloroplastic materialsInnovative Food Science and Emerging Technologies 87 (2023) 103408 Contents lists available at ScienceDirect Innovative Food Science and Emerging Technologies journal homepage: www.elsevier.com/locate/ifset 苜蓿RuBisCO(核酮糖-1,5-二磷酸羧化酶/加氧酶)去除叶绿体材料时的超分子结构修饰 Supramolecular structure modifciation of RuBisCO from alfalfa during removal of chloroplastic materials Hartono Tanambell a ,b , Anders Hauer M ø ller a ,b ,c , Laura Roman a ,b , Milena Corredig a ,b , Trine Kastrup Dalsgaard a ,b ,c ,* a Department of Food Science, Faculty of Technical Sciences, Aarhus University, Agro Food Park 48, 8200 Aarhus N, Denmark. b CiFOOD Aarhus University Centre for Innovative Food Research, Aarhus University, Agro Food Park 48, 8200 Aarhus N, Denmark. c CBIO Aarhus University Centre for Circular Bioeconomy, Aarhus University, Blichers All e e 20, 8830 Tjele, Denmark. 丹麦奥尔胡斯大学技术科学学院食品科学系 丹麦奥尔胡斯大学创新食品研究中心 丹麦奥胡斯大学循环生物经济中心 A R T I C L E I N F O Keywords: Alfalfa Alternative protein RuBisCO Protein fractionation Mild heat treatment Microflitration A B S T R A C T The use of alfalfa as a dietary protein source is of great interest. Membrane flitration shows potential for removal of unwanted compounds in the purifciation of ribulose-1,5-biphosphate carboxylase/oxygenase (RuBisCO), but fouling remains a challenge. It was hypothesized that treatments, namely centrifugation, ultracentrifugation, and heat clearing, prior to membrane processing modify the supramolecular assembly of the proteins, facilitating its flitration. The pre-treatments led to different aggregate structures. In particular, heating at 50 °C decreased the aggregate sizes by ~500 folds relative to the raw juice, as measured by light scattering. The molar mass of RuBisCO decreased by ~180 kDa after treatment with heat. Similarly, supernatants after ultracentrifugation also showed smaller structures. Unlike the other treatments, heating led to an effciient transmission of RuBisCO during microflitration. These results demonstrate for the frist time, the importance of controlling the supra-molecular structure of RuBisCO when processing proteins from alfalfa juice. Industrial relevance: The demand for more sustainable protein sources is continuously growing. RuBisCO is of particular interest because of its favorable amino acid composition. However, improved purifciation strategies are needed to extract it from green biomass. The results of this study serve as a proof-of-concept for the appli-cation of an industrially relevant process, mild heat treatment in combination with microflitration, for the pu-rifciation of RuBisCO from alfalfa green biomass. 1. Introduction The continual increase of world population has raised protein de-mand, and has challenged the sustainability of the existing food and protein production system. There is, therefore, an increasing need to investigate protein sources with less climate impact (Godfray et al.,2010; Henchion, Hayes, Mullen, Fenelon, & Tiwari, 2017). A potential source of such protein is the green biomass alfalfa (Medicago sativa L.), which is a perennial legume that can yield up to 1000–3000 kg crude protein per hectare (Solati et al., 2018). The alfalfa crop also possesses a low environmental impact for protein production as quantifeid using life cycle assessment, showing less global warming potential, ozone layer depletion, energy demand, eutrophication potential, acidifciation po-tential, and land use than other alternative plant protein sources, such as ryegrass and sugar beet leaves (Skunca, Romdhana, & Brouwers, 2021). Furthermore, alfalfa has been determined safe for food applications by the European Food Safety Authority (EFSA), however, at this point, in a limited amount of 10 g/day when consumed as a concentrate (Bresson et al., 2009). * Corresponding author at: Department of Food Science, Faculty of Technical Sciences, Aarhus University, Agro Food Park 48, 8200 Aarhus N, Denmark E-mail addresses: h.tanambell@food.au.dk (H. Tanambell), anders.hauer.moeller@food.au.dk (A.H. M ø ller), lroman@food.au.dk (L. Roman), mc@food.au.dk (M. Corredig), trine.dalsgaard@food.au.dk (T.K. Dalsgaard). https://doi.org/10.1016/j.ifset.2023.103408 Abbreviations RJ Raw Juice CJ Clarifeid Juice UJ Ultracentrifuged Juice HCJ Heat Clarifeid Juice scalability, energy effciiency, and absence of harsh chemicals (Di Ste-fano et al., 2018; Zhang, Grimi, Jaffrin, Ding, & Tang, 2017). Some examples of the described use of membrane technology in the literature include separating soluble proteins from chlorophyll in algae (Saf iet al.,2017) and purifying sugar beet leaf protein in a demo plant associated with Cosun (Skunca et al., 2021). Furthermore, membrane processes are already extensively used in the dairy industry (Reig, Vecino, & Cortina,2021), meaning that less investment is needed if the same technology can be applied for alfalfa. The use of UF and MF is, however, challenging due to the need to control concentration polarization on membrane surface which causes the formation of a gel layer that can impair the viability of the flitration process by compromising the selectivity of the membrane pores, fulxes and form irreversible fouling. These problems have been highlighted in the past, in a study of microflitration of green juice from alfalfa with 0.2u m membranes (Eakin, Singh, Kohler, & Knuckles, 1978). There is also limited information regarding supramolecular organi-zation of the RuBisCO in solution and their changes during membrane flitration (MF/UF), leading to the limited understanding of the appro-priate membrane pore sizes for fractionating it from undesirable com-ponents of the matrix. The major soluble protein of alfalfa is ribulose-1,5-biphosphate carboxylase/oxygenase (RuBisCO) (Hojilla-Evangel-ista, Selling, Hatfeild, & Digman, 2017), which is known to exist in nature as a ~550 kDa hexadecamer of eight large (~55 kDa) and eight small subunits (~15 kDa) (Di Stefano et al., 2018). Furthermore, the average size distribution of RuBisCO, as determined by dynamic light scattering (DLS), was shown to be approximately 15 nm (Desai, Streef-land, Wijffels, & Eppink, 2014). Therefore, it is possible to hypothesize that the majority of alfalfa proteins would permeate though 0.2 u m membrane pores, if RuBisCO exists as singular hexadecamers. However, Zhang et al. (2015) compared MF (nominal size: 0.2 u m) and UF (nominal molecular weight cut-off: 20 kDa) using three different flitra-tion modules set-up, and concluded that due to the fulx behavior and the severity of irreversible fouling, MF is preferred to UF for concentrating proteins in alfalfa juice. The concentration, as opposed to permeation, at nominal pore size of 0.2 u m indicates that either fouling has compro-mised the membranes or RuBisCO does not exist as singular hex-adecamers in alfalfa juice, and might be instead present in larger supramolecular assemblies. Since membrane pore size governs the separation effciiency of the flitration process, it is therefore paramount to comprehend the supramolecular structure of the proteins in alfalfa juice and its potential changes during changes in the processing pa-rameters in conditions with minimum fouling. clarifciation is deemed as one of the most effciient and scalable chlo-rophyll removal methods that has been used in a protein purifciation p p r r o o c c e e s s s s e e s s f f r r o o m m a a l l f f a a l l f f a a ((N N y y n n a a s s ,, N N e e w w s s o o n n ,, && J J o o h h a a n n s s s s o o n n ,, 22002211)).. T T h h e e investigation was carried out on alfalfa juice that were treated with sodium sulftie as the interaction between proteins and oxidized poly-phenols has also been shown to affect protein structure (Kroll, Rawel, &Rohn, 2003). In particular, larger bands attributed to polyphenol and protein interactions have been observed in alfalfa protein concentrate purifeid with acid precipitation, and were shown to be reduced with the addition of sodium sulftie (Tanambell, M ø ller, Corredig, & Dalsgaard,2022). To better test the membrane selectivity, the flitration was performed using a laboratory-scale, cross-folw flitration system, under vibrating conditions, so that the gel layer formation can be kept to a minimum, allowing the membrane pore size to govern the separation process with minimum interference. It was hypothesized that the pre-treatments (clarifciation, ultracentrifugation, or mild heating) would affect the size distribution of the protein aggregates, and therefore a better control of the upstream process would improve the fractionation of RuBisCO during downstream membrane flitration. This research will serve as a probe for future applications for purifciation of RuBisCO using MF as a fractionation method. 2. Materials and methods 2.1. Chemicals and materials C C h h e e m m i i c c a a l l s s u u s s e e d d i i n n t t h h i i s s s s t t u u d d y y w w e e r r e e o o f f a a n n a a l l y y t t i i c c a a l l g g r r a a d d e e u u n n l l e e s s s s mentioned. Sodium sulftie, hydrochloric acid (HCl) 37%, sodium hy-droxide, D-ribulose 1,5-biphosphate carboxylase/oxygenase from spinach, bovine serum albumin (BSA), sodium dodecyl sulfate (SDS), Trizma ® base, Trizma ® HCl, sodium chloride, glycerol, bromophenol blue, PageRuler ™ Plus Prestained Protein Ladder, phosphoric acid 85%, trichloroacetic acid (TCA), sodium azide, NaH2PO4, Na2HPO4, ammo-nium bicarbonate, iodoacetamide,a -cyano-4-hydroxycinnamicacid, POROS ™50 R2 Perfusion Chromatography ™ bulk media, formic acid, acetonitrile, and 1,4-dithioerythritol (DTE) were obtained from Merck (Darmstadt, Germany). Coomassie Brilliant Blue (CBB) G-250 and 18-wells Criterion TGX pre-cast gel (12%) were purchased from Serva (Heidelberg, Germany) and Bio-Rad Laboratories Inc. (Hercules, Cali-fornia, USA), respectively. NativePage ™ 4–16% Bis-Tris Mini Protein Gel, NativePage ™ Sample Prep Kit, and NativeMark ™ Unstained Pro-tein Standard were acquired from Thermo Fisher Scientifci (Roskilde, Denmark). Ethylenediaminetetraacetic acid (EDTA) and 96% ethanol were purchased from Gerhardt Analytical Systems (Ko o nigswinter, Ger-many) and VWR International (S ø borg, Denmark), respectively. Phe-nex ™-Glass Fiber 28 mm syringe fliters (1.2 u m) were purchased from Phenomenex ® (Torrance, California, USA). Sequencing Grade Modifeid Trypsin were obtained from Promega (Madison, Wisconsin, USA). MF modules with polypropylene housing (membrane area: 35 cm2) were purchased from SaniMembranes (Farum, Denmark). The modules were installed with hydrophilized polytetrafuloroethylene (PTFE) membranes with a nominal pore size of 1 p m (SANI; SaniMembranes, Farum, Denmark). Demineralized water (18.2 M Q ) was prepared in-house using the Milli-Q purifciation system from Millipore Corpora-tion (Burlington, Massachusetts, USA). 2.1.1. Plant materials The alfalfa plant materials were harvested using a MaksiGrass ®(MaksiGrass, Denmark) from a feild at Aarhus University Research Center, Foulum, Denmark, on 15 September 2021. Approximately 100kg of the harvested biomass were immediately transported to the Department of Food Science, Aarhus, Denmark, and stored at - 20 °C until further processing. 2.2. Sample preparation 2.2.1. Preparation of microflitration feed materials The alfalfa juice was prepared as previously described (Tanambell et al., 2022) with minor modifciations. In brief, 330 g of frozen alfalfa stems and leaves was thawed at room temperature for about 30 min. The biomass was then soaked in 110 mL of 75 mM sodium sulftie. Both the biomass and the treatment solution were then pressed using a twin-screw press Angel ® Juicer 8500S juicer (Angel ® Juicer, South Korea), resulting in fnial sulftie concentration of approximately 25 mM. The pH of the juice was adjusted to 6.00 ± 0.01 using 6 M HCl, which is the average native pH of alfalfa juice (Ajibola, 1984). The juice was then subjected to three individual treatments (Fig. 1):clarifciation by low speed centrifugation, ultracentrifugation, and in-cubation at about 50 °C for 30 min (mild heat treatment). Clarifciation was conducted by removing the insoluble material through a 15 min centrifugation at 1700 x g and room temperature using a Multifuge 3SR (Fischer Scientifci ™, Germany). For the ultracentrifugation treatment, removal of insoluble material was carried out frist, by using the clari-fciation treatment described above, followed by the removal of colloidal suspensions using an Optima L-80XP (Beckman Coulter Inc., California, USA) at 100,000 x g and room temperature for 1 h. The mild heat treatment was adopted and modifeid from Nyn ,as et al. (2021). In brief, the juice was heated in a 500 mL Duran borosilicate glass bottle (Schott AG, Germany) for approximately 30 min, using a SW23 shaking water bath (Julabo, Germany) at 50 °C and 50 rpm, resulting in a fnial tem-perature of 45 C C. The juice was then cooled down for approximately 20min to room temperature using an ice bath, before being centrifuged at 1700 x g and room temperature for 15 min. The supernatants of each of the three treatments were then subjected to MF and analyses as described in the following sections. While the untreated juice is referred to as raw juice (RJ), the clarifeid, ultracentrifuged, and mild heated centrifugal supernatants are subsequently referred to as CJ, UJ, and HCJ, respectively. Fig. 1. Flow process of preparation of microflitration feed materials. 2.2.2. Microflitration A vibrating, cross-folw Vibro-Lab35P system (SaniMembranes, Denmark) installed with 1 u m hydrophylized PTFE membrane was used for the MF. The selection of hydrophilized PTFE was chosen per recommendation from the manufacturer, due to their modifciation, which renders the membrane more hydrophilic than polyvinylidene fuloride (PVDF). The MF process was performed at room temperature with a low transmembrane pressure of <0.05 bar. Vibration of the Vibro-Lab35P was driven by compressed air at a pressure of 6 bar. A volume of 100 mL centrifugal supernatant from the treatments described above was used as a feed material for the flitration process. The flitration process was carried out until approximately two volumetric concentra-tion factor was achieved on the retentate side. Flux measurements and permeate collection were carried out at the beginning, middle (approaching 1.5 volumetric concentration factor), and end of the flitration process. In addition, the fnial retentate and the pooled permeate at the end of the flitration were collected for analysis. Samples were frozen at -20 °C immediately after collection. After each experi-ment, the membranes were cleaned using a clean-in-place (CIP) pro-cedure provided by the manufacturer (SaniMembranes, Denmark). The extent of fouling was measured evaluating the change in fulx with water prior to use and after the CIP of each experiment. Two separate batches were performed for each experiment, with the exception of the CJ, which was only performed once due to the irreversible fouling that formed on the membrane. 2.3. Analyses 2.3.1. Determination of TCA-precipitated protein and non-protein nitrogen A DUMATHERM ® (Gerhardt Analytical Systems, Germany) was used for determining the total Nitrogen content of the RJ, CJ, UJ, HCJ sam-ples, and the microflitered fractions. Samples were combusted with1.4mL O2/mg sample with an oxygen folw rate of 300 mL/min. The peak obtained from the measurement were then converted to total Nitrogen using an external calibration curve prepared from Trizma ® base and EDTA. A TCA-precipitation method adapted from Koontz (2014) was car-ried out to precipitate Nitrogen associated with protein. In brief, samples were diluted at a 1:1 ratio with cold 24% TCA, resulting in a fnial concentration of 12% TCA. The acidifeid samples were allowed to cool on ice for at least 30 min, before being centrifuged at 15,000 ×g 4 C C for 15 min using a Benchtop Centrifuge 5417 R (Eppendorf, Germany). The pellet was resuspended with 6 M NaOH to 50% of the original volume, before being subjected to Nitrogen measurement with a DUMATHERM ®Nitrogen analyzer (Gerhardt Analytical Systems, Germany). The value obtained was recorded as TCA-precipitated Nitrogen, and the non-protein Nitrogen (NPN) was then calculated from the difference be-tween the total Nitrogen and TCA-precipitated Nitrogen using the following formula: NPN (%) = Total Nitrogen (%- )TCA precipitatedNitrogen (% TCA-precipitated protein content of the RJ, CJ, UJ, and HCJ was calculated using a previously described conversion factor of 6.25(Edwards et al., 1975), using the formula described below: TCA precipitated protein (%) = TCA 5precipitated Nitrogen (%) x 6.25 2.3.2. Conductivity and pH The conductivity and pH of the RJ, CJ, UJ, and HCJ samples were measured using sensION ™ + EC71 (Hach ®, USA) and PHM 220 pH Meter (Radiometer, Denmark), respectively. The sensION ™ + EC71 was calibrated biweekly using KCl-based conductivity standard solutions (Hach ®, USA). The pH meter was calibrated on a daily basis using IUPAC Certifeid Buffer Standard Solutions (Radiometer, Denmark). 2.3.3. Size exclusion chromatography (SEC) The soluble fractions of the centrifugal supernatants from CJ, UJ and HCJ were freshly analyzed by size exclusion chromatography (SEC) using a Superose 6 Increase 10/300 GL column (Cytiva Life Sciences, Massachusetts, USA) installed on an A A kta Purifeir Fast Protein Liquid Chromatography System (GE Healthcare, Sweden). A mobile phase of isocratic phosphate-buffered saline (10 mM phosphate buffer, 0.14 M NaCl, pH 7.4) was employed per recommendations from the column manufacturer. The centrifugal supernatants were diluted 2.5 using the mobile phase and passed through a 1.2 u m Phenex ™-Glass Fiber 28 mm syringe fliter before their manual injection with a syringe with a volume of 100 p L/run. The elution proflie was monitored by measuring absor-bance at a wavelength of 214 nm. RuBisCO standard from spinach at a concentration of 5 mg/mL was used as a reference for the RuBisCO peak. The untreated control (RJ) was excluded from SEC analyses because of the diffciulty to fliter the material prior to injection. 2.3.3.1. Peak fractionation and concentration. Based on the elution proflie of the RuBisCO standard, the peak attributed to RuBisCO was collected and subjected to further analysis, namely dynamic light scat-tering and Blue Native-PAGE (BN-PAGE). The fractions were diaflitered and concentrated ~5n (based on their initial volume) using Amicon Ultra-0.5 (nominal molecular weight cut-off: 30 kDa) centrifugal fliter units (Millipore, Massachusetts, USA) for DLS and SDS-PAGE analyses. For BN-PAGE analysis, the concentration process was repeated as described above (Amicon Ultra-0.5), reaching a ~25× volumetric con-centration factor. 2.3.4. Colloidal CBB-stained SDS-PAGE The SDS-PAGE and CBB-staining procedures were carried out based on Laemmli (1970) and Kang, Gho, Suh, and Kang (2002), respectively. This assay was carried out without standardization of the protein con-tent of the different samples. The original RJ, as well as the supernatants CJ, UJ and HCJ and aliquots from the MF fractionations were diluted 5×using MilliQ-water and subsequently mixed with one volume of SDS-PAGE sample buffer (pH 6.8). In the case of the SEC fractions, the samples were mixed directly, with no dilution, with the sample buffer at a ratio of 1:1. The RuBisCO standard was dissolved with MilliQ water:sample buffer (1:1) at a concentration of 1 mg/mL. DTE was added to the sample buffer at a concentration of 20 mM for analysis under reducing conditions. The samples were heated using a Thermomixer C (Eppen-dorf, Germany) at 90 °C for approximately 2 min, and a volume of 20 u L was subsequently loaded into a 12% Criterion TGX precast gel. Two lanes of 6 p L PageRuler ™ Plus Prestained Protein Ladder were also loaded into the gel. The electrophoresis was carried out using a Power Pac 200 Electrophoresis Power Supply (Bio-Rad Laboratories, Califor-nia, USA) at a constant voltage of 200 V for approximately 45 min. The gels were then fxied for at least 3 h with in a solution of 50% ethanol and 8% phosphoric acid, and stained with colloidal CBB. Imaging was per-formed using a ChemiDoc ™ MP Imaging System (Bio-Rad Laboratories, California, USA). 2.3.5. Protein identifciation by Matrix-Assisted Laser Desorption Ionization-Time of Flight (MALDI-TOF) Protein identifciation was performed as previously described (Jen-sen, Larsen, & Roepstorff, 1998). In brief, bands of interest were care-fully excised from SDS-PAGE gels, and subjected to destaining with 50% a a c c e e t t o o n n i i t t r r i i l l e e a a n n d d i i n n --g g e e l l d d i i g g e e s s t t i i o o n n u u s s i i n n g g S S e e q q u u e e n n c c i i n n g g G G r r a a d d e e M M o o d d i i f f ie ei d d Trypsin (Promega). The digests were subsequently desalted and concentrated using Poros ™ 50 R2 gel-loading tip columns. Thereafter, the samples were eluted onto a MALDI target plate using a -cyano-4-hydroxycinnamic acid as matrix. Peptide mass fnigerprinting was then performed using an Autofelx Speed (Bruker, Massachusetts, USA). The most abundant ions were then subjected to further fragmentation with tandem mass spectrometry (MS/MS). Database search for both peptide mass fnigerprinting and MS/MS were carried out using an in-house Mascot server previously described by Wedholm et al. (2008). 2.3.6. Blue Native-PAGE A BN-PAGE analysis was performed on the fractions collected by SEC (Section 2.3.3.1), RuBisCO standard, as well as the original RJ, CJ, UJ, and HCJ samples, without standardizing the protein content. The pro-cedure was slightly adapted from the user guide of the NativePage ™Sample Prep Kit (Invitrogen ™). While the centrifugal supernatants and untreated alfalfa juice were diluted 3× in MilliQ water prior to analysis, the 25x concentrated SEC fractions were not diluted. Aliquots (13 u L) were then added with 5 p L of 4x NativePage ™ sample buffer (pH 7.2) and 1 u L of MilliQ-water. The RuBisCO standard were dissolved at a concentration of 3.4 mg/mL in a solution of 4x NativePage ™ sample buffer:MilliQ-water (5:14), and 19 p L of this solution was aliquoted for analysis. The samples were added with 1 p L of NativePage ™ 5% G-250sample additive shortly before being loaded into a NativePage ™ 4–16%Bis-Tris Mini Protein Gel. A lane of 6 p L NativeMark ™ unstained protein standards was also loaded into the gel. Pre-chilled cathode and anode buffers were prepared as described in the kit protocol (Invitrogen ™). The gel was then run in XCell ™ SureLock ™ Mini-Cell Electrophoresis system (Invitrogen ™, California, USA) at a constant voltage of 150 V for 113 min supplied through a Power Pac 300 Electrophoresis Power Supply (Bio-Rad Laboratories, California, USA). To prevent protein denaturation due to the heat generated by the electrophoresis, the tank was placed in an ice bucket. The gel was stained using Colloidal CBB, as described in the previous section. 2.3.7. Molecular mass determination The molecular mass (Mw) of proteins present in the CJ, UJ, and HCJ was measured by size exclusion chromatography using a Yarra SEC-4000 column combined with a GFC-4000 (4 × 3.0 mm internal diam-eter) SecurityGuard Cartridge (Phenomenex ®, California, USA) installed on an 1260 Infniity II high-pressure liquid chromatography ((H H P P L L C C )) s s y y s s t t e e m m ((A A g g i i l l e e n n t t ,, C C a a l l i i f f o o r r n n i i a a ,, U U S S A A )) c c o o u u p p l l e e d d t t o o a a n n 1188--a a n n g g l l e e DAWN ® multi-angle light scattering (MALS) detector (Wyatt Technol-ogy, California, USA). The setup also included a Shodex RI-501 refrac-tive index (RI) detector (Showa Denko K. K., Japan) and an 1260 Infniity II diode array detector (Agilent, California, USA). Samples were eluted with a 50 mM phosphate buffer with 150 mM NaCl and 0.02% sodium azide (pH 7.2) as recommended by Wyatt, at a folw rate of 0.5 mL/min and 25 °C. Prior to 30 u L injection by an autosampler at room temper-ature, samples were diluted 2.5× with the mobile phase and flitered with a 1.2 u m Phenex ™-Glass Fiber 28 mm syringe fliter. The elution proflie was monitored based on the difference in the refractive index between the samples and the elution buffer, and the specifci refractive index increment (dn/dc) was set to the 0.1850 mL/g. BSA was used for the normalization and alignment of the detector. Polydispersity of the peaks was estimated by the ratio between the weight average and the number average molecular weight (Mw/Mn). The Mw was calculated using Zimm model with 2nd degree polynomial. Data acquisition and analysis were performed using the ASTRA software version 8.0.0.28(Wyatt Technology, California, USA). 2.3.8. Particle size analysis 2.3.8.1. Dynamic light scattering. The values of apparent diameter of the particles present in fractions collected from SEC (Section 2.3.3), as well as UJ and HCJ samples were determined by DLS, using a Zetasizer (Malvern Panalytical, UK). Two different dilutions with 10 mM NaCl were prepared to ensure that the results obtained were not affected by concentration: 50x and 100× dilution for heated juice samples, 100×and 200× dilution for ultracentrifuged juice samples, and no dilution and 5 volume reduction for the SEC fractions. The measurements were performed with a PCS8501 cuvette (Malvern Panalytical, UK) with the exception of the 5x concentrated SEC fractions, which were measured with a ZEN2112 microcuvette (Malvern Panalytical, UK). Viscosity of the dispersant was set at 0.8872 (mPa s s), and the measurement was performed at a 90° angle. Samples were kept at 25 °C with 10 min of equilibration time. 2.3.8.2. Static light scattering. Particle size distribution of RJ and CJ s s a a m m p p l l e e s s w w a a s s d d e e t t e e r r m m i i n n e e d d u u s s i i n n g g a a M M a a s s t t e e r r s s i i z z e e r r 22000000 ((M M a a l l v v e e r r n n I I n n --struments, UK) with diffraction index of 1.45 and 1.33 for particles and water, respectively. Measurements were performed in three technical repeats and were reported as their volume-weighted particle size dis-tribution against mean diameter (d 4, 3). Data acquisition was carried out using the Mastersizer Software version 5.61 (Malvern Instruments, UK). 2.3.9. Moisture analysis Moisture content of the RJ, CJ, UJ, HCJ, and microflitered fractions was analyzed using a TGA2 thermal analysis system (Mettler Toledo, Switzerland) based on Wang, Zhang, Fan, Yang, and Chen (2019) with modifciations. In brief, approx. 20 p L of samples were weighed into 100u L aluminum crucibles (Mettler Toledo, Switzerland) and sealed with the appropriate aluminum piercing lids (Mettler Toledo, Switzerland). The samples were heated in Nitrogen atmosphere, at a constant heating rate of 10 °C/min from 35 to 200 °C. Data acquisition was performed using STARe software version 16.30a (Mettler Toledo, Switzerland). The frist weight loss from 35 to 140 °C were determined as loss of moisture and volatiles. 2.3.10. Statistical analyses Analyses of the two separate batches were performed at least in duplicate, and the results were presented as means of results ± standard deviation. An exception to this is the samples obtained from the MF of the CJ (Section 2.2.2), where the experiment was only performed once, the standard deviation presented was therefore from technical repeti-tion. The statistical analyses were carried out using one way analysis of variance, followed with a Duncan ’s Multiple Range Test. Statistical computing software R (version 4.0.4) (R Core Team, 2021) was used to perform the statistical analyses with 95% signifciance level (p < 0.05). The agricolae (version 1.3.3) package was used to perform the Duncan ’s Multiple Range Test (de Mendiburu, 2020). 3. Results and discussion 3.1. Pre-treatment The TCA-precipitated protein, ionic strength, and apparent hydro-dynamic diameter of the RJ, CJ, UJ, and HCJ samples are summarized on Table 1. The particle size distribution of the RJ and CJ was analyzed with static light scattering (Mastersizer), as these suspensions contained large particles (>10 u m) and the D4,3 is reported. On the other hand, the apparent diameter for the particles in the UJ and HCJ, was measured by DLS (Table 1). Particle size distribution obtained from the Mastersizer and Zetasizer are presented in supplementary materials S1 and S2, respectively. UJ and HCJ had an average apparent diameter ranging between ~240 and 300 nm. The signifciant decrease of particle size attributed to the ultracentrifugation and heat clarifciation treatment might be related to the removal of larger particles present in the green chloroplastic materials, such as cell debris, fbiers, and broken chloro-plasts (Lamsal, Koegel, & Boettcher, 2003). Table 1 also shows that the average ionic strength (measured by conductivity) was similar between treatments, indicating that changes of ionic composition during the treatments were negligible. The pH values slightly decreased from the raw juice to the three pre-treatments, which were identical to one another. The TCA-precipitated protein was higher for RJ and CJ compared to the UJ and HCJ, due to the removal of the large aggregates by ultracentrifugation and heating. It is important to note that the mea-surement might be overestimated by inclusion of non-protein Nitrogen compounds that were insoluble by TCA precipitation, for example chlo-rophyll, which structurally contains 4 nitrogen atoms, was visibly co-precipitated with proteins during TCA precipitation of RJ and CJ samples. The SDS-PAGE protein proflies of the RJ, CJ, UJ, and HCJ was mainly comprised of bands at ~55 and ~15 kDa (Fig. 2). These bands were confrimed to be the large and small subunits of RuBisCO using peptide mass fnigerprinting and MS/MS using MALDI-TOF (Supplementary Ma-terial S3). The differing pre-treatments were shown to slightly affect the migration of the large RuBisCO subunit, suggesting a slight shift to a smaller size in the UJ and HCJ samples. Furthermore, a small band at ~10kDa was observed in RJ and CJ, which was not as prominent in UJ and HCJ samples. This indicates that this small molecular weight polypeptide band was largely removed by both ultracentrifugation and heat treat-ments. It is worth noting that the band was green colored prior to fxiing and staining, indicating its association with chloroplastic materials. 3.2. Microflitration The visual appearance of the juice after different treatments is shown in Fig. 3. The original alfalfa juice was green, as well as its corresponding CJ, clarifeid by low speed centrifugation. On the other hand, most of the green color was removed through ultracentrifugation, as well as with the mild heating treatment at 50 C for 30 min, followed by low speed centrifugation. When the treatments were subjected to the MF process, the CJ retentate retained the green color, while the permeate was clear. UJ and HCJ samples were clearer in appearance with HCJ samples appearing slightly greener. The clearer appearances of the UJ and HCJ samples compared to the CJ were also observed in their corresponding permeates and retentates, due to the precipitation of the green material during centrifugation. The UJ retentate showed a slightly yellow color, while the HCJ retentate showed a green hue, suggesting the retention and concentration of green pigments in the fraction. To evaluate possible differences in protein permeation through the MF membrane, the retentate and permeate fractions were analyzed using SDS-PAGE (Fig. 4). Minimum differences under reducing (Fig. 4) and non-reducing (data not shown) conditions were observed for all samples, showing the same intensity of bands of the large (~55 kDa) and small (~15 kDa) subunit of RuBisCO. It was clearly observed that the concentration of the proteins decreased overtime in the CJ and UJ permeates (Fig. 4A and B). On the other hand, the protein in the permeate for the HCJ sample remained constant throughout the flitra-tion process, indicating free permeation through the membrane (Fig. 4C). Table 1 Apparent diameter, ionic strength, and TCA-precipitated protein content of u u n n t t r r e e a a t t e e d d a a l l f f a a l l f f a a j j u u i i c c e e a a n n d d c c e e n n t t r r i i f f u u g g a a l l s s u u p p e e r r n n a a t t a a n n t t s s f f r r o o m m t t h h r r e e e e d d i i f f f f e e r r e e n n t t treatments. Raw juice Clarifeid juice Ultracentrifuged juice Heat clarifeid juice Average apparent 118.7 11.9 ± 3 0.303 ± 0.013 0.241 土 diametera (em) ±5 0.010 Ionic strength (mS/ cm) 11.68 11.93 土 12.29 ± 0.49 12.38 土 ± 0.52 0.58 0.60 pH 6.00b 5.88 ± 5.85 ± 0.00 5.86 ± ± 0.01 0.02 0.01 TCA-precipitated protein (%, dry basis) 14.10 13.23 土 10.87 ± 0.52 6.95 土 ± 0.01 1.67 1.08 a Average apparent diameter for raw and clarifeid juices were measured by static light scattering (Mastersizer 2000), while results from ultracentrifuged and heat clarifeid juice were measured by dynamic light scattering (Zetasizer). b pH of raw juice was adjusted as part of the processing (Section 2.2.1). clarifeid (HCJ) juice samples performed under reducing conditions. RBCL: RuBisCO large subunit; RBCS: RuBisCO small subunit; The dashed box in emphasizes on the shift in size of the RuBisCO large subunit upon ultracentri-fugation and mild heat treatment. As shown in Fig. 4A, removing insoluble material through centrifu-gation (CJ) was not suffciient to have an effciient separation, and a low amount of protein was transmitted through the membrane with a nominal cut-off size of 1 u m (Fig. 4). This was most probably due to the large particles still present in the CJ sample (Table 1), which irreversibly fouled the fliters irrespective of the vibration that was applied in the cross folw system. The decrease of the RuBisCO permeation over time in CJ samples was in agreement with Eakin et al. (1978), who observed a ~50% decrease in protein permeation through a 0.2 u m membrane after a short time of flitering alfalfa juice that was pre-flitered with nylon bag to remove insoluble fbiers. Furthermore, the authors observed the for-mation of a signifciant gel layer, which compromised the selectivity of the membranes. Fouling was also observed by Zhang et al. (2015), during microflitration of alfalfa juice using different fliters. Fig. 4 shows that there was a higher extent of protein permeation for UJ (B) and HCJ (C) than CJ (A). These results correspond well with the apparent hydrodynamic radius of the particles (Table 1) in the UJ and The dry matter concentration of the various fractions obtained by microflitration is summarized in Table 2. While the dry matter of the UJ and HCJ samples did not change during the MF process, showing the similar values for the feed, retentate, and permeate samples, the dry matter of the CJ was shown to be concentrated on the retentate side. Table 2 also shows the amount of TCA-precipitated protein and NPN present in the MF fractions. In CJ, the TCA-precipitated were shown to be lower in the permeate side despite having similar values in the feed and retentate samples, indicating a possible loss of protein, potentially due to deposition on membrane surfaces. Furthermore, the TCA-precipitated protein of the UJ was shown to be concentrated on the retentate side, which is in agreement with Fig. 4B. TCA-precipitated protein values of the feed, retentate, and permeate of HCJ appeared to be a plateau, indicating that the proteins were able to pass through the MF membranes upon heat treatment, which is in good agreement with Fig. 4C. It is reiterated that the protein concentration obtained through TCA-precipitation are rough estimates due to the use of a conversion factor of 6.25 (Maehre, Dalheim, Edvinsen, Elvevoll, & Jensen, 2018), as well as the aforementioned potential overestimation of crude protein in CJ samples due to co-precipitation of chlorophyll during TCA-precipitation. While the NPN value of the CJ permeate was higher than those of the feed and retentate, the NPN values of the UJ and HCJ were shown to be relatively on a plateau during the MF process. This indicates that the NPN can freely pass through the membranes both in the absence of (in the case of UJ and HCJ) and despite the presence of fouling (for CJ), therefore emphasizing that total nitrogen value would not be a good i i n n d d i i c c a a t t o o r r f f o o r r p p r r o o t t e e i i n n d d i i s s t t r r i i b b u u t t i i o o n n f f o o r r t t h h e e a a l l f f a a l l f f a a j j u u i i c c e e .. I I t t i i s s w w o o r r t t h h mentioning that the NPN values (Table 2) reported are considerably high. However, the amount of non-protein nitrogen in alfalfa has been shown to be high (~28%) early on (Miller, 1921), and a recent study has demonstrated that twin screw pressing extracted higher portion of NPN, than protein/amino acid-associated Nitrogen (Damborg,St ø dkilde, Jensen, & Weisbjerg, 2018). Ultimately, it should be noted that the NPN calculation method does not distinguish between nitrogen-containing compounds that are associated with proteins, e.g. free peptides and amino acids, and those that are not, e.g. urea and ammonia. Raw Juice (RJ) Fig. 3. Visual appearance of the juice samples subjected to clarifciation (CJ), ultracentrifugation (UJ), heating (HCJ), and subsequently microflitration processes using 1 u m hydrophilized PTFE membrane in a vibrating, cross-flow Vibro-Lab35P system. Fig. 4. SDS-PAGE under reducing conditions for clarifeid (A), ultracentrifuged (B), and heat clarifeid (C) juice samples, and their microflitered fractions. Start: permeate at beginning of flitration; Middle: permeate at approximately 1.5× volumetric concentration factors; End: permeate at 2x volumetric concentra-tion factors. Table 2 Dry matter, TCA-precipitated protein, and non-protein Nitrogen of flitration feed, retentate, and permeate of clarifeid, ultracentrifuged, and heat clarifeid juice samples. Within the same pre-treatments, superscripts denote signifciant difference at p < 0.05 among different fractions. Clarifeid juice Ultracentrifuged juice Heat clarifeid juice Filtration Retentate Permeate Filtration Retentate Permeate Filtration Retentate Permeate feed feed feed Dry matter (%) 6.75a ± 0.49 8.69b ± 4.78c ± 5.78a ± 0.37 5.46a ±0.58 5.56a ± 6.25a ± 0.04 6.45a ± 6.35a ± 0.73 0.41 0.67 0.56 0.11 TCA-precipitated protein (%, 13.25a 土 14.94a ± 6.56 b ± 10.88a 土 14.30b ± 8.00c 土 6.94a ± 1.08 7.62a ± 5.88a 土 dry matter) 1.77 2.56 0.69 0.50 0.25 0.88 0.20 0.36 Non-protein nitrogen (%, dry 1.82a ± 0.03 1.75a ±0.08 2.25 b 士 1.77a ± 0.11 2.08a ±0.18 1.79a 士 2.37a ± 0.08 2.42a ± 2.29a ± matter) 0.18 0.16 0.01 0.11 3.3. Molecular details of juice samples The SEC and BN-PAGE measurements were carried out on freshly produced samples in order to avoid unwanted aggregation due to freezing. The SEC elution proflie (Fig. 5A) showed a small excluded volume peak for CJ and UJ at ~9 mL. The CJ, UJ, and HCJ samples also exhibited a RuBisCO peak eluting at ~15 mL, matching the major peak of the RuBisCO standard. The peaks eluting after 18 mL are likely to be phenolic compounds due to their smaller hydrodynamic radius, high absorbance at 320 nm (wavelength related to phenolic compounds)(Kaeswurm, Scharinger, Teipel, & Buchweitz, 2021), a yellowish color after fractionation, and low light scattering signal in the MALS detector (data not shown). Furthermore, we have previously tried to identify s s u u c c h h p p e e a a k k w w i i t t h h S S D D S S --P P A A G G E E w w i i t t h h o o u u t t s s u u c c c c e e e e d d i i n n g g i i n n o o b b t t a a i i n n i i n n g g b b a a n n d d s s (Tanambell et al., 2022). The identity of the peak eluting at ~15 mL was further confrimed by their ~500 kDa size in the BN-PAGE (Fig. 5B). The band at ~500 kDa is roughly in agreement with the RuBisCO band from alfalfa observed by Ladig et al. (2011), as well as the known size of native size of RuBisCO from higher plants (Di Stefano et al., 2018). It is interesting that the BN-PAGE showed no well-defnied RuBisCO band in the unfractionated RJ and CJ samples despite the fact that an intense RuBisCO peak was observed on the SEC (Fig. 5A) and SDS-PAGE (Fig. 2) proflies of the CJ. In addition, the SEC fraction collected from CJ showed a strong RuBisCO band in the BN-PAGE (Fig. 5B), suggesting that dilution with the salt-phosphate buffer and the fractionation through the column might have eliminated some of the contaminants and/or aggregates affecting the electrophoresis. The wells of the unfractionated RJ, CJ, UJ, and HCJ samples also depicted some larger aggregates that did not migrate into the gels (solid box in Fig. 5B). HCJ samples showed the least intensity of such band, and this might correspond to its SEC proflie (in Fig. 5A), which lacked a peak at ~9 mL present in CJ and UJ samples. This in-dicates that the mild heating process might have either dissociated or precipitated these aggregates. As the fractions were demonstrated to be comprised of native RuBisCO (Fig. 5B), the SEC fractions were subjected to hydrodynamic size analysis by DLS. The average particle size of the SEC-fractionated RuBisCO peaks of the CJ, UJ, and HCJ had similar values of 15.03 ±0.92, 15.12 ±0.76, and 15.53 ±0.49 nm, respectively. These values are similar to that shown by Desai et al. (2014). When comparing the par-ticle size of these purifeid RuBisCO fractions to the values reported in Table 1, it is clear that the juice samples are comprised of larger mixed particles, which might affect the flitration of the protein through the membrane. The CJ, UJ, and HCJ samples were also analyzed using SEC-MALS-RI. The normalized RI signal and molar mass are plotted against elution volume in Fig. 6. The peak eluting at 5.5 mL was observed in CJ and UJ, but not HCJ samples, as already seen in Fig. 5A. The peak had a poly-dispersity index of ~1.2 in both samples, indicating that the peak is likely comprised of aggregates. The molecular mass (Mw) of the peak was 170 ±17 and 176 ±33 MDa for CJ and UJ, respectively (not shown in graph to emphasize clarity to the Mw of the RuBisCO peak). The peak eluting at ~8.25 mL, containing RuBisCO, was monodisperse (poly-dispersity index of ~1.0), and showed a very different average Mw value was obtained from the RuBisCO peak of the CJ (703.3 ±48.9 kDa) when compared to those of the UJ and HCJ samples (533.5 ±28.3 and 517.3± 23.2 kDa, respectively). The similarity of the peaks on the SEC retention time indicates that the Mw shift did not provide signifciant infulence to the hydrodynamic volume of the RuBisCO protein. The Mw obtained from the RuBisCO peak of UJ and HCJ corresponded to the bands observed in the BN-PAGE (Fig. 5B), and also in agreement with the 497 kDa value reported by Tomimatsu (1980). However, the larger (~700 kDa) value obtained for RuBisCO peak from CJ (Fig. 6) has never been reported before, and indicates a non-covalent association of RuBisCO with other components in the CJ. These results are in agreement also with the SDS-PAGE proflie (Fig. 2), which showed that the ultra-centrifugation and heat treatments shifted the large subunit towards a smaller size. However, this difference in the size of the RuBisCO was not observed in the BN-PAGE, when the protein was isolated by size exclusion (Fig. 5B; Lane number 4 from the right), possibly due to the concentration and diaflitration used during the sample preparation for BN-PAGE (see Section 2.3.3.1), which might have removed some compounds associated with CJ that were measured in the MALS. Ladig et al. (2011) have visualized complexes of ~480 and ~750 kDa from pea chloroplasts by two different conditions of native-PAGE, and confrimed that the bands were comprised of RuBisCO through mass spectrometry. Nonetheless, only a RuBisCO complex of ~480 kDa was found from alfalfa chloroplasts in the same study. These differences might be attributed to the fact that unlike apparent Mw obtained from migration behavior in PAGE gel systems, the Mw measurement by SEC-MALS does not require detergent and is less affected by the presence of other charged compounds. There were also differences in the alfalfa parts that we used in the present study compared to Ladig et al. (2011), who isolated chloroplasts from alfalfa leaves, whereas stems were pressed together with leaves in this study (Section 2.2.1). To the best of our knowledge to-date, there are no published data on the absolute o Elution Volume (mL) Fig. 6. Size exclusion chromatograms exhibiting normalized refractive index (RI) and molar mass versus elution time of clarifeid, ultracentrifuged, and heat clarifeid juice samples. Mw: molecular weight; RI: refractive index; curves are average of duplicates; black box indicates aggregate peaks that were present in CJ and UJ samples. molecular mass of RuBisCO from alfalfa as measured by light scattering except of that reported by Tomimatsu (1980), and for the frist time, the difference in the Mw of the protein depending on the treatment of the juice has been reported. Ultimately, further study will be required to characterize these larger RuBisCO complexes and their constituents. 3.4. General discussion The present work clearly demonstrated that despite of sodium sulftie addition to inhibit oxidation of polyphenols and their subsequent reac-tion with proteins, RuBisCO in the alfalfa juice exists as non-covalent aggregates, rather than as singular hexadecamers. The possibility of using MF for partitioning the green color in the retentate is an advantage for using the permeate for downstream food applications where green color is not desired, such as egg white analogs (Zhou, Vu, & McClements,22002222)).. F F u u r r t t h h e e r r p p r r o o c c e e s s s s i i n n g g i i s s ,, h h o o w w e e v v e e r r ,, r r e e q q u u i i r r e e d d f f o o r r m m a a k k i i n n g g t t h h e e permeate adequate for food, not solely for concentrating the protein, but also to remove excess sulftie and anti-nutrients in the system. Various processes that can be considered for such purpose include UF-diaflitration (Knuckles, Edwards, Miller, & Kohler, 1980), ion ex-change expanded bed chromatography, or thermal denaturation (St ø dkilde, Ambye-Jensen, & Jensen, 2021). The MF results demonstrated that mild heating was a superior pre-treatment relative to clarifciation and ultracentrifugation for MF, allowing RuBisCO from alfalfa juice to pass freely through membranes with a nominal cut-off value of 1 u m more freely up to 2x volumetric concentration factor. However, it needs to be acknowledged that the mild heating process also potentially caused more protein loss (Table 1). This is in agreement with a previous study which also reported that alfalfa HCJ produced with a similar manner only had ~50% the nitrogen of the green juice (Nyna s s et al., 2021). This possible protein loss is not necessary wasted, as the green extraction paste produced from the heat treatment can be potentially utilized for animal feed (M ø ller et al., 2021). The methodology used for the mild heating process, including ther-mal processing, low speed centrifugation, and MF, are also relatively more scalable than other frequently used purifciations means, such as ultracentrifugation or column chromatography (Di Stefano et al., 2018). However, proteolysis needs to be considered when scaling up the pro-cess as Koschuh et al. (2004) has demonstrated that protein degradation in alfalfa juice is rapid at room temperature. Furthermore, an endopeptidase from alfalfa has been demonstrated to be present in so-lution and active after 1 h of ultracentrifugation at 100,000 ×g (Ferrari, Alpi, & Balestreri, 1988). Considering these past endogenous proteolytic activity reports on alfalfa extracts, further research on approaches for minimizing protein degradation during processing is needed for scaling up the whole process. Another issue to be considered in scaling up is the regular process control for protein quantifciation, in which we have demonstrated that total Nitrogen does not represent the protein distri-bution of different fractions of alfalfa juice. Ultimately, the economical feasibility of the whole system does not only rely on protein as single output from processing alfalfa, but will also depend on the valorization of side streams, such as pulp after screw pressing and leftover liquid fractions generated from processing, for other purposes as suggested in M ø ller et al. (2021). 4. Conclusion This work assessed the partitioning behavior of RuBisCO from alfalfa following three different pre-treatments. It was demonstrated that ul-tracentrifugation and mild heat treatment were able to separate the soluble RuBisCO proteins from the chloroplastic materials, while low speed centrifugation was unsuccessful. RuBisCO from CJ samples was shown to possess higher Mw than those of the other samples, which were similar in values with the known Mw of RuBisCO of higher plants. In addition, the CJ and UJ samples were shown to contain nanosized ag-gregates not present in HCJ. Interestingly, only the mild heat treatment was able to allow the soluble RuBisCO to pass through membranes with 1 u m cut-off value. Although further studies in optimizing the mild heat and MF conditions to minimize the protein loss and maximize removal of chloroplastic materials are needed, this study demonstrated that mild heating can be used to manipulate the supramolecular structure of RuBisCO from alfalfa, while preserving its native state, allowing its fractionation using MF. Supplementary data to this article can be found online at https://doi. org/10.1016/j.ifset.2023.103408. Funding This work was supported by Aarhus University Center for Innovative Food Research (CiFOOD). Data in this work was generated through accessing research infrastructure at Aarhus University, including those funded by FOODHAY (Food and Health Open Innovation Laboratory, Danish Roadmap for Research Infrastructure). CRediT authorship contribution statement Hartono Tanambell: Conceptualization, Methodology, Investiga-tion, Writing – original draft. Anders Hauer M ø ller: Conceptualization, Methodology, Supervision, Writing – review & editing. Laura Roman:Methodology, Writing – review & editing. Milena Corredig: Concep-tualization, Methodology, Supervision, Writing –review & editing. Trine Kastrup Dalsgaard: Conceptualization, Methodology, Supervi-sion, Writing – review & editing, Funding acquisition. Declaration of competing interest The authors declare no confilct of interests. Data availability Data will be made available on request. References Ajibola, O. O. (1984). Physical, chemical and microbiological changes during green plant juice fermentation. Food Chemistry, 13(3), 181–192. Amer, B., Juul, L., M ø ller, A. H., M ø ller, H. S., & Dalsgaard, T. K. (2021). Improved solubility of proteins from white and red clover - inhibition of redox enzymes. International Journal of Food Science and Technology, 56(1), 302–311. Bresson, J.-L., Flynn, A., Heinonen, M., Hulshof, K., Korhonen, H., Lagiou, P., …Moseley, B. (2009). Opinion on the safety of ‘Alfalfa protein concentrate ’as food:Scientifci Opinion of the Panel on Dietetic Products, Nutrition and Allergies. EFSA Journal, 7(4), 997. https://doi.org/10.2903/j.efsa.2009.997 D ’Alvise, N., Lesueur-Lambert, C., Fertin, B., Dhulster, P., & Guillochon, D. (2000). Removal of polyphenols and recovery of proteins from alfalfa white protein concentrate by ultraflitration and adsorbent resin separations. Separation Science and Technology, 35(15), 2453–2472. Damborg, V. K., St ø dkilde, L., Jensen, S. K., & Weisbjerg, M. R. (2018). Protein value and degradation characteristics of pulp fbire fractions from screw pressed grass, clover, and lucerne. Animal Feed Science and Technology, 244, 93–103. de Mendiburu, F. (2020). agricolae: Statistical procedures for agricultural research . Lima, Peru: National Engineering University . Desai, R. K., Streefalnd, M., Wijffels, R. H., & Eppink, M. H. M. (2014). Extraction and stability of selected proteins in ionic liquid based aqueous two phase systems. Green Chemistry, 16(5), 2670–2679. Di Stefano, E., Agyei, D., Njoku, E. N., & Udenigwe, C. C. (2018). Plant RuBisCo: An underutilized protein for food applications. Journal of the American Oil Chemists Society, 95(8), 1063–1074. Eakin, D. E., Singh, R. P., Kohler, G. O., & Knuckles, B. (1978). Alfalfa protein fractionation by ultraflitration. Journal of Food Science, 43(2), 544. Edwards, R. H., Miller, R. E., Fremery, D. D., Knuckles, B. E., Bickoff, E. M., & Kohler, G. O. (1975). Pilot-plant production of an edible white fraction leaf protein concentrate from alfalfa. Journal of Agricultural and Food Chemistry, 23(4), 620–626. Ferrari, L., Alpi, A., & Balestreri, E. (1988). Characterization of an endopeptidase from alfalfa (Medicago sativa L) leaves. Journal of Plant Physiology, 132(1), 74–79. Fremery, D. D., Miller, R. E., Edwards, R. H., Knuckles, B. E., Bickoff, E. M., &Kohler, G. O. (1973). Centrifugal separation of white and green protein fractions from alfalfa juice following controlled heating. Journal of Agricultural and Food Chemistry, 21(5), 886–889. Godfray, H. C., Beddington, J. R., Crute, I. R., Haddad, L., Lawrence, D., Muir, J. F., …Toulmin, C. (2010). Food security: The challenge of feeding 9 billion people. Science,327(5967), 812–818. Henchion, M., Hayes, M., Mullen, A. M., Fenelon, M., & Tiwari, B. (2017). Future protein supply and demand: Strategies and factors infulencing a sustainable equilibrium. Foods, 6(7). Hojilla-Evangelista, M. P., Selling, G. W., Hatfeild, R., & Digman, M. (2017). Extraction, composition, and functional properties of dried alfalfa (Medicago sativa L.) leaf protein. Journal of the Science of Food and Agriculture, 97(3), 882–888. Jensen, O. N., Larsen, M. R., & Roepstorff, P. (1998). Mass spectrometric identifciation and microcharacterization of proteins from electrophoretic gels: Strategies and applications. Proteins-Struct. Funct. Bioinformatics , 74–89. Kaeswurm, J. A. H., Scharinger, A., Teipel, J., & Buchweitz, M. (2021). Absorption coeffciients of phenolic structures in different solvents routinely used for experiments. Molecules, 26(15). Kang, D. H., Gho, Y. S., Suh, M. K., & Kang, C. H. (2002). Highly sensitive and fast protein detection with coomassie brilliant blue in sodium dodecyl sulfate-polyacrylamide gel electrophoresis. Bulletin of the Korean Chemical Society, 23(11), 1511–1512. Knuckles, B. E., Edwards, R. H., Miller, R. E., & Kohler, G. O. (1980). Pilot scale ultraflitration of clarifeid alfalfa juice. Journal of Food Science, 45(3), 730–734. Koontz, L. (2014). TCA precipitation. In , Vol. 541. Methods in enzymology (pp. 3–10). Elsevier . Koschuh, W., Povoden, G., Thang, V. H., Kromus, S., Kulbe, K. D., Novalin, S., &Krotscheck, C. (2004). Production of leaf protein concentrate from ryegrass (Lolium perenne x multifolrum) and alfalfa (Medicago sativa subsp. sativa). Comparison between heat coagulation/centrifugation and ultraflitration. Desalination, 163(1–3),253–259. Kroll, N. G., Rawel, H. M., & Rohn, S. (2003). Reactions of plant phenolics with food proteins and enzymes under special consideration of covalent bonds. Food Science and Technology Research, 9(3), 205–218. Ladig, R., Sommer, M. S., Hahn, A., Leisegang, M. S., Papasotiriou, D. G., Ibrahim, M., …Schleiff, E. (2011). A high-defniition native polyacrylamide gel electrophoresis system for the analysis of membrane complexes. Plant Journal, 67(1), 181–194. Laemmli, U. K. (1970). Cleavage of structural proteins during the assembly of the head of bacteriophage T4. Nature, 227(5259), 680–685. Lamsal, B. P., Koegel, R. G., & Boettcher, M. E. (2003). Separation of protein fractions in alfalfa juice: Effects of some pre-treatment methods. Transactions of the Asae, 46(3),715–720. Lamsal, B. P., Koegel, R. G., & Gunasekaran, S. (2007). Some physicochemical and functional properties of alfalfa soluble leaf proteins. Lwt-Food Science and Technology,40(9), 1520–1526. Maehre, H. K., Dalheim, L., Edvinsen, G. K., Elvevoll, E. O., & Jensen, I. J. (2018). Protein determination-method matters. Foods, 7(1). Miller, H. G. (1921). Nitrogen compounds in alfalfa hay. Journal of the American Chemical Society, 43, 2656–2663. M ø ller, A. H., Hammersh ø j, M., dos Passos, N. H. M., Tanambell, H., St ø dkilde, L., Ambye-Jensen, M., … Dalsgaard, T. K. (2021). Biorefniery of green biomass-how to extract and evaluate high quality leaf protein for food? Journal of Agricultural and Food Chemistry, 69(48), 14341–14357. Nieuwland, M., Geerdink, P., Engelen-Smit, N. P., van der Meer, I. M., America, A. H., Mes, J. J., … Mulder, W. J. (2021). Isolation and gelling properties of duckweed protein concentrate. ACS Food Science & Technology, 1, 908–916. Nissen, S. H., Lübeck, M., M ø ller, A. H., & Dalsgaard, T. K. (2022). Protein recovery and quality of alfalfa extracts obtained by acid precipitation and fermentation. Bioresource Technology Reports, 19, Article 101190. Nyn a as, A. L., Newson, W. R., & Johansson, E. (2021). Protein fractionation of green leaves as an underutilized food source-protein yield and the effect of process parameters. Foods, 10(11). R Core Team. (2021). R: A language and environment for statistical computing . Vienna, Austria: R Foundation for Statistical Computing . Reig, M., Vecino, X., & Cortina, J. L. (2021). Use of membrane technologies in dairy industry: An overview. Foods, 10(11). Saf,i C., Olivieri, G., Campos, R. P., Engelen-Smit, N., Mulder, W. J., van den Broek, L. A. M., & Sijtsma, L. (2017). Biorefniery of microalgal soluble proteins by sequential processing and membrane flitration. Bioresource Technology, 225,151–158. Singer, S. J., Eggman, L., Campbell, J. M., & Wildman, S. G. (1952). The proteins of green leaves. 4. A high molecular weight protein comprising a large part of the cytoplasmic proteins. Journal of Biological Chemistry, 197(1), 233–239. Skunca, D., Romdhana, H., & Brouwers, R. (2021). Rubisco protein production –LCA approach. MEST Journal, 9(1), 175–183. Solati, Z., Manevski, K., J ø rgensen, U., Labouriau, R., Shahbazi, S., & Laerke, P. E.(2018). Crude protein yield and theoretical extractable true protein of potential biorefniery feedstocks. Industrial Crops and Products, 115, 214–226. St ø dkilde, L., Ambye-Jensen, M., & Jensen, S. K. (2021). Biorefnied organic grass-clover protein concentrate for growing pigs: Effect on growth performance and meat fatty acid proflie. Animal Feed Science and Technology, 276. Tanambell, H., M ø ller, A. H., Corredig, M., & Dalsgaard, T. K. (2022). RuBisCO from alfalfa - native subunits preservation through sodium sulftie addition and reduced solubility after acid precipitation followed by freeze-drying. Lwt-Food Science and Technology , 154. Tomimatsu, Y. (1980). Macromolecular properties and subunit interactions of ribulose-1,5-bisphosphate carboxylase from alfalfa. Biochimica et Biophysica Acta, 622(1),85–93. Wang, Y. R., Zhang, B., Fan, J. L., Yang, Q., & Chen, H. Q. (2019). Effects of sodium tripolyphosphate modifciation on the structural, functional, and rheological properties of rice glutelin. Food Chemistry, 281, 18–27. Wedholm, A., M ø ller, H. S., Lindmark-Mansson, H., Rasmussen, M. D., Andren, A., &Larsen, L. B. (2008). Identifciation of peptides in milk as a result of proteolysis at different levels of somatic cell counts using LC MALDI MS/MS detection. Journal of Dairy Research, 75(1), 76–83. Zhang, W. X., Grimi, N., Jaffrin, M. Y., & Ding, L. H. (2015). Leaf protein concentration of alfalfa juice by membrane technology. Journal of Membrane Science, 489, 183–193. Zhang, W. X., Grimi, N., Jaffrin, M. Y., Ding, L. H., & Tang, B. (2017). A short review on the research progress in alfalfa leaf protein separation technology. Journal of Chemical Technology and Biotechnology, 92(12), 2894–2900. Zhou, H., Vu, G., & McClements, D. J. (2022). Formulation and characterization of plant- based egg white analogs using RuBisCO protein. Food Chemistry, 397, Article 133808.
确定
还剩8页未读,是否继续阅读?


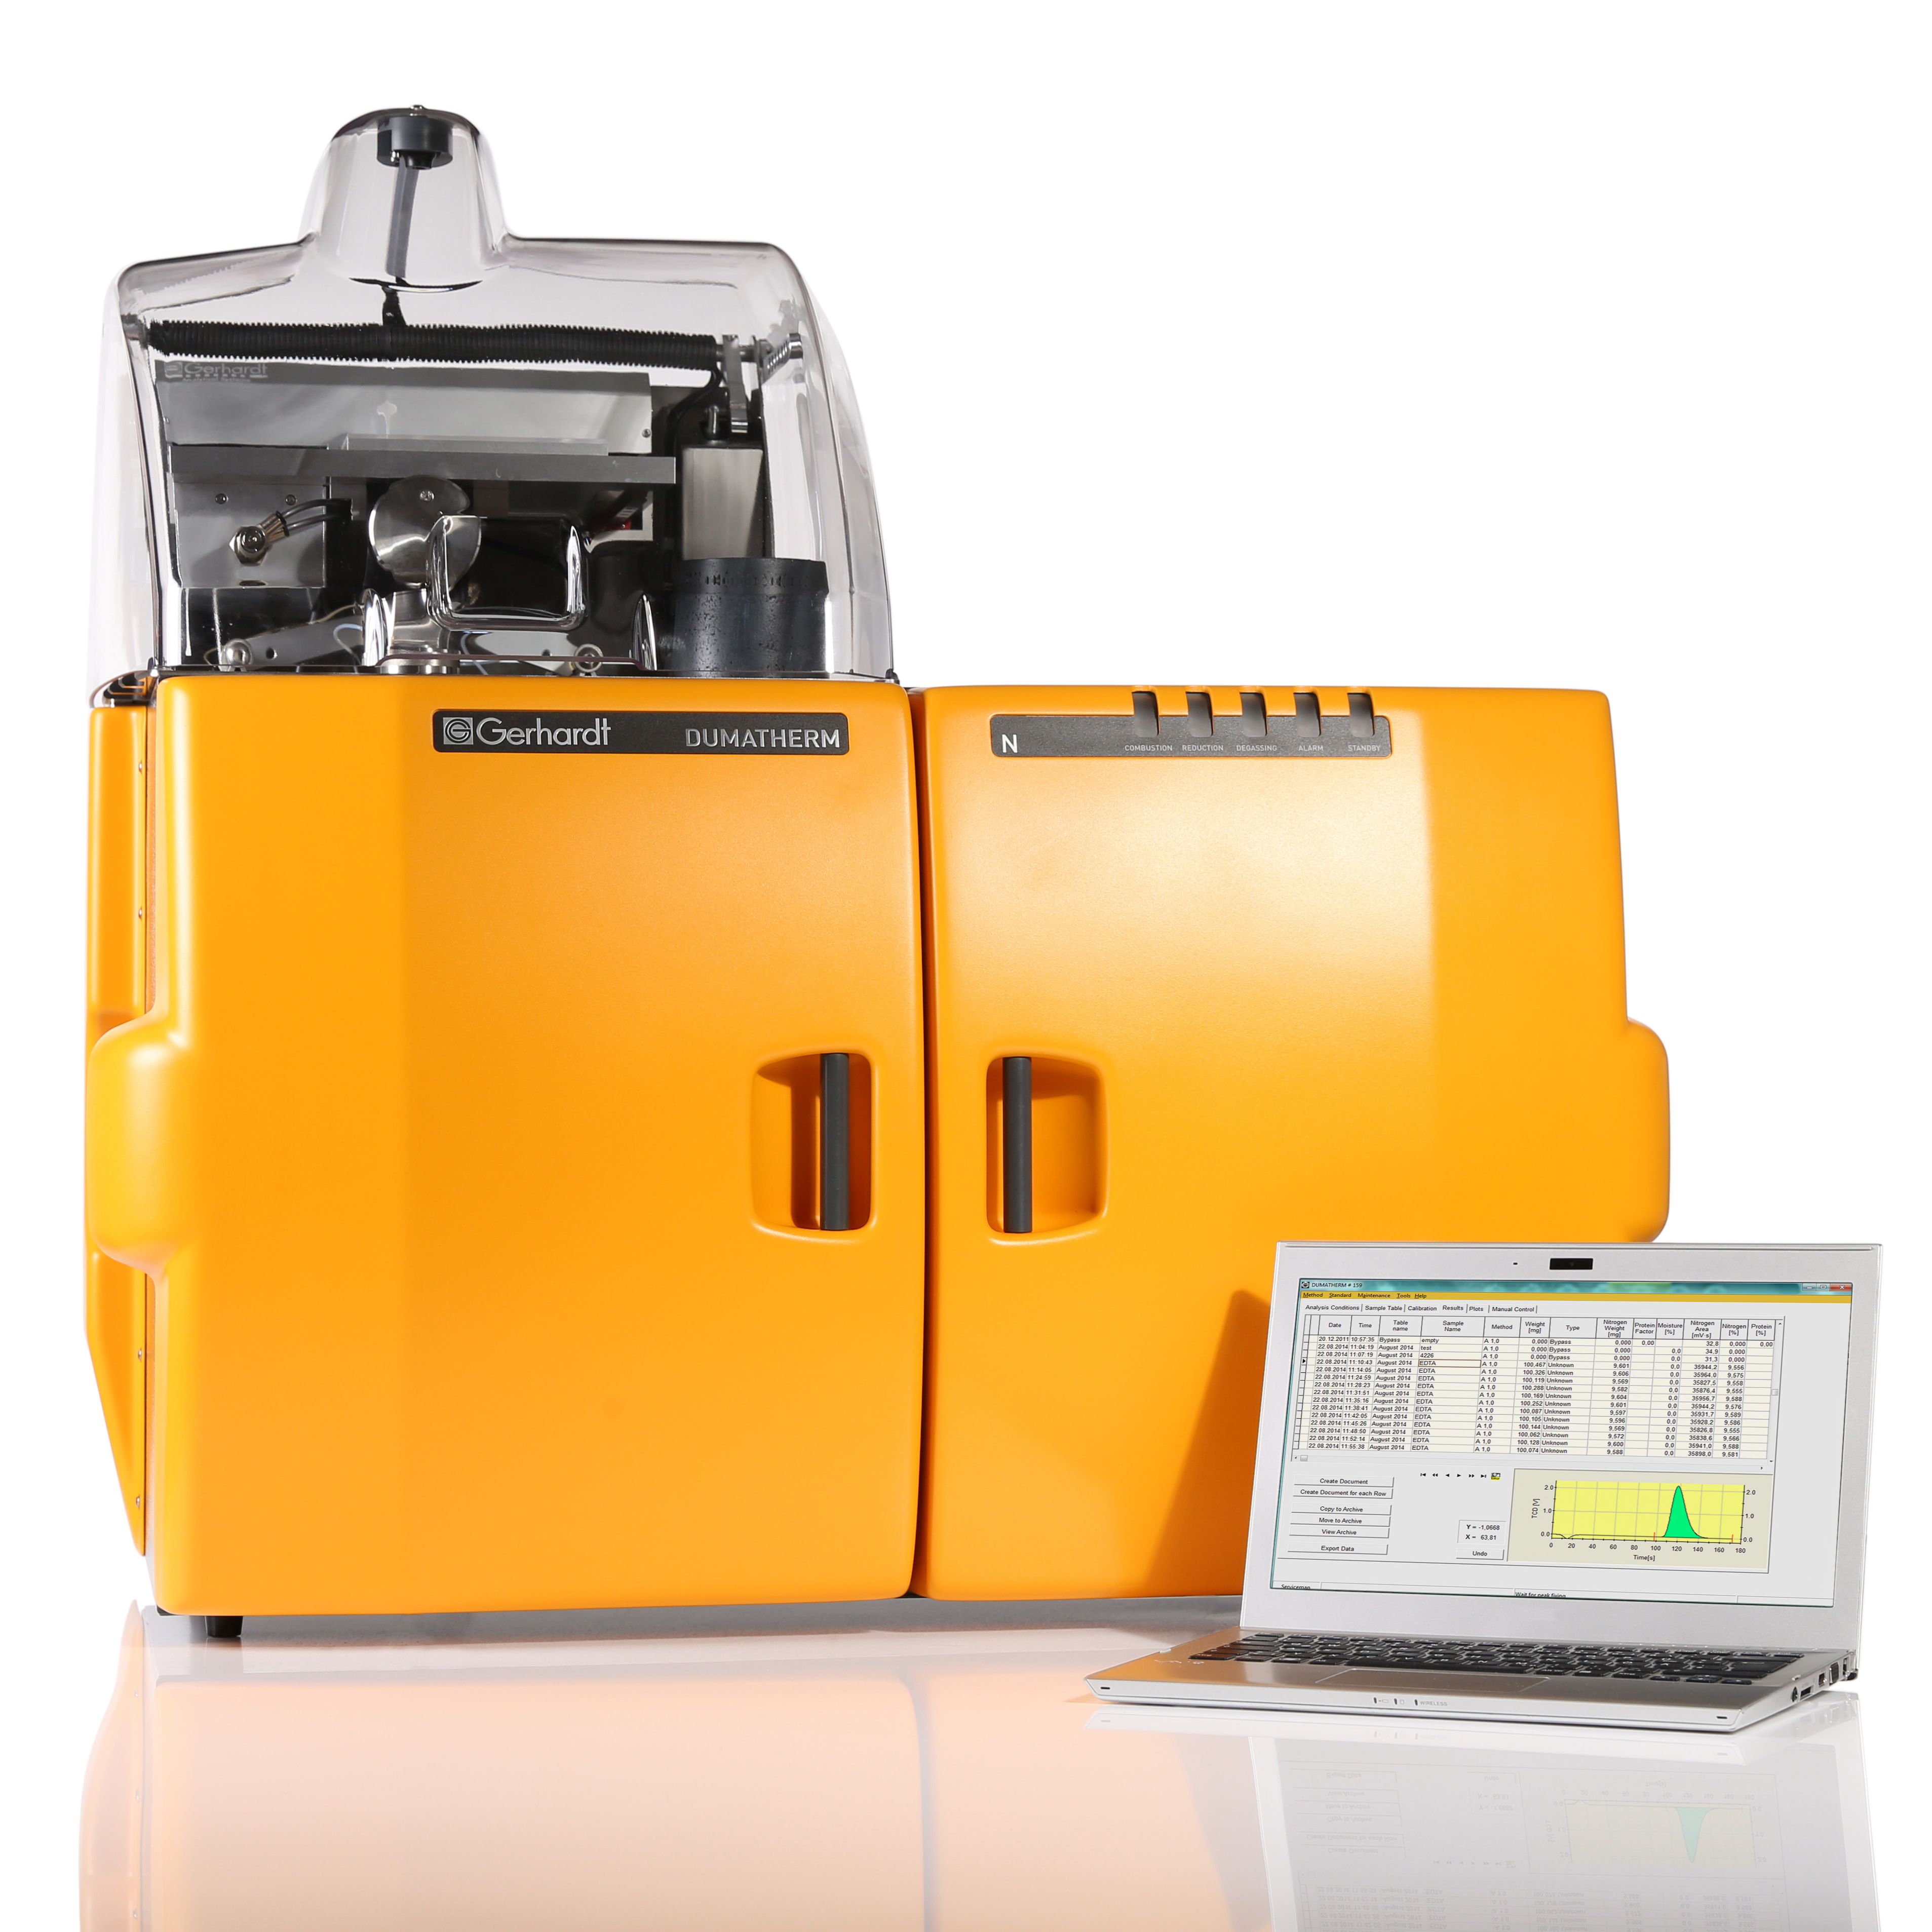
中国格哈特为您提供《苜蓿原汁、苜蓿澄清汁、苜蓿超离心汁、苜蓿热澄清汁中三羧酸沉淀蛋白(真蛋白)和非蛋白氮的测定》,该方案主要用于畜牧中动物营养与健康检测,参考标准--,《苜蓿原汁、苜蓿澄清汁、苜蓿超离心汁、苜蓿热澄清汁中三羧酸沉淀蛋白(真蛋白)和非蛋白氮的测定》用到的仪器有格哈特杜马斯定氮仪DT N Pro、德国移液器MM
推荐专场


相关方案
更多
该厂商其他方案
更多