


方案详情
文
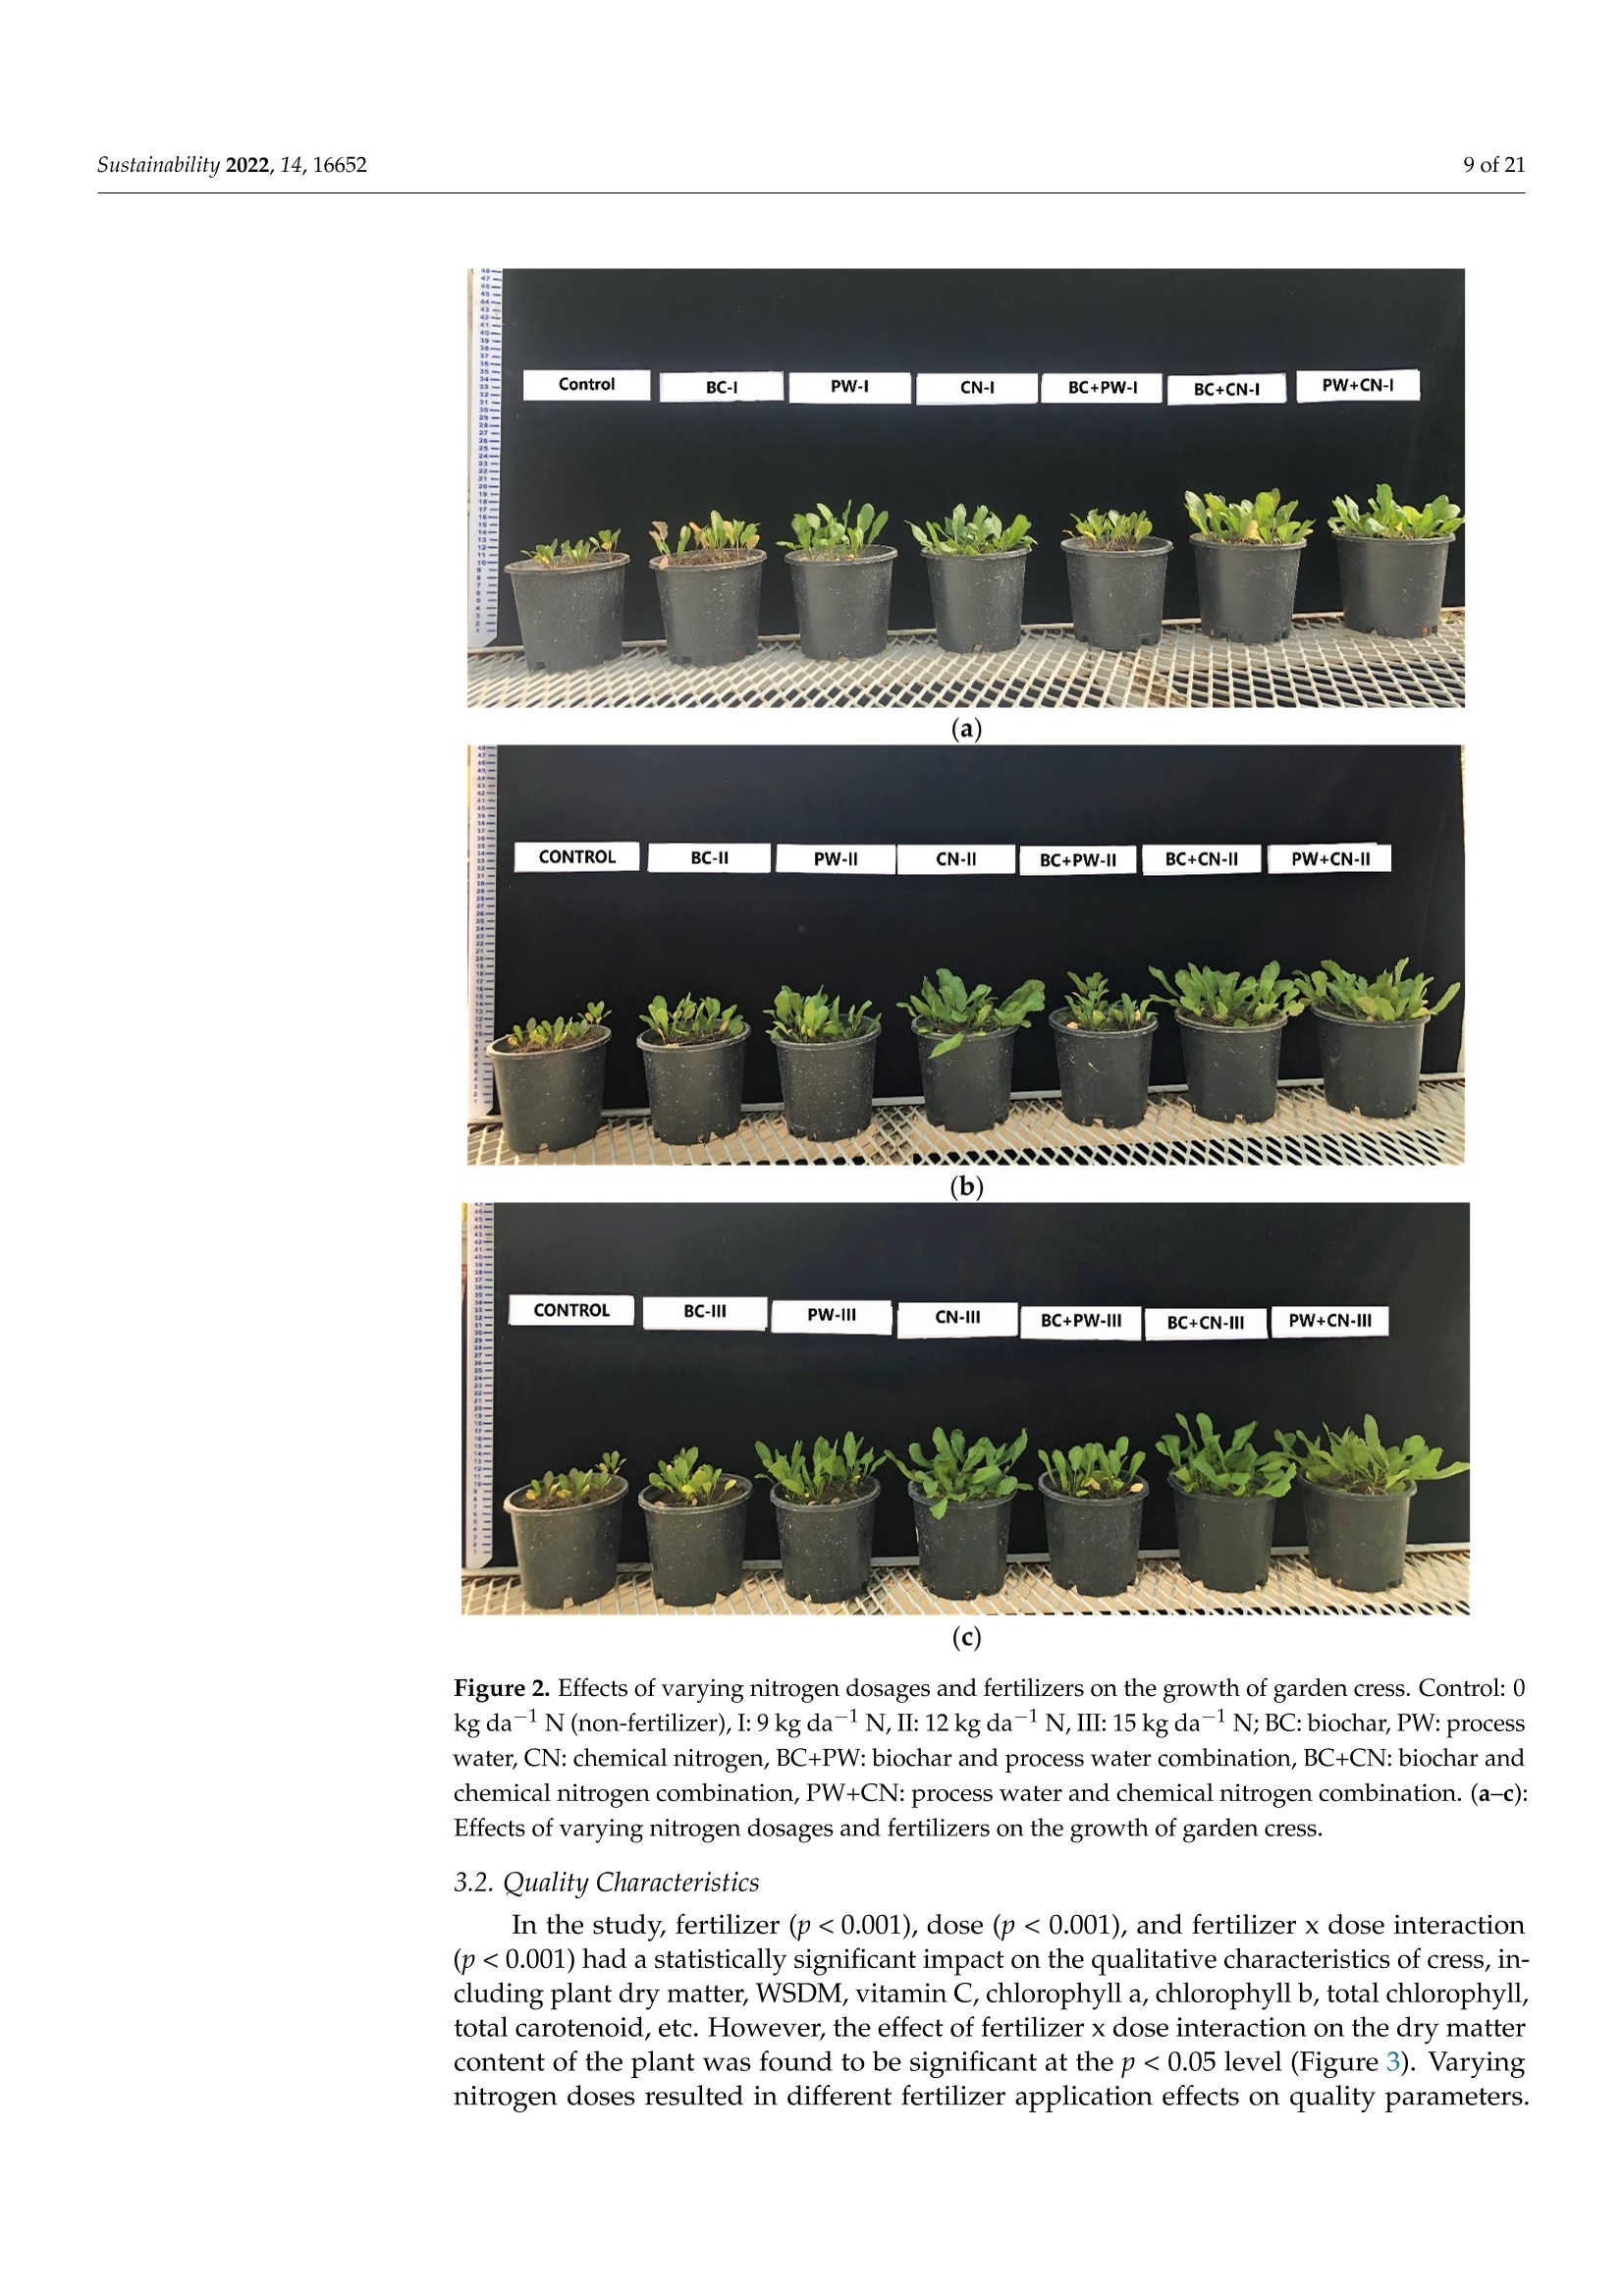
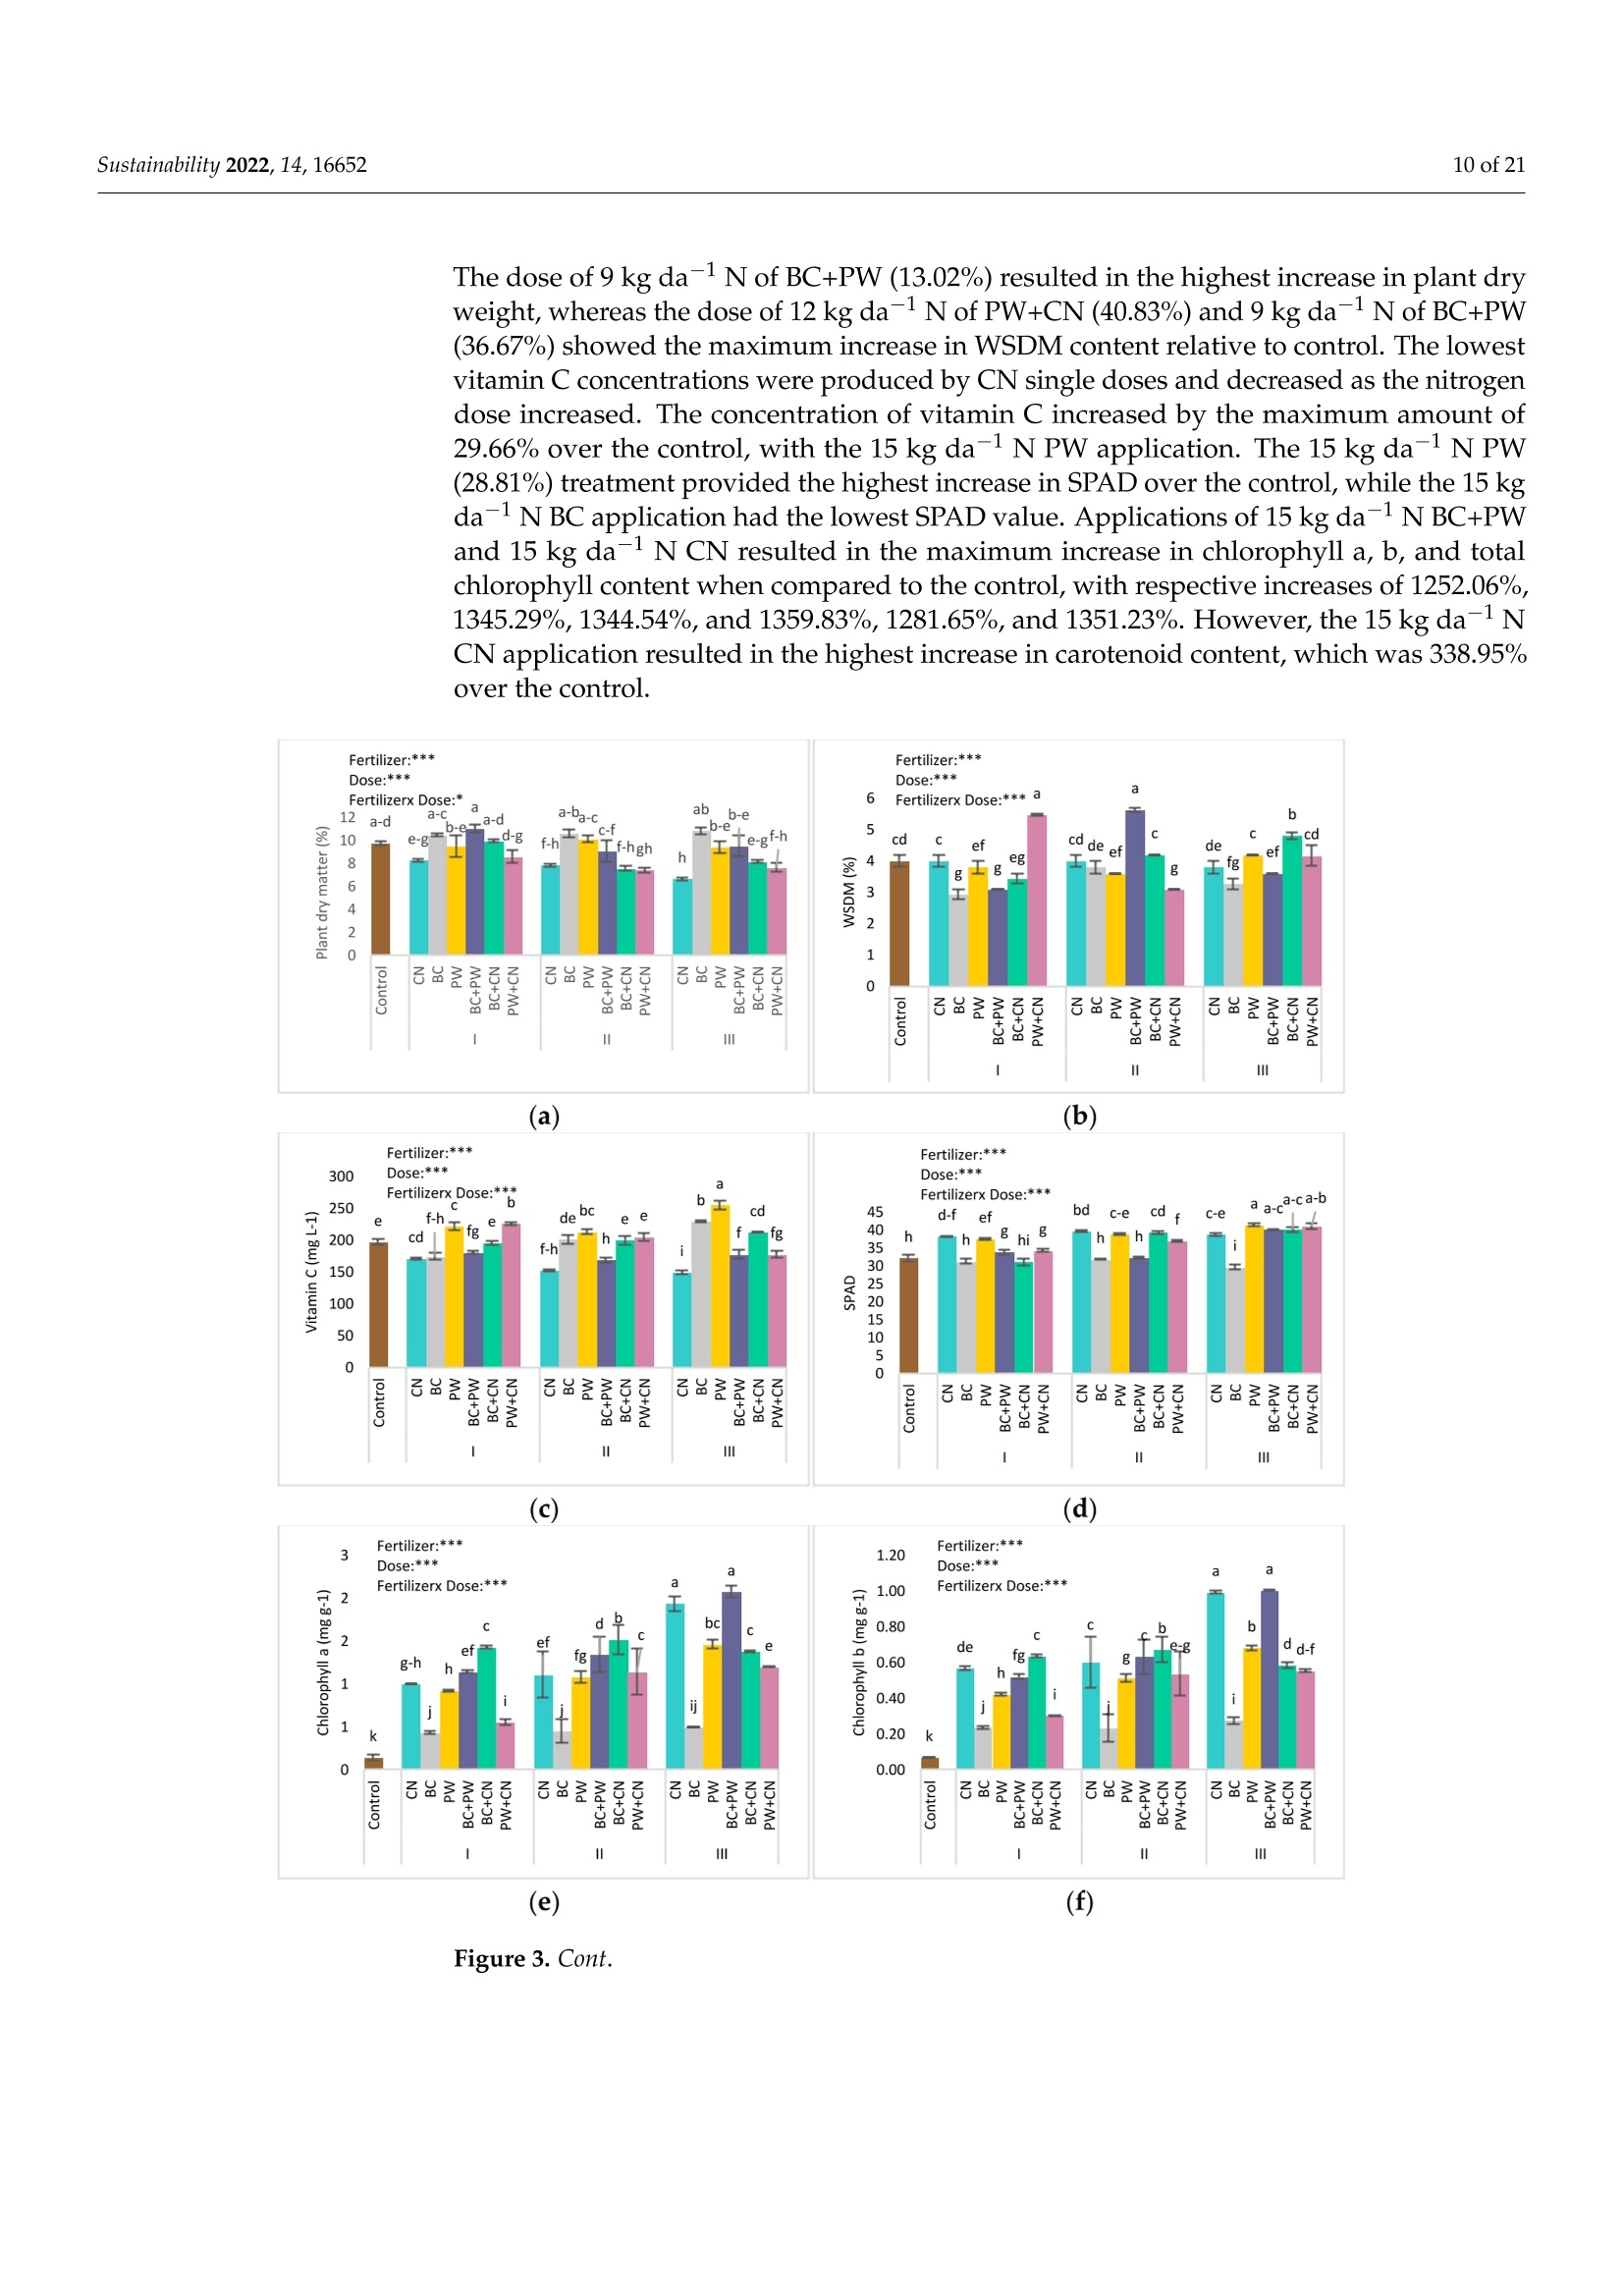
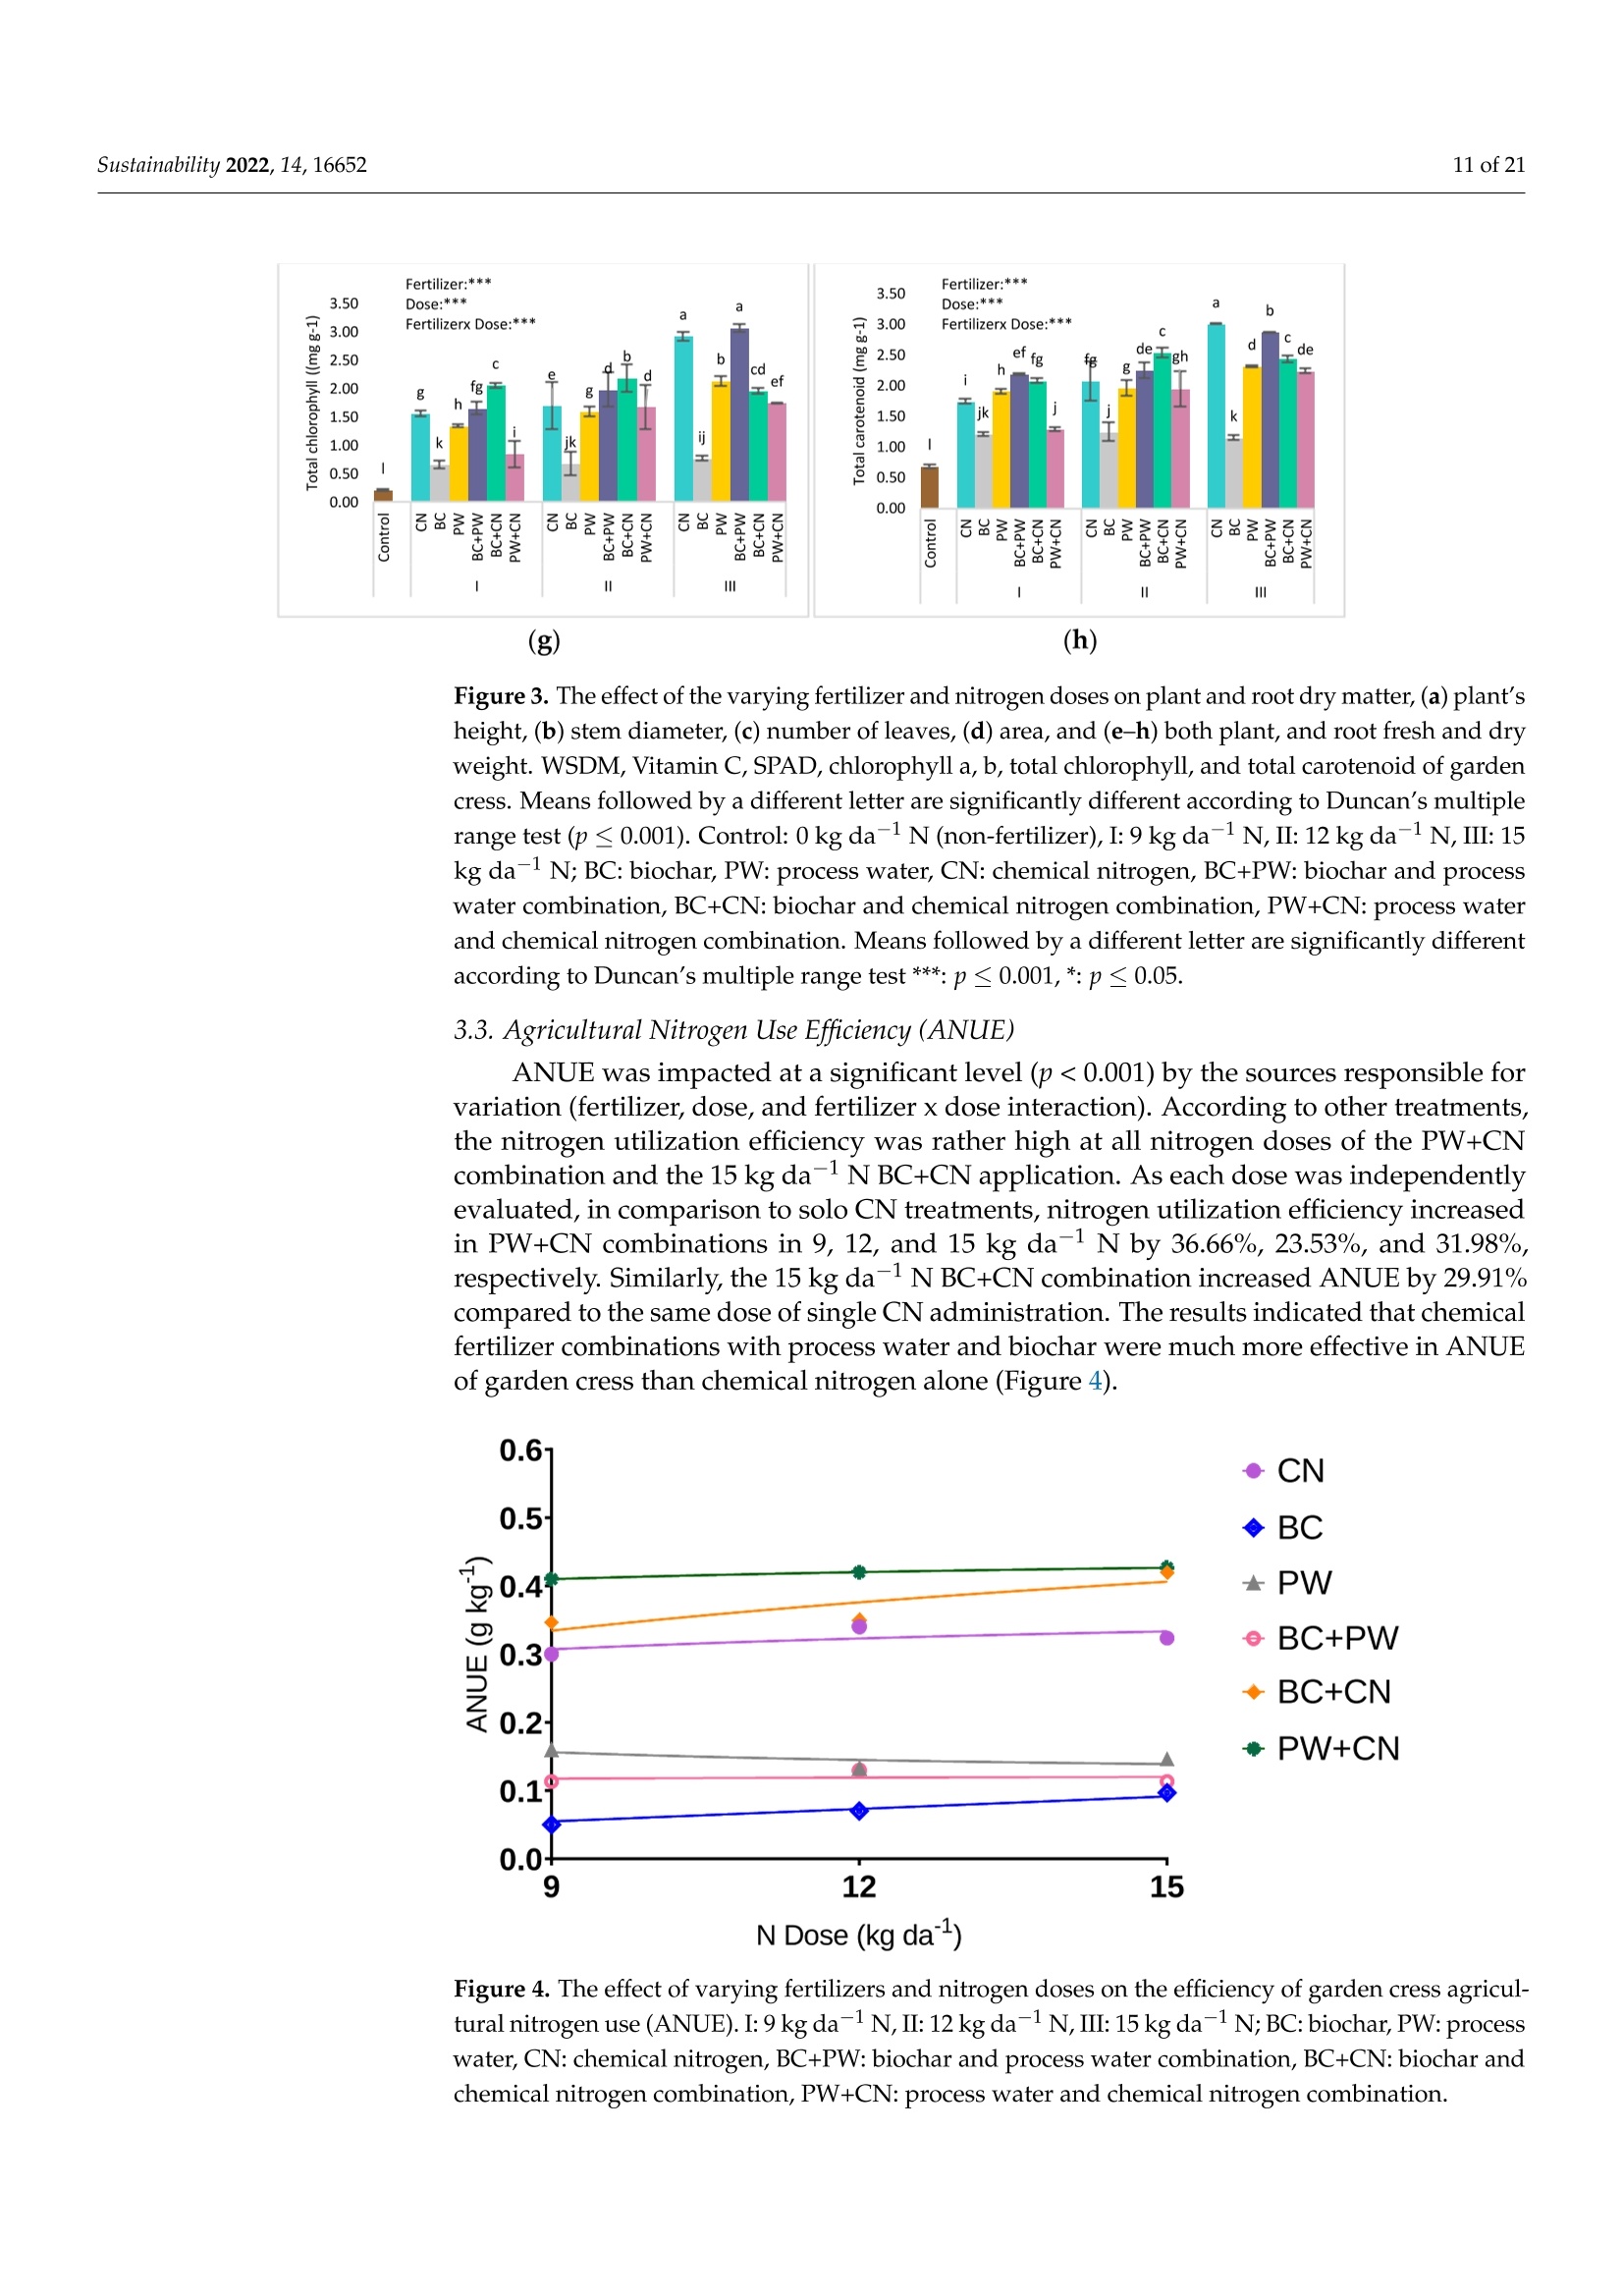
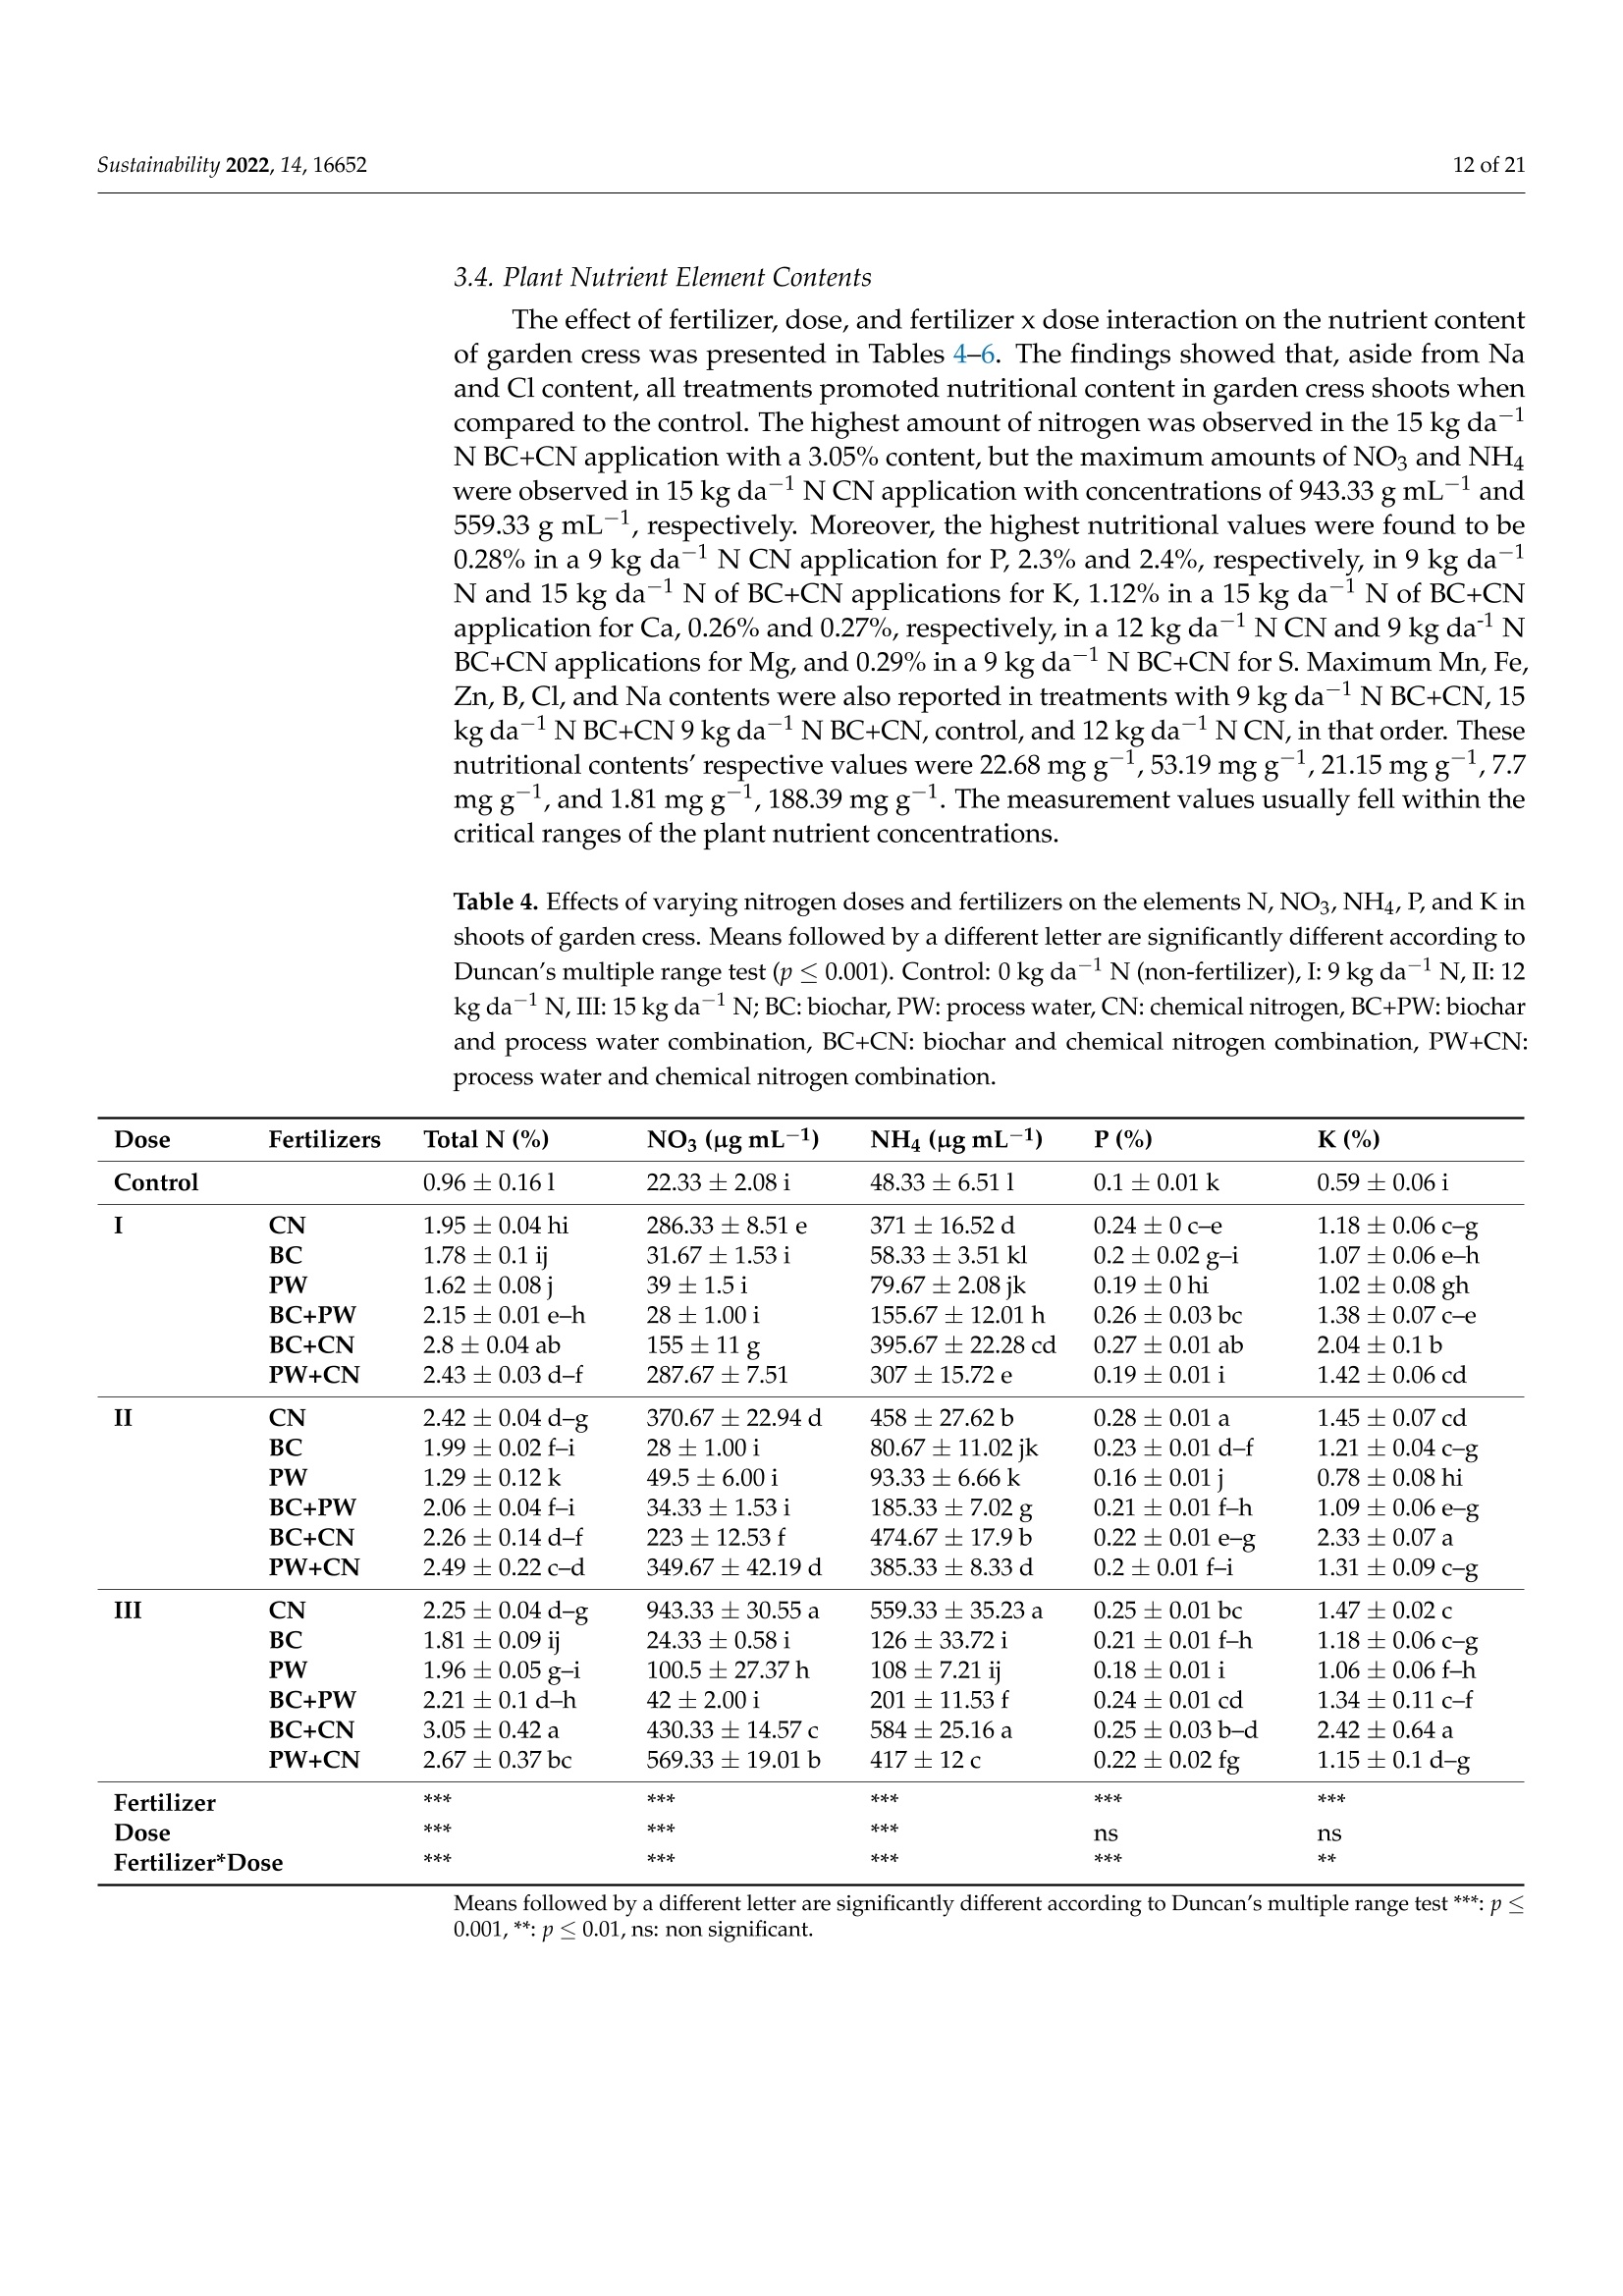
共处理污泥和食品废弃物中生物炭和工艺水对花园水芹(独行菜)生长和质量的影响Effect of Biochar and Process Water Derived from the Co-Processed Sewage Sludge and Food Waste on Garden Cress’ Growth and Quality
方案详情

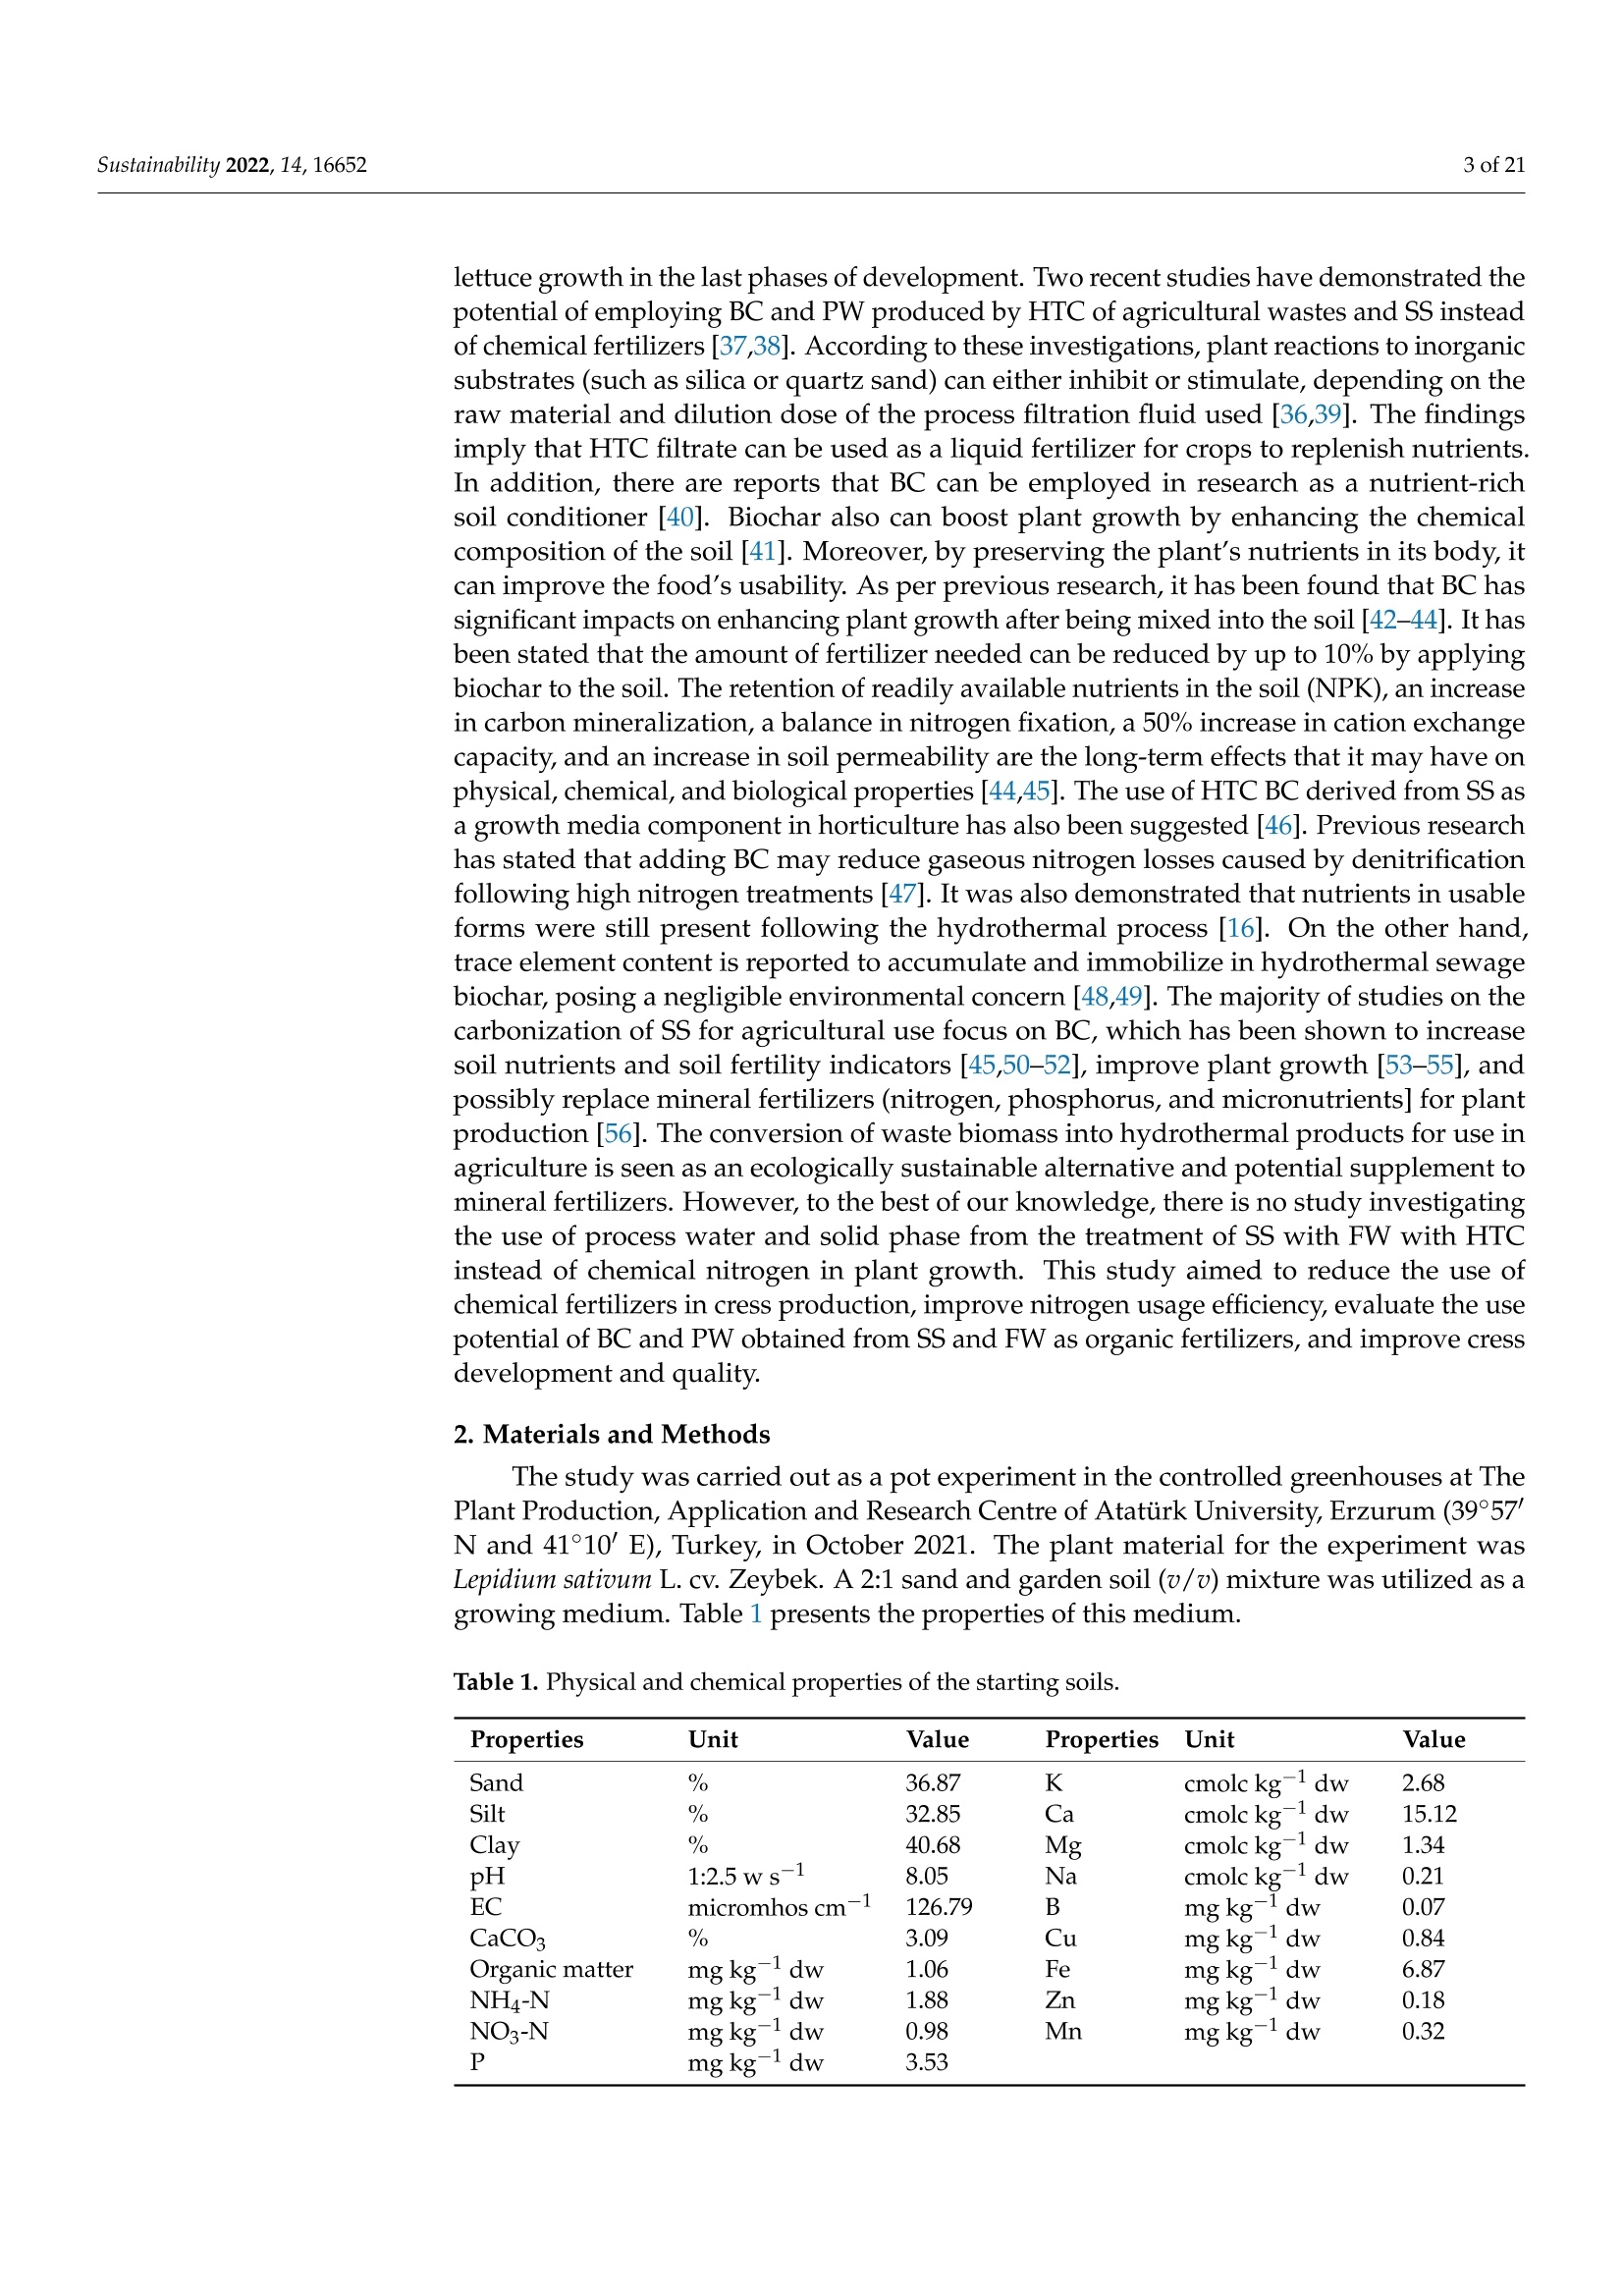
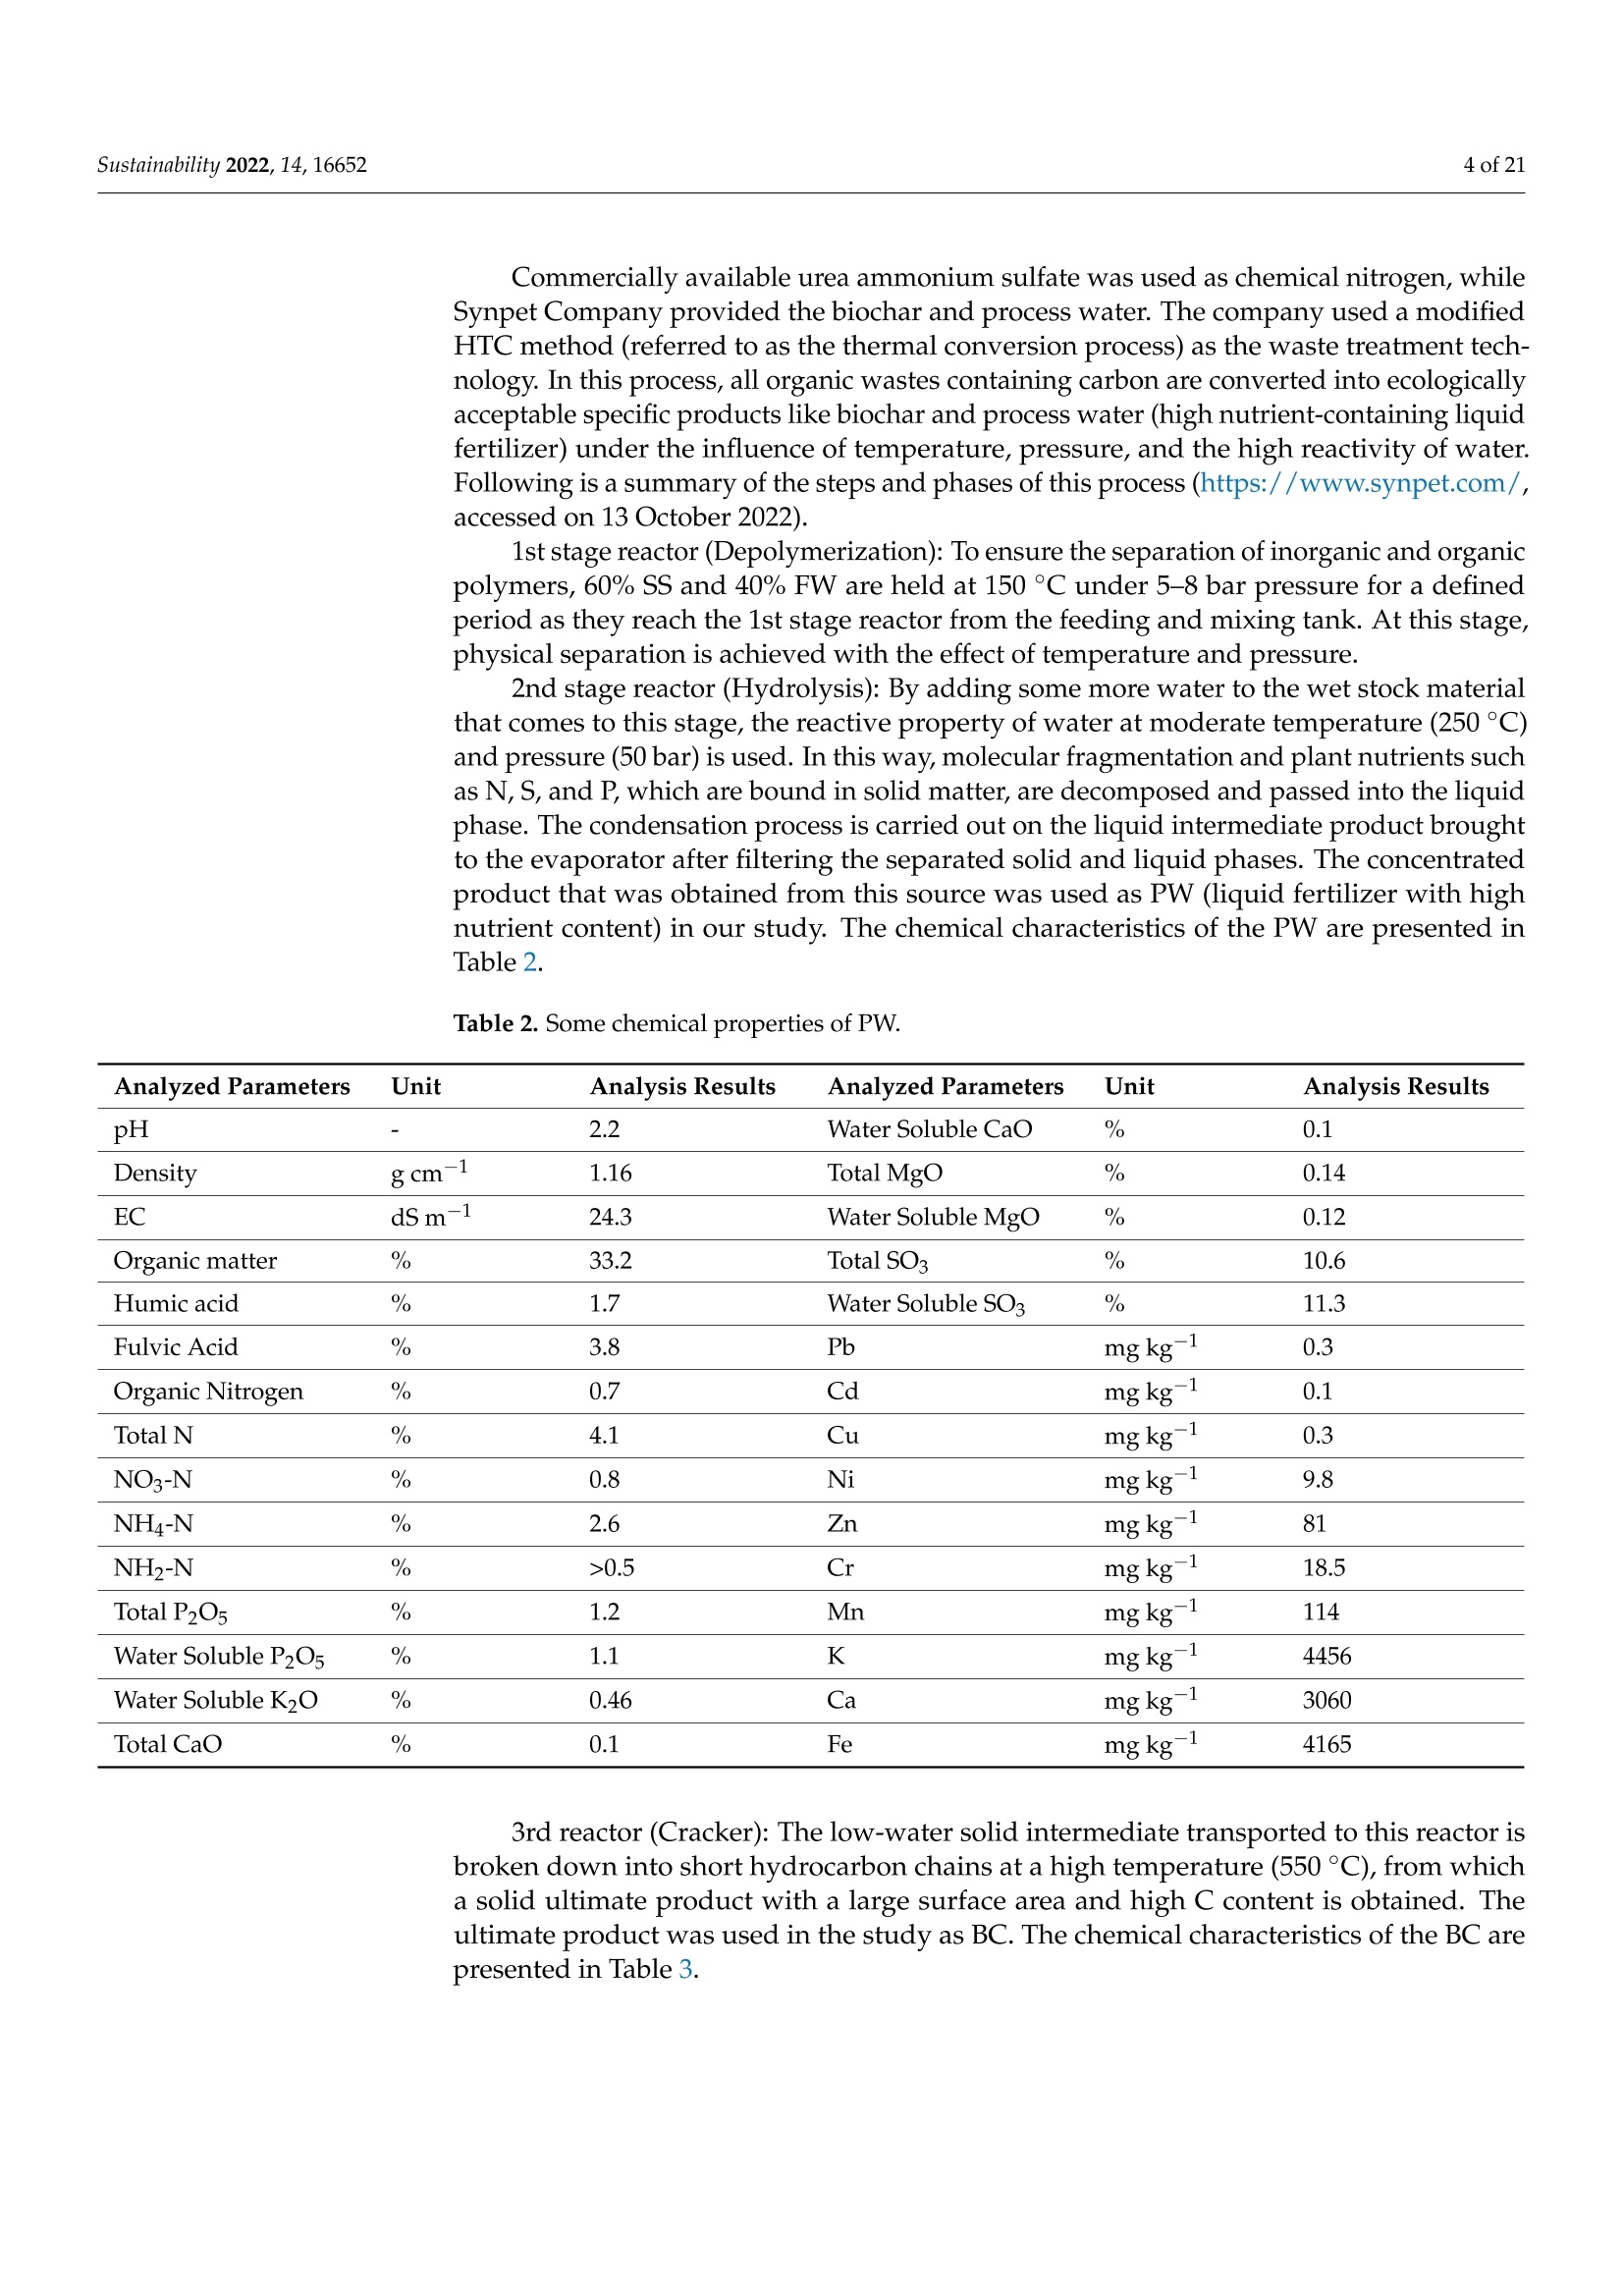
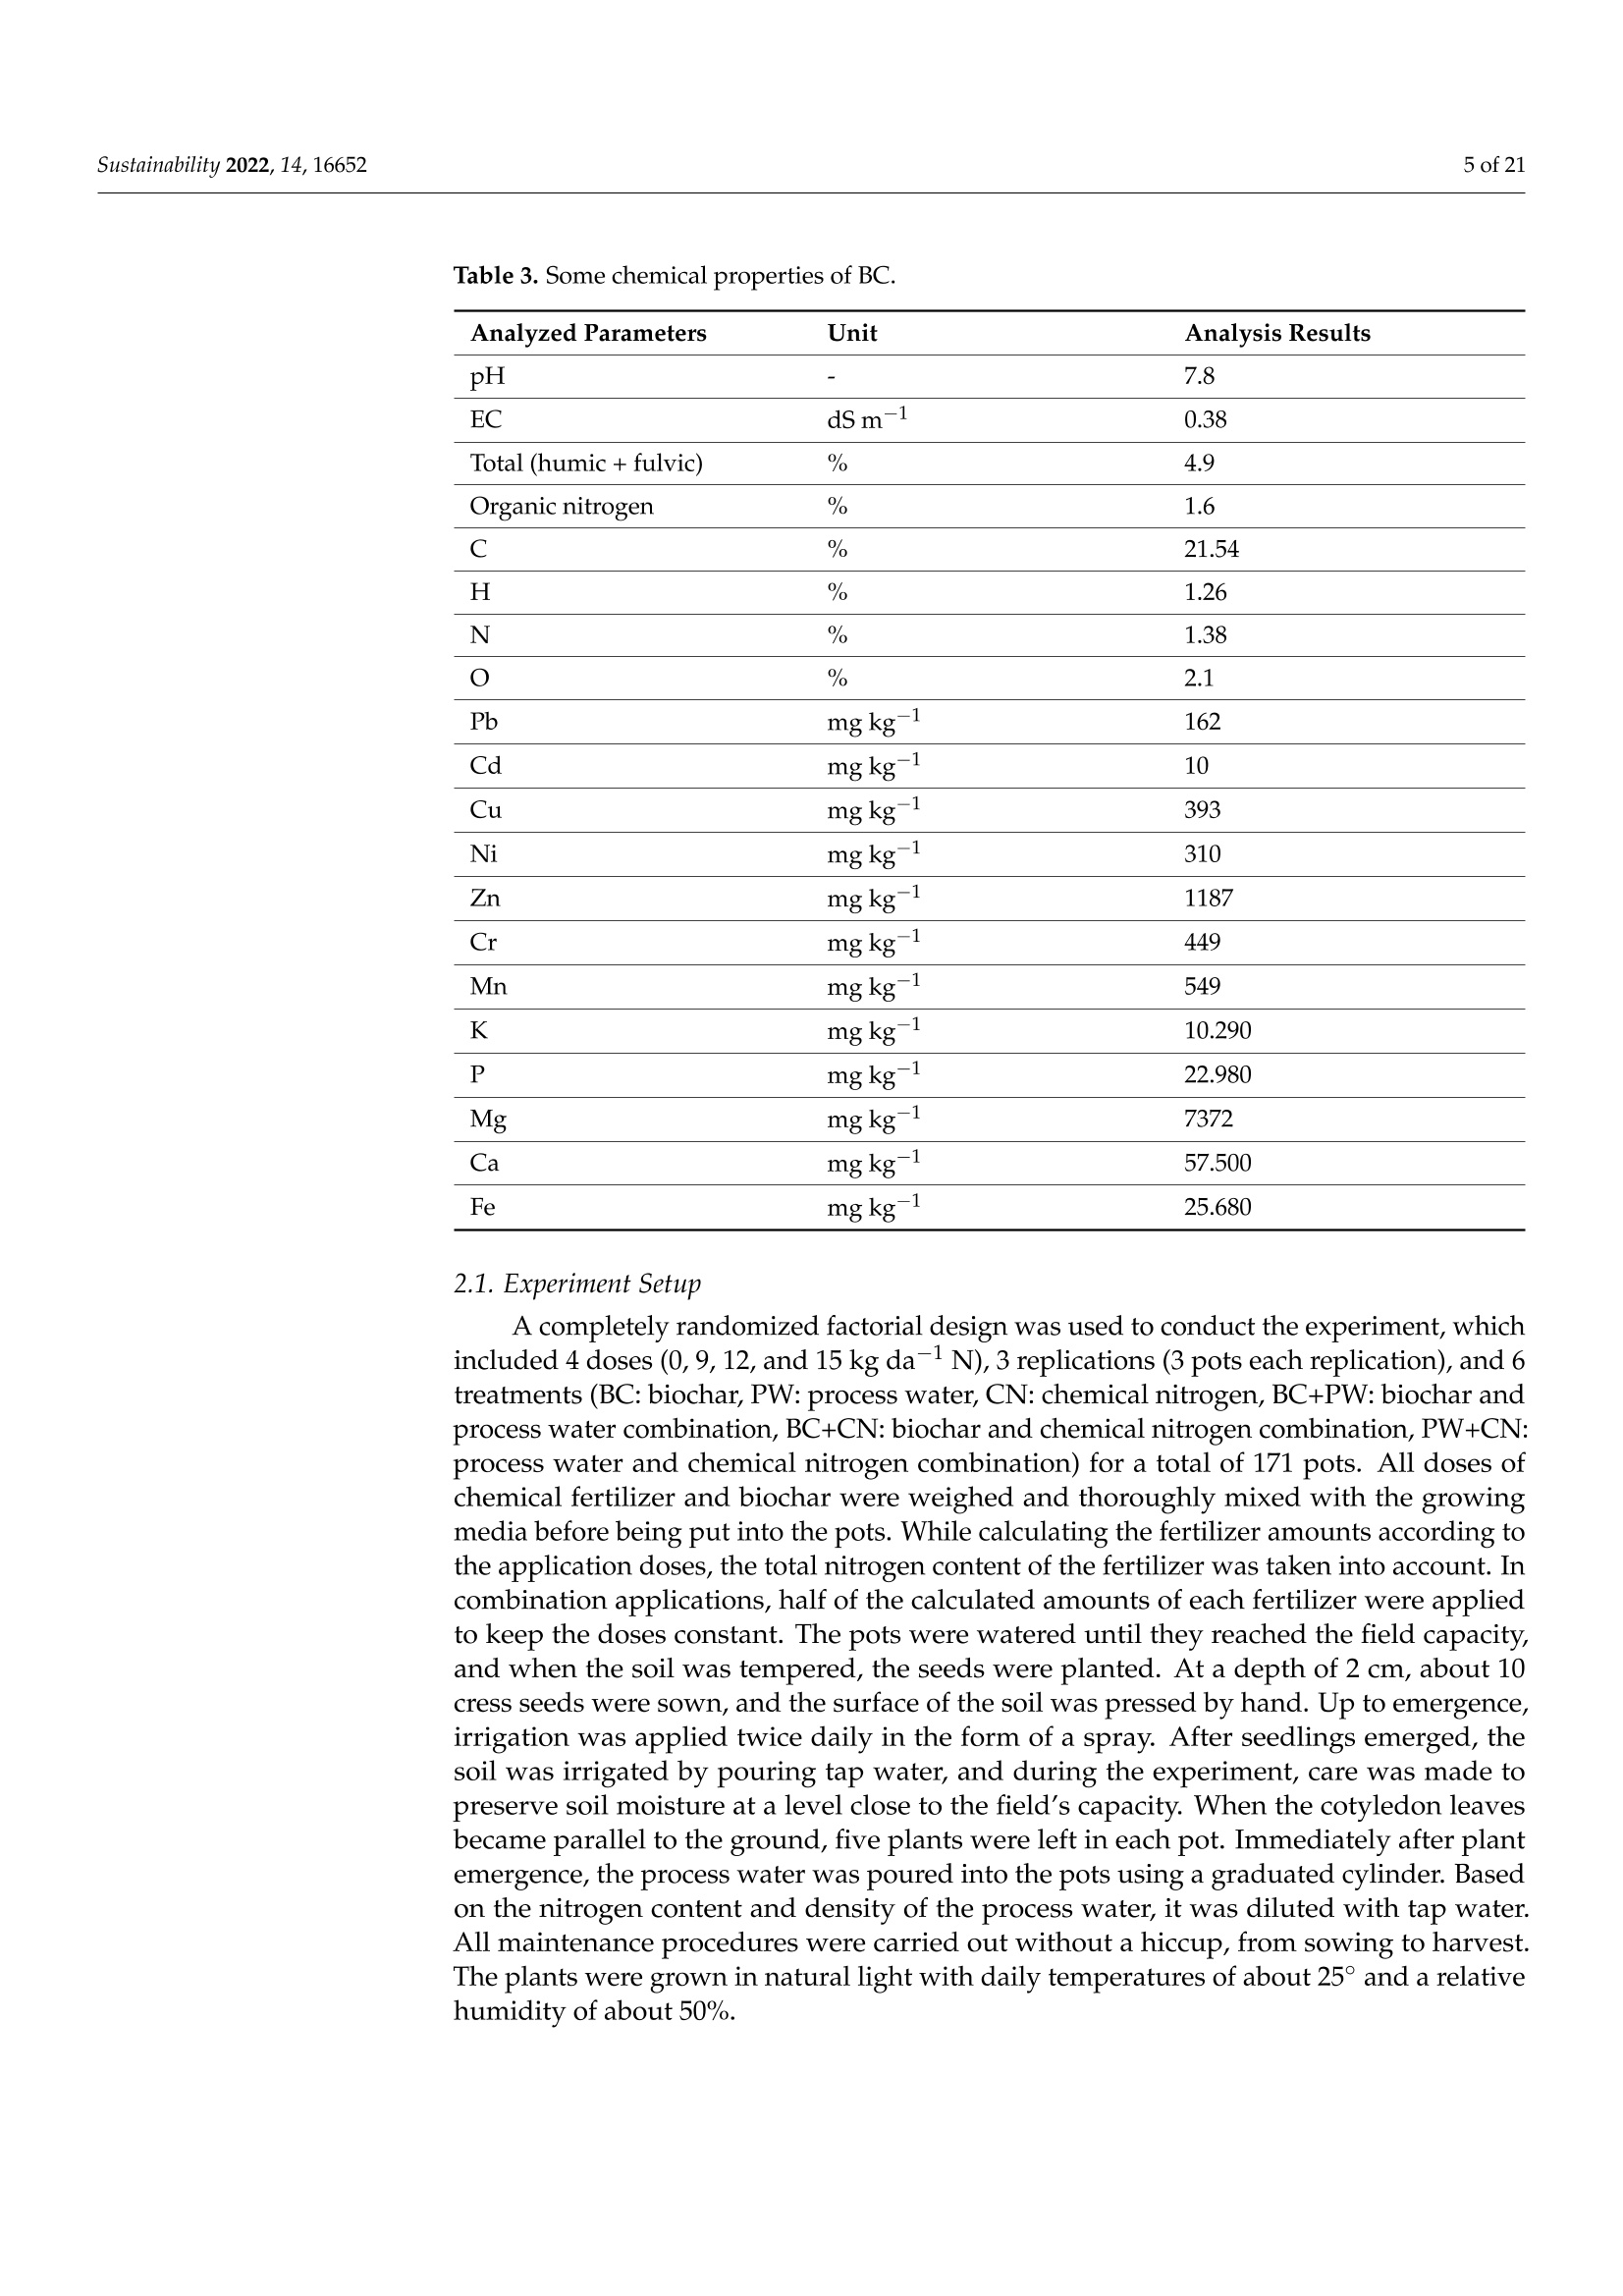
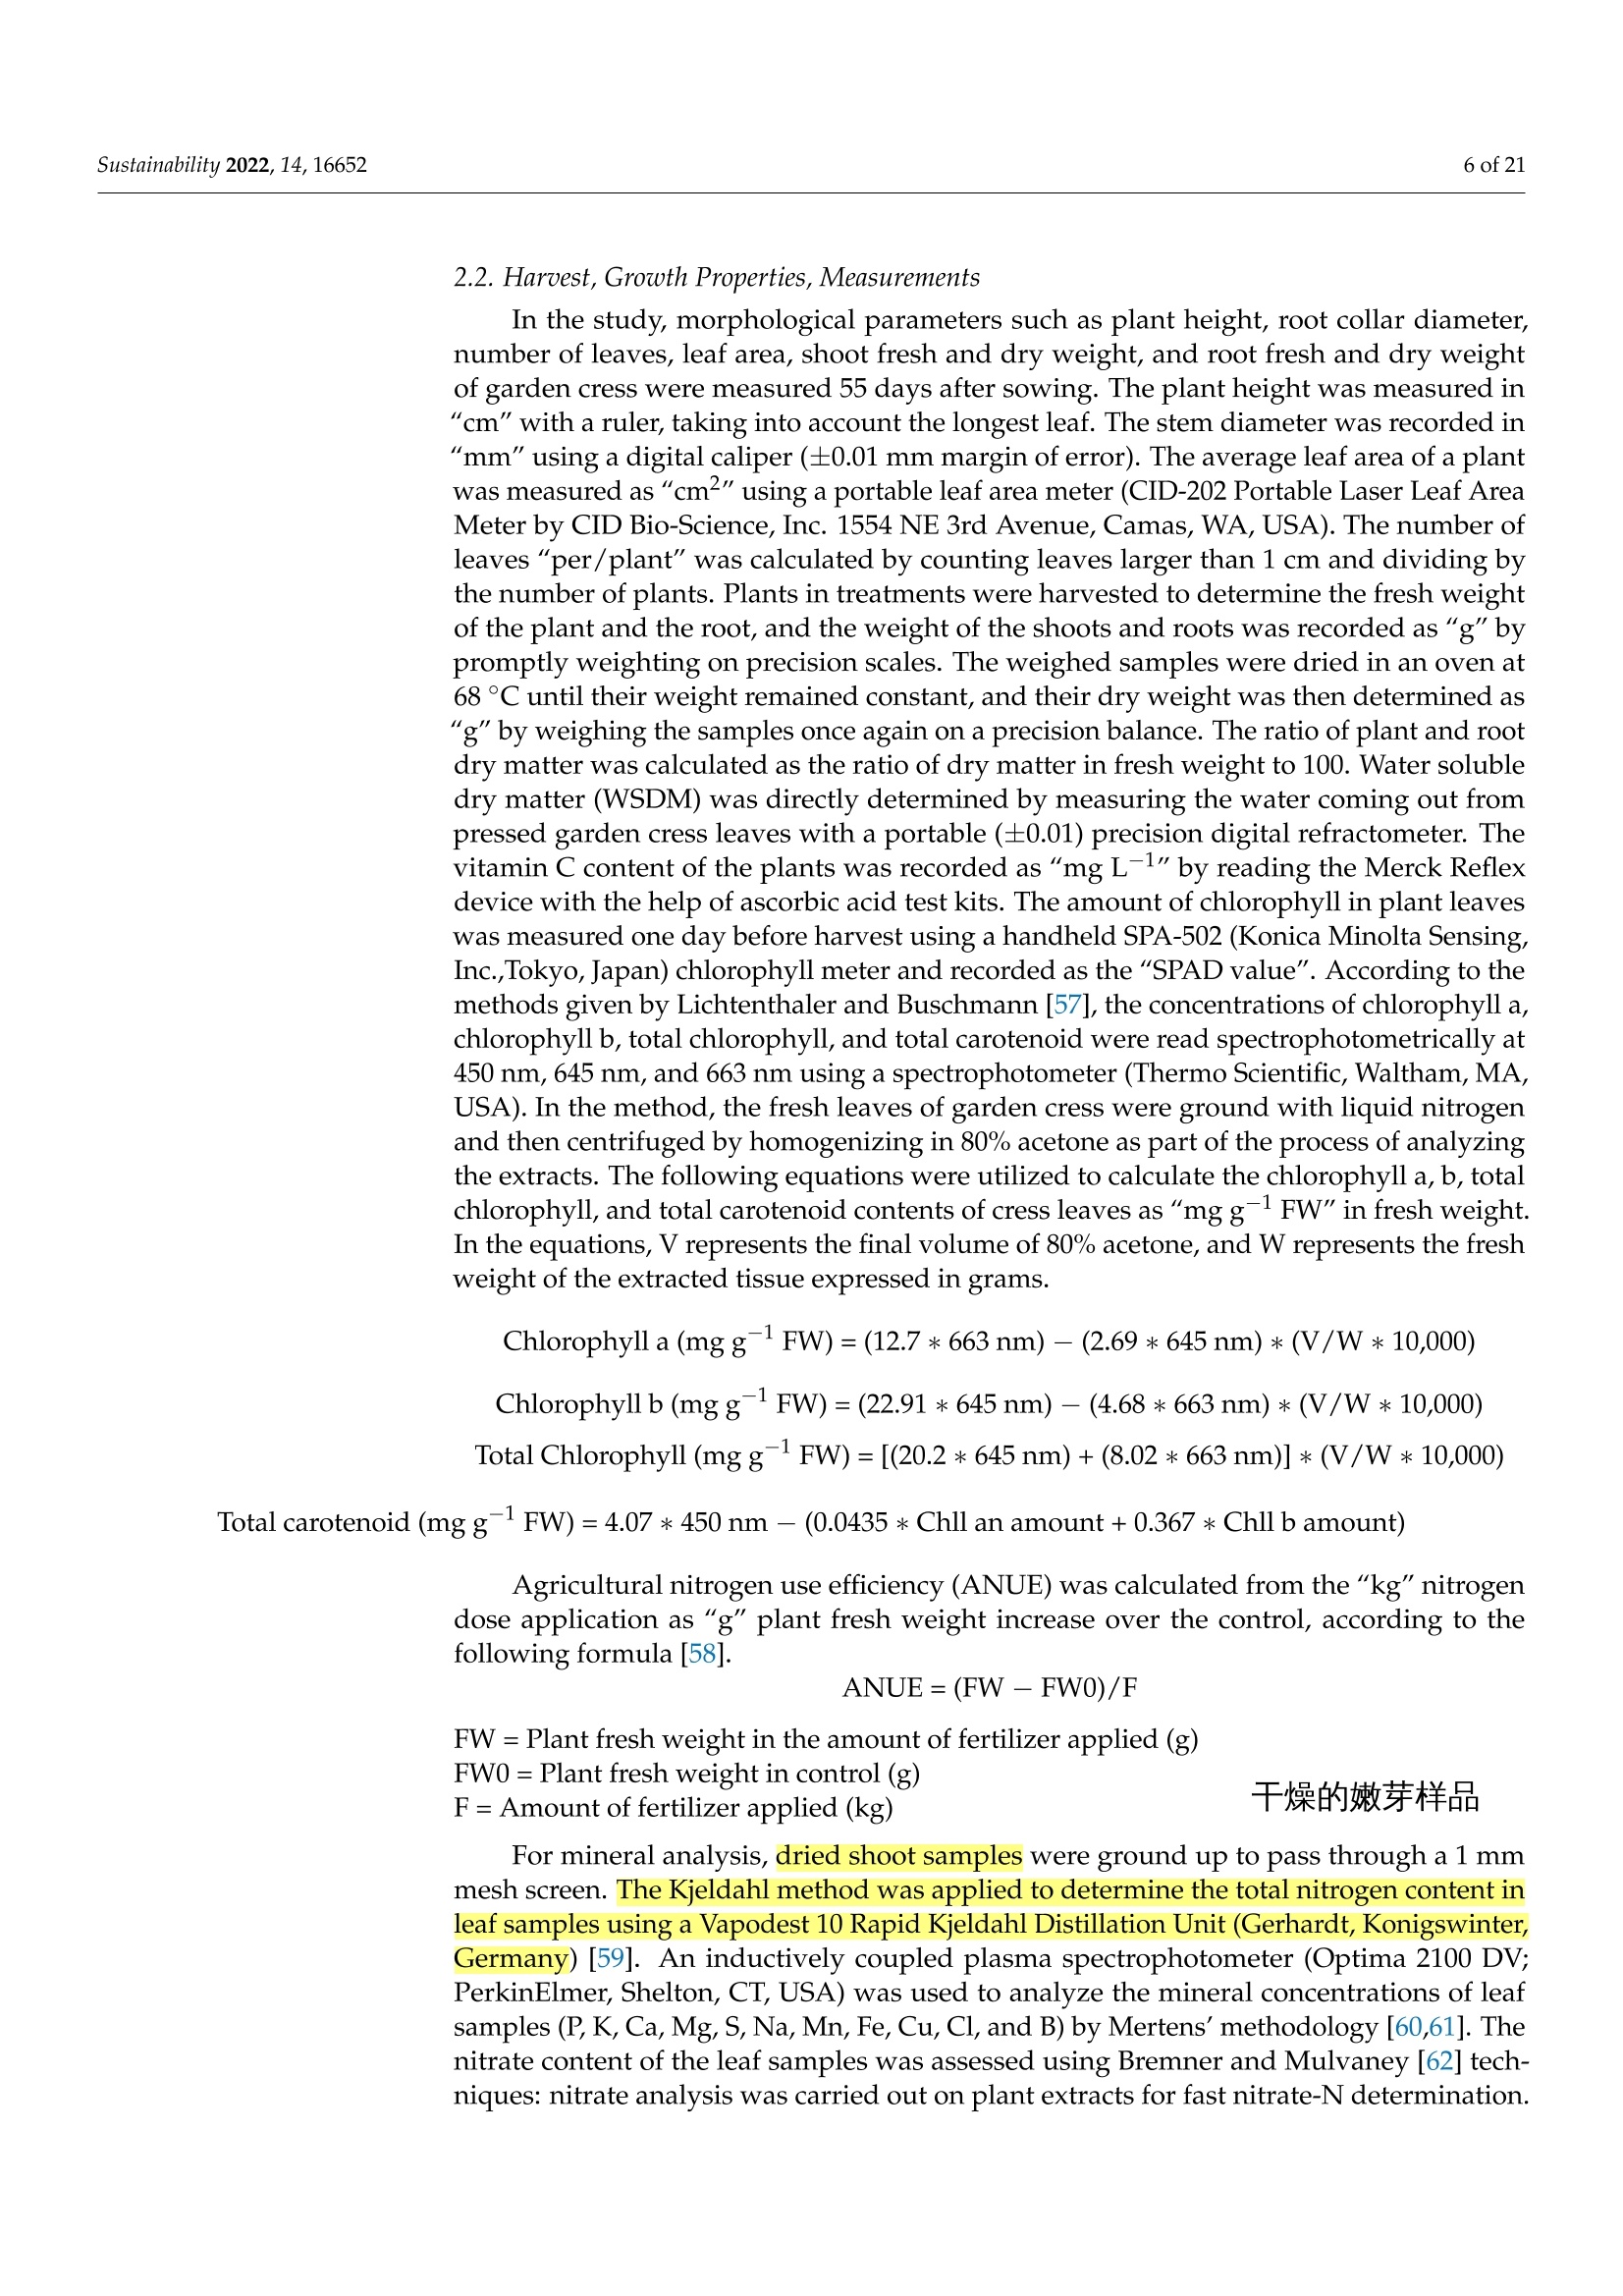
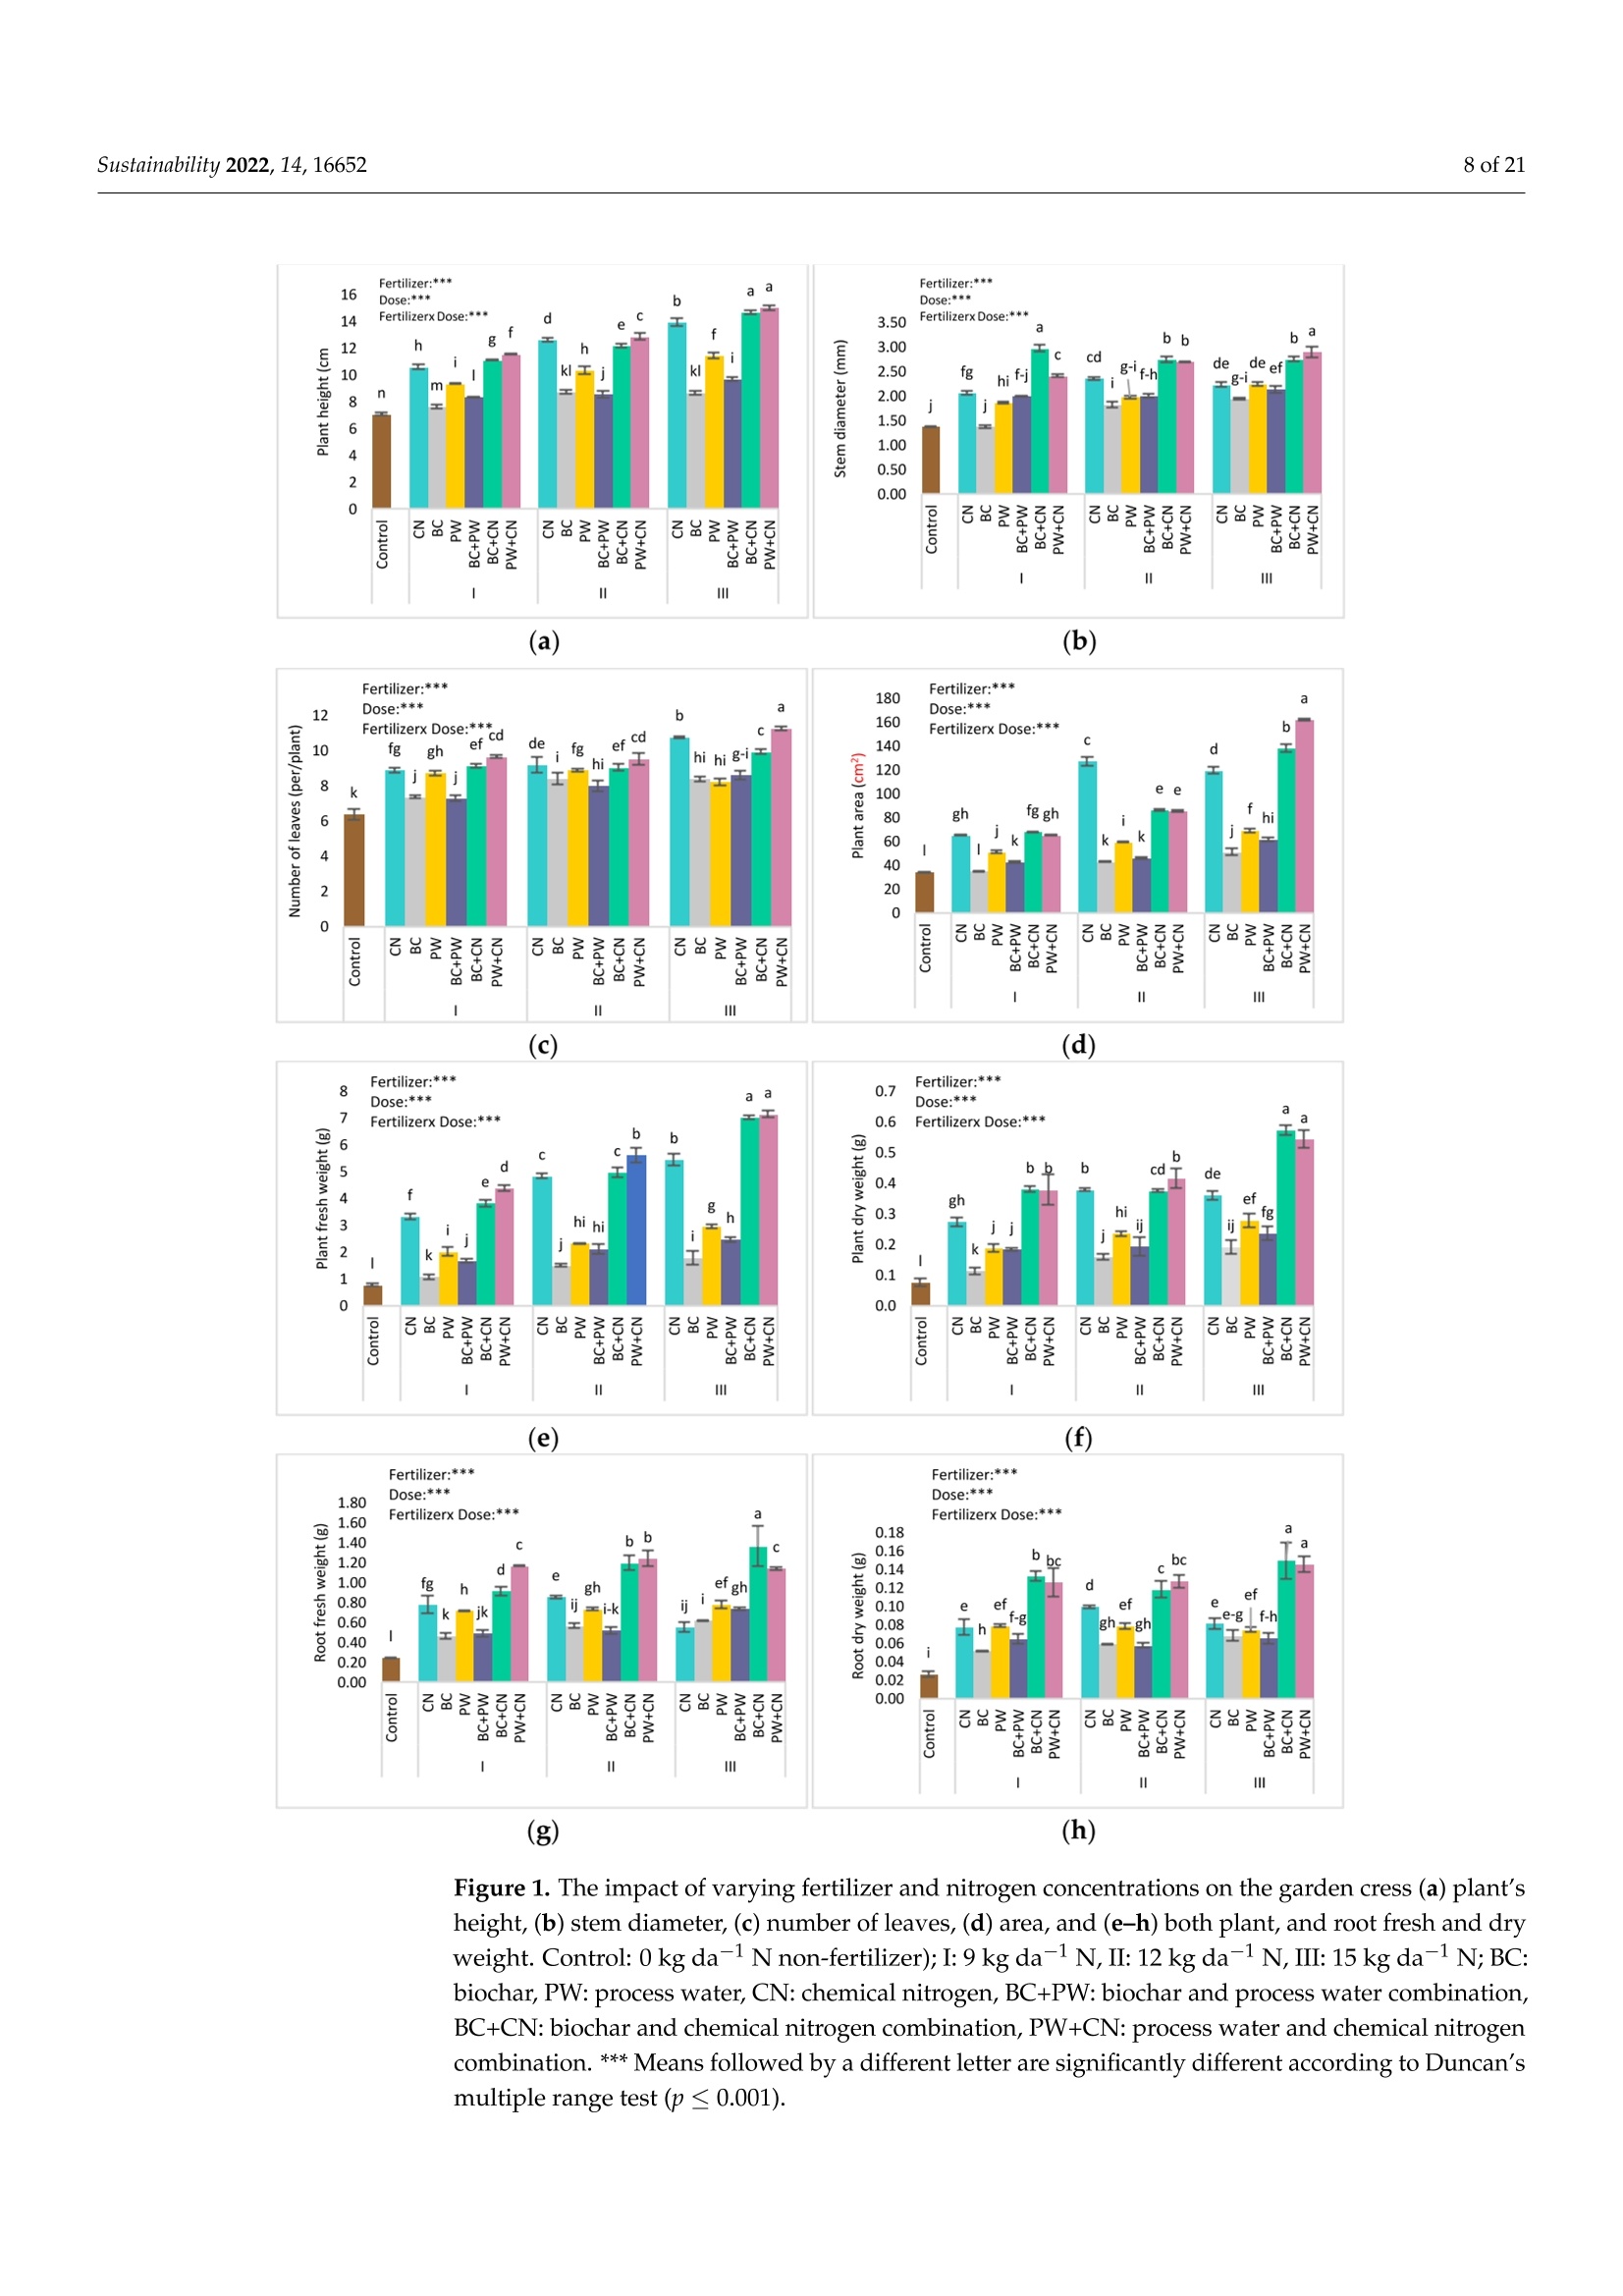
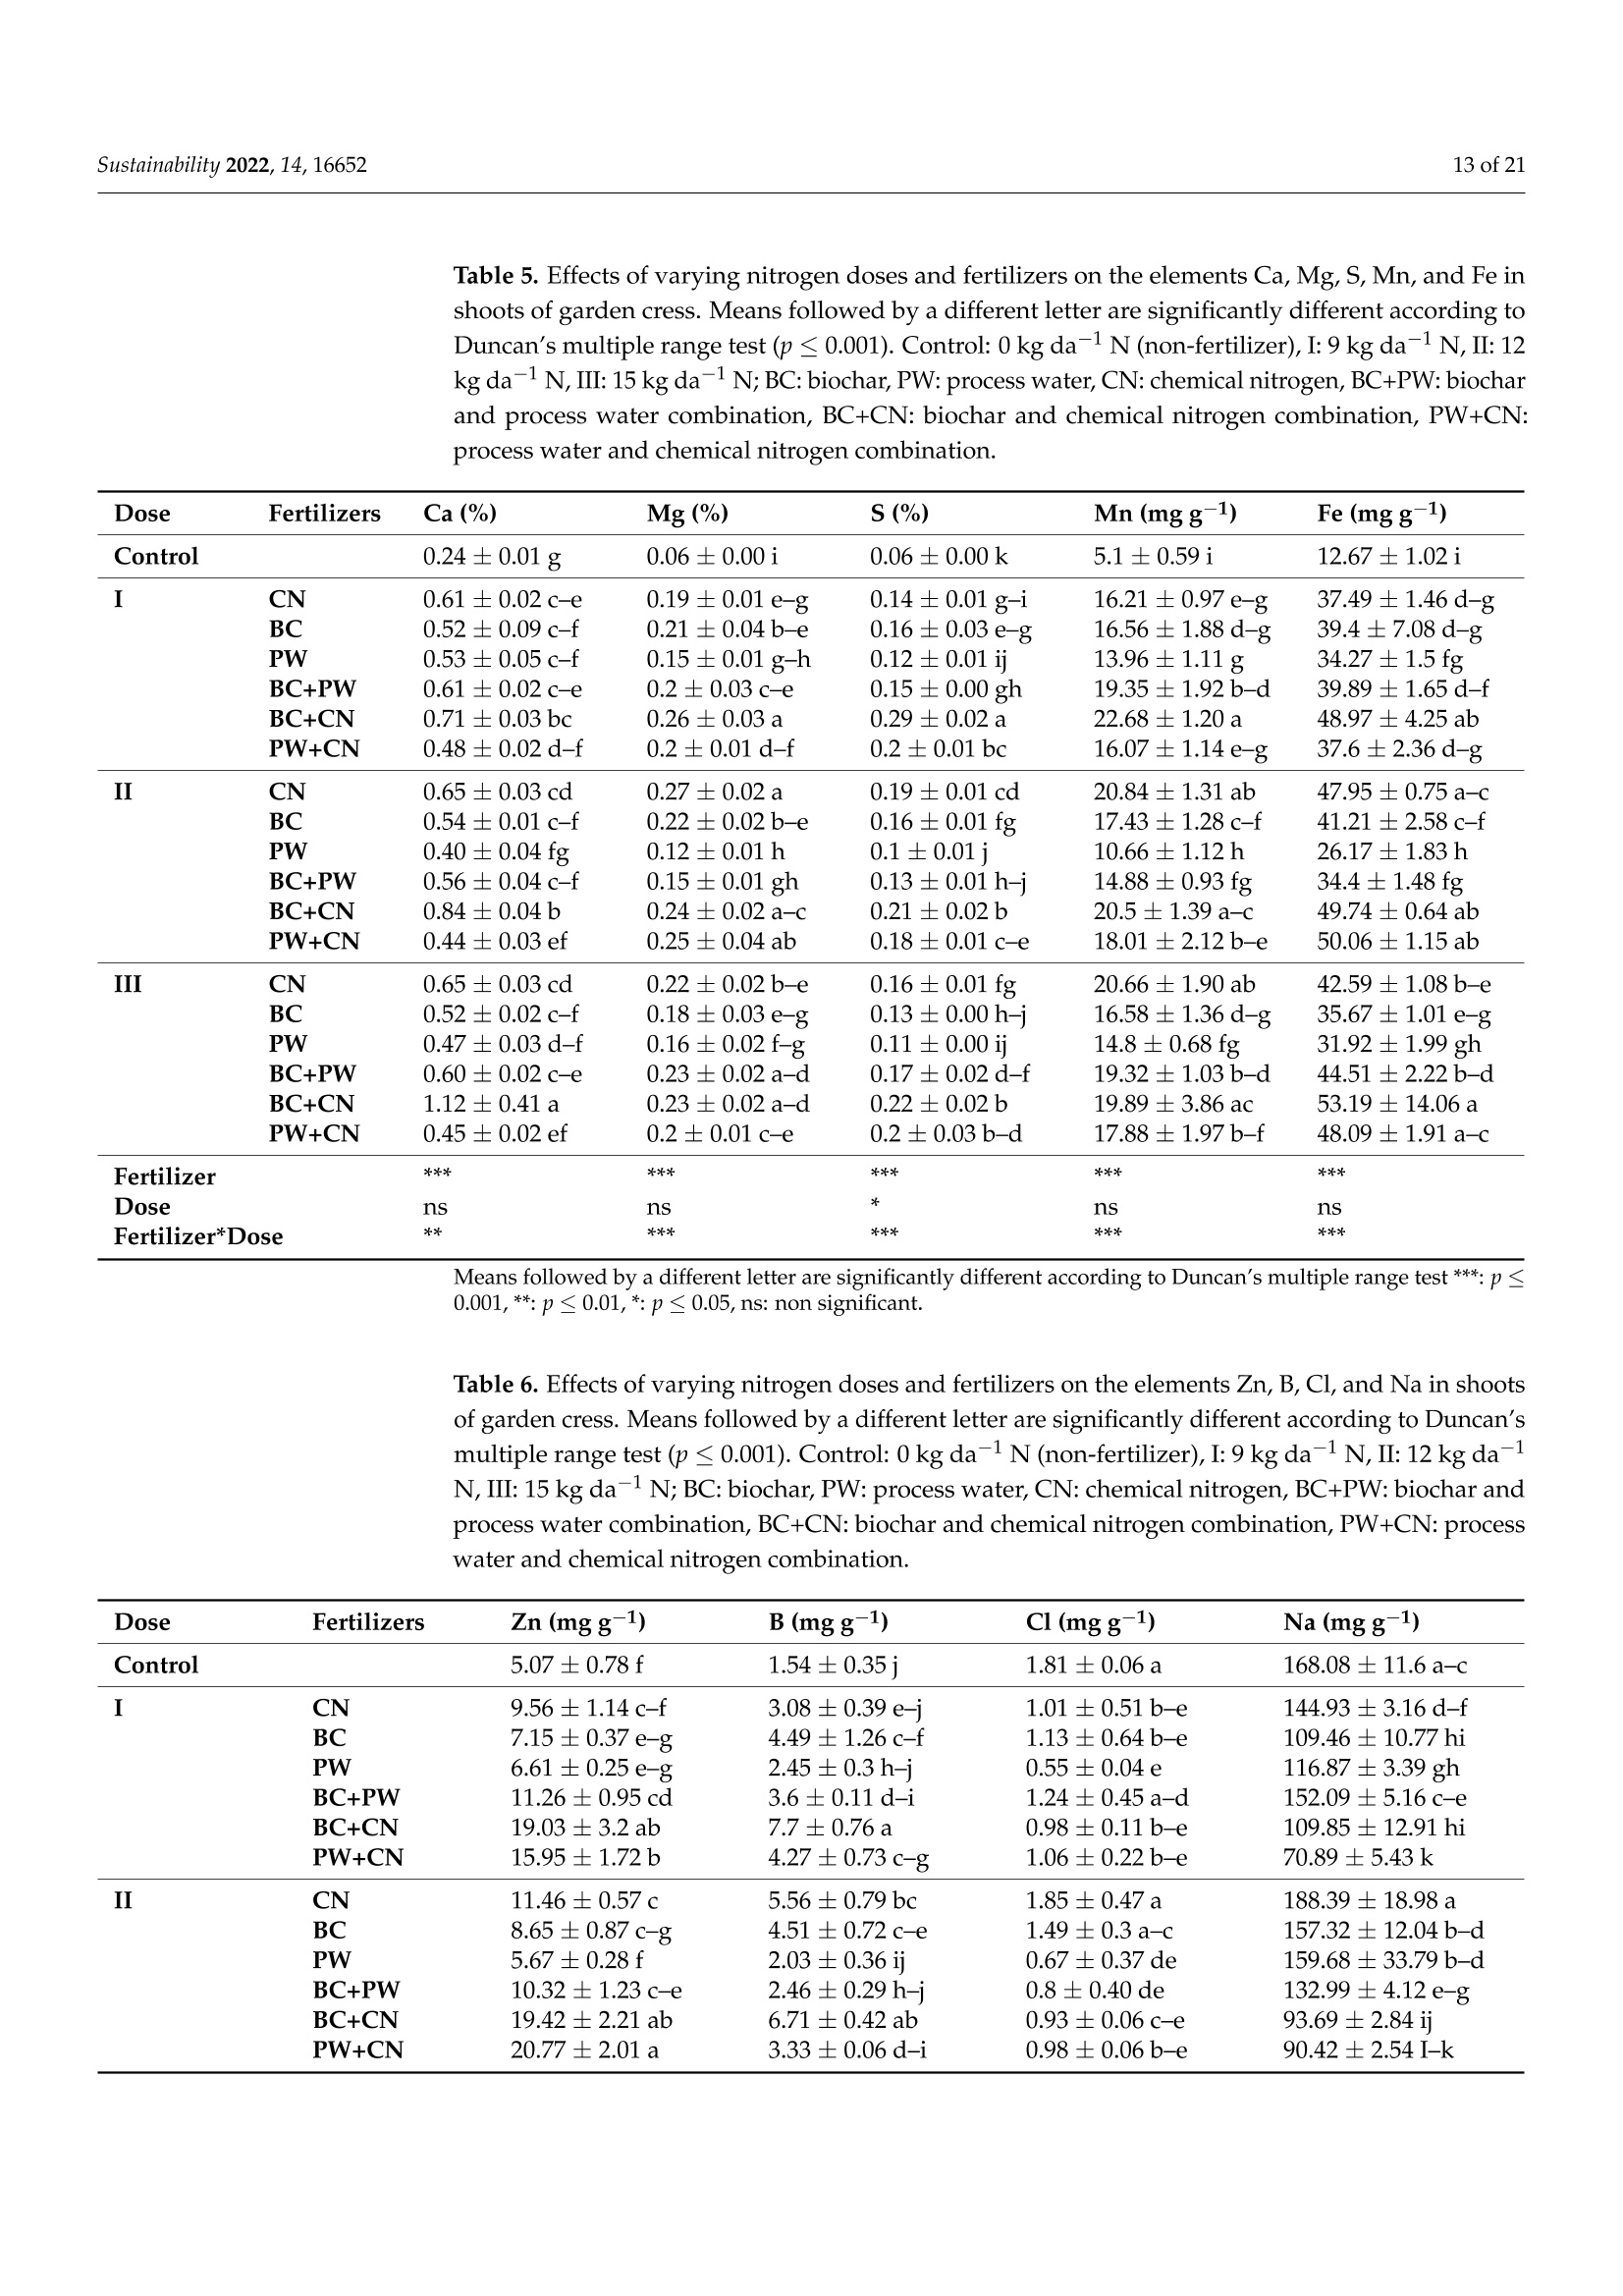
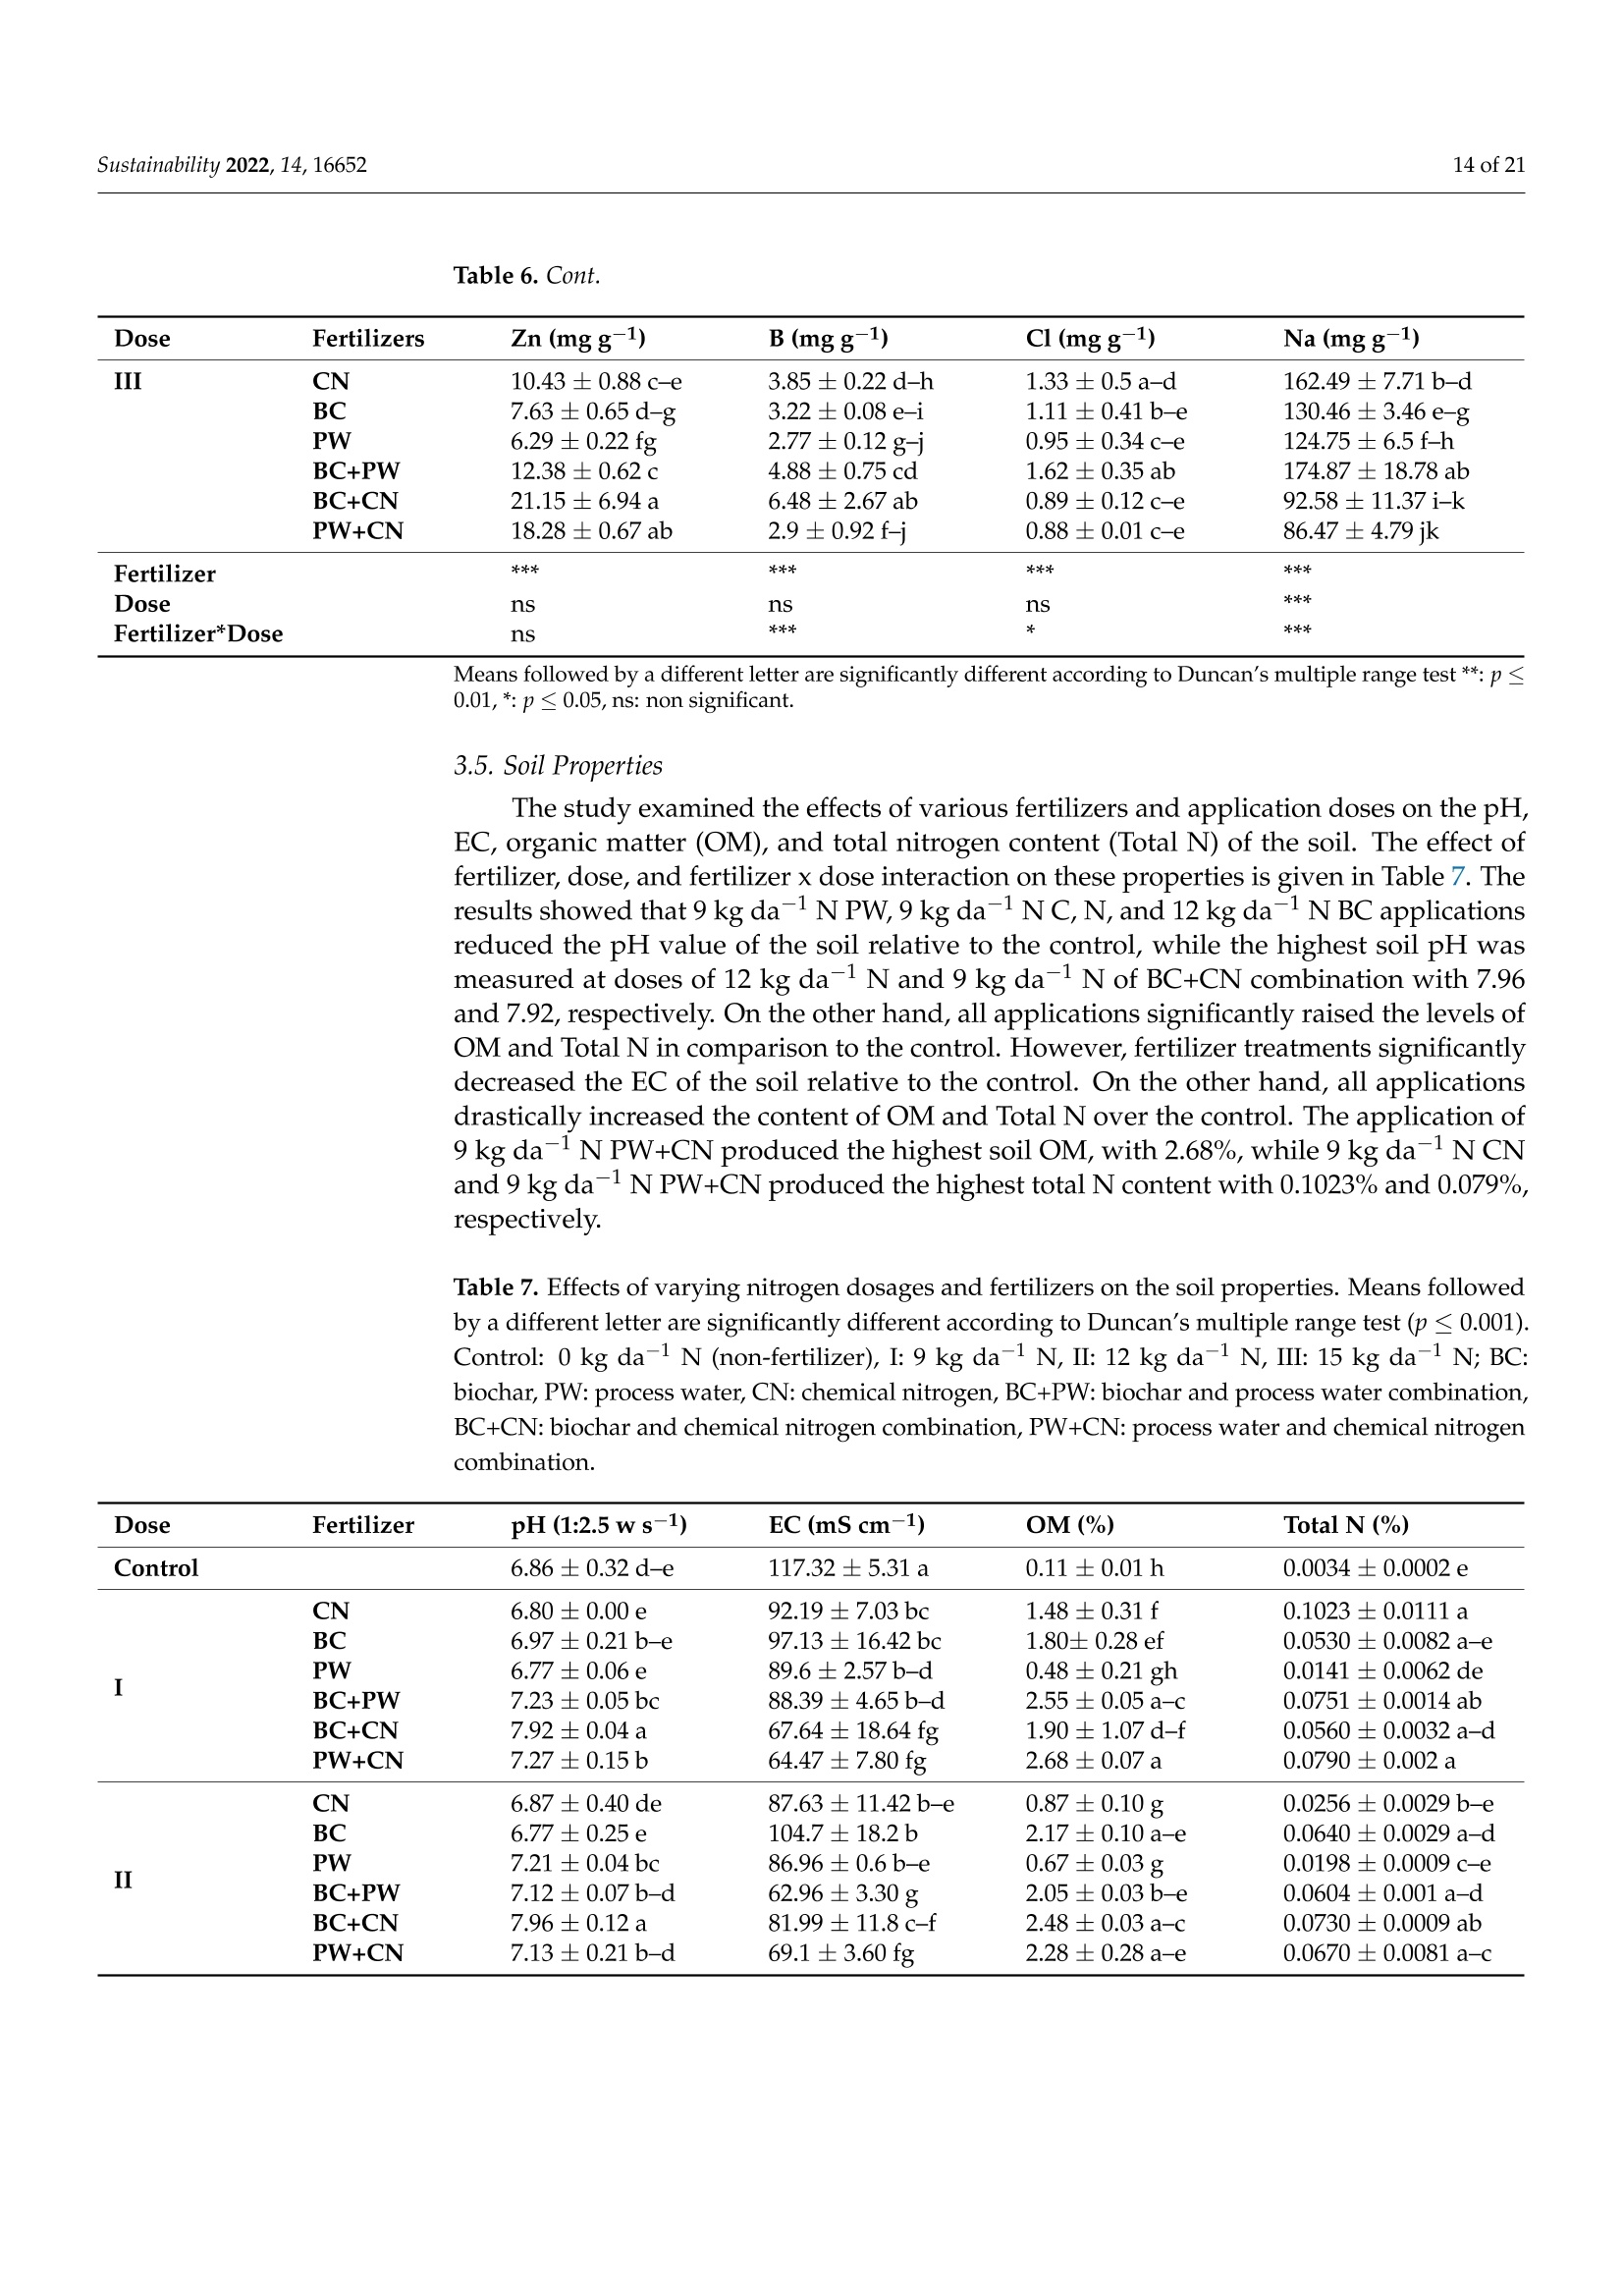
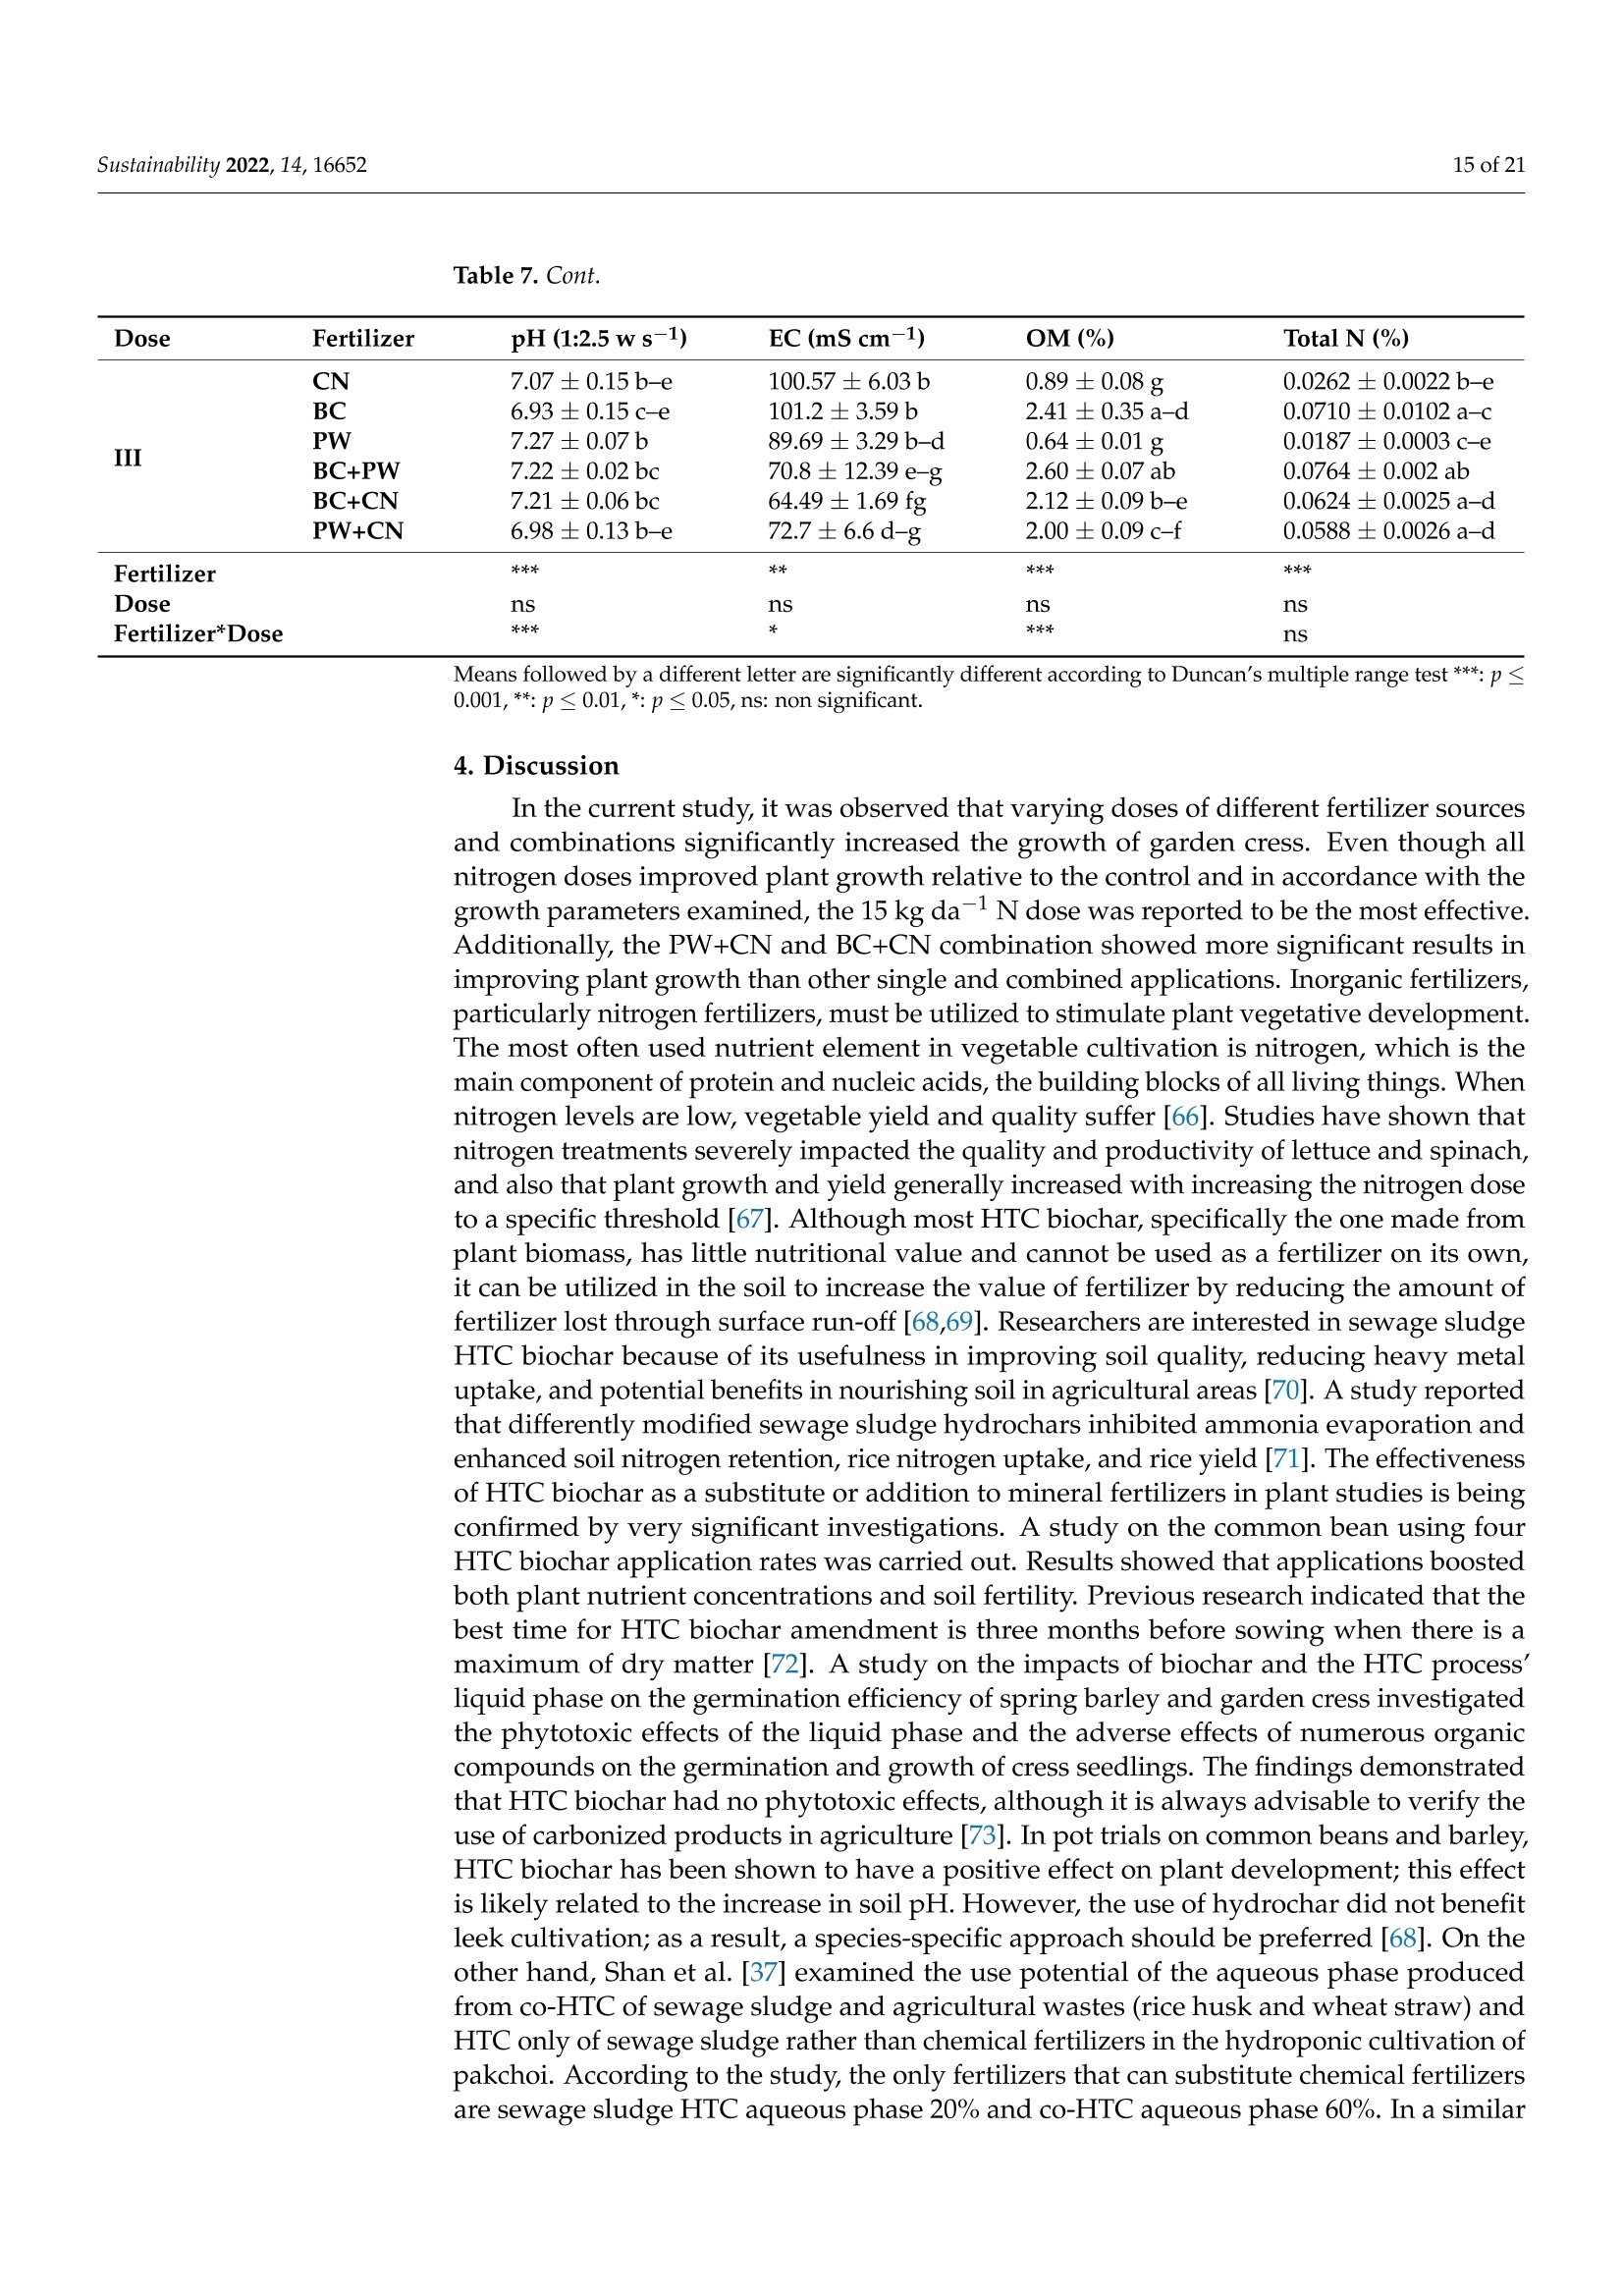
共处理污泥和食品废弃物中生物炭和工艺水对花园水芹(独行菜)生长和质量的影响Effect of Biochar and Process Water Derived from the Co-Processed Sewage Sludge and Food Waste on Garden Cress’ Growth and Qualitysustainability共处理污泥和食品废弃物中生物炭和工艺水对花园水芹(独行菜)生长和质量的影响 2 of 21Sustainability 2022,14,16652 Citation: Kul, R.; Yildirim, E.; Ekinc i ,M.; Turan, M.; Ercisli,S. E f fect of Biochar and Process Water Derived from t he Co-Processed Sewage Sludge and Food Waste on Garden Cress' Growth and Quality.Sustainability 2022,14,16652.https://doi.org/10.3390/ su142416652 Academic Editor: Dario Donno Received: 31 Oc t ober 2022 Accepted: 9 December 2022 Published: 12 December 2022 Publisher's Note: MDPI stays neutral with regard to jurisdic t ional claims i n publi s hed maps and i nstitutional aff i l-iations. Copyright: o 2022 by t he authors.Licensee MDPI, Basel, Switzerland.This article is an open access article distributed under the terms and conditions of the Creat i ve Commons A t t r i bution (CC BY ) l icense (https://c r eativecommons.org/l i censes/by/4.0/) 2Department of Agricultural Trade and Management, Faculty of Economy and Administrat i ve Sc i ences,Yeditepe University, Istanbul 34755, Turkey Correspondence: raziye.kul@atauni.edu.tr Abstract: Very little is known about how products derived from the hydrothermal carbonization (HTC) of municipa l waste affect the availability and uptake of nitrogen in plant nutrition. This study examined the effects of 60% sewage sludge and 40% food waste HTC products, i.e., biochar (BC) and process water (PW), as nitrogen sources on garden cress growth and quality. A f ertil i zation program using four nitrogen doses [(control),9, 12, and 15 kg da-1 N] and BC, PW, chemical nitrogen (CN),and their combinations were used in a pot experiment conducted under greenhouse conditions. The highest nitrogen dose often produced better results in terms of plant growth and quality. Additionally,fertilization with PW+CN and BC+CN at the highest nitrogen dose significantly improved plant height, plant f resh and dry weight, and root dry weight parameters of garden cress over the previous treatments. The highest stem diameter, number of l eaves, and plant area values were obtained in the 15 kg da-1 N dose PW+BC application. The vitamin C content in cress decreased with the increasing levels of CN. The highest vitamin C content was obtained with 15 kg N da -1 PW fertilization. BC+PW and CN fertilization applications improved chlorophyll a, b, and t he total contents of garden cress leaves. Moreover, the nitrate (NO3) concentration of cress increased wi t h CN doses while it decreased in all BC and PW administrations. The 9, 12, and 15 kg N da -1 doses of PW+CN and the 15 kg N da-1 dose of BC+CN yielded the highest agricultural nitrogen utilization efficiency (ANUE) values.Plant nutrient content was positively affected in all fertilization applications, except for Na and Cl. However, i t was determined that BC+CN fertilizer application improved plant nutrient uptake.Surprisingly, PW+CN treatment at t he lowest nitrogen dosage resulted i n the highest soi l organic matter and total nitrogen content. In conclusion, it has been determined that biochar and process water have a synergistic effect with CN to increase plant growth by improving nitrogen ef f iciency,but their application alone without CN is insufficient to meet the nitrogen requirement. Keywords: biochar; process water; nitrogen; synergic effect; Lepidium satioum L.; nitrogen use efficiency; plant growth; quality 1. Introduction Garden cress (Lepidium satioum L.), an annual herb of the Brassicaceae family, is rich in health-promoting phytochemical components. Additionally, cress has l ately emerged as a new leafy vegetable for fresh produce due to demand f rom consumers, growers,and processors [1]. Its leaves are rich in calcium, magnesium, phosphorus, potassium, copper,and manganese. I t is an excel l ent source of f iber, flavonoids, selenium, s-methyl cysteine,sulfoxide, and glucosinolate [2,3]. In addition to the vi t amins, minerals, and several anti-carcinogenic components, i ts seeds and green parts have been used as a remedy for asthma,cough, skin disorders, and other maladies since ancient t imes [4,5]. It has the advantage of reducing constipation due to i ts high magnesium and calcium content while its higher iodine level helps to strengthen bones [3]. It is well known that nitrogen is one of the most crucial nutrients for plant growth and yield. However, crops can only absorb about 30-40% of the nitrogenous f ertilizer used,resulting in l ow utilization efficiency and nitrogen losses t hat harm t he environment [6,7].In comparison to cereal production, the greenhouse vegetable system always employs more intensive crop rotations, more frequent watering, and significantly higher nutrient input [8]. Even though the nitrogen use efficiency of intensive vegetable soi l was very poor,annual nitrogen fertilizer inputs in the greenhouse vegetable system were 3-4 t imes higher than those in the non-vegetable system [9]. Therefore, developing effective strategies to reduce nitrogen losses in vegetable cultivation and increase nitrogen utilization efficiency is imperative. Thermochemical technology is currently the most remarkable method among the existing waste conversion technologies for digesting waste biomass [21]. Of these technolo-gies, hydrothermal carbonization (HTC) is considered an effective method for converting organic waste i nto useful products [22]. HTC i s a thermochemical procedure that i mproves the properties of raw biomass for future usage, in subcritical water under a moderate temperature (ranging from 180-360°C) and 2-20 MPa pressure [23,24]. Due to the elimina-tion of the pre-dehydration phase, HTC has recent l y become an extensively used method for SS processing [25]. In this technique, water acts as a catalyst for t he degradation and nversion of biomass. This allows t he biomass to be processed in an aqueous f orm without the need for drying. Additionally, products processed under high pressure and tempera-tures are sterilized, eliminat i ng pathogens [26-28]. Through the HTC process, biomass i s transformed into carbonaceous biochar (also known as hydrochar), gas (mostly CO2),and process water rich in organic and inorganic compounds [29]. Process water (PW) accounts for about 90% of HTC products [30]. Biochar (BC) can increase soil fertility by providing and/or retaining nutrients for crop production [31-33]. However, little study on the usage of PW has been conducted. Only a few studies examining the possibility of using PW as a fertilizer have evaluated t he impact on plant growth by mixing the l iquid fraction with BC or other organic substrates [34,35].Mau et al. [36] revealed t hat HTC process water f rom poultry litter can effec t ively improve 2. Materials and Methods The study was carried out as a pot experiment in t he controlled greenhouses at The Plant Production, Application and Research Centre of Atatiirk University, Erzurum (39°57'N and 41°10' E), Turkey, in October 2021. The plant material for the experiment was Lepidium sativum L. cv. Zeybek. A 2:1 sand and garden soi l (v/u) mixture was utilized as a growing medium. Table 1 presents the properties of t his medium. Table 1. Physica l and chemical properties of the starting soi l s. Properties Unit Value Properties Unit Value Sand % 36.87 K cmolc kg-1dw 2.68 Silt % 32.85 Ca cmolc kg-1dw 15.12 Clay % 40.68 Mg cmolc kg-1 dw 1.34 pH 1:2.5ws-1 8.05 Na cmolc kg-dw 0.21 EC micromhos cm-1 126.79 B mgkgdw 0.07 CaCO3 % 3.09 Cu mgkg-1 dw 0.84 Organic matter mg kg-1 dw 1.06 Fe mgkg-1 dw 6.87 NH4-N mg kg -1 dw 1.88 Zn mgkg-1 dw 0.18 NO3-N mgkg g-1dw 0.98 Mn mg kg-1 dw 0.32 P mg kg g-1dw 3.53 Commercially available urea ammonium sulfate was used as chemical nitrogen, while Synpet Company provided the biochar and process water. The company used a modified HTC method (referred to as the thermal conversion process) as the waste treatment t ech-nology. In this process, all organic wastes containing carbon are converted i nto ecologically acceptable specific products like biochar and process water (high nutrient-containing liquid fertilizer) under the influence of temperature, pressure, and the high reactivity of water.Following is a summary of the steps and phases of t his process (h ttps://www.synpet.com/,accessed on 13 October 2022). 1st stage reactor (Depolymerization): To ensure the separation of inorganic and organic polymers, 60% SS and 40% FW are held at 150°C under 5-8 bar pressure for a defined period as they reach the 1st stage reactor from the feeding and mixing tank. At this stage,physical separation is achieved with the effect of temperature and pressure. 2nd stage reactor (Hydrolysis): By adding some more water to the wet stock material that comes to this stage, the reactive property of water a t moderate temperature (250°C)and pressure (50 bar) is used. I n t his way, molecular f ragmentation and plant nutrients such as N,S, and P, which are bound in solid matter, are decomposed and passed into the liquid phase. The condensation process i s carried out on the liquid i ntermediate product brought to the evaporator after f iltering the separated solid and liquid phases. The concentrated product that was obtained from this source was used as PW (liquid fertilizer with high nutrient content) in our study. The chemical characteristics of the PW are presented in Table 2. Table 2. Some chemical properties of PW. Analyzed Parameters Unit Analysis Results Analyzed Parameters Unit Analysis Results PH 一 2.2 Water Soluble CaO % 0.1 Density gcm -1 1.16 Total MgO % 0.14 EC dS m-1 24.3 Water Soluble Mgo % 0.12 Organic matter % 33.2 Total SO3 % 10.6 Humic acid % 1.7 Water Soluble SO3 % 11.3 Fulvic Acid % 3.8 Pb mgkg-1 0.3 Organic Nitrogen % 0.7 Cd mgkg-1 0.1 Total N % 4.1 Cu mgkg-1 0.3 NO3-N % 0.8 Ni mgkg-1 9.8 NH4-N % 2.6 Zn mgkg-1 81 NH2-N % >0.5 Cr mgkg-1 18.5 Total P2Os % 1.2 Mn mgkg-1 114 Water Soluble P2O5 % 1.1 K -1mgkg 4456 Water Soluble K2O % 0.46 Ca mgkg一-1 3060 Total CaO % 0.1 Fe mgkg一1 4165 3rd reactor (Cracker): The low-water solid intermediate transported to this reactor is broken down into short hydrocarbon chains at a high temperature (550°C), from which a solid ultimate product with a large surface area and high C content is obtained. The ultimate product was used in the study as BC. The chemical characteristics of the BC are presented in Table 3. Table 3. Some chemical properties of BC. Analyzed Parameters Unit Analysis Results pH 一 7.8 EC dS m-1 0.38 Total (humic +fulvic) % 4.9 Organic nitrogen % 1.6 C % 21.54 H % 1.26 N % 1.38 % 2.1 Pb mg kg-1 162 Cd mgkg-1 10 Cu mg kg 393 Ni mgkg1 310 Zn ng kg-1 1187 Cr mgkg-1 449 Mn mg kg-1 549 K mgkg一1 10.290 P mgkg-1 22.980 Mg mgkg厂1 7372 Ca mgkg-1 57.500 Fe mgkg一1 25.680 2.1. Experiment Setup A completely randomized factorial design was used to conduct the experiment, which included 4 doses (0, 9, 12, and 15 kg da-1N), 3 replications (3 pots each replication), and 6treatments (BC: biochar, PW: process water, CN: chemical nitrogen, BC+PW: biochar and process water combination,BC+CN: biochar and chemical ni t rogen combination, PW+CN:process water and chemical nitrogen combination) for a total of 171 pots. All doses of chemical fertilizer and biochar were weighed and thoroughly mixed with the growing media before being put into the pots. While calculating the fertilizer amounts according to the application doses, the total nitrogen content of the fertilizer was taken into account. In combination applications, half of the calculated amounts of each fertilizer were applied to keep the doses constant. The pots were watered until they reached the field capacity,and when the soil was tempered, the seeds were planted. At a depth of 2 cm, about 10cress seeds were sown, and t he surface of the soil was pressed by hand. Up t o emergence,irrigation was applied twice daily in the form of a spray. After seedlings emerged, the soil was irrigated by pouring tap water, and during t he experiment, care was made to preserve soil moisture at a level close to t he f ield's capacity. When the cotyledon leaves became parallel to the ground, five plants were left i n each pot. Immediately after plant emergence, the process water was poured into t he pots using a graduated cylinder. Based on the nitrogen content and density of t he process water, it was diluted with tap water.All maintenance procedures were carried out without a hiccup, f rom sowing to harvest.The plants were grown in natural light with daily temperatures of about 25° and a relative humidity of about 50%. 2.2. Harvest, Growth Properties, Measurements In the study, morphological parameters such as plant height, root collar diameter,number of leaves, leaf area, shoot fresh and dry weight, and root fresh and dry weight of garden cress were measured 55 days after sowing. The plant height was measured in "cm"with a ruler, taking into account the longest leaf. The stem diameter was recorded i n "mm" using a digital caliper (±0.01 mm margin of error). The average leaf area of a plant was measured as "cm²" using a portable l eaf area meter (CID-202 Portable Laser Leaf Area Meter by CID Bio-Science, Inc. 1554 NE 3rd Avenue, Camas, WA, USA). The number of leaves "per/plant" was calculated by counting leaves larger than 1 cm and dividing by the number of plants. Plants in treatments were harvested to determine t he fresh weight of the plant and t he root, and the weight of the shoots and roots was recorded as "g"by promptly weighting on precision scales. The weighed samples were dried i n an oven at 68 °C until their weight remained constant, and their dry weight was then determined as “g"by weighing the samples once again on a precision balance. The ratio of plant and root dry matter was calculated as t he ratio of dry matter in fresh weight to 100. Water soluble dry matter (WSDM) was direc t ly determined by measuring the water coming out f rom pressed garden cress leaves with a portable (±0.01) precision digital refractometer. The vitamin C content of the plants was recorded as "mg L -1" by reading the Merck Reflex device with the help of ascorbic acid test kits. The amount of chlorophyll i n plant l eaves was measured one day before harvest using a handheld SPA-502 (Konica Minolta Sensing,Inc.,Tokyo, Japan) chlorophyl l meter and recorded as the "SPAD value". According to the methods given by Lichtenthaler and Buschmann [57], the concentrations of chlorophyll a,chlorophyll b, total chlorophyll, and total carotenoid were read spectrophotometrically at 450 nm, 645 nm, and 663 nm using a spectrophotometer (Thermo Scientific, Waltham, MA,USA). In the method, the fresh leaves of garden cress were ground with l iquid nitrogen and then centrifuged by homogenizing in 80% acetone as part of the process of analyzing the extracts. The following equations were utilized to calculate t he chlorophyll a, b, total chlorophyll, and total carotenoid contents of cress leaves as "mg g-1FW"i n f resh weight.In the equations, V represents the f inal volume of 80% acetone, and W represents t he f resh weight of the extracted tissue expressed in grams. Total carotenoid (mg g-1FW)=4.07*450 nm - (0.0435* Chll an amount + 0.367 *Chl l b amount) Agricultural nitrogen use efficiency (ANUE) was calculated f rom t he “kg"nitrogen dose application as "g"plant f resh weight increase over the control, according to t he following formula [58]. FW= Plant fresh weight in the amount of fertilizer appl i ed (g) FW0= Plant fresh weight in control (g)F= Amount of fertilizer a 干燥的嫩芽样品 pplied (kg) For mineral analysis, dried shoot samples were ground up to pass through a 1mm mesh screen.. The Kjeldah l method was applied to determine t he total nitrogen content in leaf samples using a Vapodest 10 Rapid Kjeldahl Distillation Unit (Gerhardt, Konigswinter,Germany) [59]. An inductively coupled plasma spectrophotometer (Optima 2100 DV;PerkinElmer, Shelton, CT, USA) was used to analyze the mineral concentrations of leaf samples (P, K, Ca, Mg, S, Na, Mn, Fe, Cu, Cl , and B) by Mertens’ methodology [60,61]. The nitrate content of the leaf samples was assessed using Bremner and Mulvaney [62] t ech-niques: nitrate analysis was carried out on plant extracts for fast nitrate-N determination. Salicylic acid is nitrated at extremely acidic conditions to form a compound, which absorbs most effectively in basic (pH>12) solutions at 410 nm. Soil samples were air-dried, ground up, and passed through a 2 mm f ilter, before being analyzed physical l y and chemically. The Kjeldahl method [59] was used to calculate t he tota l nitro g en content . Electrical conductivity (EC) was assessed in saturated extracts,according to Rhoades [63]. Soi l pH was determined in a 1:2 soil/water suspension according to McLean [64]. Organic matter (OM) of soil was analyzed by the Smith-Weldon method according to Nelson and Sommers [65]. Data preparation was carried out with Microsoft Excel (Microsoft Corporation,Red-mond, WA, USA) and all data were expressed as a treatment mean ± standard error.Statistical analysis was performed using SPSS 25 (IBM, Armonk, NY, USA). Data were subjected to a two-way analysis of variance (ANOVA) to evaluate the single or i nteractive effects of independent variables (fertilizer and dose) on the parameters. Using Duncan's multiple-range test, the means of applications were separated at the 0.05 level of signifi-cance. Significant differences were denoted by distinct letters. 3. Results 3.1. Growth Characteristics In the study, the effect of fertilizer (p<0.001), dose (p<0.001), and f ertilizer x dose interaction (p<0.001) was statistically significant in all measured plant growth parameters.The growth features of garden cress were significantly impacted by different nitrogen (N)levels of the chemical nitrogen (CN), biochar (BC), and process water (PW) applied either as a sole or combination (Figures 1 and 2). In comparison to the control, nitrogen application considerably increased growth parameters such as plant height, stem diameter, leaf number,leaf area, plant fresh and dry weight, and root fresh and dry weight. Maximum results were often recorded when a 15 kg da-l N dose of PW+CN was applied. At different nitrogen levels, aside from plant area, alternative applications often produced better outcomes than a single chemical nitrogen application. The applications of PW+CN and BC+CN at a 15kg da-1 N dose resulted in the tallest plants, exhibiting height increases of 112.08% and 107.42% over the control, respectively. While the highest stem diameter was obtained at 9kg da"l N dose of BC+CN application and 15 kg da-1N dose of PW+CN application, these applications increased the stem diameter by 115.81% and 110.31%, respectively, compared to the control. With a rise of 76.52%, the 15 kg da-1 N of PW+CN application r esulted i n the highest increase in the number of leaves per plant relative to the control. Simi l ar to other results , the 15 kg da -1 N application of PW+BC, which represented an i ncrease of 372.76% from the control , produced the best results i n the mean plant area. PW+CN and BC+CN applications played the most important role in increasing the plant fresh weight by 825.12% and 808.72% over control, respec t ively. The same applications also dramatically increased t he plant’s dry weight by 615.94% and 655.60% respectively, compared to the control. Additionally, the highest control-based increase was produced by 15 kg da -1N BC+CN application with 451.81% i n root f resh weight, while i n root dry weight produced by 15 kg da -1 N BC+CNand 15 kg da -1 N PW+CN applications with 462.78% and 448.12%,respectively. (h) Figure 1. The i mpact of varying fer t ilizer and nitrogen concentrations on t he garden cress (a) plant's height, (b) stem diameter, (c) number of leaves, (d) area, and (e-h) both plant, and roo t fresh and dry weight. Control : 0 kg da -1 N non-fertilizer); I : 9 kg da -1 N, II: 12 kg da -1N, III: 15 kg da-1N;BC:biochar, PW: process water, CN: chemical nitrogen, BC+PW: biochar and process water combination,BC+CN: biochar and chemical nitrogen combination, PW+CN: process water and chemical nitrogen combination. *** Means followed by a different l et t er are significantly different according to Duncan's multiple range test (p ≤0.001). (a) (b) (c) Figure 2. Effec t s of varying nitrogen dosages and fertilizers on t he growth of garden cress. Control: 0kg da-1 N (non-fer t ilizer), I : 9 kg da-1 N, II: 12 kg da-1N, III: 15 kg da-1 N; BC: biochar, PW: process water, CN: chemical nitrogen, BC+PW: biochar and process water combination, BC+CN: biochar and chemical nitrogen combination, PW+CN: process water and chemical nitrogen combination. (a-c):Effects of varying nitrogen dosages and f er t ilizers on the growth of garden cress. 3.2. Quality Characteristics In the study, fertilizer (p<0.001), dose (p<0.001), and fertilizer x dose i nteraction (p <0.001) had a statistically significant impact on t he qualitative characteristics of cress,in-cluding plant dry matter, WSDM, vitamin C, chlorophyll a, chlorophyll b, total chlorophyll,t otal carotenoid, etc. However, the effect of fertilizer x dose interaction on the dry matter content of the plant was found to be significant at the p<0.05 l evel (Figure 3). Varying nitrogen doses resulted in different fertilizer application effects on quality parameters. The dose of 9 kg da -1 N of BC+PW (13.02%) resulted i n the highest increase i n plant dry weight, whereas the dose of 12 kg da-1 N of PW+CN (40.83%) and 9 kg da-1 N of BC+PW (36.67%) showed the maximum increase in WSDM content relative to control. The lowest vitamin C concentrations were produced by CN single doses and decreased as the nitrogen dose increased. The concentration of vitamin C i ncreased by the maximum amount of 29.66% over the control, with the 15 kg da -1 N PW application. The 15 kg da-1 N PW (28.81%) treatment provided the highest increase in SPAD over the control, while the 15 kg da-1 N BC application had the lowest SPAD value. Applications of 15 kg da-1 N BC+PW and 15 kg da -1N CN resulted i n the maximum increase in chlorophyll a, b, and total chlorophyll content when compared to the control, with respective increases of 1252.06%,1345.29%, 1344.54%, and 1359.83%, 1281.65%, and 1351.23%. However, the 15 kg da -1N CN application resulted in the highest i ncrease in carotenoid content, which was 338.95%over the control. Figure 3. Cont. Figure 3. The effect of the varying ferti l izer and nitrogen doses on plant and root dry matter, (a) plant’s height, (b) stem diameter, (c) number of l eaves, (d) area, and (e-h) both plant, and root fresh and dry weight. WSDM, Vitamin C, SPAD, chlorophyll a, b, total chlorophyll , and total carotenoid of garden cress. Means followed by a different l etter are significant l y different according to Duncan’s mul t iple range test (p ≤0.001). Control: 0 kg da -1 N (non-fertilizer), I:9 kg da -1N, II : 12 kg da -1 N,II:15kg da -1 N; BC: biochar, PW: process water, CN: chemical nitrogen, BC+PW: biochar and process water combination, BC+CN: biochar and chemical ni t rogen combination, PW+CN: process water and chemical nitrogen combination. Means followed by a di f ferent letter are signi f icantly different according to Duncan’s multiple r ange test ***: p≤0.001,*: p≤0.05. 3.3. Agricultural Nitrogen UIse Efficiency (ANUE) ANUE was impacted at a signi f icant l evel (p <0.001) by the sources responsible for variation (fertilizer, dose, and fertilizer x dose interaction). According to other treatments,the nitrogen utilization efficiency was rather high at all nitrogen doses of the PW+CN combination and the 15 kg da -1 N BC+CN application. As each dose was independently evaluated, in comparison to solo CN treatments, nitrogen utilization efficiency i ncreased in PW+CN combinations in 9, 12, and 15 kg da -1 N by 36.66%, 23.53%, and 31.98%,respectively. Similarly, the 15 kg da-1 N BC+CN combination i ncreased ANUE by 29.91%compared to the same dose of single CN administration. The results indicated t hat chemical fertilizer combinations with process water and biochar were much more effec t ive i n ANUE of garden cress than chemical nitrogen alone (Figure 4). N Dose (kg da1) Figure 4. The effect of varying fertilizers and nitrogen doses on t he efficiency of garden cress agricul-tural nitrogen use (ANUE). I : 9 kg da -1N, II : 12 kg da -1N,III : 15 kg da -1N; BC: biochar, PW: process water, CN: chemica l nitrogen, BC+PW: biochar and process water combination, BC+CN: biochar and chemical nitrogen combination, PW+CN: process water and chemical nitrogen combination. 3.4. Plant Nutrient Element Contents The effect of ferti l izer, dose, and ferti l izer x dose i nteraction on the nutrient content of garden cress was presented in Tables 4-6. The findings showed that, aside from Na and Cl content, all treatments promoted nutritional content in garden cress shoots when compared to the control. The highest amount of nitrogen was observed in the 15 kg da-1N BC+CN application with a 3.05% content, but the maximum amounts of NO3 and NH4were observed i n 15 kg da-1 N CN application with concentrations of 943.33 g mL-1and 559.33 g mL -1, respectively. Moreover, the highest nutritional values were found to be 0.28% i n a 9 kg da-1 N CN application for P, 2.3% and 2.4%, respectively, in 9 kg da-1N and 15 kg da-1 N of BC+CN applications for K, 1.12% in a 15 kg da-1 N of BC+CN application for Ca, 0.26% and 0.27%, respectively, in a 12 kg da-1 N CN and 9 kg da-N BC+CN applications for Mg, and 0.29% in a 9 kg da-1 N BC+CN f or S. Maximum Mn, Fe,Zn, B, Cl, and Na contents were also reported in treatments with 9 kg da-1N BC+CN,15kg da-1 N BC+CN9 kg da-1 N BC+CN, control , and 12 kg da -1 N CN, in that order. These nutritional contents’ respective values were 22.68 mg g ;-1, 53.19 mg g -1, 21.15 mg g -1,7.7mgg-1,and 1.81 mgg-1,188.39 mgg-1. The measurement values usually fell within the cri t ical ranges of the plant nutrient concentrations. Table 4. Effects of varying nitrogen doses and fertilizers on the elements N, NO3, NH4, P, and K i n shoots of garden cress. Means followed by a different l etter are significantly different according to Duncan's multiple range test (p≤ 0.001). Control: 0 kg da-1 N (non-fertilizer), I: 9 kg da-1 N, I I : 12kg da-1 N, III: 15 kg da-1 N; BC: biochar, PW: process water, CN: chemical nitrogen, BC+PW: biochar and process water combination, BC+CN: biochar and chemical nitrogen combination, PW+CN:process water and chemica l nitrogen combination. Dose Fertilizers Total N (%) NO3 (ug mL-1) NH4 (ug mL-1) P(%) K(%) Control I 0.96±0.161 22.33±2.08i 48.33±6.511 0.1±0.01k 0.59±0.06i CN 1.95±0.04 hi 286.33±8.51e 371±16.52d 0.24±0c-e 1.18±0.06c-g BC 1.78±0.1ij 31.67±1.53i 58.33±3.51kl 0.2±0.02 g-i 1.07±0.06 e-h PW 1.62±0.08j 39±1.5i 79.67±2.08 jk 0.19±Ohi 1.02±0.08 gh BC+PW 2.15±0.01 e-h 28±1.00i 155.67±12.01h 0.26±0.03 bc 1.38±0.07 c-e II BC+CN 2.8±0.04 ab 155±11g 395.67±22.28 cd 0.27±0.01 ab 2.04±0.1b PW+CN 2.43±0.03 d-f 287.67±7.51 307±15.72e 0.19±0.01i 1.42±0.06 cd CN 2.42±0.04d-g 370.67±22.94d 458±27.62b 0.28±0.01a 1.45±0.07 cd BC 1.99±0.02 f-i 28±1.00i 80.67±11.02 jk 0.23±0.01 d-f 1.21±0.04c-g PW 1.29±0.12k 49.5±6.00i 93.33 ±6.66k 0.16±0.01j 0.78±0.08 hi BC+PW 2.06±0.04 f-i 34.33±1.53i 185.33±7.02g 0.21±0.01 f-h 1.09±0.06e-g BC+CN 2.26±0.14 d-f 223±12.53f 474.67 ±17.9b 0.22±0.01 e-g 2.33±0.07a III PW+CN 2.49±0.22 c-d 349.67 ±42.19d 385.33 ±8.33d 0.2±0.01 f-i 1.31±0.09c-g CN 2.25±0.04d-g 943.33±30.55 a 559.33±35.23a 0.25±0.01 bc 1.47±0.02c BC 1.81±0.09ij 24.33±0.58i 126±33.72i 0.21±0.01 f-h 1.18±0.06c-g PW 1.96±0.05 g-i 100.5± 27.37h 108±7.21ij 0.18±0.01i 1.06±0.06 f-h BC+PW 2.21±0.1 d-h 42±2.00i 201±11.53f 0.24±0.01 cd 1.34±0.11 c-f BC+CN 3.05±0.42a 430.33±14.57c 584±25.16a 0.25±0.03 b-d 2.42±0.64a PW+CN 2.67±0.37 bc 569.33 ±19.01b 417±12c 0.22±0.02 fg 1.15±0.1d-g Fertilizer Dose ns ns Fertilizer*Dose Means fol l owed by a different l etter are significantly different according to Duncan’s multiple range test ***: p≤0.001, **: p≤ 0.01, ns: non significant. Table 5. Effects of varying nitrogen doses and fertilizers on t he elements Ca, Mg, S, Mn, and Fe i n shoots of garden cress. Means followed by a different l etter are significantly different according to Duncan's multiple range test (p≤0.001). Control: 0 kg da-1 N (non-fertilizer), I: 9 kg da-1 N, II: 12kg da-1 N, III : 15 kg da-1 N; BC : biochar, PW: process water, CN: chemical nitrogen, BC+PW: biochar and process water combination, BC+CN: biochar and chemical nitrogen combination, PW+CN:process water and chemical nitrogen combination. Dose Fertilizers Ca (%) Mg(%) S(%) Mn (mg g-1) Fe (mg g-1) Control I 0.24±0.01 g 0.06±0.00i 0.06±0.00k 5.1±0.59i 12.67±1.02i CN 0.61±0.02 c-e 0.19±0.01e-g 0.14±0.01 g-i 16.21±0.97 e-g 37.49 ±1.46 d-g BC 0.52±0.09 c-f 0.21±0.04 b-e 0.16±0.03 e-g 16.56±1.88d-g 39.4±7.08 d-g PW 0.53±0.05 c-f 0.15±0.01g-h 0.12±0.01 ij 13.96±1.11g 34.27±1.5 fg BC+PW 0.61±0.02 c-e 0.2±0.03 c-e 0.15±0.00 gh 19.35±1.92 b-d 39.89 ±1.65 d-f BC+CN 0.71±0.03 bc 0.26±0.03a 0.29±0.02 a 22.68±1.20a 48.97±4.25 ab II PW+CN 0.48±0.02 d-f 0.2±0.01 d-f 0.2±0.01 bc 16.07±1.14e-g 37.6±2.36d-g CN 0.65±0.03 cd 0.27±0.02a 0.19±0.01 cd 20.84±1.31 ab 47.95 ±0.75 a-c BC 0.54±0.01 c-f 0.22±0.02 b-e 0.16±0.01 fg 17.43±1.28 c-f 41.21±2.58 c-f PW 0.40±0.04fg 0.12±0.01h 0.1±0.01j 10.66±1.12h 26.17±1.83h BC+PW 0.56±0.04 c-f 0.15±0.01 gh 0.13±0.01 h-j 14.88±0.93 fg 34.4±1.48 fg BC+CN 0.84±0.04b 0.24±0.02 a-c 0.21±0.02b 20.5±1.39 a-c 49.74±0.64 ab III PW+CN 0.44±0.03 ef 0.25±0.04 ab 0.18±0.01 c-e 18.01±2.12 b-e 50.06 ±1.15 ab CN 0.65±0.03 cd 0.22±0.02 b-e 0.16±0.01 fg 20.66±1.90 ab 42.59±1.08 b-e BC 0.52±0.02 c-f 0.18±0.03 e-g 0.13±0.00 h-j 16.58±1.36 d-g 35.67±1.01 e-g PW 0.47±0.03 d-f 0.16±0.02f-g 0.11±0.00ij 14.8±0.68fg 31.92±1.99 gh BC+PW 0.60±0.02 c-e 0.23±0.02 a-d 0.17±0.02 d-f 19.32±1.03 b-d 44.51 ±2.22 b-d BC+CN 1.12±0.41 a 0.23±0.02 a-d 0.22±0.02b 19.89 ±3.86 ac 53.19 ±14.06a PW+CN 0.45±0.02 ef 0.2±0.01 c-e 0.2±0.03 b-d 17.88±1.97 b-f 48.09±1.91a-c Fertilizer 老安兴 Dose ns ns ns ns Fertilizer*Dose 老安 老老兴 Means followed by a different l etter are significantly different according t o Duncan's multiple r ange t est ***: p<0.001, **:p≤0.01, *: p ≤0.05, ns: non signi f icant. Table 6. E f fects of varying nitrogen doses and f erti l izers on t he elements Zn, B, Cl, and Na i n shoots of garden cress. Means followed by a different letter are significantly di f ferent according to Duncan’s multiple range test (p ≤ 0.001). Control: 0 kg da-1 N(non-f ertilizer), I: 9 kg da-1 N, II: 12 kg da-1N, III: 15 kg da-1N; BC: biochar, PW: process water, CN: chemical nitrogen, BC+PW: biochar and process water combination, BC+CN: biochar and chemical ni t rogen combination, PW+CN: process water and chemical nitrogen combination. Dose Fertilizers Zn (mg g-1) B (mg g-1) C1 (mg g-1) Na (mg g-1) Control 5.07±0.78f 1.54±0.35j 1.81±0.06a 168.08±11.6 a-c I CN 9.56±1.14 c-f 3.08±0.39 e-j 1.01±0.51 b-e 144.93±3.16 d-f BC 7.15±0.37e-g 4.49±1.26 c-f 1.13±0.64 b-e 109.46±10.77 hi II PW 6.61±0.25e-g 2.45±0.3 h-j 0.55±0.04e 116.87 ±3.39 gh BC+PW 11.26±0.95 cd 3.6±0.11d-i 1.24±0.45 a-d 152.09±5.16c-e BC+CN 19.03±3.2ab 7.7±0.76a 0.98±0.11 b-e 109.85±12.91 hi PW+CN 15.95±1.72b 4.27±0.73c-g 1.06±0.22 b-e 70.89±5.43k CN 11.46±0.57c 5.56±0.79 bc 1.85±0.47a 188.39±18.98a BC 8.65±0.87c-g 4.51±0.72 c-e 1.49±0.3 a-c 157.32±12.04 b-d PW 5.67±0.28f 2.03±0.36 ij 0.67±0.37 de 159.68±33.79b-d BC+PW 10.32±1.23c-e 2.46±0.29 h-i 0.8±0.40 de 132.99 ±4.12e-g BC+CN 19.42 ±2.21 ab 6.71±0.42 ab 0.93±0.06 c-e 93.69±2.84 ij PW+CN 20.77±2.01a 3.33±0.06 d-i 0.98±0.06 b-e 90.42±2.54I-k Table 6. Cont. Dose Fertilizers Zn (mg g-1) B (mg g-1) C1 (mg g-1) Na (mg g-1) III CN 10.43±0.88 c-e 3.85±0.22 d-h 1.33±0.5 a-d 162.49±7.71 b-d BC 7.63±0.65 d-g 3.22±0.08 e-i 1.11±0.41 b-e 130.46±3.46e-g PW 6.29±0.22 fg 2.77±0.12 g-j 0.95±0.34 c-e 124.75 ±6.5 f-h BC+PW 12.38±0.62 c 4.88±0.75 cd 1.62±0.35ab 174.87±18.78 ab BC+CN 21.15±6.94a 6.48±2.67 ab 0.89±0.12 c-e 92.58±11.37i-k PW+CN 18.28±0.67 ab 2.9±0.92 f-j 0.88±0.01 c-e 86.47±4.79jk Fertilizer 冷冷冷 Dose ns ns ns 冷冷冷 Fertilizer*Dose ns Means followed by a different letter are signi f icantly di f ferent according to Duncan’s multiple r ange test **: p ≤0.01, *: p≤0.05, ns: non significant. 3.5. Soil Properties The study examined the effects of various fertilizers and application doses on t he pH,EC, organic matter (OM), and total nitrogen content (Total N) of the soil. The effect of fertilizer, dose, and fertilizer x dose interaction on these properties is given in Table 7. The results showed that 9 kg da -1 N PW, 9 kg da -1 NC, N,and 12 kg da -1 N BC applications reduced the pH value of the soil relative to the control, while the highest soil pH was measured at doses of 12 kg da -1 N and 9 kg da -1 N of BC+CN combination with 7.96and 7.92, respectively. On the other hand, all applications significantly raised the levels of OM and Total N i n comparison to the control . However, ferti l izer treatments significantly decreased the EC of the soil relative to the control. On the other hand, all applications drast i cally i ncreased the content of OM and Total N over the control . The application of 9 kg da -1 N PW+CN produced the highest soil OM, with 2.68%, while 9 kg da-1N CN and 9 kg da-1 N PW+CN produced the highest total N content with 0.1023% and 0.079%,respectively. Table 7. Effects of varying nitrogen dosages and fert i lizers on t he soil properties. Means followed by a different letter are significantly different according to Duncan’s multiple r ange test (p ≤0.001).Control: 0 kg da-1 N (non-fertilizer), I : 9 kg da -1 N, II : 12 kg da-1 N, I II : 15 kg da-1 N; BC:biochar, PW: process water, CN: chemical nitrogen, BC+PW: biochar and process water combination,BC+CN: biochar and chemical nitrogen combination, PW+CN: process water and chemical nitrogen combination. Dose Fertilizer pH(1:2.5ws-1) EC (mS cm-1) OM(%) Total N (%) Control 6.86±0.32 d-e 117.32 ±5.31a 0.11±0.01h 0.0034±0.0002e CN 6.80±0.00e 92.19±7.03 bc 1.48±0.31f 0.1023±0.0111 a BC 6.97±0.21 b-e 97.13±16.42 bc 1.80±0.28 ef 0.0530±0.0082 a-e I PW 6.77±0.06e 89.6±2.57 b-d 0.48±0.21 gh 0.0141 ±0.0062 de BC+PW 7.23±0.05 bc 88.39 ±4.65 b-d 2.55±0.05 a-c 0.0751 ±0.0014 ab BC+CN 7.92±0.04a 67.64±18.64 fg 1.90±1.07 d-f 0.0560 ±0.0032 a-d PW+CN 7.27±0.15b 64.47 ±7.80 fg 2.68±0.07a 0.0790±0.002 a CN 6.87±0.40 de 87.63 ±11.42 b-e 0.87±0.10g 0.0256±0.0029 b-e BC 6.77±0.25e 104.7±18.2b 2.17±0.10 a-e 0.0640 ±0.0029 a-d II PW 7.21±0.04 bc 86.96 ±0.6 b-e 0.67±0.03g 0.0198±0.0009 c-e BC+PW 7.12±0.07 b-d 62.96±3.30g 2.05±0.03 b-e 0.0604±0.001 a-d BC+CN 7.96±0.12a 81.99 ±11.8 c-f 2.48±0.03 a-c 0.0730±0.0009 ab PW+CN 7.13±0.21 b-d 69.1±3.60 fg 2.28±0.28a-e 0.0670±0.0081 a-c Table 7. Cont. Dose Fertilizer pH (1:2.5ws-1) EC (mS cm-1) OM(%) Total N (%) III CN 7.07±0.15 b-e 100.57±6.03b 0.89±0.08g 0.0262±0.0022 b-e BC 6.93±0.15 c-e 101.2±3.59b 2.41±0.35 a-d 0.0710±0.0102 a-c PW 7.27±0.07b 89.69 ±3.29 b-d 0.64±0.01g 0.0187 ±0.0003 c-e BC+PW 7.22±0.02 bc 70.8±12.39e-g 2.60±0.07 ab 0.0764 ± 0.002 ab BC+CN 7.21 ±0.06 bc 64.49±1.69 fg 2.12±0.09 b-e 0.0624±0.0025 a-d PW+CN 6.98±0.13 b-e 72.7±6.6d-g 2.00±0.09 c-f 0.0588±0.0026 a-d Fertilizer Dose ns ns ns ns Fertilizer*Dose ns Means followed by a different letter are significantly different according t o Duncan’s multiple range test ***: p≤0.001,**:p<≤0.01, *: p≤0.05, ns: non signi f icant. 4. Discussion In the current study, it was observed that varying doses of different fertilizer sources and combinations significantly increased the growth of garden cress. Even though all nitrogen doses improved plant growth relative to the control and in accordance with the growth parameters examined, the 15 kg da -l N dose was reported to be the most effective.Additionally, the PW+CN and BC+CN combination showed more significant results in improving plant growth t han other single and combined applications. Inorganic fertilizers,particularly nitrogen fertilizers, must be utilized to stimulate plant vegetative development.The most often used nutrient element in vegetable cultivation is ni t rogen, which is the main component of protein and nucleic acids, the building blocks of all living things. When nitrogen l evels are low, vegetable yield and quality suf f er [66]. Studies have shown that nitrogen treatments severely impacted the quality and produc t ivi t y of l ettuce and spinach,and also t hat plant growth and yield generally i ncreased wi t h increasing the nitrogen dose to a specific threshold [67]. Although most HTC biochar, speci f ically the one made from plant biomass, has little nutritional value and cannot be used as a fertilizer on its own,it can be utilized i n the soi l to increase the value of fertilizer by reducing the amount of fertilizer lost t hrough surface run-off [68,69]. Researchers are interested in sewage sludge HTC biochar because of i ts usefulness in i mproving soil quality, reducing heavy metal uptake, and potential benefits in nourishing soi l in agricultural areas [70]. A study reported that differently modified sewage sludge hydrochars i nhibited ammonia evaporation and enhanced soi l nitrogen retention, rice nitrogen uptake, and rice yield [71]. The effectiveness of HTC biochar as a substitute or addi t ion to mineral fertilizers in plant studies is being confirmed by very significant i nvestigations. A study on the common bean using four HTC biochar application rates was carried out. Results showed t hat applications boosted both plant nutrient concentrations and soil fertility. Previous research indicated t hat the best time for HTC biochar amendment i s three months before sowing when there i s a maximum of dry matter [72]. A study on t he impacts of biochar and t he HTC process'liquid phase on the germination efficiency of spring barley and garden cress investigated the phytotoxic effects of the liquid phase and the adverse effects of numerous organic compounds on the germination and growth of cress seedlings. The f indings demonstrated that HTC biochar had no phytotoxic effects, although it is always advisable to verify the use of carbonized products in agriculture [73]. In pot trials on common beans and barley,HTC biochar has been shown to have a positive effect on plant development; t his effect is likely related to the increase in soil pH. However, t he use of hydrochar did not benefit leek cultivation; as a resul t , a species-specific approach should be preferred [68]. On the other hand, Shan et al. [37] examined the use potential of the aqueous phase produced from co-HTC of sewage sludge and agricultural wastes (rice husk and wheat straw) and HTC only of sewage sludge rather than chemical f ertilizers in the hydroponic cultivation of pakchoi. According to the study, the only fertilizers that can substitute chemical fertilizers are sewage sludge HTC aqueous phase 20% and co-HTC aqueous phase 60%. In a simi l ar study, it was found that the biomass of pakchoi grew by 25.7-40.9% in the liquid phase produced by co-HTC of sewage sludge and l eftover mushroom compost , whi l e t he nitrogen recovery was reported to be 62.03-64.65%[38]. The findings of our study showed that CN fertilization had a detrimental impact on cress’s vitamin C content. High doses of nitrogen application are reported to reduce the vitamin C content in vegetable crops [74]. The effects of commercial fertilization with ammonium nitrate at doses of 50 kg/ha N, 100 kg/ha N, and 150 kg/ha N on the growth and quality of cress were evaluated in a parallel study (Control), and it was observed that high nitrogen dosages led to poor vitamin C content [75]. Other research supports the f inding that some crops lose vitamin C content when nitrogen f ertilization is increased [76-79]. In the analysis of vitamin C in cress, Zhan et al. [80] reported 33.52 mg 100 g-1 FW; in a study by Tuncay et al. [80] the total vitamin C content was r eported to range from 66.9 to 89.2 mg 100g- in 2002, and from 66.4 and 87.9 mg 100 g-l in 2003. Our results were found to be quite high compared to those obtained i n these studies. Both single and combined applications of process water were found to boost the chlorophyll content of plants in the study. Contrarily, biochar only i ncreased chlorophyll concentrations in combination applications. T his may be because biochar l imits the release of nutrients from the soil by absorbing them. However, i t was f ound t hat adding biochar to process water signi f icantly enhanced t he chlorophyll contents of cress. T uncay et al . [81]stated that t he leaf color of cress with mineral ni t rogen fertilization is darker t han t hat of organic nitrogen sources. Leaf nitrogen concentration is directly related to leaf chlorophyll content, hence leaf greenness [82]. Numerous studies measure or analyze chlorophyll to estimate crop nitrogen status [83-86]. Contrary t o t he results of our work, Celletti et al. [87]claimed that phytotoxic compounds i n the liquid process filtrate produced by hydrothermal carbonization of cow manure impeded plant growth. Low concentrations, however, led to nutritional deficiencies and reduced photosynthesis, which resulted in chlorosis and leaf yellowing. However, the researchers pointed out that l iquid fertilizer can be used with treatments t hat remove phytotoxic substances and t he effects of elements such as Na. Our study determined that cress gained a significant increase i n agricultural nitrogen use efficiency (ANUE) under PW and CN combination (PW+CN) and BC and CN combina-tion (BC+CN) treatments, compared to single CN treatment. Fertilizer management has a direct impact on sustainable nutrient management, which demands both efficiency and effectiveness. The sustainability of fertilizer management systems is determined by nutrient use efficiency (NUE) [76]. The harvested yield and plant nitrogen uptake are closely related and mostly have a linear relationship. It was also observed t hat the growth t raits and the findings for nitrogen usage efficiency were parallel . Hydrothermal biochar showed a higher rate of biodegradation and nitrogen availability than pyrolysis biochar, even in t he second harvest of Lolium perenne grass, according to pot tests [88]. A recent study reported that biochar mixed with urea, leguminous residues and azocompost increased N-ef f iciency as well as reduced nitrogen loss through leaching, as nitrogen is retained on t he large specific surface of the biochar [44]. The nitrogen fer t ilizers used i n the current study were found to considerably boost t he nutritional content of garden cress. The most effective outcomes came from combining PW and BC, which are f requently used with CN. It was discovered that the highest nitrogen dose (15 kg da -1 N) resulted in the maximum outcomes for the nitrate content. The application of CN was found to increase plant ni t rate content i n comparison to other appl i cations, while the combination of CN with BC and PW was found t o reduce i t by almost half. As opposed to single CN applications, combined CN applications with BC and PW usually raised the organic matter and total nitrogen content in the soil. Similarly, Inne et al. [75] reported that a commercial nitrogen application of 150 kg/ha significantly raised t he NOs level of garden cress. There i s evidence that the NO3 level in the leaf i ncreases with increasing nitrogen dose in spinach and lettuce, which is consistent with our findings [89,90]. Nitrogen (N) and phosphorus (P) are extremely well retained in HTC biochar, suggesting that the resulting solid has the potentia l to serve as a source of nutrition [91]. Zhang et al. [92] highlighted that nitrogen-rich HTC biochar has the potential to be utilized as a soil conditioner by regulating nitrogen content and stimulating plant growth. Up to 70% of nitrogen and potassium were carried into the l iquid phase by the PW from the sewage sludge HTC process, which has proven to be rich in fertilizing components [93]. According to Sousa and Figueiredo [51], the quantity of total nitrogen, organic carbon, readily available potassium,and phosphorus in the soi l increased after adding sewage sludge biochar to it. According to t he study, adding sewage sludge biochar to t he soil boosted nutrients such as P, N, Ca,and Mg, which improved soil fertility and radish yield. Researchers stated that a significant increase in foliar nutrients also improved plant height, dry weight, and leaf number. Yue et al. [55] observed significant increases in total soil nitrogen (1.5 times), black carbon (4.5 t imes), organic carbon (1.9 times), potassium (0.4 times), and available phosphorus (5.6 times) after applying sewage biochar to urban soil and growing turf grass in pots.Grass dry matter increased proportionally with increasing amounts of applied biochar due to improved plant mineral nutrition. SS biochar was also reported to retain nutrients,especially nitrogen (N) in permeable soil in wet conditions due to i ts nutrient affinity [94]. 5. Conclusions The study revealed that PW and BC applications alone were i nsufficient for growing garden cress, however, when combined with CN, they were very effec t ive at reducing the nitrogen dose and improving agricultural nitrogen use efficiency. Additionally, PW and BC treatments together with CN enhanced the soil’s nitrogen and organic matter content and boosted the plant nutrient i ntake. Consequently, the i mplementation of BC and PW to increase the utility of CN while lowering its dose is a very hopeful approach for the advancement of sustainable agriculture practices and systems. However, these findings are generally applicable to horticultural applications that use pots, and must be considered for short-term responses even i n f ield conditions. Future research will provide more precise information regarding the practical usage of PW and BC derived from SS and FW as fertilizer, through extensive field trials that take i nto account the soil microbial population. Author Contributions: R.K., E.Y., M.E. and S.E. designed and conducted the experiments; R.K.conducted the research, analyzed the data, and wrote the manuscript; M.T. performed plant and soil nutrient analysis; E.Y., M.E., S.E. and M.T. revised the English composit i on and analyzed the data.All authors have read and agreed to the published version of t he manuscr i pt Funding: This research was funded by Ataturk University Scientific Research Projects Coordinat i on Unit (BAP), grant number FAB-2021-8739. Institutional Review Board Statement: Not applicable Informed Consent Statement: Not applicable. Data Availability Statement: This manuscript includes all data produced or analyzed during this investigation. Acknowledgments: We are very grateful to Synpet (Synpet Technologies, Istanbul, Turkey, and New York,NY, USA) for their support. Conflicts of Interest: The authors declare no competing interests. References 3Gunay, A. Special Vegetable Growi ng (Brassica Crops); Cag Press: Ankara, Turkey, 1984; p. 312.4 5. Diwakar, B.T.; Dutta, P.K.; Lokesh, B.R.; Naidu, K.A. Physicochemical properties of garden cress (Lepidium satioum L .) seed oil. J.Am. Oil Chem. Soc.2010,87,539-548. [CrossRef] 6. Jain, A.; Balasubramanian,R.; Srinivasan, M.P. Hydrothermal conversion of biomass waste t o activated carbon with high porosity:A review. Chem. Eng. J. 2016, 283,789-805. [CrossRef ] 7. Rahman, M.M.; Sal l eh, M.A.M.; Rashid, U.; Ahsan, A.; Hossain, M.M.; Ra, C.S. Production of slow release crystal fertilizer from wastewaters through struvite crystallization-A review. Arab. J. Chem. 2014,7,139-155.[CrossRef ] 9. Ju , X.T .; Kou, C.L.; Zhang, F.S.; Christie, P. Nitrogen balance and groundwater nitrate contamination: Comparison among three intensive cropping systems on the North China Plain. Environ. Pollut. 2006, 143, 117-125.[CrossRef ] 10. Kaza, S.; Yao, L.; Bhada-Tata, P.; Van Woerden, F. What a Waste 2.0: A Global Snapshot of Solid Waste Management to 2050;Urban Development ; World Bank: Washington, DC, USA, 2018; p. 168. 11. Wu, J.; Zhao, Y.; Wang, F.; Zhao, X.; Dang, Q.; Tong, T; Wei, Z. Identifying the action ways of function materials i n catalyzing organic waste transformation into humus during chicken manure composting. Bioresour . Technol. 2020,303,122927.[CrossRef ] 12. Aragon-Briceno,C.I.; Pozarlik, A.K.; Bramer, E.A.; Niedzwiecki, L.; Pawlak-Kruczek, H.; Brem, G. Hydrothermal carbonization of wet biomass f rom nitrogen and phosphorus approach: A r eview. Renew. Energy 2021, 171,401-415. [CrossRef ] 13. Khoshbouy, R.; Takahashi, F.; Yoshikawa, K. Preparation of high surface area sludge-based activated hydrochar via hydrothermal carbonization and application i n the removal of basic dye. Environ. Res. 2019,175,457-467. [CrossRef ] [P ubMed ] 14. Gao, N.; Kamran, K.; Quan, C.; Williams, P.T. Thermochemical conversion of sewage sludge: A critical review. Prog. Energy Combust. Sci. 2020,79,100843. [CrossRef ] 15. Liu , H.; Basar, I .A.; Nzihou, A.; Eskicioglu, C . Hydrochar derived f rom munic i pal sludge t hrough hydrothermal processing: A critica l review on its formation, characterization, and valorization. Water Res. 2021, 199,117186. [CrossRef ] [PubMed ] 16. Breulmann, M.; Schulz, E.; van Afferden, M.; Fuhner, C . Effects of pyrolysis and HTC chars produced from sewage sludge in the plant-soil system. In Proceedings of the 20th World Congress of Soil Science, Soil Embrace Life and Universe, Jeju, Republ i c of Korea, 8-13 J une 2014. 17. Prabhu, M.; Horvat, M.; Lorenz, L.; Otterpohl , R.; Bettendorf, T.;Mutnuri, S. Terra Preta as an alternative for t he management of sludge from wastewater treatment plant . In Proceedings of the 1st International Conference on Terra Preta Sanitation, Hamburg,Germany, 28-31 August 2013. 18. Doelle, H.W. Biomass and organic waste conversion to food, feed, fuel, f ertilizer, energy and commodity products. Biotechnology 2012,10,156. 19. Chiew, Y.L.; Shimada, S. Current state and environmental impact assessment for utilizing oil palm empty fruit bunches for fuel,fiber and f ertilizer-A case study of Malaysia. Biomass Bioenergy 2013,51,109-124. [CrossRef ] 20. Bastidas Oyanedel, J.R.; Schmidt, J.E. (Eds.) Biorefinery: Integrated Sustainable Processes for Biomass Conversion to Biomaterials,Biofuels, and Fertilizers; Springer: Berlin/Heidelberg, Germany, 2019. [CrossRef ] 22. Bardhan, M.; Novera, T.M.; Tabassum, M.; Islam, M.A.; Islam, M.A.; Hameed, B.H. Co-hydrothermal carbonization of different feedstocks to hydrochar as potential energy for the future world: A rev i ew. J. Clean. Prod. 2021,298,126734. [CrossRef ] 23. Dutta, S.; He, M.; Xiong, X.; Tsang, D.C. Sustainable management and recycling of food waste anaerobic digestate: A review.Bioresour. Technol.2021,341,125915. [CrossRe f ] 24. Nizamuddin, S.; Baloch, H.A.; Gri f fin, G.J.; Mubarak, N.M.; Bhutto, A.W.; Abro, R.; Mazari, S.A.; Ali, B.S. An overview of the effect of process parameters on hydrothermal carbonization of biomass. Renew. Sustain. Energy Rev. 2017, 73, 1289-1299.[CrossRe f ] 25. Liu, Z.; Wang, Z.; Tang, S.; Liu, Z. Fabrication, characterization and sorption properties of activated biochar from l ivestock manure via three different approaches. Resour. Consero. Recyc l . 2021,168,105254. [CrossRe f ] 26. Silva Thomsen, L.B.; Carvalho, P.N.; dos Passos, J.S.; Anastasakis, K.; Bester, K.; Biller, P. Hydrothermal liquefaction of sewage sludge; energy considerations and fate of micropollutants during pilot-scale processing. Water Res. 2020,183, 116101. [CrossRef ][PubMed ] 27. Neyens, E.; Baeyens, J . A review of thermal sludge pre-treatment processes to improve dewaterability. J. Hazard. Mater. 2003, 98,51-67. [CrossRef] [PubMed ] 28. Escala, M.; Zumbuhl, T.; Koller, C.; Junge, R.; Krebs, R. Hydrothermal carbonization as an energy-efficient alternative to established drying technologies for sewage sludge: A feasibility study on a laboratory scale. Energy Fuels 2013, 27, 454-460.[CrossRef ] 29. Aragon-Briceno, C.;Ross, A.B.; Camargo-Valero, M.A. Evaluation and comparison of product yields and bio-methane potential in sewage digestate following hydrothermal treatment . Appl. Energy 2017, 208,1357-1369.[CrossRe f ] 30. Chen, W.T.; Haque, M.A.; Lu, T.; Aierzhati, A.; Reimonn, G. A perspective on hydrothermal processing of sewage sludge. Curr.Opin. Environ. Sci. Health 2020,14,63-73.[CrossRef ] 31. Atkinson, C.J.; Fitzgerald, J.D.; Hipps, N.A. Potential mechanisms f or achieving agricultural benefits from biochar application to temperate soils: A review. Plant Soil 2010,337,1-18.[CrossRef] 32. Steinbeiss, S.; Gleixner, G.; Antoniett i , M. Effect of biochar amendment on soil carbon balance and soil microbial activity. Soil Biol.Biochem. 2009, 41, 1301-1310. [CrossRef ] 33. Reibe, K.; Gotz, K.P; Ros, C.L.; Doring, T.F;El l mer, F; Ruess, L. Impact of quality and quantity of biochar and hydrochar on soil Collembola and growth of spring wheat. Soil Biol. Biochem. 2015,83,84-87. [CrossRef ] 34. Busch, D.; Stark, A.; Kammann, C.I.; Glaser, B. Genotoxic and phytotoxic risk assessment of f resh and t reated hydrochar f rom hydrotherma l carbonization compared to biochar f rom pyrolysis. Ecotoxicol. Environ. Saf . 2013, 97, 59-66.[CrossRef ] 35. Sun, X.; Sumida, H.; Yoshikawa, K. Effects of liquid f erti l izer produced from sewage sludge by the hydrothermal process on t he growth of Komatsuna . Br. J. Environ. Clim. Chang. 2014,4, 261-278. Avai l able onl i ne: https://www.cabdirect .org/cabdirect/FullTextPDF/2014/20143414158.pdf (accessed on 13 October 2022). [C r ossRef ] 36. Mau, V.; Neumann, J.; Wehrli , B.; Gross, A. Nutrient behavior i n hydrothermal carbonization aqueous phase f ollowing recircula-tion and reuse . Environ. Sci. Technol. 2019,53, 10426-10434.[CrossRef ] [PubMed ] 37. Shan, G.; Li, W.; Bao, S.; Li, Y.; Tan, W. Co-hydrothermal carbonization of agricultural waste and sewage sludge for product quality improvement: Fuel properties of hydrochar and fertilizer quali t y of aqueous phase. J. Environ. Manag. 2023, 326,116781.[CrossRef ][PubMed] 38. Shan, G.; Li , W.; Bao, S.; Hu, X.; Liu,J; Zhu, L.; Tan, W. Energy and nutrient recovery by spent mushroom substrate-assisted hydrothermal carbonization of sewage sludge. Waste Manag. 2023,155,192-198. [CrossRef ] [PubMed ] 39. Vozhdayev, G.V.; Spokas, K.A.; Molde, J.S.; Hei l mann, S.M.; Wood, B.M.; Valentas, K.J . Response of maize germination and growth to hydrothermal carbonization fi lt rate type and amount. Plant Soil 2015, 396, 127-136.[CrossRef ] 40. Maniscalc o , M.P; Volpe, M.; Messineo, A. Hydrothermal carbonization as a valuable tool for energy and environmental applications: A review. Energies 2020,13,4098. [CrossRef ] 41. Glaser, B.; Lehmann,J.; Zech, W. Ameliorat i ng physical and chemical propert i es of highly weathered soils i n t he t ropics with charcoal-A review. Biol. Fert i l. Soils 2002,35,219-230. [CrossRef] 42. Cheng, C.H.; Lehmann,J .; Engelhard, M.H. Natural oxidation of black carbon in soils: Changes in molecular form and surface charge along a c l imosequence. Geochim. Cosmochim. Acta 2008,72,1598-1610. [CrossRef ] 43. Major, J.; Rondon, M.; Molina, D.;Riha, S.J .; Lehmann, J. Maize yield and nutrition during 4 years af t er biochar applicat i on to a Colombian savanna oxisol. Plant Soil 2010,333,117-128. [CrossRef ] 44. Ghorbani , M.; Konvalina, P.; Neugschwandtner, R.W.; Kopecky, M.; Amirahmadi, E.; Bucur, D.; Walkiewicz, A. Interaction of biochar with chemical, green and biological nitrogen ferti l izers on nitrogen use efficiency indices. Agronomy 2022, 12, 2106.[CrossRef] 45. Jeffery, S.; Verheijen, F.G.; van der Velde, M.; Bastos, A.C. A quantitat i ve review of the effects of biochar application t o soils on crop productivity using meta-analysis. Agric. Ecosyst. Environ. 2011,144,175-187. [CrossRef ] 46. Mendez, A.; Cárdenas-Aguiar, E.; Paz-Ferreiro, J.; Plaza, C.; Gasco, G. The effect of sewage sludge biochar on peat-based growing media. Biol . Agr i c . Hortic. 2017, 33, 40-51.[CrossRef] 47. Taghizadeh-Toosi, A.; Clough, T.J.; Condron, L.M.; Sherlock, R.R.; Anderson, C.R.; Craigie, R.A. Biochar i ncorporation into pasture soi l suppresses in situ nitrous oxide emissions f rom ruminant urine patches. J. Environ. Qual. 2011, 40,468-476. [C rossRef ][PubMed ] 48. Huang, H.J.; Yuan, X.Z. The migration and transformation behaviors of heavy metals during the hydrothermal t reatment of sewage sludge. Bioresour. Technol. 2016,200,991-998.[CrossRef] [PubMed] 49. Zhang, J.; Lin, Q.; Zhao, X. The hydrochar characters of municipal sewage sludge under different hydrothermal temperatures and durations. J . Integr. Agric. 2014,13, 471-482. [CrossRef ] 50. Hossain, M.K.; Strezov, V.;Chan, K.Y.; Ziolkowski, A.; Nelson, P.F. Influence of pyrolysis temperature on production and nutrient properties of wastewater sludge biochar. J. Environ. Manag. 2011,92,223-228.[CrossRef] [PubMed] 51. Sousa, A.A.T.C.; Figueiredo, C . Sewage sludge biochar: Effects on soil fertility and growth of radish. Biol. Agric. Hortic. 2016, 32,127-138. [CrossRef ] 52. Vasilyeva, G.; Butusov, M. Biochar from Municipal Sewage Sludge as Soil Conditioner for Recultivat i on of urban and i ndustrial areas. Abstrac t . In Proceedings of the EGU Genera l Assembly Conference, Vienna, Austria, 4-13 April 2018; Volume 20, p. 2547. 53. Deenik, J .L.; Cooney, M. The potential benefits and limitations of corn cob and sewage sludge biochars in an infertile Oxisol.Sustainability 2016, 8, 131. [CrossRef] 54. Song, X.D.; Xue, X.Y.; Chen, D.Z.; He, P.J.; Dai , X.H. Applicat i on of biochar f rom sewage sludge to plant cult i vation: I nfluence of pyrolysis temperature and biochar-to-soi l ration on yield and heavy metal accumulation. Chemosphere 2014, 109,213-220.[CrossRef ] 55. Yue, Y.; Cui, L.; Lin, Q.; Li, G.; Zhao, X. Efficiency of sewage sludge biochar in improving urban soil properties and promoting grass growth. Chemosphere 2017,173,551-556.[CrossRef ] 56. Faria, W.M.; de Figueiredo, C.C .; Coser, T.R.; Vale, A.T .; Schneider, B.G. Is sewage sludge biochar capable of replacing inorganic fertilizers for corn production? Evidence from a two-year f ield experiment. Agron. Soil Sci. 2017, 64,505-519. [CrossRef] 57. Lichtenthaler, H.K.; Buschmann, C. Chlorophylls and carotenoids: Measurement and characterization by UV-VIS spectroscopy.Curr. Protoc. Food Anal. Chem. 2001,1, F4.3.1-F4.3.8.[CrossRef ] 58. Dobermann, A. Nutrient use efficiency-Measurement and management. In Proceedings of t he I nternational Fertilizer Industry Association, Brussels, Belgium, 7-9 March 2007; pp. 1-22. 59. Bremner, J .M. Nitrogen-Total. In Methods of Soil Analysis; Part 3, Chemical Methods; Sparks, D.L., Page, A.L., Helmke, P.A.,Loeppert , R.H ., Soltanpour, P.N., Tabatabai , M.A., Johnston, C.T ., Sumner, M.E., Eds.; SSSA Inc.: Madison, WI , USA; ASA Inc.:Bridgman, MI , USA, 1996; pp. 1085-1122. 60. Mertens, D. AOAC official method 922.02: Plant preparation of laboratory sample. In Official Methods of Analysis, 18th ed.; Chapter 3; Horwitz, W., Latimer, G.W., Eds.; AOAC: Gaitherburg, MD, USA, 2005; pp. 1-2. 61. Mertens, D. AOAC off i cial method 975.03. Metal in plants and pet foods. In Official Methods of Analysis, 18th ed.; Chapter 3;Horwitz, W., Latimer, G.W., Eds.; AOAC Intl.: Gaitherburg, MA, USA, 2005;pp.3-4. 62. Bremner, J.M.; Mulvaney, C.S. Sal i cyl i c Acid-thiosulfate Modification of Kjeldahl Method t o I nclude Nitrate and Nitrite. In Methods of Soil Analysis. Part 2, Chemical and Microbiological Properties, 2nd ed.;Page, A.L., Ed.; Academic Press: New York, NY,USA, 1982; pp. 621-622. 63. Rhoades, J.D. Salinity: Electrical Conductivity and Total Dissolved Solids. In Methods of Soi l Analysis; Part 3, Chemical Methods;Sparks, D.L ., Page, A.L., Helmke, P.A., Loeppert, R.H., Soltanpour, P.N., Tabatabai, M.A., Johnston, C.T., Sumner, M.E., Eds.; SSSA Inc.: Madison, WI, USA; ASA Inc.: Bridgman, MI , USA, 1996; pp. 417-435.[CrossRef ] 64. McLean, E.O. Soil pH and l ime requirement. In Methods of Soil Analysis. Part 2. Chemical and Microbiological Properties, 2nd ed.;Monograph No. 9; Page, A.L., Mil l er, R.H., Keeney, D.R., Eds.; ASA-SSSA: Madison, WI, USA, 1982; pp. 199-224. [CrossRef ] 65. Nelson, D.W.; Sommers, L .E. Total carbon, organic carbon, and organic matter. I n Methods of Soil Analysis, Part 2, 2nd ed.; Page,A.L., Ed.; John Wiley & Sons: Madison, WI, USA, 1996; Volume 14, pp. 961-1010.[CrossRef ] 66. Mengel, K. Available nitrogen in soils and its determination by the Nmin-method and by electroul t rafiltration (EUF). Fert i l. Res.1991, 28, 251-262. [CrossRef ] 67. Mordogan, N.; Ceylan, S.; Cakici, H.; Yoldas, F. The effects of nitrogen fertilizat i on on nitrogen accumulation of lettuce plants. J.Ege Unio. Fac. Agric. 2001, 38,85-92. Available online: ht t ps://de rgip ark.org .t r/tr/p ub/zfderg i/issue/5070/69202 (accessed on 13 October 2022). 68. Bargmann, I.; Ril l ig, M.C.; Kruse, A.; Greef, J.M.; Kucke, M. Effects of hydrochar application on the dynamics of soluble nitrogen in soils and on plant availability. J. Plant Nutr. Soil Sc i . 2014, 177, 48-58. [CrossRe f ] 69. Schimmelpfennig, S.; Kammann, C.; Moser, G.; Grunhage, L.;Muller, C. Changes i n macro-and micronutrient contents of grasses and forbs fol l owing M i scanthus x giganteus feedstock, hydrochar and biochar application to temperate grassland. Grass Forage Sci. 2015,70, 582-599. [CrossRef ] 70. Singh, S.; Kumar, V.; Dhanjal , D.S.; Datta, S.; Bhatia, D.; Dhiman,J .; Datta, S.; Bhatia, D.; Dhiman, J.; Samuel , J.; et al. A sustainable paradigm of sewage sludge biochar: Valorization, opportuni t ies, challenges and future prospects. J . Clean. Prod. 2020,269,122259.[CrossRef ] 71. Chu, Q.; Xue, L.; Singh, B.P; Yu, S.; Muller, K.; Wang, H.; Feng, Y.; Pan, G.; Zheng, X.; Yang, L. Sewage sludge-derived hydrochar that inhibits ammonia volatilization, i mproves soil nitrogen retention and rice nitrogen utilization. Chemosphere 2020,245,125558.[CrossRef ] 72. Melo, T.M.; Bottlinger, M.; Schulz, E.; Leandro, W.M.; de Aguiar Fi l ho, A.M.; Wang, H.; Ok, Y.S.; Rinklebe, J. Plant and soil responses to hydrothermally converted sewage sludge (sewchar). Chemosphere 2018, 206,338-348. [CrossRef ] 73. Bargmann, I .; Rillig, M.C.; Buss, W.; Kruse, A.; Kuecke, M. Hydrochar and biochar effects on germination of spring barley.J .Agron. Crop Sci. 2013,199,360-373.[CrossRef ] 74. Miceli, A.; Miceli, C. Effect of nitrogen fertilization on the quality of swiss chard at harvest and during storage as minimally processed produce. J. Food Qual. 2014, 37,125-134.[CrossRe f ] 75. Inne, A.; Kul, R.; Ekinci , M.; Turan, M.; Yildrim, E . Nitrogen Ferti l ization Affects Growth, Yield, Nitrate and Minera l Content of Garden Cress (Lepidium satioum L.). YYU J. Agric. Sci. 2021,31, 89-97. [CrossRef ] Mozafar, A. Nitrogen fertilizers and the amount of vitamins in plants: A review. J. Plant Nutr. 1993,16,2479-2506.[CrossRef] Lee, S.K.; Kader, A.A. Preharvest and postharvest factors influencing vitamin C content of horticultural crops. Postharvest Biol.Technol . 2000,20,207-220. [CrossRef ] 78. Yildirim, E .; Guvenc, I .; Turan, M.; Karatas, A. Effect of f oliar urea applicat i on on qual it y, growth, mineral uptake and yield of broccoli (Brassica oleracea L., var. It alica). Plant Soil Environ. 2007, 53,120.[CrossRef ] 79. Yildirim, E.; Ci l, B.; Ekinci, M.; Turan, M.; Dursun, A.; Gunes, A.; Kul , R.; Ki t ir, N. Effects of the intercropping system and nitrogen fertilization on land equivalent ratio, yield and mineral content of broccoli. Acta Sci. Pol. Hortorum Cultus 2020, 19, 101-109.[CrossRef ] 83. Shaahan, M.M.;El-Sayed, A.A.; Abou El-Nour, E.A.A. Predicting nitrogen, magnesium, and iron nutri t ional status i n some perennial crops using a portable chlorophyll meter. Sci. Hor t ic. 1999,82,339-348. [CrossRef] 86. Liu, Y.J.; Tong, Y.P.; Zhu, Y.G.; Ding, H.; Smith, F.A. Leaf chlorophyll readings as an i ndicator for spinach yield and nutri t ional quality with different nitrogen f ertilizer applicat i ons. J . Plant Nutr. 2006,29,1207-1217. [CrossRef ] 87. Celletti , S.; Lanz, M.; Bergamo, A.; Benedett i , V.; Basso, D.; Baratieri, M.; Basso, D.; Baratieri , M.; Cesco,S.; Mimmo, T. Evaluating the aqueous phase from hydrothermal carbonization of cow manure digestate as possible fertilizer solution for plant growth.Front. Plant Sci. 2021, 12, 1317. [CrossRef ] [PubMed ] 88. Leiva-Suárez, B.; Paneque, M.; De la Rosa, J .M.; Gonzalez-Perez, J.A.; Leiva, M.J.; Knicker, H. Soi l amendment with sewage sludge-derived chars i ncreases C-sequestration potential and provides N and P f or plant growth during a second cropping period with Lol i um perenne. Eur. J. Soil Sci. 2021, 72, 1256-1269. [CrossRef] 89. Smatanova, M.; Richter, R.; Hulisek, J. Spinach and pepper response to nitrogen and sulphur fertilization. Plant Soi l Environ. 2004,50, 303-308. [CrossRef ] 90. Liu, C.W.;Sung, Y.;Chen, B.C.; Lai , H.Y. Effects of nitrogen f ert il izers on t he growth and nitrate content of l ettuce (Lac t uca sativa L.). Int. J . Environ. Res. Public Health 2014, 11, 4427-4440. [CrossRef] 91. Marin-Batista, J.D.; Villamil, J .A.; Qaramaleki , S.V.; Coronella, C.J .; Mohedano, A.F.; de La Rubia, M.A. Energy valorization of cow manure by hydrothermal carbonization and anaerobic digestion. Renew. Energy 2020,160,623-632. [CrossRef ] 92. Zhang, X.; Zhang, L.; Li, A. Hydrothermal co-carbonization of sewage sludge and pinewood sawdust f or nutrient-rich hydrochar production: Synergistic effects and products characterization. J. Environ. Manag. 2017,201,52-62. [CrossRef ] 93. Wang, L.; Chang, Y.; Liu, Q. Fate and dist r ibution of nutrients and heavy metals during hydrothermal carbonization of sewage sludge with implication to l and application. J. Clean. Prod. 2019,225, 972-983. [CrossRef ] 94. C ari , A.;C odaglio, A.G. Properties and beneficial uses of (bio) chars, with special attention t o products f rom sewage sludge pyrolysis. Resources 2018,7, 20. [CrossRef ]
确定
还剩19页未读,是否继续阅读?

产品配置单


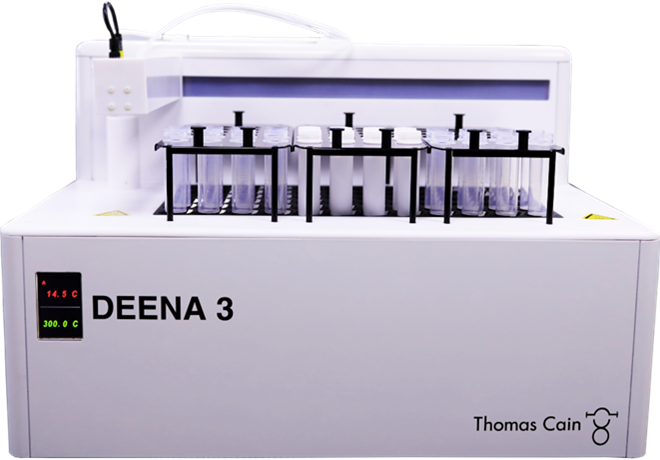
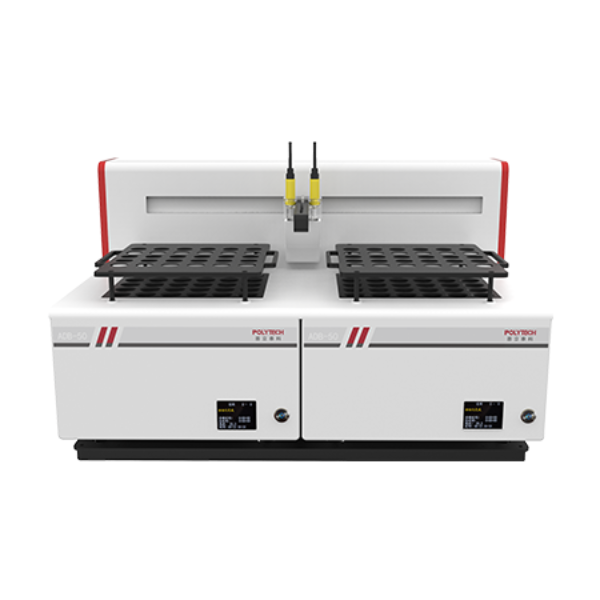
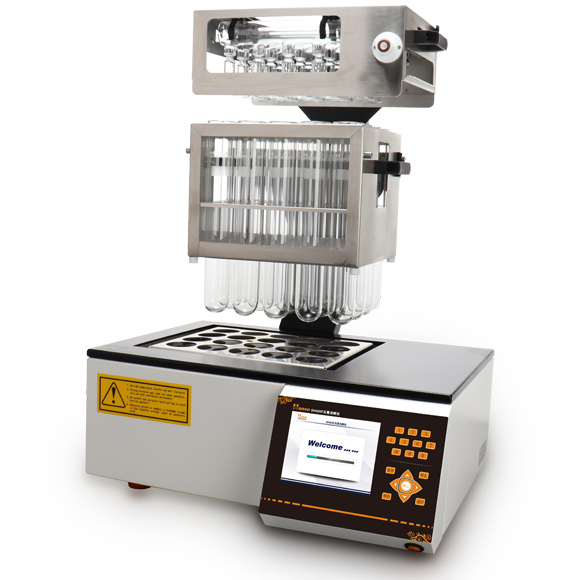
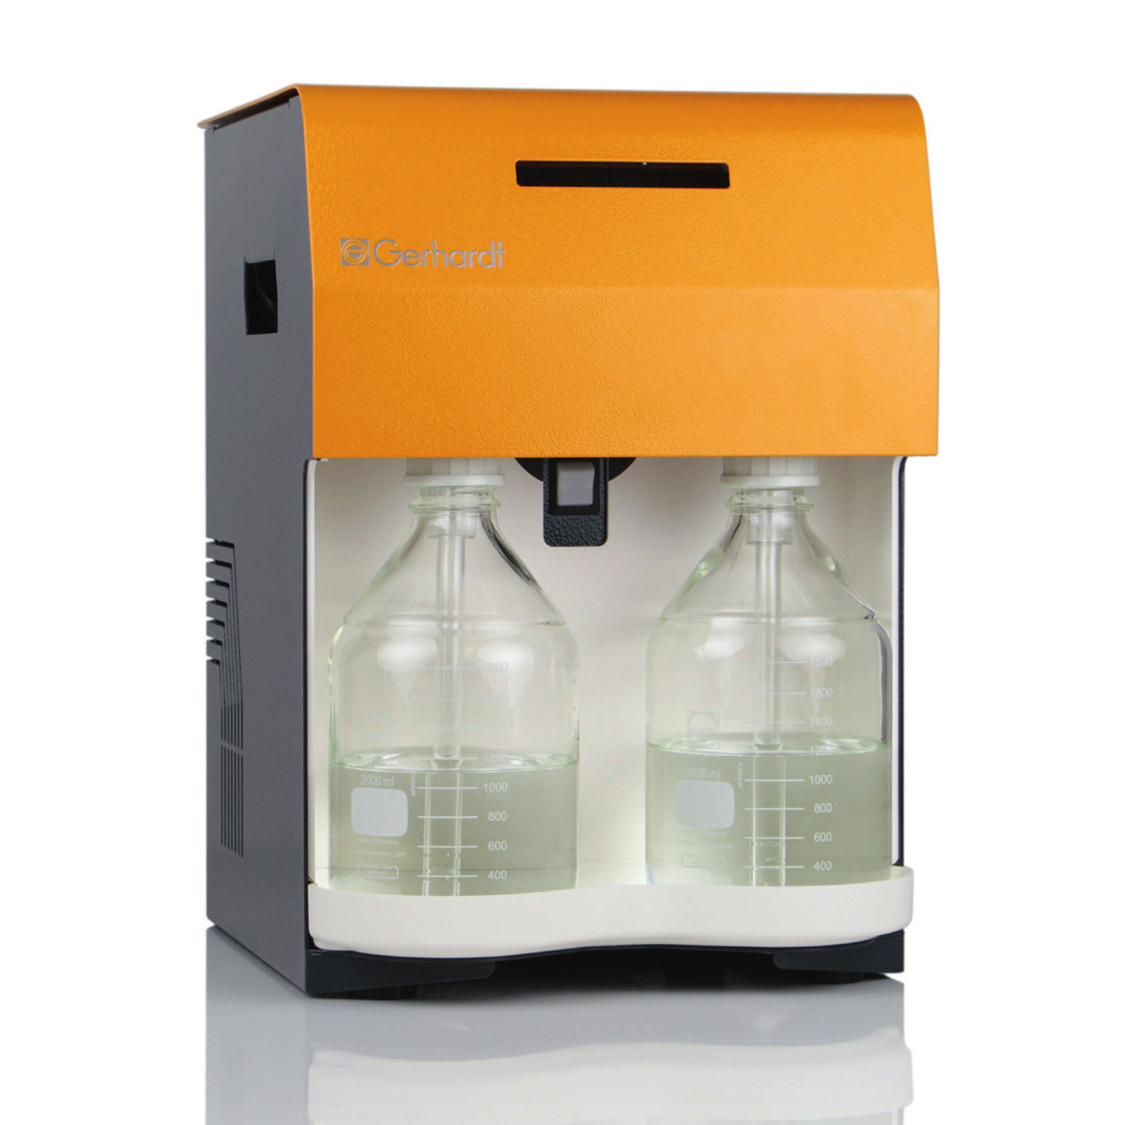
中国格哈特为您提供《花园水芹(独行菜)嫩芽和土壤中氮含量的检测》,该方案主要用于生物农业中氮含量检测,参考标准--,《花园水芹(独行菜)嫩芽和土壤中氮含量的检测》用到的仪器有格哈特带自动进样器凯氏定氮仪VAP500C、格哈特凯氏消化系统KT8S、格哈特维克松废气实验室废物处理系统涤气VS、德国加液器MM、凯氏定氮催化片
推荐专场
定氮仪、凯氏定氮仪、Dumas定氮仪
更多

相关方案
更多
该厂商其他方案
更多