


方案详情
文
不纯二氧化碳在生物涓流床反应器中生物甲烷化的中试研究Pilot-scale study of biomethanation in biological trickle bed reactors converting impure CO2 from a Full-scale biogas plant
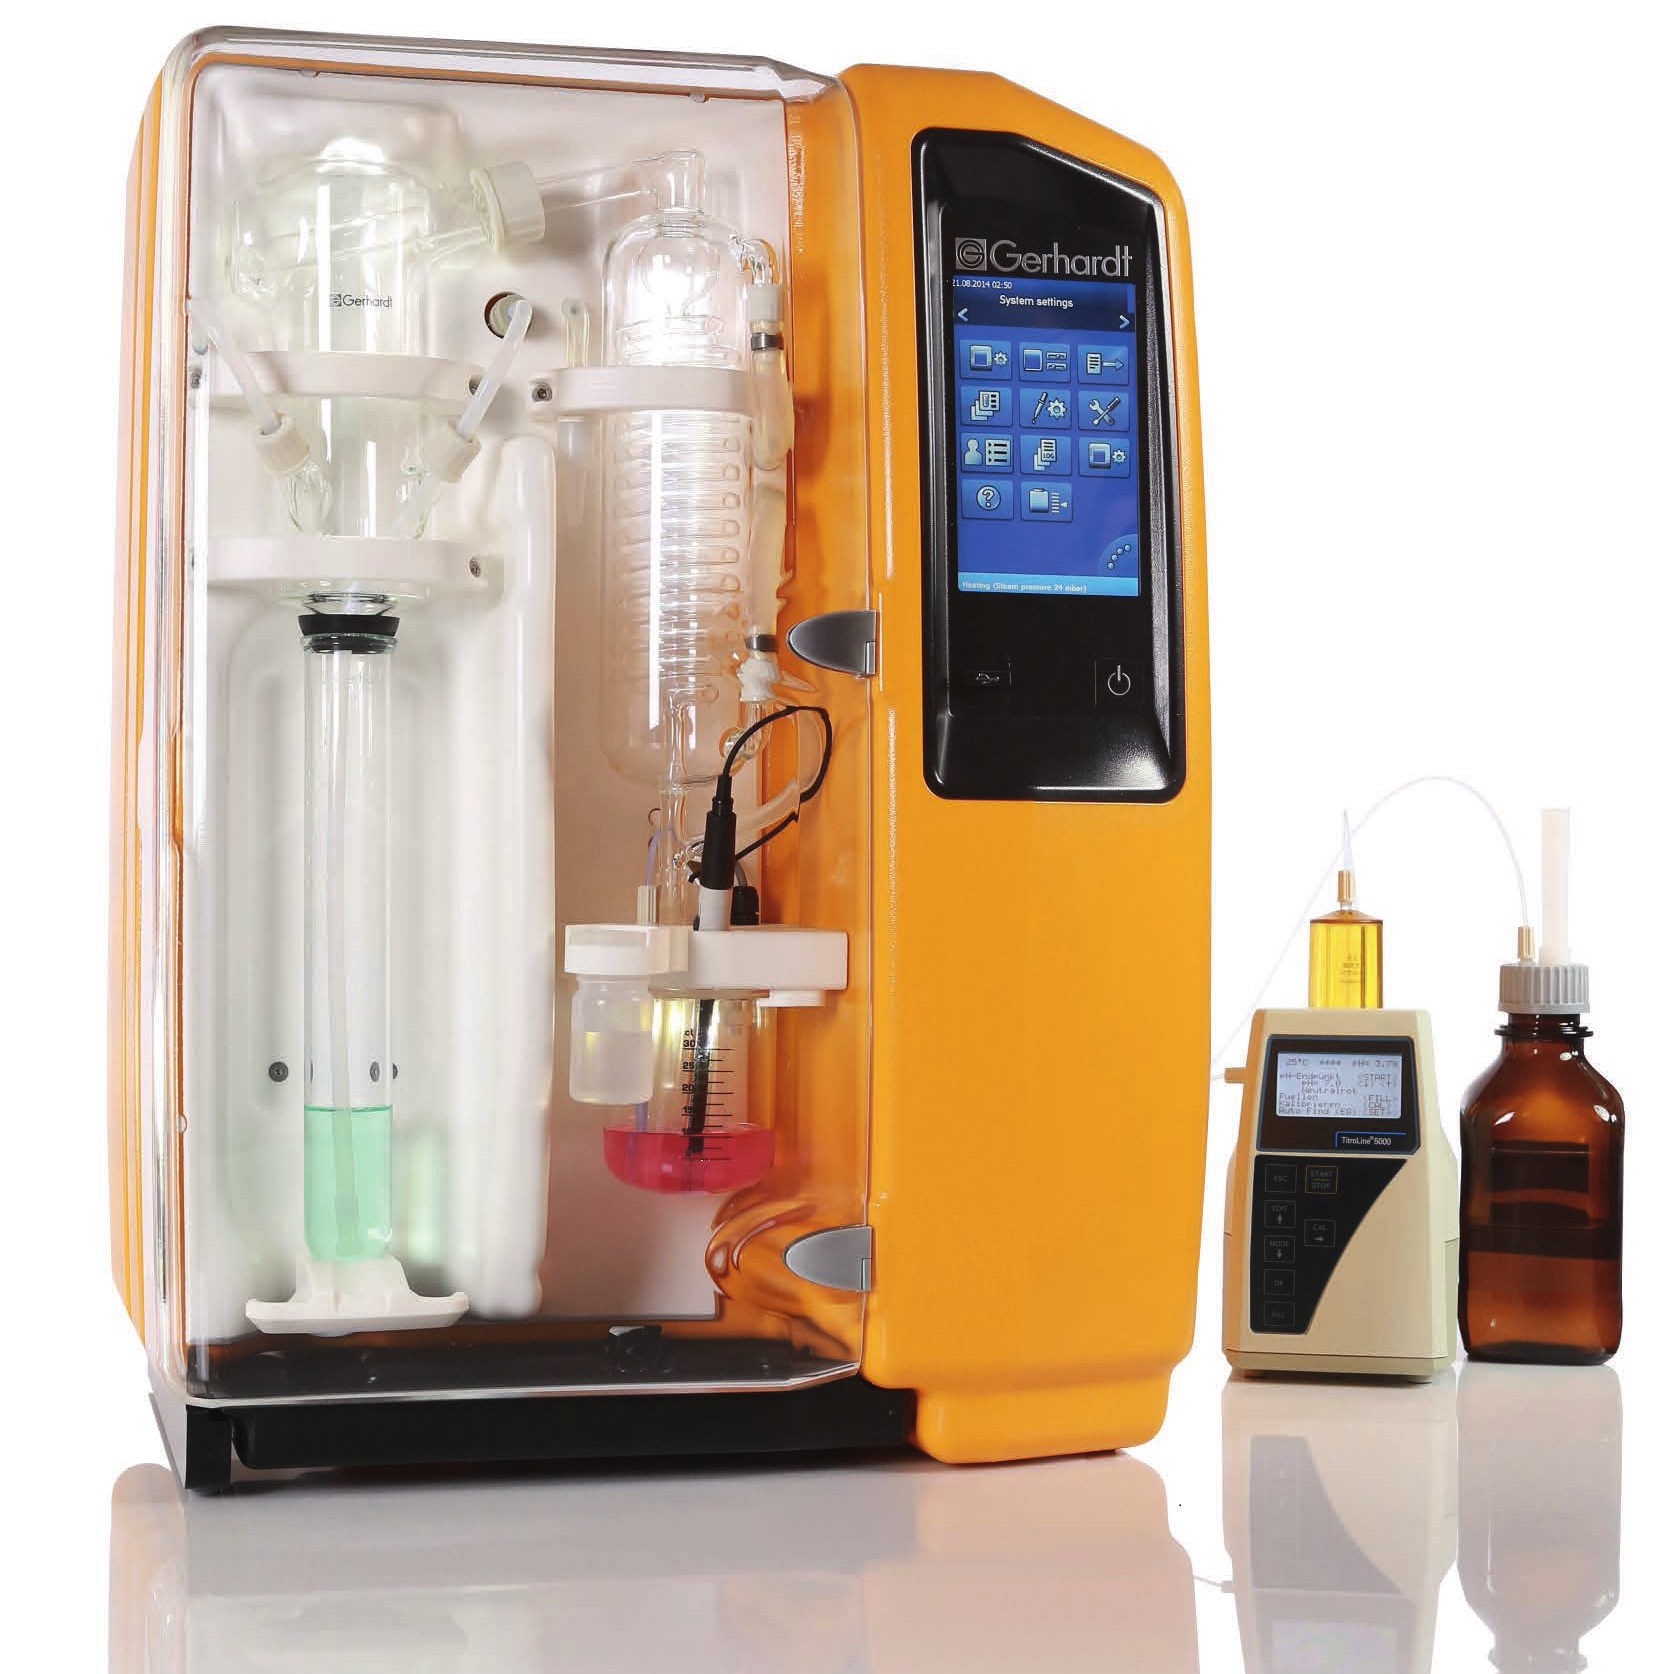
使用格哈特Vapodest 500C检测沼液中NH4+氨含量
NH4+ was measured with distillation (Vapodest 500C, Gerhardt GmbH & Co. KG)
方案详情

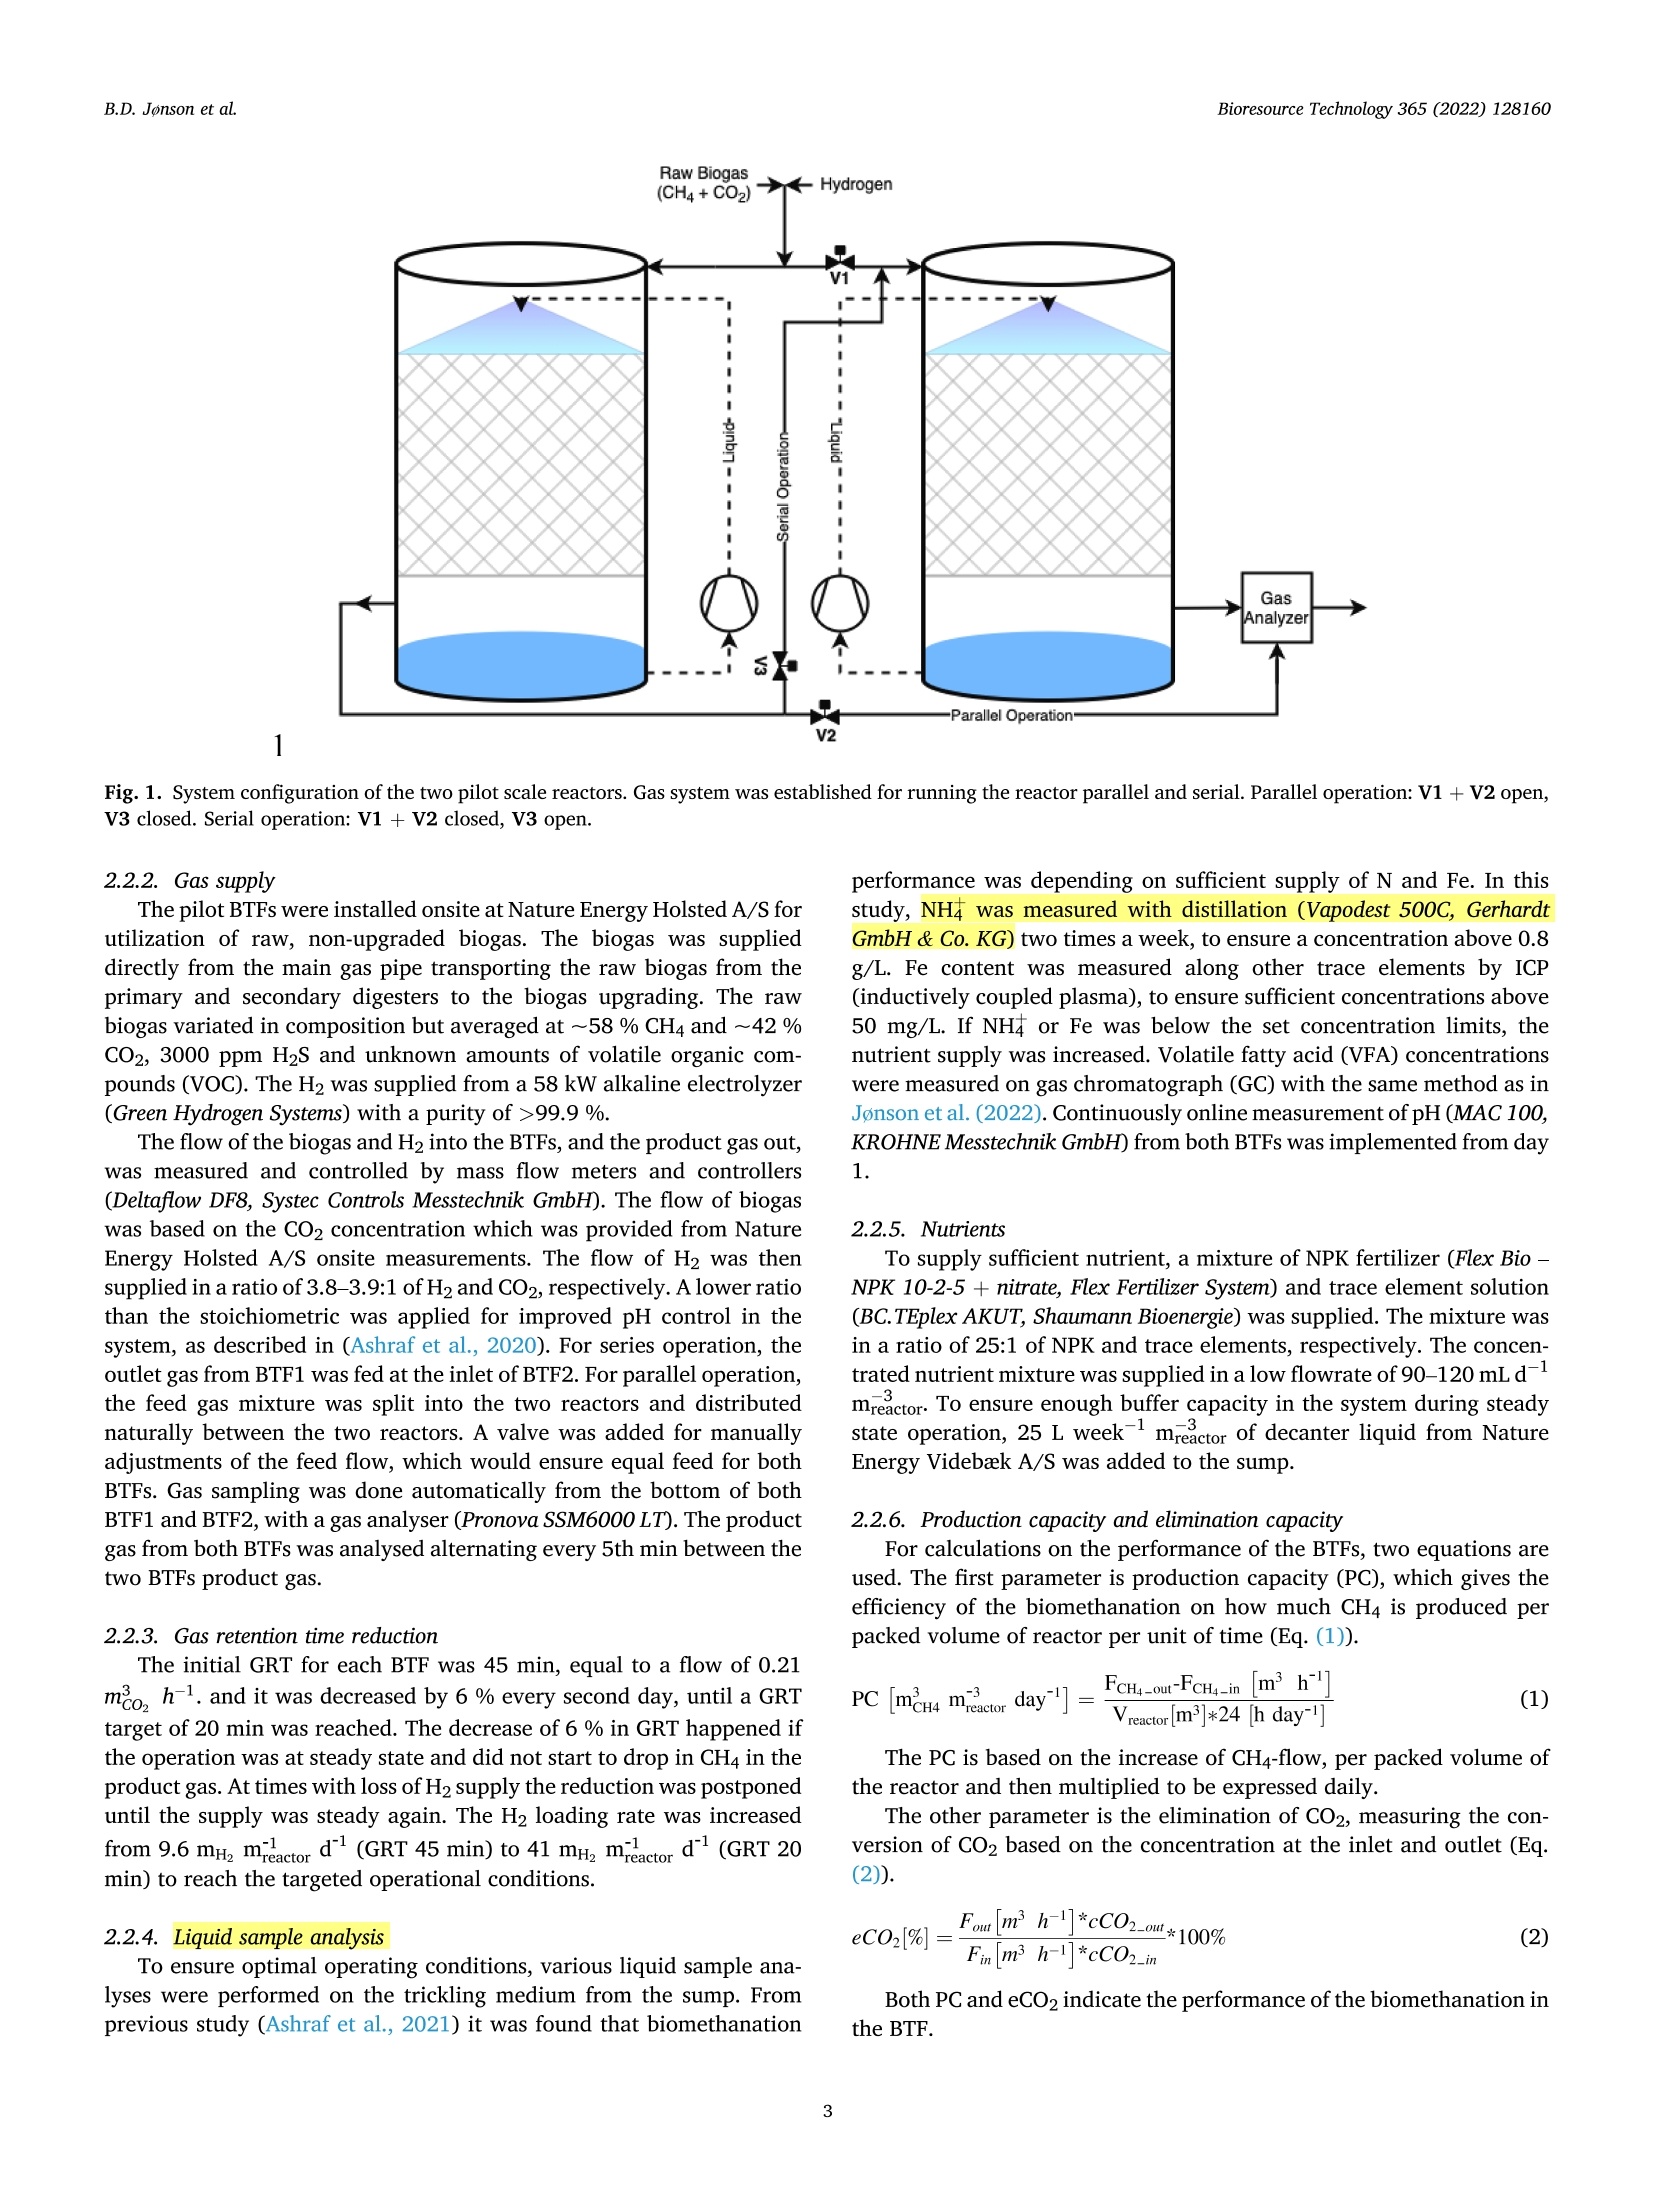
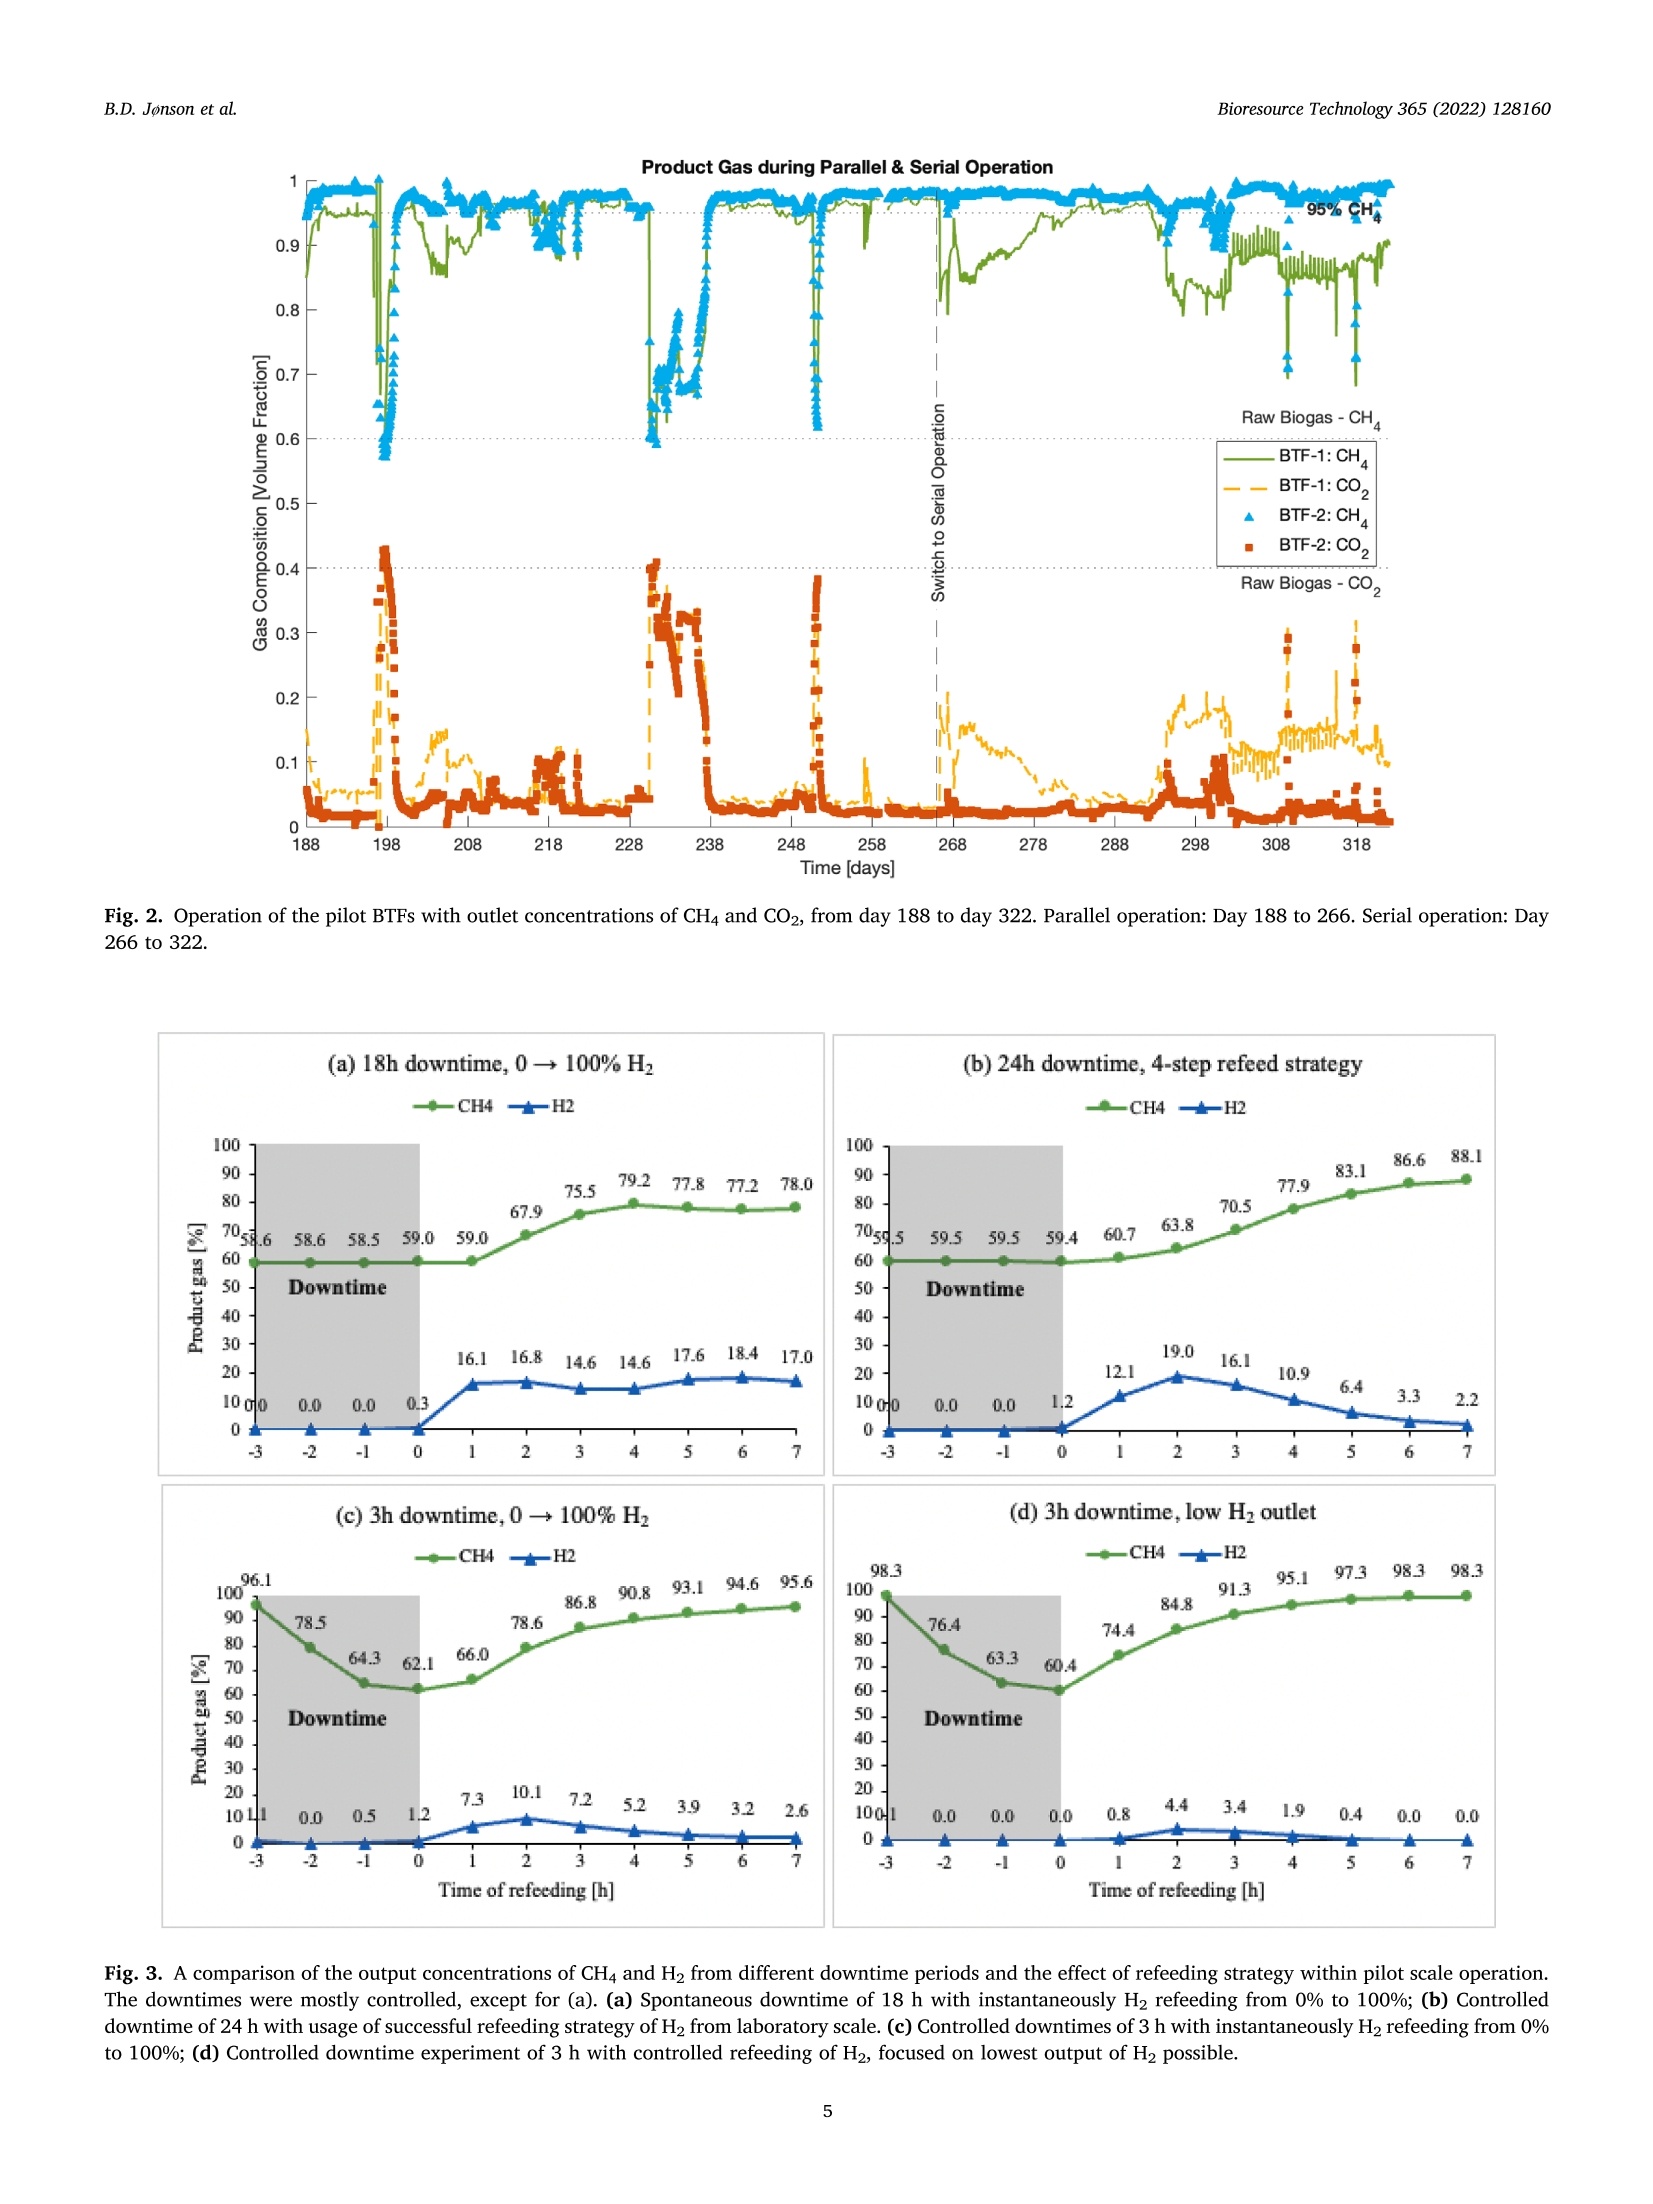
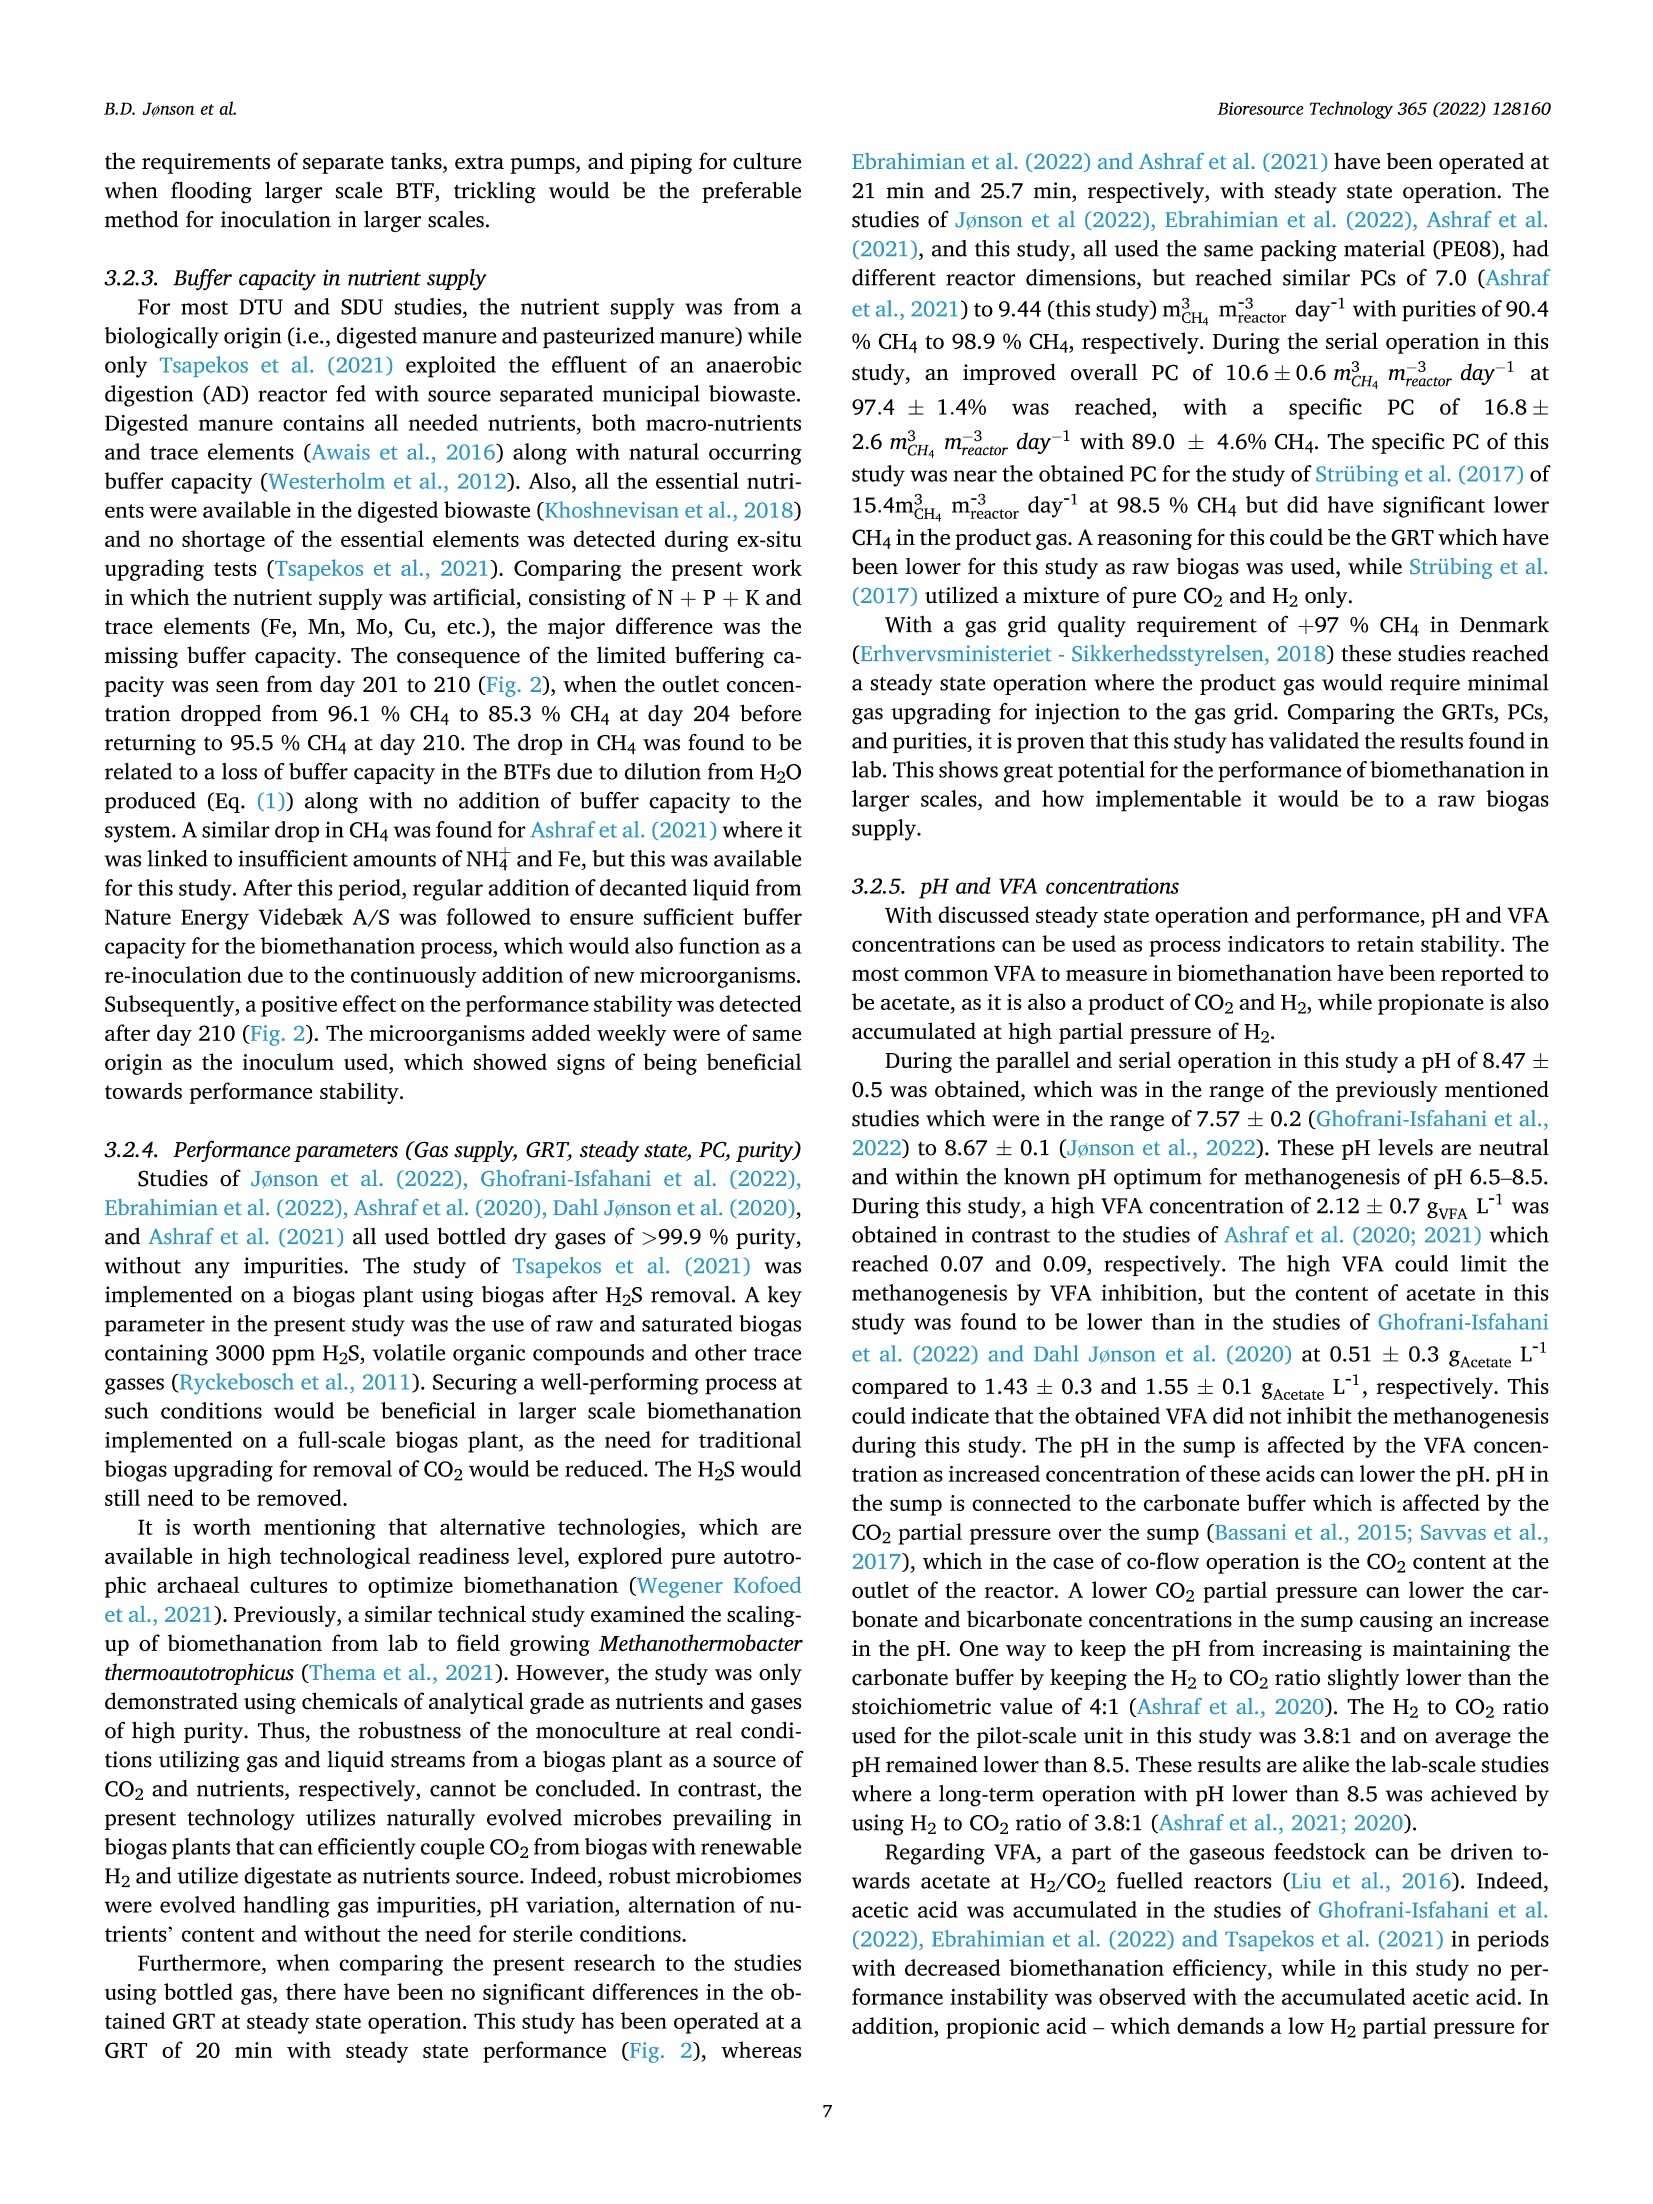
不纯二氧化碳在生物涓流床反应器中生物甲烷化的中试研究Pilot-scale study of biomethanation in biological trickle bed reactors converting impure CO2 from a Full-scale biogas plant使用格哈特Vapodest 500C检测沼液中NH4+氨含量NH4+ was measured with distillation (Vapodest 500C, Gerhardt GmbH & Co. KG)Bioresource Technology 365 (2022) 128160Contents lists available at ScienceDirectBioresource Technology B.D. Jonson et al.Bioresource Technology 365 (2022)128160 journal homepage: www.e l sevie r .com/locate/biortech 不纯二氧化碳在生物涓流床反应器中生物甲烷化的中试研究 Pilot-scale study of biomethanation i n biological trickle bed reactors converting impure CO2 from a Full-scale biogas plant Brian Dahl Jonson a.b , Panagiotis Tsapekos , Muhammed Tahir Ashraf a *, Martin Jeppesen b ,Jens Ejbye Schmidt , Juan-Rodrigo Bastidas-Oyanedel a a SDU-Biotechnology, Department of Green Technology, University of Southern Denmark, Odense DK-5230, Denmark b Nature Energy A/S, Odense DK-5220, Denmark CDepartment of Chemical and Biochemical Engineering. Technical University of Denmark, Kgs. Lyngby DK-2800, Denmark d Department of Green Technology, University of Southern Denmark, Odense DK-5230, Denmark HIGHLIGHTS GRAPHICALABSTRAC T ·Successful implementation of bio-methanation on ful l -scale biogas plant. ·Validated biomethanation technology byy upscaling of biological t ri ckling fil ters. ·Parallel operation obtained 9.44Nm? mday - with a product gas of 95.7 % CH4. ·Serial operation n exceededd parallel operation with 10.6Nm2m’day- at 97.4% CH4. ·Flexibility y proven by intermittent feeding of H2 t o biological t r i ckling fi l ters. ARTICLEINFO ABSTRACT Keywords: Biogas Biomethanat i on Biomethane Pilot scale Power -to-x Research within biological methanation has been a great development using biotrickling filter s (BTF), as a power-to-x solution, but research within up scaling is missing. This study i nvestigates the commercial potential of biomethanation i n BTF by operating two 1 m’ r eactors which was i mplemented i nto a f ull-scale b iogas p lant.Several areas were investigated, such as enrichment and start-up, long-term steady state operation, serial operation, and i ntermittent feed. A methane productivity of 9.44 Nm3 m dayl with a product gas of 95.7%CH4 was obtained for parallel operation, whereas dur i ng serial operation a methane productivity of 10.6 Nm3. m’ day-1 at 97.4 % CH4 was achieved. The f l exibility of the biomethanation was demonstrated with unintentional loss of H2 feed in periods of 12 to 72 h, where initial performance was regained within 6 to 12h. The result s from this study demonstrate the potential for commercial use of biomethanation in BTF for future Power-to-X solutions. * Corresponding author. E-mail address: mut a@i g t .sd u .d k (M. T ahir Ashraf). With the current state of greenhouse gas (GHG) emi s sions, a solution for carbon capture storage and ut i lization (CCS and CCU) i s needed. The GHG emissions have been i ncreasing since the 1960s and in 2015 it resolved in the climate agreement, the Paris Agreement (U n i te d N at i o ns Fr a me wo rk C on v e n tio n o n Clim a t e Ch an ge (UN F CC ), 2015). This has been regularly updated, but the main goal still exists. The temperature increase must not exceed 1.5 °C compared to pre-industrial l evels. With an increasing interest in CO2 reductions, such as EU2030 and EU2050goals (Eur o pe a n C o mmi s s io n, 2020a; b ), there has become a great need for solutions that can store or utilize CO2, which are known as CCU and CCS solutions. Along with the increasing GHG emissions, the current state of energy supply i n the world has shifted t hroughout 2022. To solve these issue, along with stability of natural gas supply, power-to-x tech-nologies could be uti l ized. These technologies ut il ize electricity, to produce H2 by electrolysis, with CO2 to form e-fuels. These f uels are capable of substituting fossil fuels, i.e., natural gas can be substituted by e-methane. Conversion of H2 and CO2 can be done catalytic and bio-logical, where the process wi l l produce CH4 and H2O. A stoichiometric reaction of 4:1 of H2:CO2 will produce the e-methane and H2O i n ratio 1:2, respectively. Moreover, CO2 credits and unified carbon tax are ongoing incentives that can accelerate the implementation of e-methane at various i n-dustries. For example, the C-rich inlet stream can be taken from bio-manufacturing (i.e. biogenic CO2) or intensive GHG releasing chemi-ca l industries (e.g. cement , steel , l i me). On the other hand, the forth-coming huge implementation of solar and wind energy along with advances in water electrolysis are expected to trigger the H2 at lower prices. Methanation technology has been researched widely at labora-tory scale, where a biological approach uti l izing a biological t rickling filter (BTF) has shown great potential. The use of BTFs has shown a potential for lower operational costs and abi l ity to use less purified feed gasses than catalytic methanation which requires high purity gas, and higher operat i ng temperatures and pressures, up to 250 °C and 90 bar,respectively (Y o u n a s e t a l., 2016). Other types of large scales of bio-methanation have been demonstrated before. One of these have been in Denmark and Switzerland (E l ec tro c h aea, 2022), where a biological methanation have been demonstrated with a pure culture of metha-nogens in a CSTR reactor . The results from these operations are strictly l i mited, but they have operated at 63°C and at 10 bar of pressure. Several studies have tested biological methanat i on using BTF at l ab-scale with promising results of production capacity, from 0.2 L (D u p -no ck and De s hus s e s , 2017) up to 14.5 L (Lemmer and U llrich, 2018).Some studies have also performed biological methanat i on (bio-methanation) at a relatively larger scales than the l ab-scale i.e., semi-pilot scale. For example, Str i i bi n g et a l . (2017) used a pilot scale trickle bed reactor with packed volume of 58.1 L and used pure CO2 and H2 gases as feed. They reported CH4 production capaci t y of 15.4 Nm³m-3d-1 with 98 % CHa at the reactor outlet . Recent studies f rom T sa-p e k o s e t al . (2021) and Ch e n g et a l . (2022) used a semi pilot-scale t rickle bed reactor with a packed volume of 68 L and 35 L. However, t he focus in both studies was on the microbial communities applying meta-genomics and the reactors were operated at low gas feed rates. Asi ma -ko poul o s et al. (2021) conducted a scale up study for syngas biomethanation in semi-pilot trickle bed reactor wi t h a packed volume of 5 L. They reported 100 % H2 conversion and CH4 production capacity of 5.7 Nm’m-3d -1 at a gas retention t ime (GRT) of 0.6 h. While these semi-pilot scale studies were performed i n a l arger BTF than laboratory scale, the upscaling was minimum a 4-fold, compared to the study of L e mmer and Ull r i ch (2018), which is not enough to encounter unknown chal l enges from upscal i ng to a larger scale. More-over, i t i s i mperat i ve for the future development and i mplementation of biomethanation to investigate how the operation and process perfor-mance of a BTF wil l be affected at larger scales, especially when the BTF is operated continuously using raw biogas containing t races of 2. Materials and methods 2.1. Reactor configuration of pilot BTFs The pilot plant consisted of two BTFs (BTF-1 & BTF-2) with a packed volume of 1 m’ each. The reactors have inner diameter of 1 m, and a packed height of 1.3 m, giving a low height:diameter ratio of 1.3:1. The complete pilot plant setup was constructed inside a 20 ft. container.Fi g . 1 shows an illustration of the reactor configuration. The BTFs were built accordingly to given regulations from t he Danish Safety Technology Authority regarding H2 safety. Given H2 i s highly permeable through materials (Ab o ham z eh et al., 2021), the BTFs and all piping for gasses were built in stainless steel. All welding was done by cert i fied welders and followed Danish regulations. F i g. 1 shows t he BTFs are buil t with piping arrangement s that allows switching between par-allel and serial operation of the two BTF units and allows gas recircu-lation to the first BTF . Both BTFs were fully insulated t o minimize heat loss to surroundings from the BTFs. Each BTF reactor has a sump volume of 0.4 m’ at the bottom of packed volume to contain nutrient media. Two liquid pumps (SHB 20-100 horizontal pump, Stiibbe GmbH & Co. KG) were placed to p ump the sump with nutrients at a t rickl i ng flow rate of 0.7 m’ m-3 h-1.A nozzle was installed to ensure even distribution of trickled media. The sumps were actively cooled to keep a steady operating temperature of 54-57°C throughout the BTFs, which was observed by 7 temperature points located throughout each BTFs. To keep a steady operating tem-perature, a regulation loop was put i n place with a minimum and maximum temperature of the sump at which the cooling would stop or start, respectively . Both reactors were initial packed with a high surface area (>3500 m²/m³) packing material (5x10mm) with 76 % void space (MBBR PE08, Tongxiang Small Boss Special Plastic Products Co. Ltd). The same packing material have been used previously in a different study as well (As hr af et al., 2021). 2.2. Operational parameters 2.2.1. Inoculum and i noculation Prior to the inoculation, the BTFs were heated up to the thermophilic operating temperature and continuously trickled with water to wet the packing material. The l iquid f raction obtained from a decanter separa-tion process of digestate at Nature Energy Videbaek A/S was used as inoculum for the BTFs. This decanted l i quid was free of particles >500um and was sampled at the inoculation day. A direct inoculation method was applied, as used in (D a h l J onson e t al ., 2020), by flooding the re-actors packed volume with the inoculum. After t he inoculation process,the feeding of gases was started. Raw Biogas S -→99.9%. The flow of the biogas and H2 into the BTFs, and the product gas out,was measured and controlled by mass flow meters and controllers (Deltaflow DF8, Systec Controls Messtechnik GmbH). The flow of biogas was based on the CO2 concentration which was provided from Nature Energy Holsted A/S onsite measurements. The flow of H2 was then suppl i ed in a ratio of 3.8-3.9:1 of H2 and Co2, respectively. A lower ratio than the stoichiometric was applied for i mproved pH control i n the system, as described in (A s hraf e t a l ., 2020). For series operation, t he outlet gas f rom BTF1 was fed at the inlet of BTF2. For parallel operation,the feed gas mixture was spl i t into the two reactors and distributed naturally between the two reactors. A valve was added for manually adjustments of the feed flow, which would ensure equal feed for both BTFs. Gas sampling was done automatically from the bottom of both BTF1 and BTF2, with a gas analyser (Pronova SSM6000 LT). T he product gas from both BTFs was analysed alternating every 5th min between the two BTFs product gas. 2.2.3. Gas retention t i me reduction The initial GRT for each BTF was 45 min, equal to a flow of 0.21m h-1. and it was decreased by 6 % every second day, until a GRT target of 20 min was reached . The decrease of 6 % in GRT happened if the operation was at steady state and did not s tar t to drop i n CHa i n the product gas. At times wi t h loss of H2 suppl y the reduction was postponed unt i l the supply was steady again. The H2 loading rate was increased from 9.6 mH, mactor d(GRT 45 min) to 41 mH, ma c tor d (GRT 20min) to reach the targeted operational conditions. performance was depending on sufficient supply of N and Fe. I n this study, NH; was measured with dist i llation (Vapodest 500C, Gerhardt GmbH & Co.KG) two times a week, to ensure a concentration above 0.8g/L. Fe content was measured along other trace elements by ICP (i nductively coupled plasma), to ensure suf fi cient concentrations above 50 mg/L. If NH; or Fe was below the set concentration limits, the nutrient supply was increased. Volatile fatty acid (VFA) concentrations were measured on gas chromatograph (GC) with t he same method as i n J on so n e t al. (2022). Continuously online measurement of pH (MAC 100,KROHNE Messtechnik GmbH) from both BTFs was implemented from day 1. 2.2.5. Nutrients To supply sufficient nutrient, a mixture of NPK fertilizer (Flex Bio -NPK 10-2-5 + nitrate, Flex Fertilizer System) and trace element solution (BC. TEplex AKUT, Shaumann Bioenergie) was suppl i ed. The mixture was in a ratio of 25:1 of NPK and trace elements, respectively. The concen-trated nutrient mixture was supplied in a low f lowrate of 90-120 mLd-1mreactor. To ensure enough buffer capacity in the system during steady state operation, 25 L week-1 mreactor of decanter liquid from Nature Energy Videbak A/S was added to t he sump. 2.2.6. Production capacity and elimination capacity For calculations on the performance of the BTFs, two equations are used. The first parameter i s production capacity (PC), which gives the ef f iciency of the biomethanation on how much CH4 is produced per packed volume of reactor per unit of time (Eq.(1)). The PC is based on the increase of CH4-flow, per packed volume of the reactor and then multiplied to be expressed daily. The other parameter is the elimination of CO2, measuring the con-version of CO2 based on the concentration at the i nlet and outlet (Eq.(2)). Both PC and eCO2 indicate the performance of the biomethanation in the BTF . In this study, the reactors were designed to assess a real-l i fe opera-tion of a biological methanation system, which would reflect on the commercial aspect of the technology. Hence, four major areas were investigated. Parallel operation: The focus was to validate the technology in oper-ational environment , compared to the previous laboratory scale studies (A shr a f et al ., 2021,2020; D ahl J onson e t a l ., 2020; Ebr a h i m i a n e t a l.,2022; G ho fra n i -I sfa h an i e t al ., 2022; J on son et a l ., 2022; T sa pe k os e t al .,2021). The BTFs were operated under i dentical conditions of tempera-ture, flow, and trickling. Serial operation: Seria l operation of the BTFs was tested to elucidate i f the methanation process would become more eff i cient. T he feed gas would enter the first BTF and output would enter the second BTF. The overal l gas load to the system was kept unchanged. Intermittent feeding: Previous studies (Jo ns o n et a l., 2022; S t r u bi ng et al ., 2018) have shown t he potential of this type of biomethanation technology to work under an intermittent energy system, where H2production would be f luctuating. The i ntermittent feeding, or dynamic operation, is an important parameter for i mplementation of t his tech-nology into the current energy system which have been described more in J on son et a l. (2022). The results from J o n so n et a l . (2022) was going to be validated herein, to show the scalabil i ty of the optimized param-eters for downtime operation of the BTFs. This flexible operation i s one of the most important areas to be investigated to assess the applicability of this technology. 3. Results and discussion 3.1. Operational performance from pilot scale BTFs Due to equipment calibrations and sensor challenges, H2 was peri-odically added in a higher ratio than 4, and therefore H2 output i s neglected on all figures while the outlet r atio of CH4 and CO2 were used instead. The BTFs have been operated for >500 days, not all data wi l l be shown here, as some was commissioning, and others was steady state operation between the experimental periods. The commissioning of the BTFs took around 100 days (data not shown) due to the equipment and signals that needed to be between the pilot container, the electrolyser unit and the biogas plant, along with safety installations and signals. The resul t s during this period were used for cal i brat i on and adjustment s of the equipment. The BTFs were started in paral l el operation to ensure uniform per-formance. 10 days after inoculation, the outlet gas of the BTFs had CH4>90 %. This CH4 content is lower than gas grid requirements in Denmark (Er h vervsm i nis t eri e t -S i kkerheds s t y r el s e n , 2018), but it is known the product gas f rom the BTFs wi l l undergo further upgrading to remove residues of CO2 and H2S from the raw biogas. Therefore, this study does not have a target of gas grid gas quality in the product gas.After 45 days of steady-state operat i on the GRT was lowered to increase the PC of the BTFs. Thi s ramp-up t echnique of gas flow was mimicked from commercia l scale biogas digester ramp-ups and being based upon studies (A ra mrue a ng e t a l., 2016; B a bae e and Sh ay e ga n, 2011; Wi j ek o on e t al ., 2011), investigating organic l oading rate (OLR) changes in anaerobic digestions. Specifically, an i ncrement i n t he OLR could have negative impacts on the performance due to over-feeding. With this ramp-up, the GRT was lowered to 20 min after 28 days. However, due to challenges with the H2 supply from the electrolyzer unit and equipment difficulties, the stable operation at the GRT of 20 min was reached after 112 days after initial ramp-up start. GRT of 20 min, on average, resulted in PC of 10 man, mreactor day, with a H2 loading of 41 mH, mreactor d,and the BTFs were kept at this GRT during the parallel operation t rials. 3.1.1. Parallel operation From day 188 to day 266, the BTFs were operated in parallel at steady state with a f low of 0.48 m2, micactor h per BTF, giving a GRT of 20 min. The outlet ratio of CH4 and CO2 is i l lustrated i n Fig. 2, where H2 was neglected as previousl y mentioned. For the whole period, an average between both BTFs showed 95.7±2.2% CH4 and an eCO2 of 89.8±5.2% with a peak in eCO2 of 97.3%.A mean PC of 9.44±2.37 m3 m-3 day-1 was reached with a maximum of 11.1mmreactor day-1. During the 78-day parallel oper-ation (Day 188-263), three occasions with loss of H2 supply happened that were related to the operation of the electrolyzer unit. The occasions with loss of H2 was at day 197, 230 and 250, and the periods without H2supply had a duration of 1.5 days, 6 days, and 0.6 days, respectively.During the loss of H2 t he outlet switched to raw biogas concent r ations and when H2 feeding was reinitiated, the performance was r egained within a day of operation. This regain of performance was unexpected,as no strategy was implemented for this loss of H2, but the relative fast recovery was a clear sign for the potential of flexibility of t he t echnol-ogy. Neglecting the periods with loss of H2 the averaged concentration of CH4 in the outlet was 95.73±2.17%. 3.1.2. Serial operation In the serial operational, the total gas flow was not changed f rom 0.48 m3 m-3ctorhper BTF, but i nstead of dividing the f low between the reactors, the total inlet f low was directed into BTF-1 and that outlet was used as feed gas in BTF-2. F i g . 2 shows t he output concentrations of CH4 and CO2 for both BTF in the serial operation mode f rom day 266 to day 322. With all f low going through BTF-1, the GRT was halved to 10min, while the precise inlet flow and GRT of BTF-2 was unknown due to equipment failure on the inlet f lowmeter in this period. Besides this, the product gas quality from BTF-1 was used to estimate and calculate a flow, which could then be used for calculations of PC. The outlet of BTF-2 expressed the total CO2 conversion. When the operation was switched to serial operation a significant change in the product gasses were observed. This was due to BTF-1receiving an increased load of feed. This stabilized until day 292,where it was observed that a malfunction had happen and wi t h the switch in operational mode, had lowered t he inlet feed gasses. At day 292-295 the malfunction was fixed, and the i nitial feed used for parallel operation was used for serial operation. During the last 28 days, smaller fluctuations were observed, but overall performance of BTF-1 increased slowly. During the whole 58-day period of serial operation, BTF-1 had a PC of 16.8±2.6 mmreac t or day-1, but it alower CH44 content a 89.0±4.6%. The PC was higher than the results obtained during par-allel operation due to increased feed. The eCO2 was 73.5±11.4%and the high variation was due to feed flow adjustments at day 293, which lowered the conversion of BTF-1 for the rest of the period. For the whole biomethanation system, the PC during the 58 days was 10.6±0.6 m? m-3 day -1 at 97.4±1.4% CH4, corresponding to a 10 %increase compared to the parallel BTFs operation. The eCO2 increased to 93.4±5.33% in serial operation, which was also higher than during the value achieved during the parallel operation of t he BTFs. With the serial operation, an enhanced operation was observed compared to the par-allel operation, and more stability was observed in the quality gas of BTF-2 compared to the parallel operation from both BTF-1 and BTF-2. 3.1.3. Intermittent feeding With the importance of dynamic operation due to the intermi t tent energy system, a validation test was performed. The f irst t est was un-intentional, where downtimes occurred due to the loss of H2 have occurred. As mentioned previously, a loss of H2 was not uncommon as the electrolyzer unit was not performing optimally. In the period f rom day 90 to day 120 there had been multiple occasions with losses of H2, Time [days] Fig. 2. Operation of the pilot BTFs wi t h outlet concentrations of CHa and Co2, from day 188 to day 322. Parallel operation: Day 188 t o 266. Serial operation: Day 266 to 322. Fig. 3. A comparison of the output concentrations of CHa and H2 from different downt i me periods and the effect of refeeding strategy within p ilot scale operation.The downt i mes were mostly controlled, except f or (a). (a) Spontaneous downtime of 18 h with instantaneously H2 r efeeding from 0% t o 100%; (b) Controlled downtime of 24 h wi t h usage of successful refeeding strategy of H2 f rom laboratory scale. (c) Controlled downtimes of 3 h with instantaneously H2 refeeding from 0%to 100%; (d) Controlled downt i me experiment of 3 h with controlled refeeding of H2, focused on l owest output of H2 possible. ranging from 12 to 72 h (data not shown). For these periods the r egain of performance after H2 was reinitiated took between 6 and 12 h. Common for these downtimes was no strategy for refeeding of the H2, which could be a reason for the relatively longer time to regain conversion. There-fore, a downtime period of 24 h was tested wi t h a r efeeding strategy, as was used in St r u bi n g e t al . (2018), and the results were compared to the earlier lab-scale study from J on s o n et a l. (2022). For the second test, a method was investigated for the development of a refeeding strategy. A 3-hour downtime was used for testing no refeeding strategy and a strategy where the H2 refeeding was i ncreased slowly and gradually to avoid high H concentrations i n t he product gas.This was done due to limi t ations of t he Wobbe index in the gas grid (Er h v e rvsm i ni s t e ri e t - S i kk erh e d ss ty re ls en, 2018). The results f rom both tests of refeeding strategy in a pilot scale operation are shown in F i g . 3. By comparison of t he unintentional downtime at F ig. 3a wi t h the intentional downtime of F ig. 3b, a signi f icant di f ference in product gas development is noticed. With the control l ed refeeding strategy, a H2peak of 19.0 % was noticed after 2 h but dropped to 2.2 % after 7 h.Compared to no refeeding strategy, 16.8% H2 was noticed i n the product gas after 2 h, which was lower than with t he refeeding strategy,but no signs of i mprovements were noticed as 17 % of H2 was sti l l in the outlet after 7 h. This significant difference was a clear result of proper implementation of a r efeeding strategy. A shorter downtime was tested with no refeeding strategy (Fi g . 3c )and peaked with 10.1 % H2 in the outlet, whereas the gradually increasing H2 input reduced this peak t o 4.4 % H2 i n the product gas.Bes i des this, the t i me to regain <0.5% H2 in the outlet was reduced with >3 h, as 0.4%H2 was achieved 5 h after refeeding (F ig .3d) while after 7h the H2 concentration was st i ll 2.6 % without a refeeding strategy (F i g . 3c). The comparison of all resul t s from Fi g. 3 highl i ghted the i n-fluence and importance of opt i mizing the r efeeding strategy. 3.2. Validation of pilot scale results With the overall objective of t his study to validate the use of BTFs for biomethanation in larger scales, the results obtained i n this study needs to be compared with laboratory scale studies. To meet t his target, t he laboratory studies from the groups within this project were used (Ashr a f e t a l ., 2021, 2020; D a h l J on son e t al., 2020; E b r a him i a n e t a l ., 2022;G h o f r a ni-Is f ahani e t al ., 2022; J on so n et al ., 2022; T sap ek o s e t al .,2021). The studies were all precursor to this pilot-scale study. All studies were of laboratory scales ranging between 0.8 L and 8 L of packed volume, besides T sa p e k o s e t a l. (2021) which was of semi-pilot scale at 68.8 L packed volume. The laboratory studies used an artificial biogas composition, whereas T sap ekos e t a l. (2021) and this study, both used real biogas as f eed. 3.2.1. Non-enriched inoculum vs pre-enriched inoculum The method for inoculation differ s between the studies presented.The inoculum used for inoculation i n the studies of A s h r afe t a l. (2020),Gh o f ra n i-Is f a h ani et a l . (2022), Ebra hi mian e t al . (2022) and Tsa p ek os et a l. (2021) was pre-enriched i noculum for hydrogenotrophic metha-nogens in a two-stage system from Bas sa ni e t al . (2015). The method for inoculation of the BTFs i n these studies were by trickl i ng. This study,J on so n e t al . (2022), D a h l J o nson et a l. (2020), and A s hraf et al. (2021)used non-enriched inoculum (direct inoculation), which was liquid fraction of digestate from full-scale biogas plants, and t he inoculation methods were both trickling and f looding.ng· As this study was focused on the potential of biomethanation i n a BTF for larger scale operations, the enrichment phase was important. For larger scale operations, to pre-enrich i noculum with the same method as used for the studies of A s h raf e t a l. (2020), G hof ra ni-Is f a ha n i e t al.(2022), Ebr a hi m ia n e t a l. (2022) a nd Ts a pekos et al . (2021) would be expensive in terms of operat i ng cost and t ime. Using a direct inoculation with non-enriched inoculum would reduce the expenses f or enrichment of the BTF. Comparing the pre-enriched and non-enriched studies, it was found that the pre-enriched BTF would require between 7 and 16 days in the BTF to reach >90 % CH4 i n t he product gas. Including the time period for the pre-enrichment period from B a ssani et al . (2015), which was 35 days for thermophilic enrichment, the total enrichment time would take between 42 and 51 days to reach >90 % CHa in the outlet of a BTF. With the non-enriched i noculum used in this study, J ons o n et al .(2022), Dahl J o nson e t al . (2020), and As h raf et al. (2021) the threshold of >90 % CH4 in the outlet was reached within 5 to 25 days, which have halved the total time for the enrichment process. The same results were found in (D ah l Jon so n e t al., 2020), and it has now been proven to f i t for larger scale biomethanation i n BTF by this study. It should be mentioned that the inoculum taken from B ass a n i e t al . (2015) was enriched in planktonic environment and grown at GRTs above 10 h. In the present study, significantly higher gas rates were fed to achieve the targeted GRTs (<0.5 h) and , the uti l ized BTFs utilized that rely on biofilm for-mation which is a completely di f ferent reactor design. Thus, the microbiomes at the studies of Ashr a f e t a l . (2020), Ghof rani-I sfahani et al. (2022), E bra himian et al . (2022) an d Tsape k o s e t al . (2021)were subjected to more intense operating conditions and completely different environment (i.e., from planktonic to biofi l m) l eading to relat i vely prolonged lag phase. Nevertheless, high biomethanat i on was achieved in all t he cited studies of this project. On t he long run, syn-trophic associations of bacterial and archaeal strains accelerated biofilm formation through the secretion of extracellular polysaccharides aided by both microbial groups. Hence, archaeal strains were enriched over time at the packing materials and strong biofilm was formed to achieve the increased production capaci t ies. The enrichment process chosen for f uture large scale biomethanation i n BTF should be of direct enrichment.This saves operational costs of keeping larger volumes of pre-enriched inoculum active, performance would be equal in long term operation and enrichment t ime would be faster. 3.2.2. Flooding or trickling for inoculation Flooding of a BTF has been proved to be an effective strategy for supplying nutrients at high concentrations i n the packing material (A s h ra f et al ., 2021). However, it also had negat i ve i mpacts on the steady performance afterwards compared to trickling, due to thicker water f ilm formation from f looding. Applying this knowledge to i nocu-lation of a BTF, the f looding would ensure even distribution of inoculum on the packing material and at a faster rate t han t rickling. Flooding was applied for inoculation in the present study as well as J onson e t a l.(2022). Enrichment periods were observed varying between 10 and 14days, respectively, before reaching >90 % CH4. Comparing t his s trategy to the inoculation with t rickling (section 3.3) the outlet reached >90 %CH4 after 5 days, having a similar performance with the Tsa pe kos e t al.(2021) study which also used t rickl i ng for i noculation, and reached>90% CH4 within 7 days after inoculation using a pre-enriched inoculum.The studies of D ahl J o ns o n et a l. (2020) a nd A s h r af et al . (2021) also used trickling and non-enriched i noculum and they reported a need of 25 and 22 days to reach >90 % CHa i n t he outlet, respectively. This shows that inoculation by flooding in this study resulted in a 3-to 4-fold reduction in the time needed for enrichment of the BTF as compared to lab-scale studies that used i noculat i on by trickl i ng. For the i noculation using t rickling in this study (section 3.3), i t should be noted that the packing material (PE08) was previously used but has been cleaned with water. This could leave residues of i nact i ve hydrogenotrophic metha-nogens or bacteria that can biosynthesise extracellular polymeric sub-stances and improve the biofilm formation on t he packing material ,which could improve the enrichment period, decreasing the time needed to reach >90 % CH4 i n the outlet. Relat i ng the i noculation process to larger scale operation, the trickl i ng would be preferable over flooding.Flooding a large scale BTF would result a large water pressure at the bottom of the BTF, which would require more expensive materials,higher operating costs, and more strict safety measurements. Based on the results discussed, there was no substantial difference between flooding and tr i ckling during i noculation to reach>90 % CH4, but with the requirements of separate tanks, extra pumps, and piping for culture when flooding larger scale BTF, t r ickling would be t he preferable method for inoculation in larger scales. 3.2.3. Buffer capacity i n nutrient supply For most DTU and SDU studies, the nutrient supply was from a biologically origin (i.e ., digested manure and pasteurized manure) while only T s ape k os et a l. (2021) exploited the effluent of an anaerobic digestion (AD) reactor fed with source separated municipal biowaste.Digested manure contains al l needed nutrients, both macro-nutrients and trace elements (Aw a i s e t a l., 2016) along with natural occurring buffer capacity (We s t e r h ol m et a l ., 2012). Also, all the essential nutri-ents were available in the digested biowaste (K ho s hnevi sa n e t a l ., 2018)and no shortage of the essential elements was detected during ex-situ upgrading tests (Tsapekos e t al ., 2021). Comparing the present work in which the nutrient supply was artificial , consisting of N +P+ K and trace elements (Fe, Mn, Mo, Cu, etc.), the major di f ference was the missing buffer capacity. The consequence of the limited buffering ca-pacity was seen from day 201 to 210 (Fi g. 2), when the outlet concen-tration dropped from 96.1 % CH4 to 85.3 % CH4 at day 204 before returning to 95.5 % CH4 at day 210. The drop in CH4 was found to be related to a loss of buffer capacity i n the BTFs due to dilution from H2O produced (Eq. (1)) along with no addition of buffer capacity to the system. A simila r drop i n CH4 was found for Ash ra fe t a l . (2021) where i t was l inked to insufficient amounts of NH4 and Fe, but t his was available for this study. After this period, regular addition of decanted l iquid from Nature Energy Videbak A/S was followed to ensure sufficient buffer capacity for the biomethanation process, which would also function as a re-inoculation due to the continuously addition of new microorganisms.Subsequently, a positive effect on t he performance stability was detected after day 210 (F ig. 2). The microorganisms added weekl y were of same origin as the i noculum used, which showed signs of being beneficial towards performance stability. 3.2.4. Performance parameters (Gas supply, GRT, steady state, PC, purity)Studies of J o ns o n et a l. (2022), Gh o fr a ni -Is f a hani e t a l. (2022),E b ra h i m i an e t al . (2022), A s h ra fet a l . (2020), D a hl J on s o n e t a l . (2020),and A s hraf et al . (2021) all used bot t led dry gases of >99.9 % purity,without any impurities. The study of T sa p e k os et al . (2021) was implemented on a biogas plant using biogas after H2S removal. A key parameter in t he present study was the use of raw and saturated biogas containing 3000 ppm H2S, volatile organic compounds and other trace gasses (Ryck e bo s ch e t a l., 2011). Securing a wel l-performing process at such conditions would be beneficial in larger scale biomethanation implemented on a full-scale biogas plant, as the need f or t raditional biogas upgrading f or removal of CO2 would be reduced. The H2S would still need to be removed. It is wor t h mentioning that alternative technologies, which are avai l able in high technological readiness level, explored pure autotro-phic archaeal cultures to optimize biomethanat i on (We g ener Ko f o e d e t a l ., 2021). Previously, a similar technical study examined the scaling-up of biomethanation from lab to field growing Methanothermobacter thermoautotrophicus (Th ema e t al., 2021). However, the study was only demonstrated using chemicals of analy t ical grade as nutrients and gases of high purity. Thus, the robustness of the monoculture at real condi-tions ut i l i zing gas and l iquid streams from a biogas plant as a source of CO2 and nutrients, respectively, cannot be concluded. In contrast, the present technology utilizes naturally evolved microbes prevailing in biogas plants that can efficiently couple CO2 from biogas with renewable H2 and ut il ize digestate as nutrients source. Indeed, robust microbiomes were evolved handling gas impurities, pH variation, al t ernation of nu-trients 'content and without the need for sterile conditions. Furthermore, when comparing the present research to the studies using bottled gas, there have been no significant differences i n t he ob-tained GRT at steady state operation. This study has been operated at a GRT of 20 min with steady state performance (Fi g. 2), whereas Ebr a himi an et al. (2022) and As hr a f et a l. (2021) have been operated at 21 min and 25.7 min, respectively, with steady state operation. The studies of J o n so n e t a l (2022), Ebra h imia n e t al . (2022), A s h r af et al.(2021), and this study, all used the same packing material (PE08), had different reactor dimensions, but reached similar PCs of 7.0 (As hr af e t a l ., 2021) to 9.44 (this study) m? mctor dayl with purities of 90.4% CH4 to 98.9 % CH4, respectively. During the serial operation i n this study, an improved overall PC of 10.6±0.6 m3 m-3c. day-1 at 97.4±1.4% was reached, with a specific c PC of 116.8±2.6 m m-3 day-1 with 89.0 ± 4.6% CH4. The specific PC of t his study was near the obtained PC for the study of St r i ibi n g e t a l . (2017) of 15.4m3 m3c tor day1 at 98.5 % CH4 but did have significant lower CH4 in the product gas. A reasoning for this could be the GRT which have been lower for thi s study as raw biogas was used, while St rub i n g e t a l.(2017) ut i lized a mixture of pure CO2 and H2 only. With a gas grid quality requirement of +97 % CH4 in Denmark (Erhve r v s mi n i st e r i et - Sikkerhe d s s ty r el se n, 2018) these studies reached a steady state operation where the product gas would r equire minimal gas upgrading for injection to the gas grid. Comparing the GRTs, PCs,and purities, i t is proven that this study has val i dated the results found in lab. This shows great potential for the performance of biomethanation i n larger scales, and how i mplementable i t would be to a raw biogas supply. 3.2.5. pH and VFA concentrations With discussed steady state operation and performance, pH and VFA concentrations can be used as process indicators to retain stability. The most common VFA to measure i n biomethanation have been r eported to be acetate, as it is also a product of CO2 and H2, while propionate i s also accumulated at high partial pressure of H2. During the parallel and serial operation i n t his study a pH of 8.47 ±0.5 was obtained, which was i n the range of t he previously mentioned studies which were in the range of 7.57 ±0.2(Ghof ra ni -I s f a han i et al .,2022) to 8.67 ±0.1 (J on s o n e t al ., 2022). These pH l evels are neutral and within the known pH optimum for methanogenesis of pH 6.5-8.5.During this study, a high VFA concent r at i on of 2.12 ± 0.7 gvFA L- was obtained in contrast to the studies of As hr a f e t a l . (2020; 2021) which reached 0.07 and 0.09, respectively. The high VFA could l imit the methanogenesis by VFA inhibi t ion, but the content of acetate in this study was found to be lower than i n t he studies of Gho f r a n i -I sf ah a ni et a l . (2022) and D ahl J onso n et al. (2020) at 0.51±0.3 gAcetate L-1compared to 1.43±0.3 and 1.55 ± 0.1 gAcetate L", respectively. This could indicate t hat the obtained VFA did not inhibi t the methanogenesis during this study. The pH i n t he sump is affected by the VFA concen-tration as increased concentration of these acids can lower the pH. pHin the sump is connected to the carbonate buffer which is affected by the CO2 partial pressure over the sump (Bassan i et a l ., 2015; S a vvas et a l .,2017), which in the case of co-flow operation is the CO2 content at the outlet of the reactor. A lower CO2 partial pressure can lower t he car-bonate and bicarbonate concentrations in the sump causing an increase in the pH. One way to keep the pH from increasing is maintaining the carbonate buffer by keeping the H2 to CO2 ratio slightly lower than the stoichiometr i c value of 4:1 (A s h r af e t a l ., 2020). The H2 to CO2 r atio used for the pilot-scale unit in this study was 3.8:1 and on average the pH remained lower than 8.5. These results are alike the lab-scale studies where a long-term operation wi t h pH lower than 8.5 was achieved by using H2 to CO2 ratio of 3.8:1 (As hr a f e t a l ., 2021;2020). Regarding VFA, a part of the gaseous feedstock can be driven to-wards acetate at H2/CO2 fuelled reactors (Li u e t a l ., 2016). Indeed,acet i c acid was accumulated in the studies of G ho f r a ni -Is fah a n i et a l.(2022), Ebrahim i an e t al . (2022) and T s apeko s et al . (2021) in periods with decreased biomethanation efficiency, while in this study no per-formance instability was observed with the accumulated acetic acid. In addition, propionic acid -which demands a l ow H2 partial pressure f or its oxidation - is considered as stress indicator (T sa pek o s e t a l., 2022).With the continuously addition of new decanted l iquid, a mixed culture is added to the system. In the effluent of a biogas reactor, propionate could be found as process intermediate from the function of AD micro-biome. During non-efficient ex-situ methanogenesis, H2 can remain non-utilized, and this wi l l enhance t he accumulat i on of propionate due to non-favourable thermodynamic conditions (G uo et al ., 2021). Its degradation requires a syntropy between propionate-oxidizing bacteria and hydrogenotrophic archaea. However, high H2 partial pressure i n-hibits this syntropy result i ng in propionate accumulation (Xu et al.,2016). The degradation can be t hermodynamically restricted by high H2concentrations and so, the propionate will accumulate. In accordance,propionic acid was the second most abundant VFA in the studies of G h o f r ani -I s f a h ani et al. (2022) a nd Ts a pe kos et a l . (2021), while also being the most abundant i n this study. 3.2.6. Flexibility towards an intermittent energy system With validation of laboratory results in t he pilot scale and showing the potential for biomethanation in larger scales, the successful scal-abil i ty of dynamic operation was needed. While the steady-state oper-ation of pilot scale biomethanation in BTFs indicated the technology would return to initial performance after variating downtimes at day 196, 230, 250, there was sti l l a need to control and optimize these pe-riods. To compare the scalabi l ity and dynamic operation i n this study,T a b l e 1 shows a comparison with other studies investigating dynamic operation. The f lexibility obtained i n this study have been comparable to mul-tiple laboratory studies. Tsa pe kos et a l . (2021) does not directly compare but do show the potential of having downtimes of a higher order downtime periods. The downside would be the prolonged time to regain performance, but this could be optimized with a refeeding strategy. Comparing the study 24-hour controlled downtime in t his study,using the same refeeding strategy as both St r i i bi n g e t al. (2019) a nd Jon so n et a l . (2022), i t was observed that pilot scale needed significantly longer time to regain performance (i.e., magnitude of 2-fold to 4.5-fold in time). This observation could the attributed to several reasons. The first one being the GRT of the di f ferent systems. This study had 20 min GRT which was around hal f of the value used i n J ons on et a l. (2022)which had 45 min. Thereby, the feed loading of t his study was higher,which could be a reasoning of the longer time needed to r egain per -formance. S t r ubi ng et a l . (2018) had a cooled downt i me and a normal operating temperature downtime, which both regained faster than i n the present study. While the refeeding method was identical for this study,during the downtime of the 24 h, the constant t r ickl i ng of both BTFs was kept on. This error led to a difference between t he full l aboratory method used in Jo n son e t a l. (2022), semi -pilot study of St ri ibi n g e t a l.(2019) and this pilot-scale study. This could be the reasoning for the unexpected result f rom the 24-hour downtime. Further testing would be needed to validate if this was the reasoning. Another impact could be the time of steady-state operation for the matur i ng of t he biofilm and adaptation to the f eed load. Downtimes were performed at day 196, 230and 250 in this study, after 150 days of operation in Jo nson et al . (2022)and 86 days of operation in Striibing et al. (2021). All t hese studies are of comparable maturing, as the lowest of 86 days have been operated for almost 3 months, which would be relative long t i me to mature a biofilm,as enrichment periods previously have been shown to vary between 7and 25 days. Therefore, the maturity of the biofilm was not seen as a reasoning for the unexpected resul t s in t his pilot scale study. The f lexibility of biomethanation and dynamic operation have been demonstrated within this study in larger pi l ot scale. While there have been found areas which needs further investigation and improvements,these results do show the great potential of this technology. 3.3. Assessment of pilot scale study While the performance of the technology has been shown and dis-cussed the cost aspects of this type of technology has not been mentioned. With this technology utilizing H2 produced from electricity t hrough e.g., an alkal i ne electrolysis, the produced H2 can vary a lot i n price, depending on t he electrical spot prices. Along with the known low efficiency of alkaline electrolysis, a loss of energy is present. Combining this with the natural gas prices, thi s technology is of a low i nterest , i n the aspects of the cost versus the product. Therefore, this technology could also be limited to area where electricity is of low enough price and/or the selling price of the biomethane is favourable. To assess the performance of biomethanation in larger pilot scale,lab-based results have been compared and do validate the scalabilit y and great potentia l of conducting biomethanation in BTF for future Power-to-X solutions. Nevertheless, there are some areas which needs more in-depth research and development for larger scale operations, to ensure more scalability within the methods used. (i ) An area could be deeper understanding for nutrient requirements, with focus on which specif-ically are the needs for the hydrogenotrophic methanogens and how the nutrient supply could be optimized. Despite the present study demon-strated the use of commercial NPK and micronutrients solutions, opti-mization of the dosage is st il l needed. (ii ) Another area of focus would be opt i mization of the methods used for dynamic operations. This study demonstrated that the previously found optimized refeeding strategy (St r uibi n g e t al ., 2019) of H2 after downtime periods did not have the same response time as in other studies (J on son e t a l ., 2022; St ru bing e t a l., 2019; 2018), this could be due to constant t rickl i ng which would need further test i ng. The method also resulted in a higher H2 output compared to legislation (Er h v e rv sm i nis ter ie t - Sik k e r he ds s ty re l s e n,2018). This was improved with testing of another refeeding strategy which decreased the H2 in the product gas with a 2.3-fold and was low concentration enough to not interfere with legislations. Research on these areas could contribute towards up scaling of t his technology even further. 4. Conclusions This study successfully demonstrated the i mplementat i on of a pilot-scale biomethanation system into a full-scale biogas plant for biogas upgrading. The operation and results obtained were validated by com-parison with laboratory results. Under steady state and with GRT of 20min a PC of approx. 10 m3 mactor dayl was achieved with output gas quality matching the grid requirements of methane composition. The flexibility and dynamic operation of the technology was successfully demonstrated and showed the potent i al for i mplementation of l arger scale biomethanation i n an intermittent energy system, such as solar or wind powered electrolysers. Funding The author was grateful that this study was financially supported by Table 1 Comparison of studies with investigated dynamic operation. The results i nvestigated was the length of downt i me along with t i me needed to reach i nitial performance. Ref. This study This study Tsapekos et al., 2021 Striibing et al., 2018 Struibing et al., 2019 Jonson et al., 2022 Downtime [h] 12-72 24 600 1800 24 24 24 24 Temperature [C] 52-57 52-57 52 8-12 25 55 25 52 Time to regain [h] 6-12 7 >120 >120 3.1 4.7 2 1.5 the project “eFuel -Electrofuel from a bio-t rickling filter", which is a Energiteknologisk Udviklings- og Demonstrationsprogram (EUDP)project (Project ID 64018-0559). CRediT authorship contribution statement Brian Dahl Jonson: Conceptual i zation, Data curation, Formal analysis, Investigation, Methodology, Validation, Visualization, Writing - original draft, Writing -review & edit i ng. Panagiotis Tsapekos: Data curation, Visualization, Writing - original draft, Writing - review &editing. Muhammed Tahir Ashraf: Data curation, Visualization,Writing - original draft, Wri t ing - review & editing. Martin Jeppesen:Conceptual i zation, Methodology, Supervision, Writ i ng - review &editing. Jens Ejbye Schmidt: Supervision, Writing - review & edit i ng.Juan-Rodrigo Bastidas-Oyanedel: Supervision, Writing - review &editing. Declaration of Competing Interest The authors declare that they have no known competing financial interest s or persona l relationships that could have appeared to i nfluence the work reported in t his paper. Data availability Data will be made available on request. Acknowledgments An exceptional acknowledgement goes to Biogasclean A/S for their help and assistance in bui l ding and operating the pi l ot scale unit. CEO Thorkild Dahlgreen and technical employee Jan Thomsen have done an extraordinary effort to make the project a reality with t heir k nowledge and work during this study. References Abohamzeh, E ., Salehi, F., Sheikholeslami, M., Abbassi , R., Khan, F ., 2021. Review of hydrogen safety during storage, transmission, and applications processes. J . Loss Prev. Process Ind. 72, 104569 h t tp s://d o i.o r g/10.1016/J .JL P.2021.104569. Aramrueang, N., Rapport, J., Zhang, R., 2016. Effects of hydraulic r etention t i me and organic loading rate on performance and stability of anaerobic digestion of Spirulina platensis. Biosyst. Eng. 147, 174-182. htt ps ://do i .org/10.1016/J.B I O S YST EM S E NG.2016.04.006. Ashraf, M.T., Sieborg, M.U., Yde, L ., Rhee, C ., Shin, S.G., Tr i olo, J .M., 2020.Biomethanation i n a t hermophilic biotrickling fil t er 一 pH control and lessons f rom long-term operation. Bioresour. Technol. Rep. 11, 100525 h t tps ://doi.o rg/10.1016/J .BI TEB .2020.100525. Ashraf, M.T., Yde, L., Triolo, J.M., Wenzel, H., 2021. Opt i miz i ng the dosing and trickling of nutrient media for thermophilic biomethanation i n a biotric k ling f ilter. Biochem.Eng . J. 176, 108220 htt ps://d o i.or g/10.1016/j .bej .2021.108220. Asimakopoulos, K., Kaufmann-Elfang, M., Lundholm-Hoffner, C ., Rasmussen, N.B.K.,Grimalt-Alemany, A., Gavala , H.N ., Skiadas, I ., v.,, 2021. Scale up study of a thermophilic trickle bed reactor performing syngas biomethanation. Appl. Energy 290,116771. h t tps://d o i.org/10.1016/J .APENER G Y.2021.116771. Awais, M., Alvarado-Morales, M., Tsapekos, P., Gulfraz, M., Angelidaki, I ., 2016.Methane production and kinetic model i ng f or co-digestion of manure with lignocellulosic residues. Energy Fuels 30, 10516-10523. h t tps://doi .o rg/10.1021/AC S .E NE R G Y FUELS.6B O2105. Babaee, A., Shayegan, J., 2011. Effect of Organic Loading Rates (OLR) on Production of Methane from Anaerobic Digestion of Vegetables Waste. Proceedings of the World Renewable Energy Congress -Sweden, 8-13 May, 2011, Linkoping, Sweden 57,411-417.10.3384/ECP11057411. Bassani, I., Kougias, P.G., Treu, L., Angelidaki, I ., 2015. Biogas upgrading via hydrogenotrophic methanogenesis in two-stage continuous sti r red t ank reactor s at mesophi l ic and thermophil i c conditions. Environ. Sci . Technol . h t t p s://d o i .o rg/10.1021/a c s.e st.5b03451. Cheng, G., Gabler, F ., Pizzul , L, Olsson, H., Nordberg, A., S chntirer, A., 2022. Microbial community development dur i ng syngas methanation i n a t r ickle bed r eactor with various nutrient sources. Appl. Microbiol. Biotechnol. 106 (13), 5317-5333. h t tp s://doi.or g/10.1007/S00253-022-12035-5. European Commission, 2020a. 2030 Climate Target Plan [WWW Document]. URL h t t ps ://ec .eu r opa .eu/clima/eu -act i on/eu r opean-green-deal /2030-clima t e-t arge t -p l an _en (accessed 5.31.22). European Commission , 2020b. 2050 l ong-term strategy [wWW Document]. URL htt ps://e c .e u ropa.eu/c l i ma /eu-ac t i on /c l i m a t e-str ateg i es-t a r ge t s/2050-l on g -term-s t r a t e g y _e n (accessed 5.31.22). 8Y Dahl Jonson, B., Ujarak Sieborg, M., Tahir Ashraf, M., Yde, L., Shin, J ., Shin, S.G., Mi Tr i olo, J ., 2020. Direct inoculation of a biot r ickl i ng fi l ter for hydrogenotrophic methanogenesis. Bioresour. Technol . 318, 124098 htt p s://doi.org/10.1016/j.bi o r t e ch .2020.124098. Dupnock, T.L ., Deshusses, M.A., 2017. High-performance biogas upgrading using a biotrickling filter and hydrogenotrophic methanogens. Appl. Biochem. Biotechnol.183, 488-502. ht tps ://doi .or g/10.1007/s 12010-017-2569-2. Ebrahimian, F., de Bernardini , N., Tsapekos, P., Treu, L., Zhu, X., Campanaro, S.,Karimi, K., Angelidaki , I ., 2022. Effect of pressure on biomethanation process and spatial strati f i cation of microbial communities in trickle bed reactors under decreasing gas retention time. Bioresour. Technol. 361, 127701 htt p s://doi.o r g /10.1016/J.B I O RT EC H .2022.127701. E l ectrochaea, 2022. E l ectrochaea GmbH-Power-to-Gas Energy Storage| T echnology [WWW Document]. URL h t tps://www.e l ec t r ochaea.com/tec hn ol o gy / (accessed 10.6.22). Ghofrani-Isfahani, P., Tsapekos, P., Peprah, M., Kougias, P., Zervas, A., Zhu, X., Yang, Z.,Jacobsen, C.S., Angelidaki, I., 2022. Ex-situ biogas upgrading i n the r mophili c trickle bed reactors packed with micro-porous packing materials. Chemosphere 296,133987. h t tp s://doi .o r g/10.1016/J.CH EMO S P HE RE .2022.133987. Guo, B., Zhang, Y., Yu, N., Liu, Y., 2021. I mpact s of conduct i ve materials on microbial community during syntrophic propionate oxidi z ation for biomethane r ecover y .Water Environ. Res. 93,84-93. h t tps ://doi .org/10.1002/WER.1357. Jonson, B.D., Mortensen, L .O.L ., Schmidt , J .E ., Jeppesen, M., Bastidas-Oyanedel , J .-R.,2022. F l exibi li ty as the key to stabi li ty: optimization of temperature and gas feed during downtime towards e f fective i ntegration of b iomethanation i n a n intermittent energy system. Energies 15, 5827. h t tps ://d o i .org/10.3390/E N15165827. Khoshnevisan , B., Tsapekos, P., Alvarado-Morales, M., Angelidaki, I ., 2018. Process performance and mode l l i ng of anaerobi c digestion using source -sorted or g anic household waste . Bioresour . Technol . 247, 486-495. https ://doi .o rg/10.1016/J .B I OR T ECH .2017.09.122. Lemmer, A., U l lrich , T., 2018. Effect of different operating temperatures on the biological hydrogen methanat i on i n t ri ckle bed r eactors. Energies 11,1344. h t tp s://d o i .org/10.3390/EN11061344. Liu, R., Hao, X., Wei , J., 2016. Function of homoacetogenesi s on t he heterotrophic methane production with exogenous H2/CO2 involved. Chem. Eng. J. 284,ony 1196-1203. htt ps://doi .o r g/10.1016/J .CEJ .2015.09.081. Ryckebosch, E., Droui l lon, M., Vervaeren, H., 2011. Techniques f or t ransformation of biogas to biomethane. Biomass Bioenergy 35, 1633-1645. h t t ps://d oi .o r g /10.1016/J.B IO MB I OE.2011.02.033. Savvas, S., Donnelly, J., Patterson, T.P., Dinsdale, R., Esteves, S.R., 2017. Closed nutrient recyc l ing via microbial catabol i sm in an eco-engineered self r egenerating mixed anaerobic microbiome for hydrogenotrophic methanogenesis. Bioresour. Technol.227, 93-101. h t tp s ://do i .org /10.1016/j.biortech .2016.12.052. Erhvervsministeriet -Sikkerhedsstyrelsen, 2018. Bekendtgorelse om gaskvalitet, BEK nr 230 af 21/03/2018 [WWW Document]. URL h t tp s://www.retsi nf ormation.d k/el i/l t a /2018/230 (accessed 8.15.22). Strubing, D., Huber, B., Lebuhn, M., Drewes, J.E., Koch, K., 2017. High per f ormance biologica l methanation i n a thermophi l ic anaerobic trickle bed reactor. Bioresour.Technol . 245, 1176-1183. h t tps ://doi.org/10.1016/j .biortec h.2017.08.088. St ri ibing, D., Moeller, A.B., MoBnang, B., Lebuhn, M., Drewes, J.E., Koch, K., 2018.Anaerobic thermophilic trickle bed reactor as a promising technology for f lexible and demand-oriented H2/CO2 biomethanation. Appl. Energy 232, 543-554. h t t ps://doi .org /10.1016/j.a p en e rg y .2018.09.225. St r ubing, D., Moeller, A.B., MoBnang, B., Lebuhn, M.,Drewes, J .E., K oc h , K., 2019. Load change capabi li ty of an anaerobic thermophilic trickl e bed reactor for dynamic H2/CO2 biomethanation. Bioresour. Technol. 289,121735 h t t p s://doi .o rg/10.1016/j .b i o rt ec h .2019.121735. Thema, M., Weidlich, T., Kaul, A., Bollmann, A., Huber, H., Bellack, A., Karl, J .,Sterner, M., 2021. Optimized biological CO2-me t hanation with a pure cul t ure of thermophilic methanogenic archaea in a trickle-bed reactor. Bioresour . Technol.333,125135 htt ps://d o i .o r g/10.1016/J.B I ORTE CH .2021.125135 Tsapekos, P., Treu, L., Campanaro, S., Centurion, V.B., Zhu, X., Peprah, M., Zhang, Z.,Kougias, P.G., Angel i daki, I ., 2021. Pi l ot-scal e biomethanation in a trickle bed reactor: pro 9c C ess performance and microbiome f unctional r econstruction. Energy Convers. Manag . 244, 114491 htt ps ://doi .o r g/10.1016/J .EN CO NMAN.2021.114491. Tsapekos, P., Alvarado-Morales, M., Angel i daki, I ., 2022. H2 competit i on between homoacetogenic bacte r ia and methanogenic archaea during biomethanation from a combined experimental-modell i ng approach. J . Environ. Chem. Eng. 10, 107281https://doi .org/10.1016/J .J ECE.2022.107281. United Nations Framework Convention on Climate Change (UNFCC), 2015. The Paris Agreement [WWW Document]. accessed 5.30.22. h ttps://u nf cc c .in t /p ro c ess-and-mee t i ngs /t he -pa r is -ag r eemen t /t he-pa r is -agr e e m en t. Wegener Kofoed, M.V., Jensen, M.B., Morck Ottosen, L .D., 2021. Biological upgrading of biogas t hrough CO2 conversion to CH4. Eme r g. Technol . Biol. Syst. B iogas Upgrading 321-362. h t t p s://do i .org /10.1016/B978-0-12-822808-1.00012-X . Westerholm, M., Hansson, M., Schniirer, A., 2012. Improved biogas product i on from whole st il lage by co-digestion wi t h cat t le manure . Bioresour. Technol. 114,314-319.https ://do i.org/10.1016/J .B IORT E CH .2012.03.005. Wijekoon, K.C., Visvanathan, C., Abeynayaka, A., 2011. Effect of organic loading rate on VFA production, organic matter removal and microbial activity of a two-stage thermophi l ic anaerobic membrane bioreactor. Bioresour. Technol. 102, 5353-5360.h t tps ://d o i .org/10.1016/J .BIO RTECH .2010.12.081. Xu, H., Wang, C., Yan, K., Wu, J., Zuo, J., Wang, K., 2016. Anaerobic granule-based biofilms formation reduces propionate accumulation under high H2 partial pressure using conductive carbon felt particles. Bioresour . Technol. 216, 677-683. h t tps ://doi.org /10.1016/J.B I O RT EC H .2016.06.010. Younas, M., Kong, L.L., Bashir , M.J.K., Nadeem, H., Shehzad, A., Sethupathi, S., 2016.Recent advancements, f undamenta l challenges, and oppor t unities i n catalytic PDO H methanation of CO2. Energy Fuels 30, 88158831.ht t p s://doi.org/10.1021/ACS.ENER GYFU ELS.6B01723.
确定


还剩8页未读,是否继续阅读?

产品配置单
中国格哈特为您提供《沼液中NH4+氨含量的检测》,该方案主要用于生物能源中NH4+氨检测,参考标准--,《沼液中NH4+氨含量的检测》用到的仪器有格哈特带自动进样器凯氏定氮仪VAP500C
推荐专场


相关方案
更多
该厂商其他方案
更多