


方案详情
文
测量不同巧克力的吸收光谱
方案详情

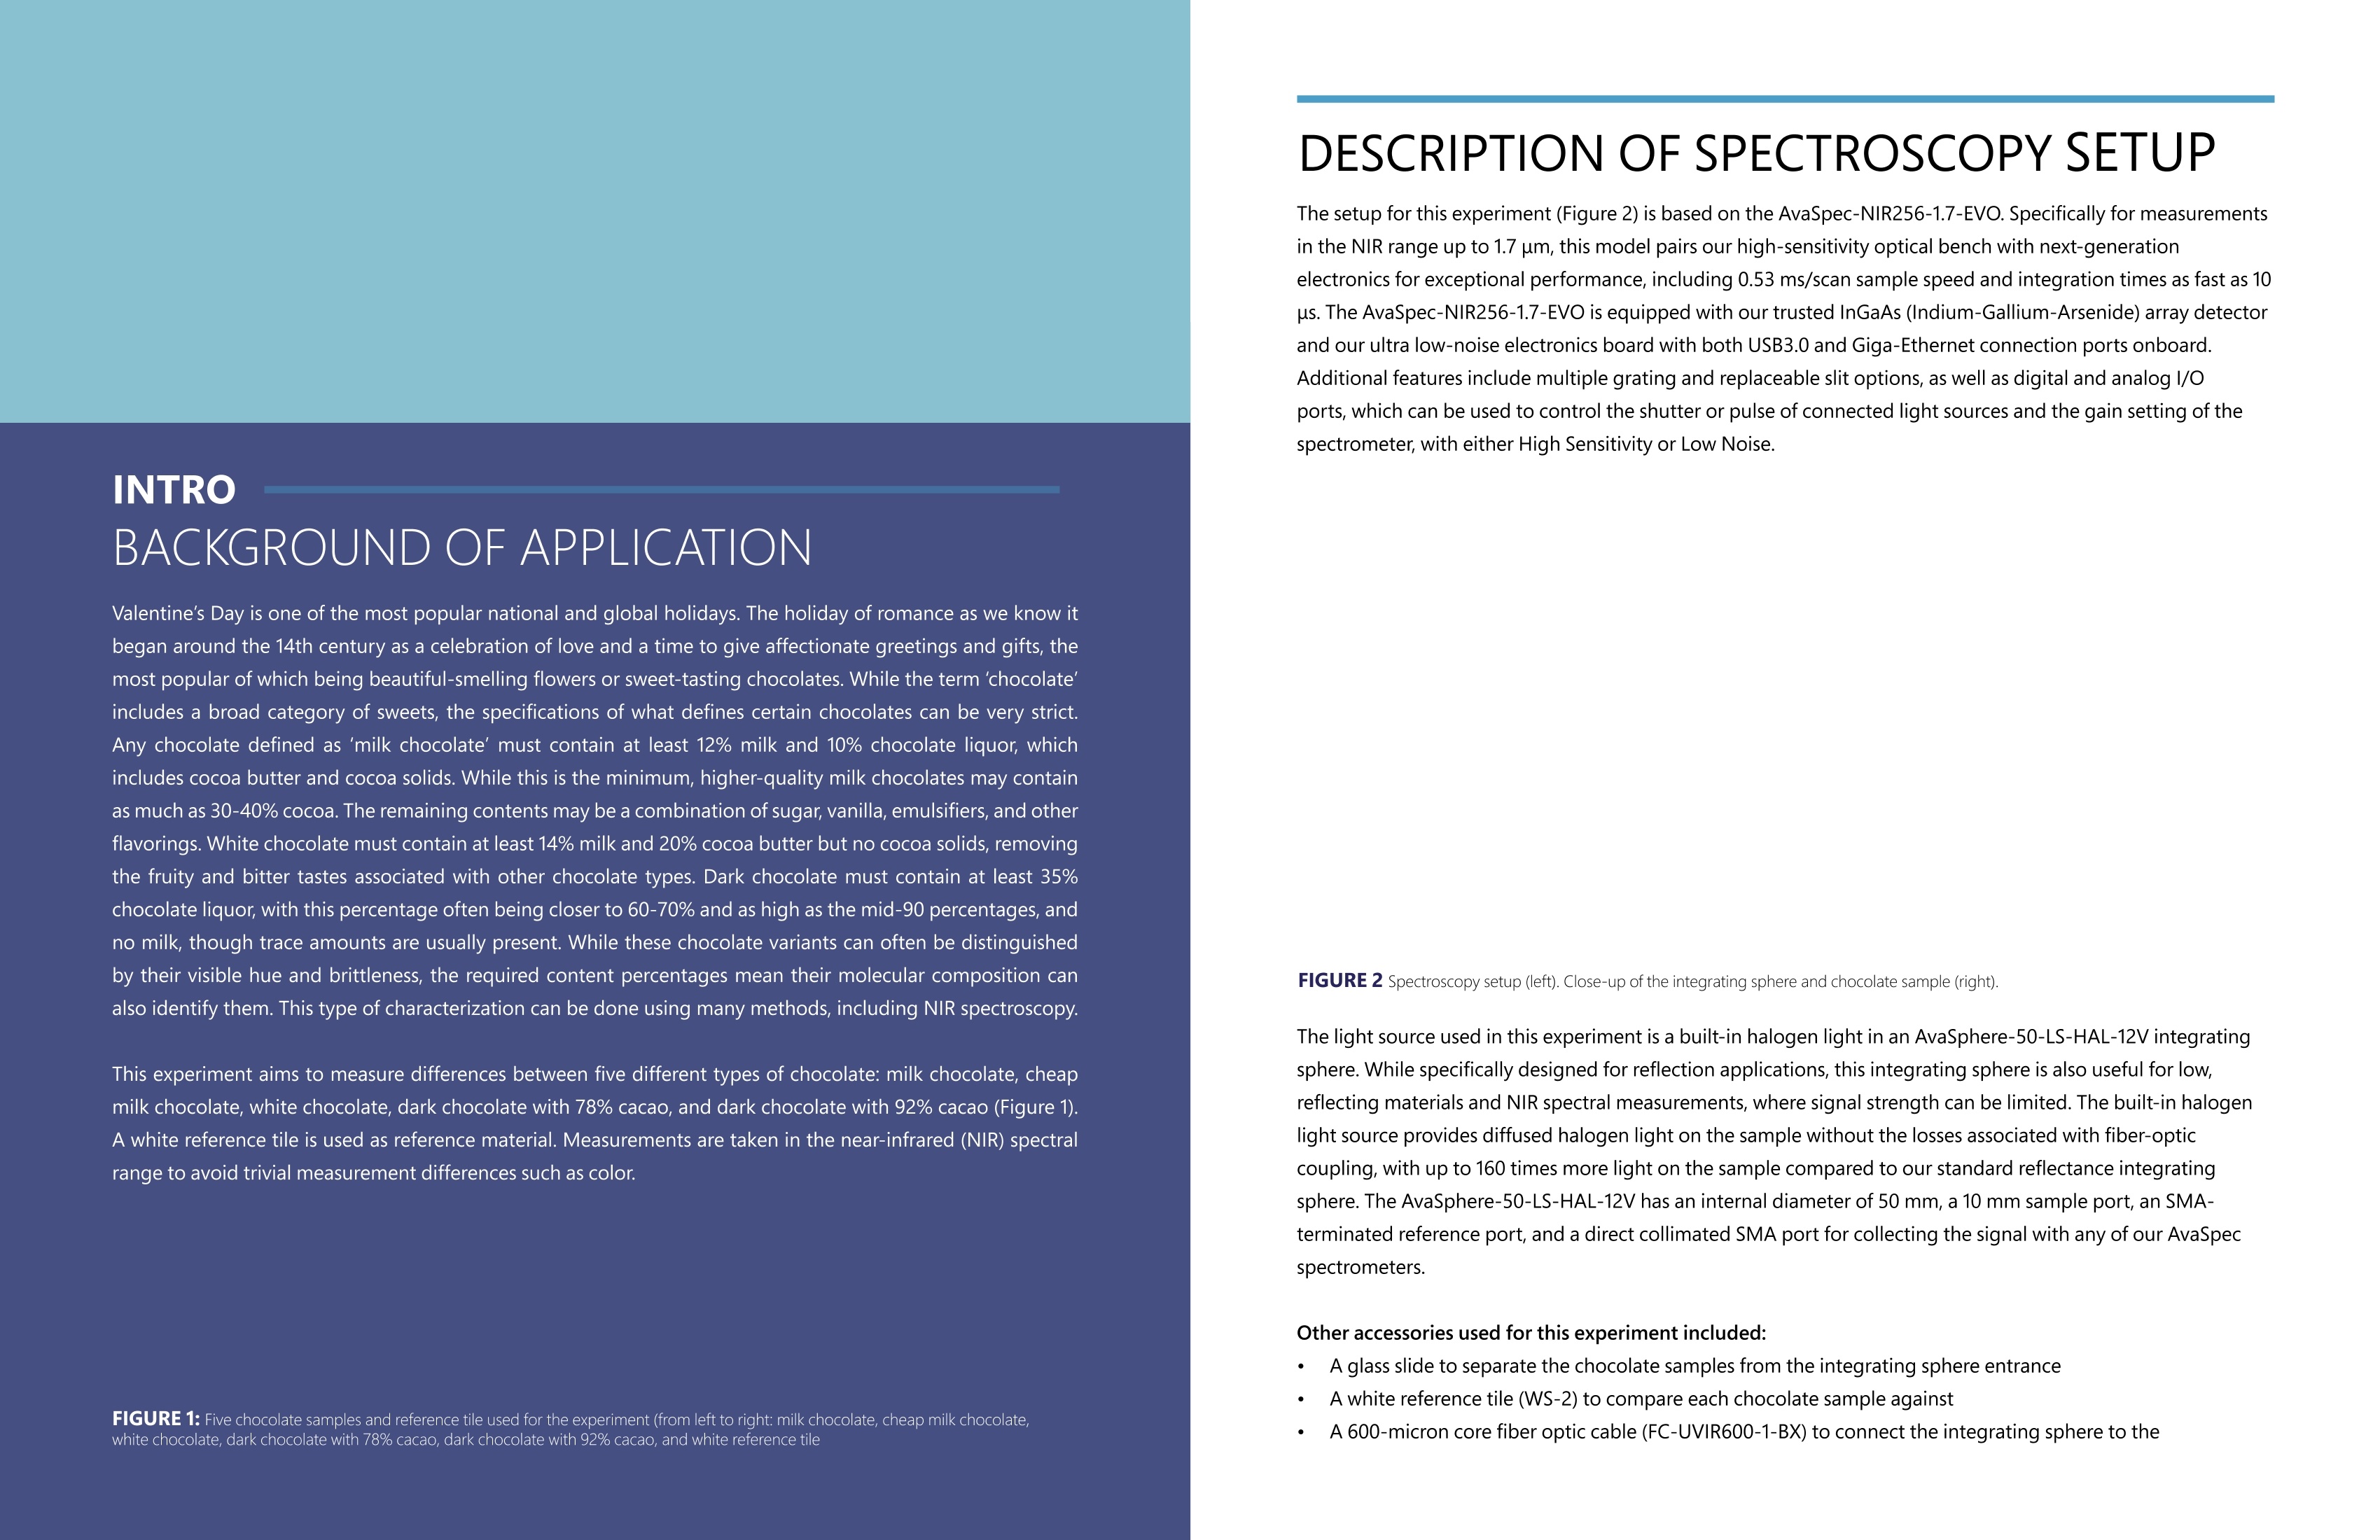
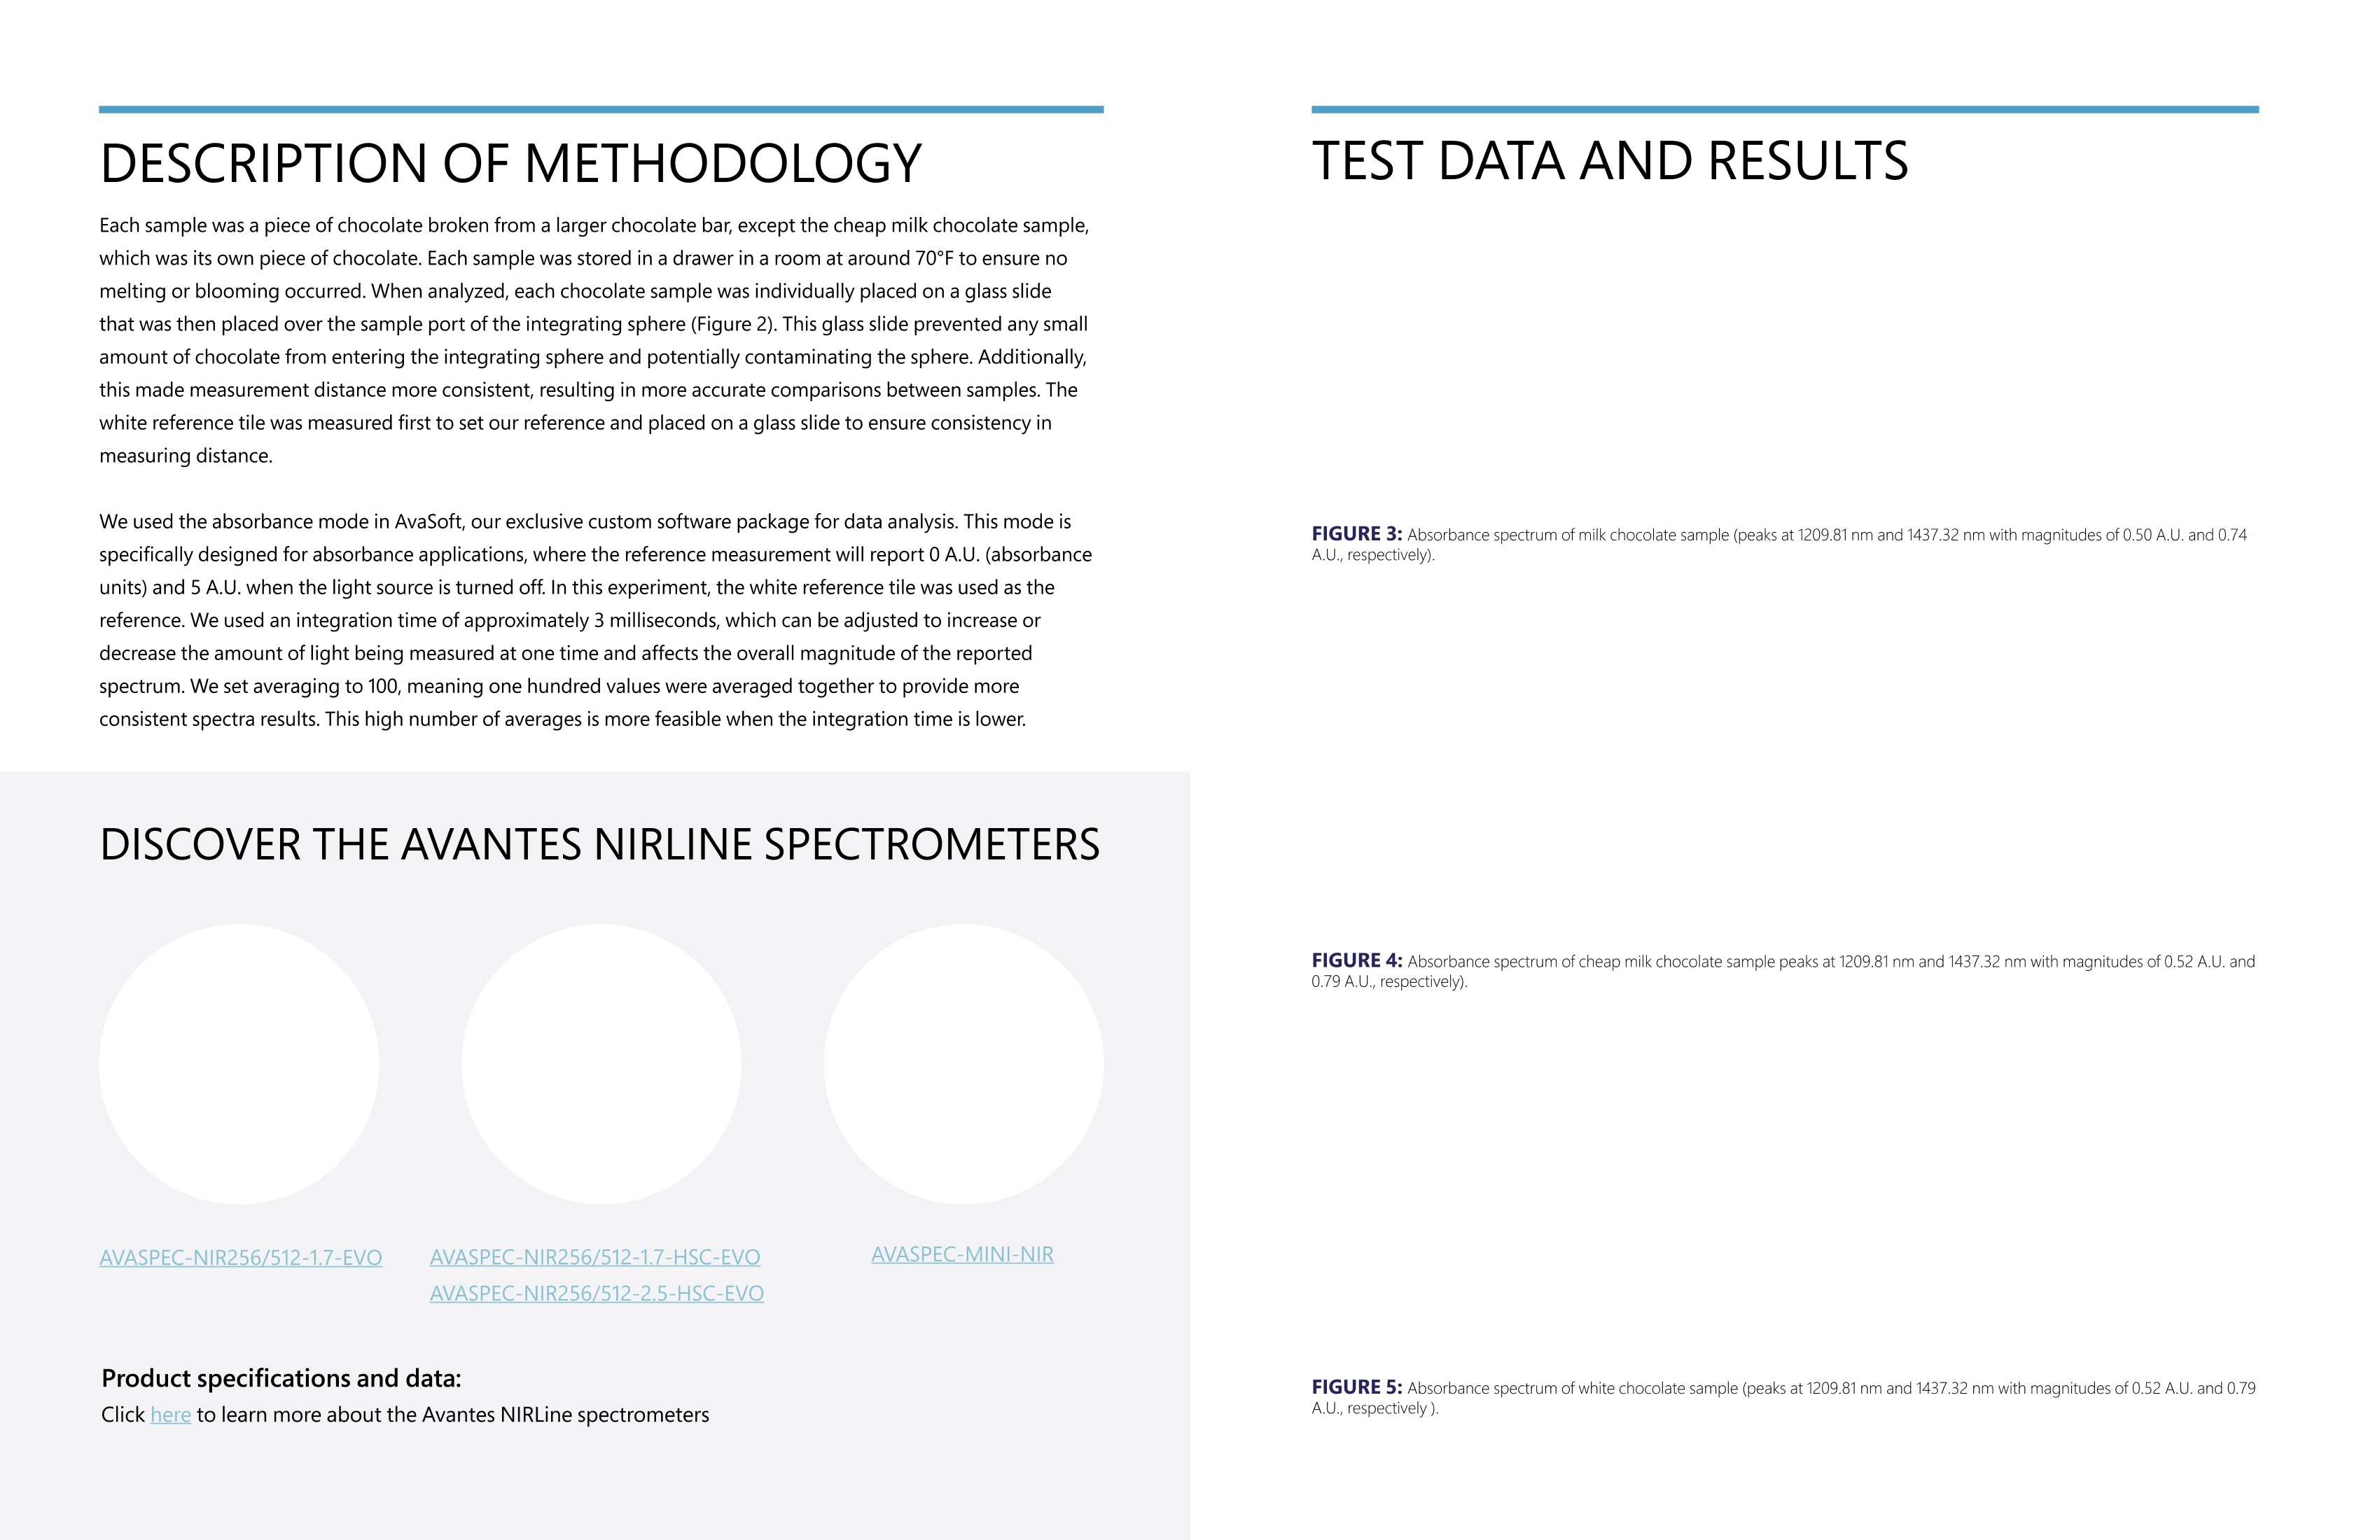
你知道吗?这些关于“巧克力”的知识情人节是最受欢迎的全国性和全球性节日之一。这个浪漫的节日始于14世纪左右,是一个为了庆祝爱情互赠深情问候和礼物的节日,其中最受欢迎的礼物是香气扑鼻的鲜花和香甜可口的巧克力。虽然“巧克力”一词包含的糖果类别比较广泛,但对于某些特定的巧克力,它们的定义却非常严格。任何被定义为“牛奶巧克力”的巧克力都必须含有可可脂,可可固体,至少12%的牛奶和10%的可可。这还只是“牛奶巧克力”的最低限度指标,高品质的牛奶巧克力一般含有30-40%的可可。剩余成分可能是糖、香草、乳化剂和其他调味品。“白巧克力”必须含有至少14%的牛奶和20%的可可,但不含可可固体,这可以消除巧克力自身的果味和苦味。“黑巧克力”中必须含有至少35%的可可,一般情况下这个比例接近60-70%,最高可达90%左右,规定要求不含牛奶,但通常会有微量的牛奶。PART01实验设想通常这些不同的巧克力类型可以通过肉眼可观察的颜色和材质来区分。但我们也可以跟据他们的组成成分——即它们的分子组成来区分。本实验中,我们将使用近红外光谱法来实现。图1:实验中使用的五种巧克力样品和白参考从左到右:牛奶巧克力、廉价牛奶巧克力、白巧克力、可可含量为78%的黑巧克力、可可含量为92%的黑巧克力、Avantes的白色参考瓦(WS-2)。PART02实验仪器本实验使用的光谱仪(图2)是AvaSpec-NIR256-1.7-EVO近红外光纤光谱仪。这款近红外光谱仪测量范围高达1.7 μm,采用高灵敏度光学平台,具有良好的性能参数,采样速度可达0.53 ms,积分时间可短至10μs。图2:AvaSpec-NIR256-1.7-EVO (左),积分球和巧克力样品 (右)AvaSpec-NIR256-1.7-EVO配备了InGaAs(铟镓砷)阵列探测器,USB3 和千兆以太网接口的超低噪声电路板。可以选择不同光栅和狭缝。光谱仪的数字和模拟I / O 接口可实现对光谱仪的外触发以及对脉冲光源和快门和的控制,并且可以通过软件选择两种不同的增益模式,即高灵敏度模式(HS,默认)和低噪声 (LN)模式。本实验使用的光源为AvaSphere-50-LS-HAL-12V内置卤素灯光源(图3)的积分球。此积分球专为反射应用而设计,但也适用于低反射材料和近红外光谱测量。图3:AvaSphere-50-LS-HAL-12V内置卤素灯光源内置卤素灯光源的积分球为样品提供漫射卤素光,可以避免产生与光纤耦合相关的损耗,与我们的标准反射积分球相比,样品上的光照强度高达160倍。AvaSphere-50-LS-HAL-12V积分球内径为50mm,有一个10mm直径的采样口,一个SMA参比端口,以及一个准直的SMA端口,用于收集AvaSpec光谱仪的信号。本实验使用的其他配件包括:一个将巧克力样品与积分球隔开的玻璃白色参考瓦(WS-2),做为参考来比较每个巧克力样品PART03实验方法除了便宜的牛奶巧克力样品是一块单独的巧克力外,每个巧克力样品都是从一块完整的巧克力上掰下来的。每个样品都储存在21℃左右的房间抽屉里,以确保巧克力不会熔化。测量时,每个巧克力样品先分别放置在玻片上,然后将玻片放在积分球的样品端口上(图4)。图4:用玻璃隔开积分球与巧克力这个玻璃可以防止巧克力碎屑进入积分球造成污染,同时,也可以使测量距离更一致得到更准确的结果。首先测量白色参考瓷作为我们的白参考,将其放置在玻璃上确保测量距离的一致性。我们使用AvaSoft软件中的T-吸光度模式,其计数单位为A.U.。AvaSoft是我们独家定制的数据分析软件包。这种模式是专门为吸光度应用而设计的。本实验中,我们将白色参考瓦作为白参考。将积分时间设置为3ms左右,积分时间可以增加或减少一次测量的光量,影响测量光谱的整体幅度。我们将平均次数设置为100,是指将100个值平均在一起,以提供更一致的光谱结果。当积分时间较短时,可以使用比较高的平均次数。PART04实验结果实验所得光谱图如下图所示图5:牛奶巧克力样品的吸收光谱峰值在1209.81 nm和1437.32 nm,吸光度分别为0.50 A.U.和0.74 A.U.左右滑动,查看更多图6:廉价牛奶巧克力样品的吸收光谱峰值在1209.81 nm和1437.32 nm,两处波长对应的吸光度分别为0.52 A.U.和0.79 A.U.左右滑动,查看更多图7:白巧克力样品的吸收光谱峰值在1209.81 nm和1437.32 nm,两处波长对应的吸光度分别为0.52 A.U.和0.79 A.U.左右滑动,查看更多图8:可可含量为78%的黑巧克力样品的吸收光谱峰值在1209.81 nm和1437.32 nm,两处波长对应的吸光度分别为0.53 A.U.和0.68 A.U.左右滑动,查看更多图9: 可可含量为92%的黑巧克力样品的吸收光谱峰值在1128.26 nm和1322.60 nm,两处波长对应的吸光度分别为0.52 A.U.和0.62 A.U.左右滑动,查看更多图10:结果对比图牛奶巧克力样品(蓝色)、廉价牛奶巧克力样品(红色)、白巧克力样品(浅绿色)、可可含量为78%的黑巧克力样品(暗红色)和可可含量为92%的黑巧克力样品(深绿色)的吸收光谱左右滑动,查看更多所有巧克力样品的吸收光谱均在1209.81 nm和1437.32 nm处测量到峰值。数据说明:牛奶巧克力样品在峰值处的吸光度值分别为0.50 A.U.和0.74 A.U.(图5)。廉价牛奶巧克力样品在峰值处的吸光度值分别为0.52 A.U.和0.79 A.U.(图6)。白巧克力样品在峰值处的吸光度值分别为0.52 A.U.和0.79 A.U.(图7)。可可含量为78%的黑巧克力样品在峰值处的吸光度值分别为0.53 A.U.和0.68 A.U.(图8)。可可含量为92%的黑巧克力样品在峰值处的吸光度值分别为0.52 A.U.和0.62 A.U.(图9)。五种巧克力的光谱图可以表明峰值强度的差异(图10)。在1209.81 nm处,吸光度由高到低分别为:可可含量为78%的黑巧克力样品,可可含量为92%的黑巧克力样品,白巧克力样品,廉价牛奶巧克力样品。在1437.32 nm处,吸光度由高到低分别为:白巧克力,廉价牛奶巧克力,牛奶巧克力,可可含量为78%的黑巧克力样品,可可含量为92%的黑巧克力样品。由此可以假设这个峰值表示糖含量。结论:平均每份巧克力样品为28g,白巧克力含15g糖,廉价牛奶巧克力含16克糖,牛奶巧克力含12g糖,可可含量为78%的黑巧克力含5g糖,可可含量为92%的黑巧克力含2g糖。这仅表明一个猜想,类似的如牛奶固体和其他调味料的趋势可以从其他成分中得出。PART05实验后记总之,本实验通过使用近红外光谱观察到了不同类型巧克力之间的差异。然而,必须使用进一步的计量分析来充分解释和量化这些测量的差异。AvaSpec-NIR256-1.7-EVO光纤光谱仪是一款高度通用的近红外光谱仪,可以定制以适配您的需求。AvaSphere-50-LS-HAL-12V内置卤素灯积分球是专门为反射率测量而设计的,但也可用在任何可能存在信号强度有限问题的应用,如近红外光谱测量。扫码关注我们600微米芯径光纤(FC-UVIR600-1-BX),连接积分球和光谱仪AVANTESMEMBER OF THE NYNOMIC GROUP APPLICATION NOTE - IN-HOUSE EXPERIMENT COMPARISON OF CHOCOLATE TYPES UTILIZING ABSORBANCE SPECTROSCOPY CONDUCTED BY KURT AMEKU DESCRIPTION OF SPECTROSCOPY SETUP The setup for this experiment (Figure 2) i s based on the AvaSpec-NIR256-1.7-EVO. Speci f ical l y for measurements i n the NIR range up to 1.7 um, t his model pairs our high-sensitivity optical bench with next -generation electronics for except i onal performance,inc l uding 0.53 ms/scan sample speed and integration times as f ast as 10us. The AvaSpec-NIR256-1.7-EVO is equipped wi t h our t r usted InGaAs (I ndium-Gallium-Arsenide) array detector and our ultra l ow-noise electronics board with both USB3.0 and Giga-Ethernet connection por t s onboard.Additional f eatures i nclude multiple grating and replaceable slit options, as well as digital and analog I/O ports, which can be used to control the shutter or pulse of connected l i ght sources and t he gain setting of the spectrometer, with either High Sensit i vity or Low Noise. INTRO BACKGROUND OF APPLICATION Valentine's Day i s one of the most popular national and global holidays. The holiday of romance as we know i t began around the 14th century as a celebration of love and a time to give affectionate greetings and gifts, the most popular of which being beautiful-smelling flowers or sweet-tasting chocolates. While the term chocolate'includes a broad catego ry of sweets, the specifications of what defines certain chocolates can be very strict.Any chocolate defined as 'milk chocolate' must contain at least 12% milk and 10% chocolate l iquor , which includes cocoa butter and cocoa solids. While this is the minimum, higher-quality m ilk chocolates may contain as much as 30-40% cocoa. The remaining contents may be a combination of sugar, vanilla, emulsifiers, and other flavorings. White chocolate must contain at least 14% milk and 20% cocoa butter but no cocoa solids, removing the fruity and bitter tastes associated with other chocolate t yp es. Dark chocolate must contain at l east 35%chocolate l iquor, with this percentage often being closer to 60-70% and as high as the mid-90 percentages, and no milk, thou g h trace amounts are usua lly pr esent. While these chocolate variants can often be disting uis hed b y their visible hue and brittleness, the required content percentages mean their molecular comp os ition can also identify them. This t y pe of characterization can be done using many m ethods, including NIR spectroscopy . F IG U RE 2 S pectrosco p y set u p (l e ft). C l ose-u p o f the i ntegrating sphere a nd c hocol a te samp l e (rig h t ). This experiment aims to measure differences between five different ty pe s of chocolate: milk chocolate, cheap milk chocolate, white chocolate, dark chocolate with 78% cacao, and dark chocolate with 92% cacao (Figure 1).A white reference tile is used as reference material. Measurements are taken in the near-infrared (NIR) spectral range to avoid trivial measurement differences such as color. T he light source used in this experiment is a built-in halogen light i n an AvaSphere-50-LS-HAL-12V integrating sphere. While specif i cally designed for reflection app l ications, t his integrating sphere i s also useful for l ow,reflec t ing materials and NIR spectral measurements, where signal strength can be limited. The built -i n halogen light source provides di f fused halogen light on the sample without the losses associated with f iber-optic coupling, with up to 160 times more l i ght on the sample compared to our standard reflectance integrating sphere. The AvaSphere -50-LS-HAL-12V has an internal diameter of 50 mm, a 10 mm sample por t , an SMA-terminated reference por t , and a direct collimated SMA port for collecting t he s ignal with any of our AvaSpec spectrometers. Other accessories used for this experiment included: ·A glass slide to separate the chocolate samples from the integrating sphere entrance · A white reference t i le (WS-2) to compare each chocolate sample against A 600-micron core f iber optic cable (FC-UVIR600-1-BX) to connect t he integrating sphere to t he DESCRIPTION OF METHODOLOGY Each sample was a piece of choco l ate broken f rom a l arger choco l at e bar, except t he cheap milk chocolat e sample,which was its own piece of chocolate. Each sample was stored in a drawer in a room at around 70°F to ensure no melt i ng or blooming occur r ed. When analyzed, each chocolate sample was indi v idually placed on a glass slide that was then placed over the sample port of the i ntegrating sphere (Figure 2). This glass s lide prevented any small amount of chocolate from entering the integrating sphere and potentially contaminating the sphere. Additionally,this made measurement distance more consistent , resulting in more accurate comparisons between samples. The white reference tile was measured f i rst to set our reference and placed on a glass slide to ensure consistency in measuring distance. We used the absorbance mode in AvaSof t , our exc l usive custom software package for data analysis. This mode is specifically designed for absorbance applications, where the r eference measurement will r eport 0 A.U. (absorbance units) and 5 A.U. when the l ight source is turned off. In this experiment, the white reference tile was used as the reference. We used an i ntegration t ime of approximately 3 milliseconds, which can be adjusted t o inc r ease or decrease the amount of light being measured at one time and affects the overall magnitude of the r eported spectrum. We set averaging t o 100, meaning one hundred values were averaged t ogether t o provide more cons i stent spec t ra results. This high number of averages is more feasible when the integration time is lower. DISCOVER THE AVANTES NIRLINE SPECTROMETERS AVASPEC -N I R256/512-1.7-EVQ AV ASPEC -NIR256/512-1.7-HSC -EVQ AVASPEC -NIR256/512-2.5-HSC -EVQ AVASPEC-MINI-N IR Product specifications and data: Click here to learn more about the Avantes NIRLine spectrometers TEST DATA AND RESULTS F IG U RE 3: Absor b a n ce spec t rum of m i l k c hocolat e sample (p eaks a t 1209.81 n m a nd 1437.32 nm with ma g n it udes of 0.50 A .U . an d 0.74A .U., respec ti ve ly ). F I GU RE 4: A b sor b a n ce s p ect r u m of cheap mi l k c h ocol a te sample p eaks at 1209.81 nm an d 1437.32 nm with mag n it ud es of 0.52 A.U. a nd 0.79 A.U., r espe c tivel y ). F IGURE 5: Absor b a n ce s pectrum of w h i t e choco l at e sa m ple (p eak s a t 1209.81 nm a n d 1437.32 n m with m a gni tudes of 0.52 A .U . an d 0.79A .U., re s pective l y). TEST DATA AND RESULTS FIG U RE 6: A bsorba n ce spectr u m o f da r k c hocolat e sampl e wi t h 78% c acao (pea ks a t 1209.81 n m an d 1437.32 nm wit h m ag n it u d e s of 0.53 A.U . and 0.68 A .U ., r es p ectiv e l y ). F IGURE 7: Spectru m of d ark chocolate sa mp l e wit h 92% caca o (peaks at 1128.26 nm and 1322.60 n m wi th mag nitu des of 34303.70co u nts and 48289.00 count s , r e s pe ctivel y ) F IGURE 8: Absor b a n ce s pectra of milk c h o c ola t e sa mp le (blue), chea p mil k chocolate sample (r ed ), wh i t e chocola t e s a mp l e (l ight g ree n).da rk c h ocola t e samp le wi t h 78% caca o (da r k re d), and da r k cho c ol at e s a m pl e wi t h 92% cacao (dar k gr e e n), shown t og et her f o r c omp a r i son. TEST DATA ANALYSIS The absorbance spectra for all chocolate samples had measured peaks at 1209.81 n m and 1437.32 n m. The milk chocolate sample had absorbance values of 0.50 A.U. and 0.74 A.U. at each respect i ve peak (Figure 3). The cheap mi l k chocolate sample had absorbance values of 0.52 A.U. and 0.79 A.U. at each respect i ve peak (F i gure 4). T he white chocolate sample had absorbance values of 0.52 A.U. and 0.79 A.U. at each respective peak (Figure 5). The dark chocolate sample wi t h 78% cacao had absorbance values of 0.53 A.U. and 0.68 A.U. at each respective peak (F i gure 6). The dark chocolate sample with 92% cacao had absorbance values of 0.52 A.U. and 0.62 A.U. at each respective peak (F i gure 7). A plot of all f ive spectra i s also provided to illustrate the differences in peak intensity (Figure 8). For the peak at 1209.81 nm, the dar k chocolate sample with 78% cacao reported the highest absorbance value,followed by the dark chocolate sample with 92% cacao, the white chocolate sample, and the cheap milk chocolate sample. T he milk chocolate sample had t he absorbance value at this wavelength. It is only apparent what t his peak is indicating with more complex analysis, though the second peak seen at 1437.32 nm may be more clear.At this peak, the white chocolate and cheap mi l k chocol a te samples have t he highest absorbance values; the milk chocolate sample has the next highest absorbance value, followed by the dark chocolate sample with 78% cacao and ending with the dark chocolate sample with 92% cacao having the lowest absorbance value at this peak.Based on this relation, i t could be hypothesized that this peak indicates sugar content. Averaged for a 28g serving,the white chocolate has 15g of sugar, the cheap milk chocolate has 16g, the milk chocolate has 12g, the dark chocolate with 78% cacao has 5g, and the dark chocolate with 92% cacao has 2g of sugar. This is j ust one idea, as simi l ar trends could be drawn f rom other ingredient s such as milk solids and other added f lavorings.More complex analyses like chemomet ri cs could verify this hypothesis with the f irst observed peak. CONCLUSION In conclusion, the present exper i ment highlights t he differences t hat can be observed between different t ypes of chocolate using NIR spectroscopy. However, further analys i s must be used to interpret and quanti f y these measured differences fully. The AvaSpec-NIR256-1.7-EVO is a highly versatile NIR spectrometer with plenty of available options to match your application's bandwidth and r equirements. T he AvaSphere-50-LS-HAL-12Vis designed explicitly for reflectance measurements but i s effective for any applications where limited signal strength may be an issue, such as NIR spectral measurements. Please get in touch with Avantes for more information on the configuration that is best suited f or your data collection. CONTACT WE'RE HAPPY TO HELP Curious how spectroscopy can help you reveal answers by measuring all kinds of material i n-line, at your production facility, in a lab, or even i n the f ield? Visit our website or contact one of our technical experts. We are happy to help you. Avantes Headquarters Phone: +31 (0) 313 670 170 Email: info@avantes.com Website: www.avantes.com Avantes Inc. Phone: +1 (303) 410 866 8 Avantes China Phone: +86 (0) 108 457 404 5 Email: info@avantes.com.cn Website: www.avantes.cn Follow us on social media:
确定

还剩3页未读,是否继续阅读?

产品配置单

北京爱万提斯科技有限公司为您提供《不同巧克力的吸收光谱》,该方案主要用于巧克力及制品中吸收光谱检测,参考标准--,《不同巧克力的吸收光谱》用到的仪器有AvaSpec-NIR256-1.7近红外光谱仪、Avantes-NEXOS™系列迷你型光纤光谱仪、AvaLight-HAL-Mini卤素灯光源
推荐专场

相关方案
更多