


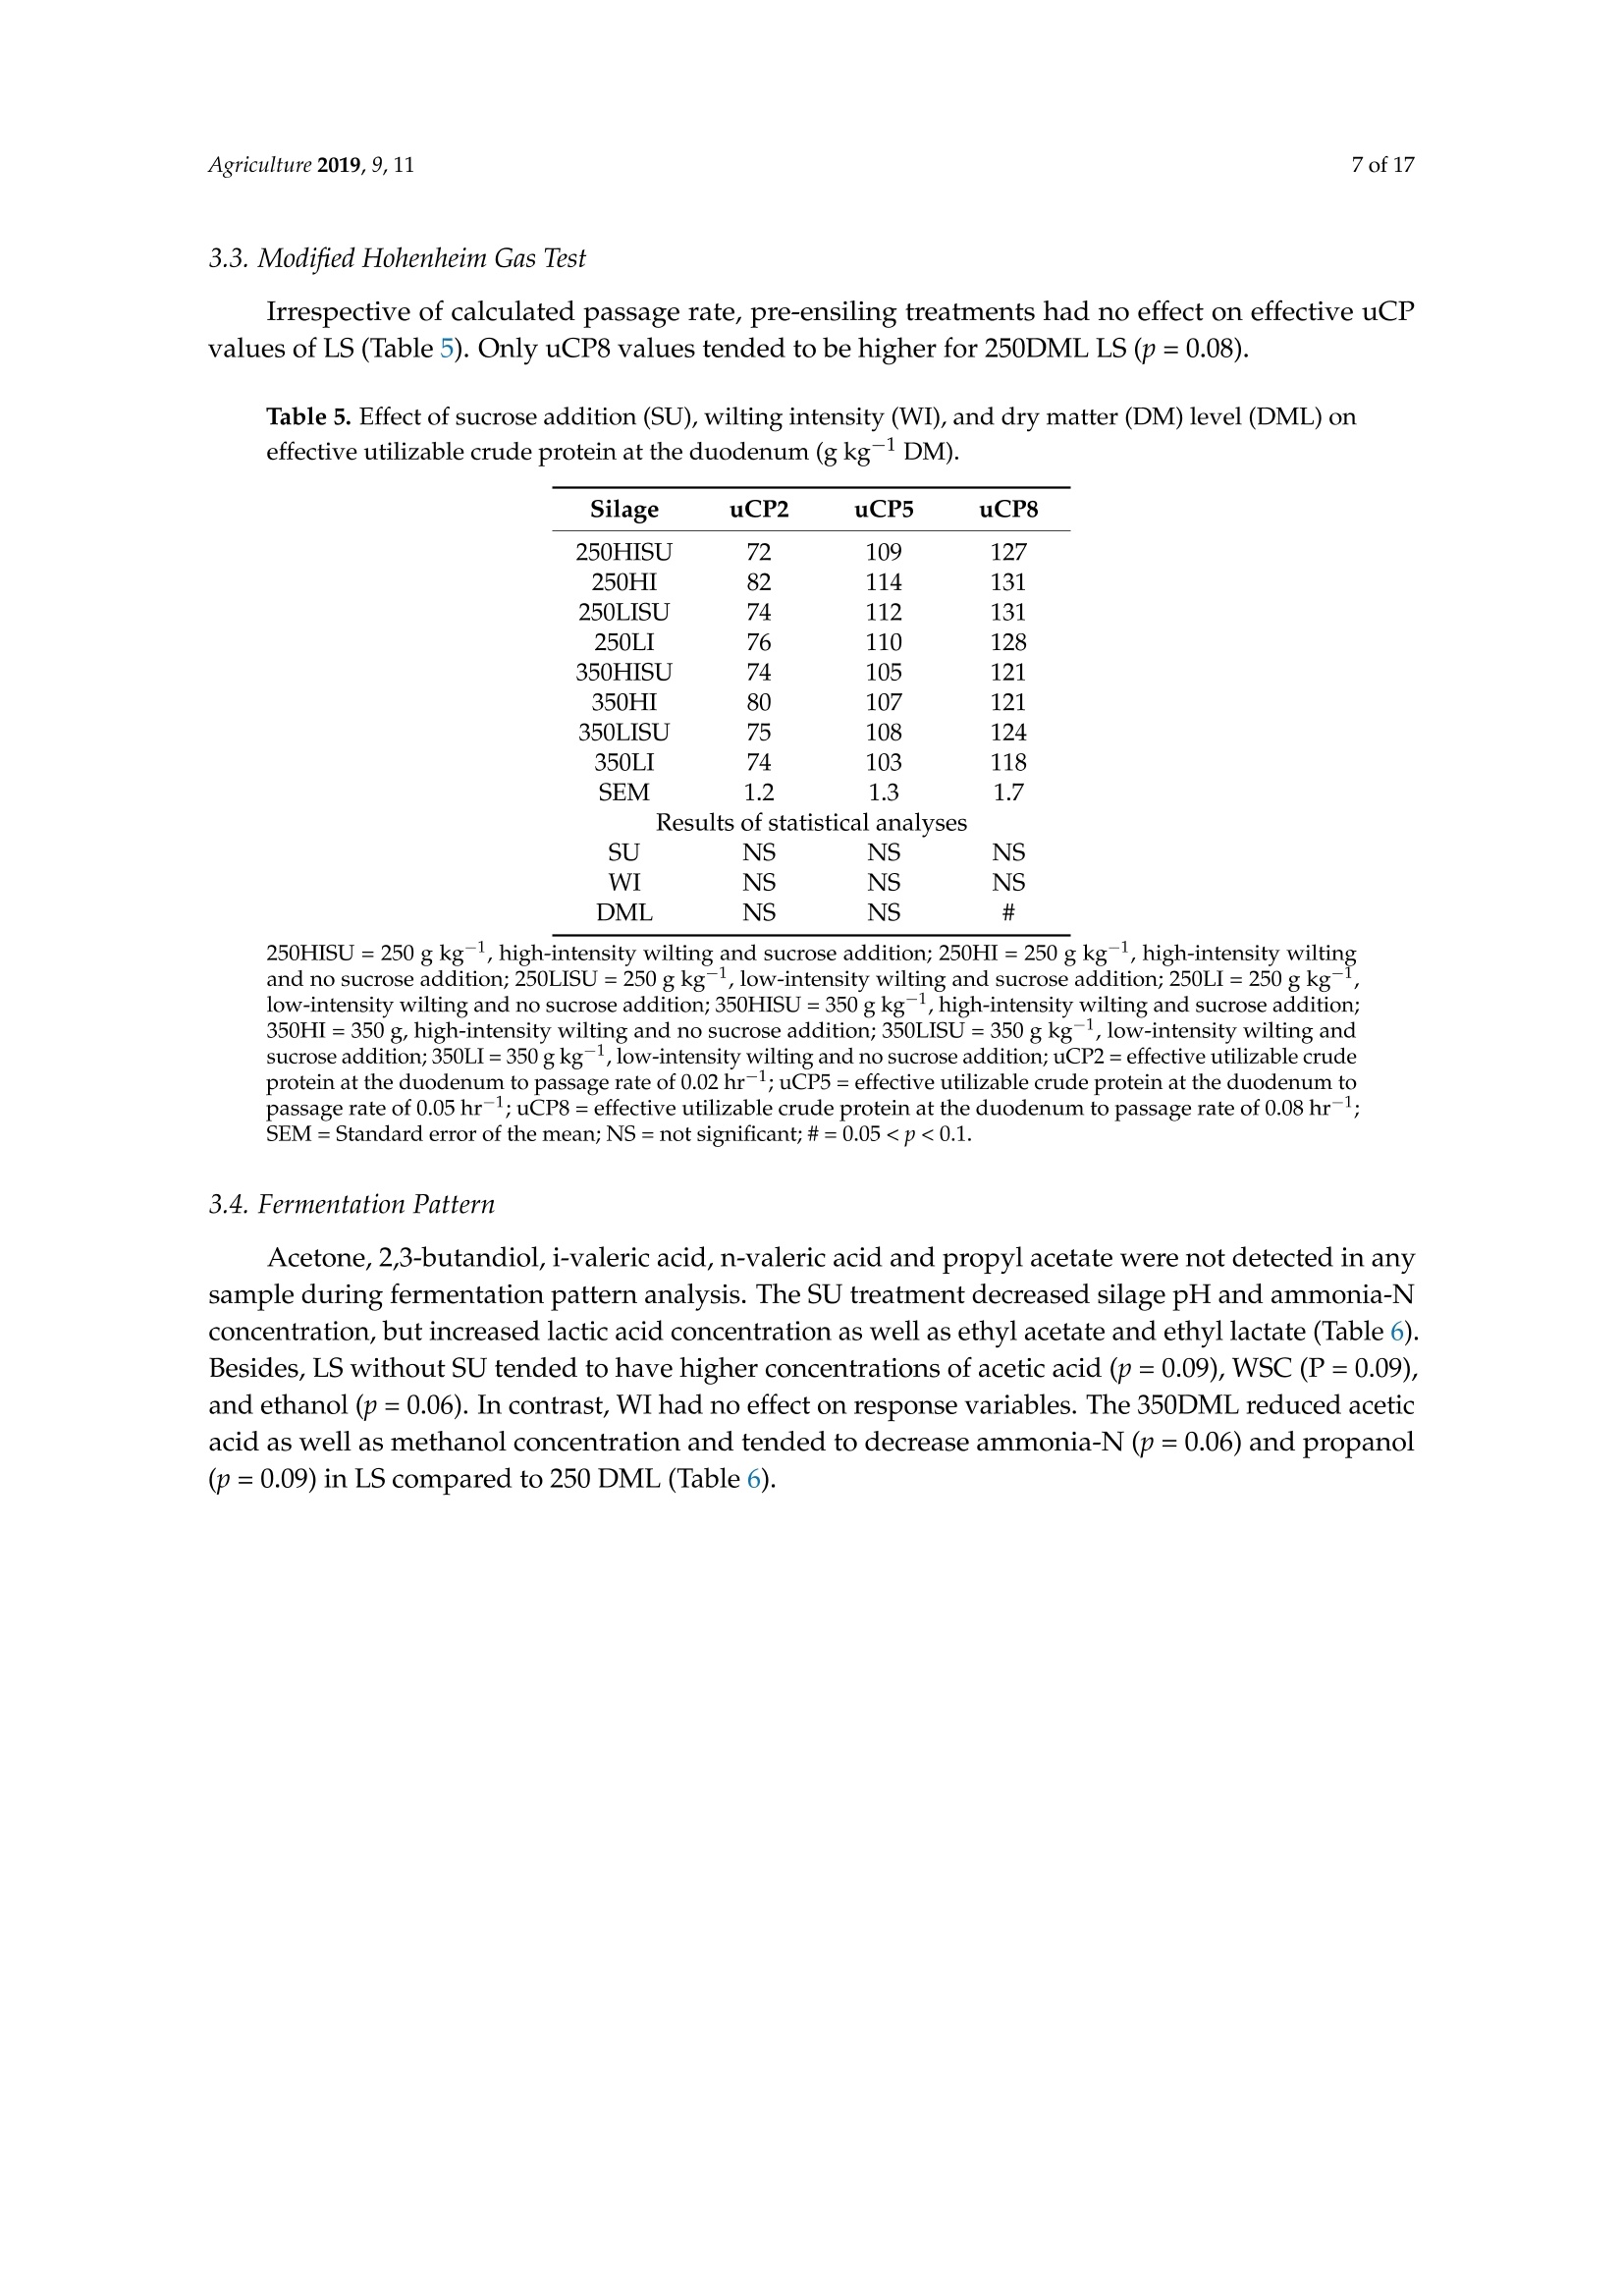
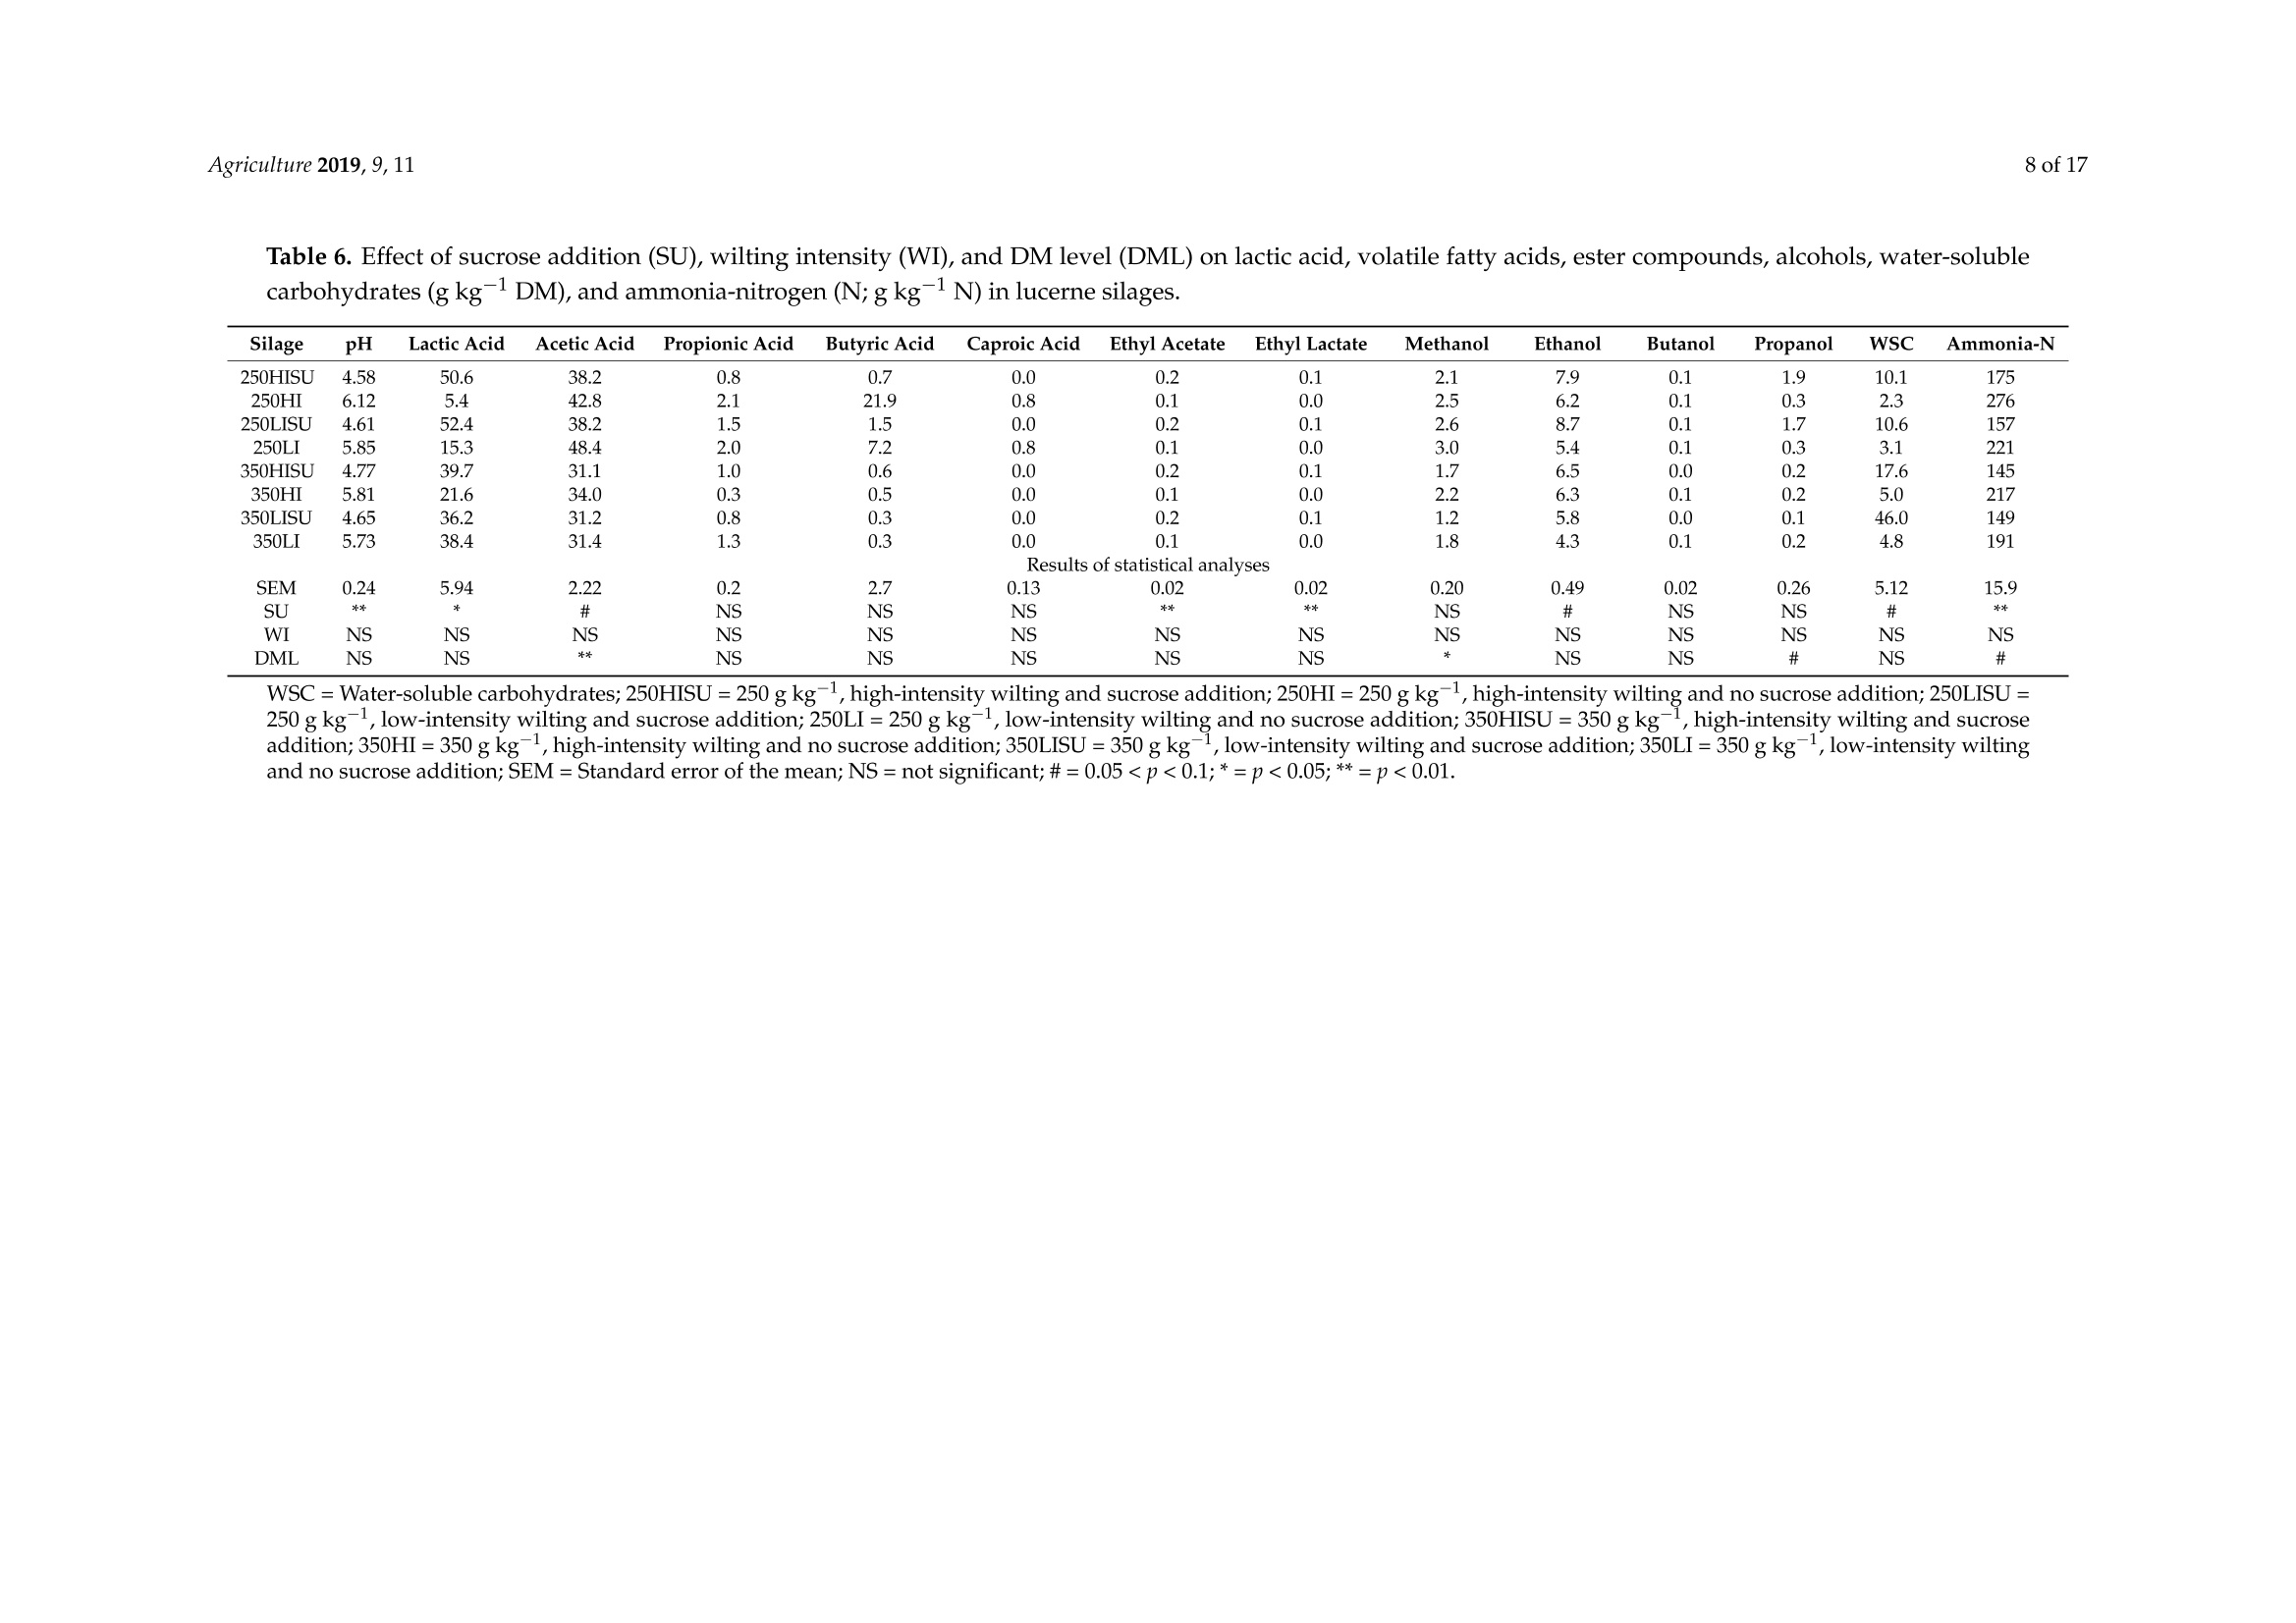
方案详情
文
枯萎强度、干物质含量和糖添加对紫花苜蓿青贮中氮含量的影响Effect of Wilting Intensity, Dry Matter Content and Sugar Addition on Nitrogen Fractions in Lucerne Silages
方案详情

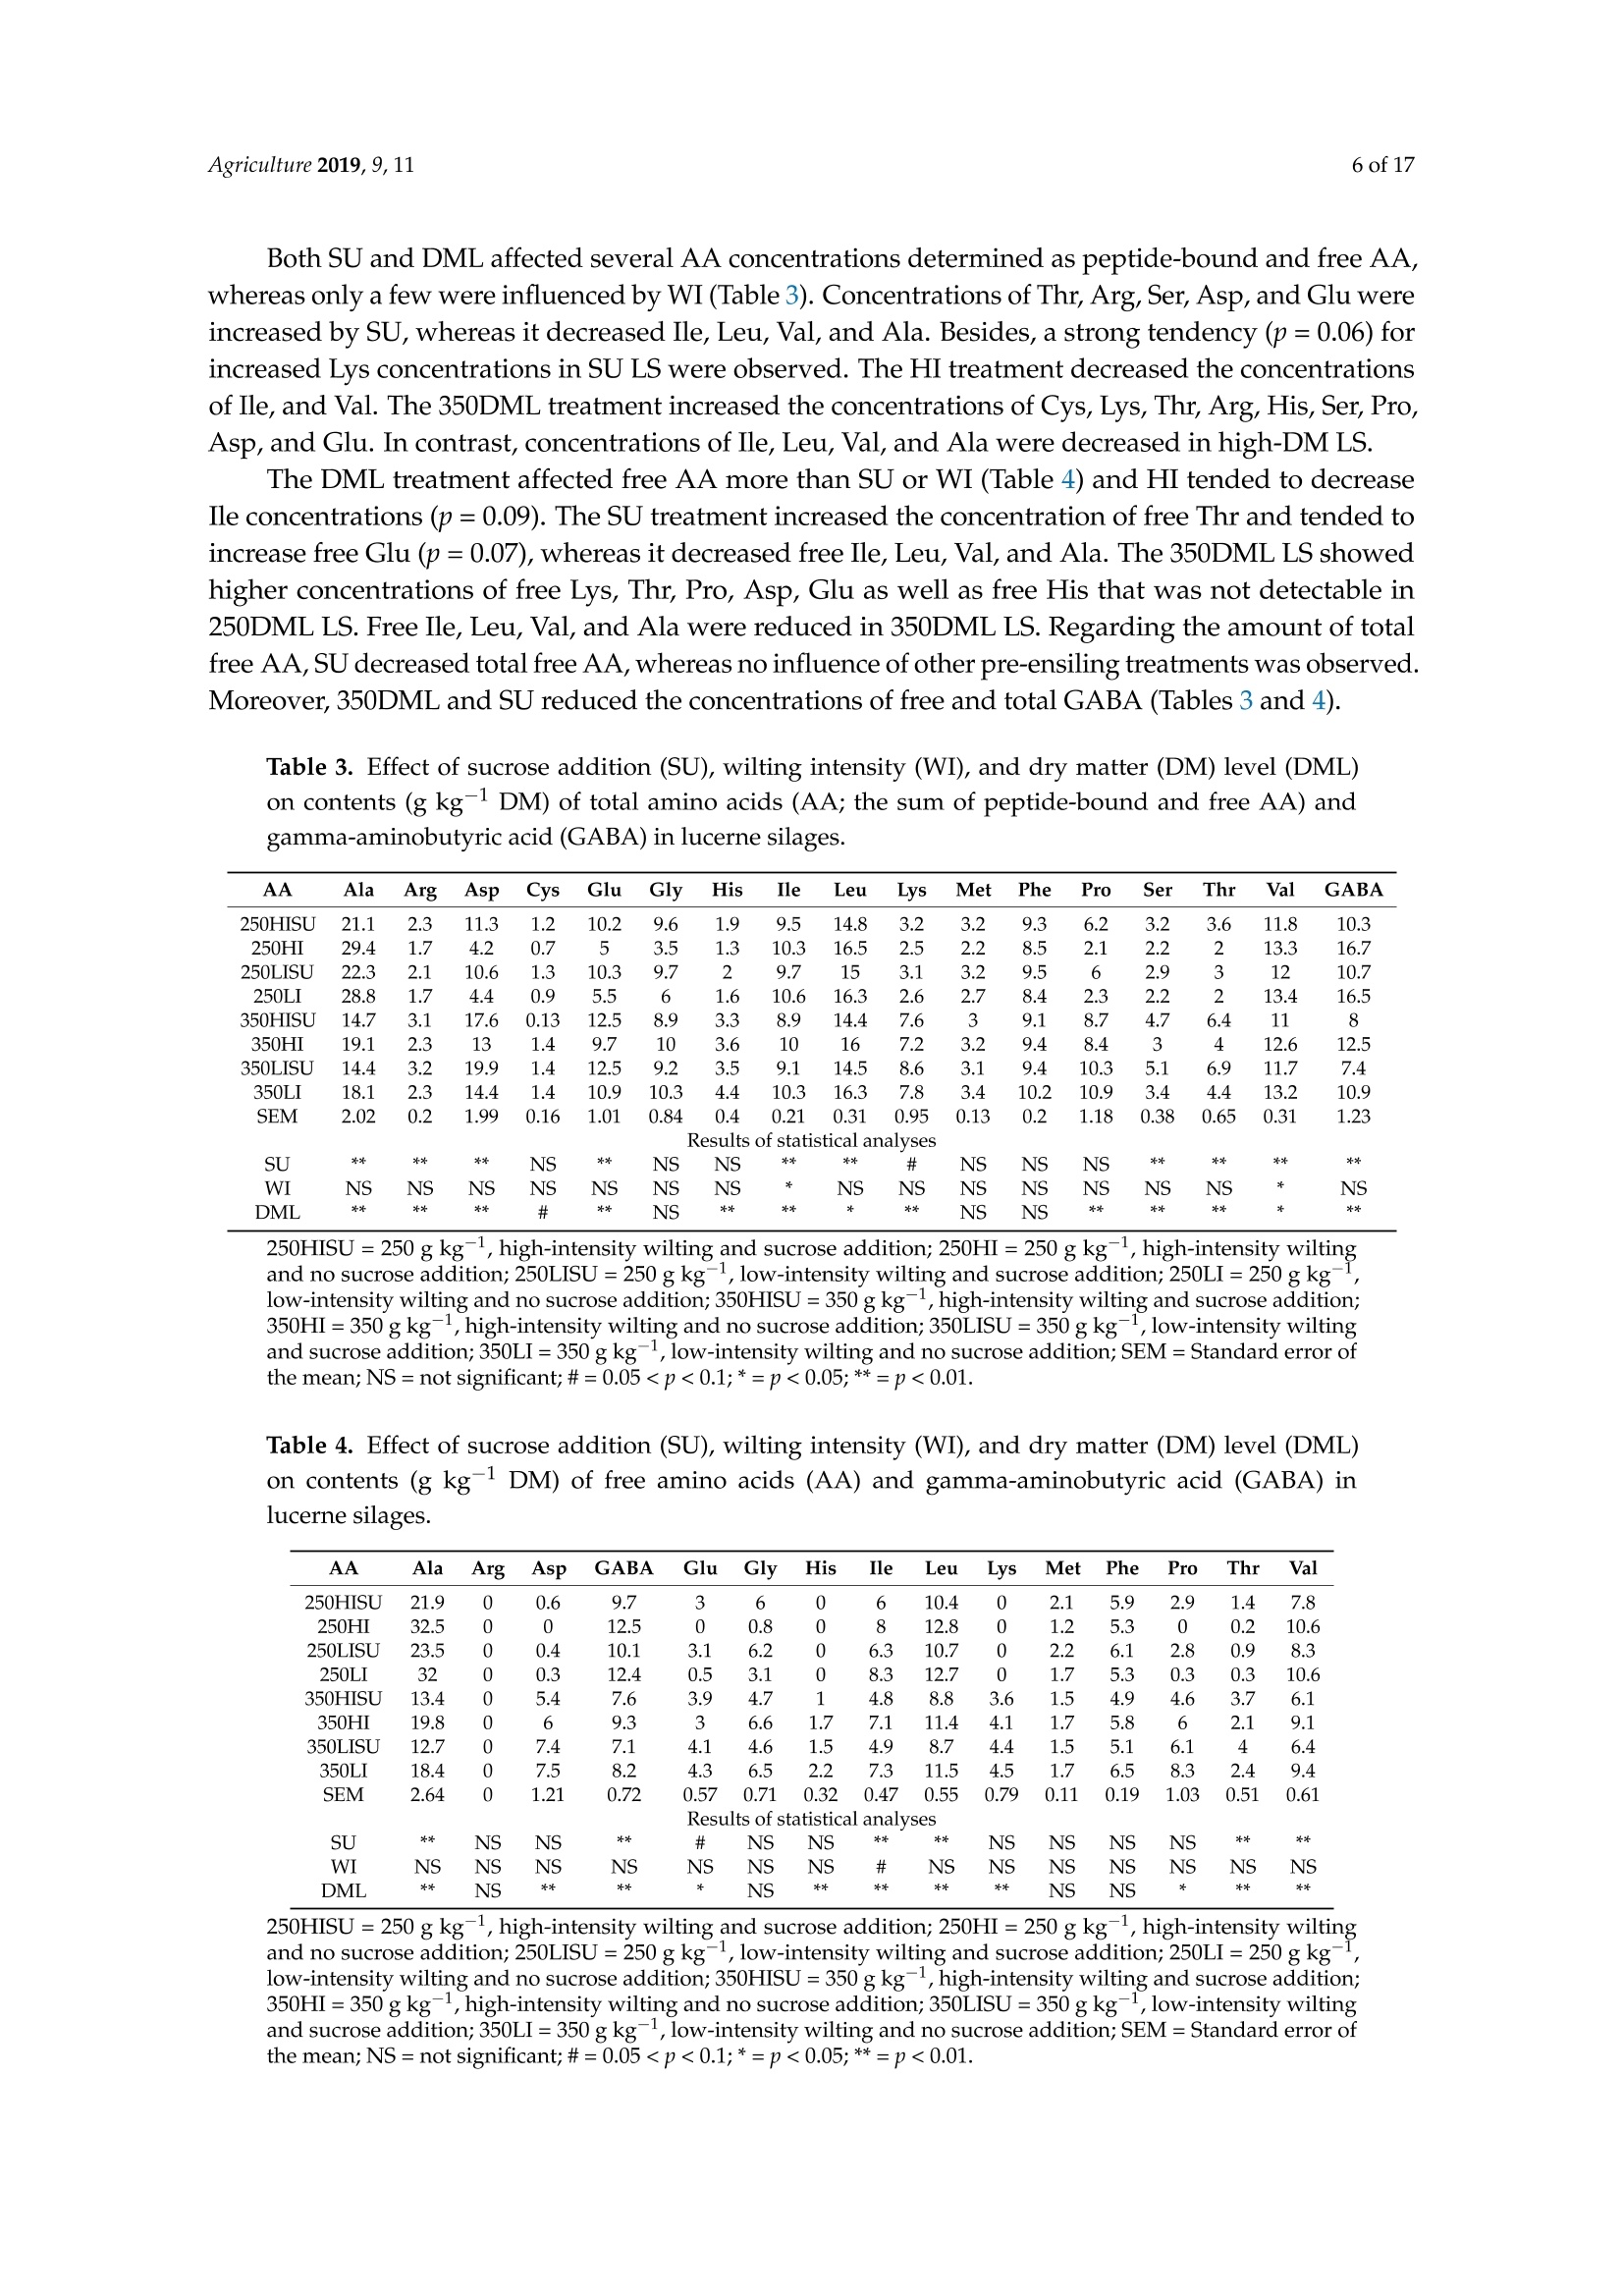
枯萎强度、干物质含量和糖添加对紫花苜蓿青贮中氮含量的影响Effect of Wilting Intensity, Dry Matter Content and Sugar Addition on Nitrogen Fractions in Lucerne Silagesagriculture[MDPI 2 of 17Agriculture 2019, 9,11 Article 枯萎强度、干物质含量和糖添加对紫花苜蓿青贮中氮含量的影响 Effect of Wilting Intensity, Dry Matter Content and Sugar Addition on Nitrogen Fractions in Lucerne Silages Thomas Hartinger, Nina Gresner and Karl-Heinz Suidekum *D Institute of Anima l Science, University of Bonn, 53115 Bonn, Germany; thar@itw.uni-bonn.de (T .H.); ngre@itw.uni-bonn.de (N.G.) * Correspondence: ksue@itw.uni-bonn.de; Tel.: +49-228-73-2287 Received: 24 November 2018; Accepted: 28 December 2018; Published: 5 J anuary 2019 check for updates Abstract: Pre-ensiling treatments can significantly influence the composition of l ucerne (Medicago satioa L.) silages (LS). Besides dry matter (DM) content and availability of water-soluble carbohydrates (WSC), wilting intensity may exert a strong impact on the crude protein (CP; nitrogen [N]×6.25)fractions. The present study aimed to evaluate the effects of DM l evel, wilting intensity, and sucrose addition on N compounds and fermentat i on products i n LS. Pure l ucerne stand (cul t ivar Plato) was wilted with either high or l ow i ntensity to DM contents of 250 and 350 g kg-1, respectively, and ensiled with or without the addition of sucrose. Non-protein-N (NPN) concentration in LS was affected by all pre-ensiling t reatments and with 699 g kg -1 CP, NPN was lowest in high-intensity wilted high-DM LS with sucrose addition. No effects were observed on i n vitro-estimated concentrations of utilizable CP at the duodenum, a precursor to metabolizable protein. Sucrose addition and higher DM level decreased acetic acid and ammonia-N concentration in t he silages. Therefore, t he present study demonstrated t he beneficial manipulation of CP fractions in LS by high-intensity wilting to higher DM contents and that the provision of WSC may be necessary for sufficient silage fermentation and protein preservation. Keywords: crude protein; dry matter; l ucerne; alfalfa; nitrogen; silage; wilting 1. Introduction Compared with other forage species, lucerne (Medicago sativa L.) has a high crude protein (CP;Nitrogen [N]×6.25) content and depending on its degradability in the rumen, a considerable part of the ruminant's demand for amino acids (AA) can be supplied by feeding lucerne [1]. Preserved as lucerne silage (LS), this forage is continuously available as a component for dairy and beef cattle diets, independently from vegetative growth periods. However, t he vast majority of CP i n LS is ruminally readily-degradable non-protein-N (NPN), i.e., from 50 up to 87% of total CP [2-4], which can be ascribed to proteolytic activities of l ucerne-derived proteases before ensiling, and microbial enzymes during the ensiling process [5]. Legumes are also characterized by low proportions of water-soluble carbohydrates (WSC) [6], which f irstly make them difficult to ensile, and secondly also result in silages with minimal concentrations of rapidly fermentable carbohydrates. Solely feeding LS l eads to an inefficient microbial N fixation i n t he rumen [4,7] and consequentl y high N excretion causing increased environmental pollution. However, substantial N excretion may stil l occur in mixed LS-based diets because the provision of rapidly fermentable carbohydrates by concentrate is limited due to the risk of rumen acidosis [8]. Therefore, adequately meeting the microbial energy demand for fixing the N arising from the rapid degradation of high NPN amounts in LS is hardly feasible. Consequently, manipulating the CP fractions in LS should be targeted, and in order to improve this fraction, meaning by increasing true protein (TP) concentrations and decreasing low-molecular-weight CP, high-intensity wilting, i.e., with high solar radiation, may be an effective option that to date has not received much attention. Rapid drying should i nactivate plant-derived proteases, whose functions rely on water, and consequently stabilize TP content of lucerne plants.Likewise, a previous study by Edmunds et al. [9] already showed that high-intensity wilting results in higher TP percentages i n grass silages. Thus, we hypothesized t hat high-intensity wilting alone or in combination wi t h further treatments may influence the CP composition in LS and decrease proteolysis during ensiling. Because lucerne contains limited amounts of WSC [6], t he effect of sucrose addition before ensiling on the N fractions in LS was further tested,particularly as there is clear evidence for decreased ammonia-N concentration in glucose- and fructose-added LS [10] and a more stable silage fermentation in general [11]. Therefore, the objective of t he present study was to evaluate N f ractions in LS wilted with different intensities t o DM contents of 250 or 350 g kg- and with or without t he addition of sucrose. The hypothesis was that the highest TP preservation would occur in those LS,which received high-intensity wilting to 350 g kg-1 and with sucrose addition. 2. Materials and Methods 2.1. Preparation of Silages The procedure for the preparation of the LS was adopted from Edmunds et al. [9] and partly modified as described i n the following. On the 19th of July 2016, the third cut of a one hectare pure lucerne stand (cultivar Plato) at the early bud stage of maturity was harvested using a disc mower without a mechanical conditioner at 10 cm stubble height at the Educational and Research Centre Frankenforst of the Faculty of Agriculture, University of Bonn (Konigswinter, Germany, 7° 12' 22"E;50°42’49"N). The harvested material was immediately collected from the f ield and equally spread on either black plastic i n the sun (high-intensity wilting; HI ) or on white plastic i n the shade (low-intensity wilting; LI). The lucerne layers on each plastic had a thickness of approximately 10 cm to ensure sufficient and consistent exposure of the entire plant material to the solar radiation. Immediately,a composite sample was taken and stored at -20 °C for l ater analysis. This composite sample consisted of 20 single samples that were taken from different places of the lucerne l ayers on the white and the black plastic, respectively. During silage preparation, the sky was clear, and the weather conditions were sunny with a relative humidity of 59%, a maximum temperature of 32 °C and 15 h of sunshine during the day and a minimum t emperature of 20 C during the night. The plant material was wilted to DM l evels (DML) of 250 and 350 g kg-1, r espectively, and ensiled either without or with sucrose addition (SU) of 125 g kg-1 DM. The amount of added sucrose was chosen as i t constitutes the difference between the average WSC content of l ucerne with 65 g kg-1DM and perennial ryegrass (L o lium perenne L.) with 190g kg -1DM [12], which is good t o ensile [13]. T he compac t ion of the lucerne at ensiling was calculated according to t he recommendations of the Federal Working Group for Forage Preservation (Bundesarbeitskreis Futterkonservierung; [12]) in Germany with 190.4 (±2.3) kg DM m-3for low-DM LS and 215.8(±4.6) kg DM m-3for high-DM LS. The l ucerne was ensiled in duplicate in 60 1 plastic containers and stored for 120 days. Thus, eight different silage t reatments were finally prepared, which are referred to as: 250HISU, 250HI , 250LISU, 250LI, 350HISU, 350HI, 350LISU,and 350LI. The required wi l ting durations were 2.5 h for 250HISU and 250HI , 4.0 h for 250LISU and 250LI , 7 h for 350HISU and 350HI and 22 h f or 350LISU and 350LI. 2.2. Basic Analysis After 120 days, the two plastic containers of each LS were pooled and t hree composite samples,each compr i sing 20 single samples from different spots of the silage heap, were taken and checked for the presence of mould or any other signs of spoilage. All composite samples were thoroughly mixed and 800 g fresh matter of each were freeze-dried and ground successively using 3 mm and then 1 mm sieves (SM 100, Retsch, Haan, Germany). These samples were used for the following analyses, except fermentation pattern analysis, which was conducted with two subsamples (50 g) of each LS that were immediately taken after silo opening and stored at -20°℃. The proximate analyses were conducted in accordance with t he Association of German Agricultural Analytic and Research Institutes (VDLUFA;[14]). The DM content was determined by drying the fresh silages overnight at 60C and subsequently at 105 °C for at least 3 h (method 3.1).Using the equation from Weissbach and Kuhla [15], DM was corrected for the loss of volatile compounds that occur during drying.Crude protein was determined by the Kjeldahl method (method 4.1.1) using a Vapodest 50s carousel (Gerhardt, Konigswinter, Germany) and multiplying N by 6.25. Proportions of neutral detergent f ibre assayed with a heat stable amylase and expressed exclusive of residual ash (aNDFom), acid detergent f ibre expressed exclusive of residual ash (ADFom), and acid detergent lignin (ADL ) were determined in accordance with methods 6.5.1, 6.5.2, and 6.5.3, respectively. 2.3. Crude Protein Fractionation and Amino Acid Analysis The CP fractionation was performed according to the Cornell Net Carbohydrate and Protein System [16], following recommendations and standardizations of Licitra et al. [17].卜 Briefly,five fractions (all expressed as g kg-1 CP; A, B1, B2, B3, and C) were obtained; fraction A represents NPN, fraction B1 represents rapidly ruminally degradable TP, fraction B2 represents moderately ruminally degradable TP, fraction B3 represents slowly ruminally degradable TP and fraction C represents indigestible TP. Fraction A is the difference between tota l CP and TP,which precipitates in tungstic acid. Fraction B1 is the difference between total TP and borate-phosphate-buffer-insoluble TP. Fraction B2 is borate-phosphate-buffer-insoluble TP minus neutral-detergent-insoluble TP and fraction B3 is the difference between neutral-detergent-insoluble TP and acid detergent-insoluble TP. Fraction C is acid-detergent-insoluble TP. Subsequently, total TP concentrations (g kg-1 CP) of samples were calculated by 1000 minus f raction A. The contents of free AA and total AA (sum of peptide-bound and free AA), including gamma-aminobutyric acid (GABA), were determined by ion-exchange chromatography according to the Commission Regulation (EC) No. 152/2009 of t he European Communities [18]. This method is not valid for the determination of tryptophan and cannot differentiate between D and L forms of AA. Briefly, free AA were extracted with diluted hydrochloric acid and co-extracted nitrogenous macromolecules were precipitated with sulfosalicylic acid and removed by filtration before the free AA determination by ninhydrin reaction with spectrophotometric detection at 570 nm. The procedure for total AA determination depended on AA under i nvestigation. Prior to hydrolysis, Cys and Met were oxidized with a performic acid-phenol mixture to cysteic acid and methionine sulphone, respectively,whereas Tyr was determined in unoxidized samples only. All remaining AA were determined in either the oxidized or unoxidized sample. Samples were then hydrolyzed with hydrochloric acid and determined by ninhydrin reaction using spectrophotometric detection at 570 nm or 440 nm for Pro. 2.4. Modified Hohenheim Gas Test In order to estimate utilizable CP at the duodenum (uCP), the modified Hohenheim gas test [19,20]was conducted as outlined in detai l by Edmunds et al. [21]. Briefly, ruminal f luid was collected before morning feeding from two rumen-fistulated sheep receiving a 1:1 grass hay-pelleted compound maintenance ration twice daily. An amount corresponding to 200 mg DM of each sample was incubated in duplicate in each of two runs in 30 mL of ruminal fluid-buffer solution for 8 and 48 h, as r ecommended for forages [22]. At the end of these i ncubation periods, syringe contents were analyzed for ammonia-N applying a Vapodest 50s carousel and uCP was calculated using t he following equation: where ammonia-N i s in mg 30 mL-1, blank refers to the ruminal fluid-buffer solution without sample substrate, sample refers to the ruminal fluid-buffer solution with sample substrate, Nsample i s N added to the syringe through the sample substrate (mg), and sample weight is the amount of sample substrate (mg DM) weighed into the syringe. When using a live product such as ruminal f luid, small biological fl uctuations among runs are i nevitable. To correct for t his a protein standard provided by the University of Hohenheim was analyzed with every run. The standard was a concentrate mixture of (kg-1 DM) 450 g rapeseed meal, 300 g faba beans, and 250 g molasses sugar beet pulp, and had a CP content of 254 g kg-1DM. The correc t ion f ollows t he same method as for gas production [23]whereby the mean uCP value for the standard, provided by the University of Hohenheim for 8 or 48 h,is divided by the recorded value of the standard for that run and all other samples are multiplied by the resulting correction f actor. Whole runs were repeated if the correction factor, for either incubation t ime,lay outside the range of 0.9-1.1. The hay and concentrate standards typically used for correcting gas production were also included in the incubation, not only to correct gas production values, but to ensure the ruminal fluid solution followed typical fermentation. After the correction of obtained uCP, values from the incubation t imes were plotted against a log ((ln) time) scale and the resulting regression equation was used to calculate t he effective uCP at passage rates of 0.02,0.05, and 0.08 hr-1,which are referred to as uCP2, uCP5, and uCP8, respectively. These passage rates represent t he ruminal digesta f low, i ncluding the solid and liquid phase, in animals with different production levels [24]. 2.5. Fermentation Pattern Analysis Subsamples (50 g) of all silages were used for f ermentation pattern analysis. Procedures, as well as detection limi t s, are described in detail by Brining et al. [25]. Briefly, a cold-water extract was prepared from all samples by blending the f rozen substrate with 200 mL distilled water and 1 mL toluene and refrigerated overnight at 4C. Extracts were then f iltered using MN 615 filter paper (Macherey-Nagel,Duren, Germany) and subsequently microfiltered (Minisart RC, 0.45 um pore size;Sartorius, Gottingen, Germany). Ammonia-N concentration was analyzed colorimetrically based on the Berthelot reaction [26]. The pH of the extracts was determined potentiometrically and l actic acid concentration was analyzed by high-performance l iquid chromatography with refractive i ndex detection in accordance with Weif and Kaiser [27]. Volatile fatty acids, alcohols (methanol , ethanol,propanol, butanol, 2,3-butanediol), ethyl lactate, ethyl acetate, propyl acetate, and acetone were determined by gas chromatography with flame ionization detection [28,29]. The concentrations of WSC were determined using the anthrone method [30]. 2.6. Statistical Analysis Statistical analysis was performed with the GLM procedure of SAS version 9.3 (SAS Institute I nc.,Cary, NC, USA) using the following model: Y=u+a日+b;+ Ck +eejk where u i s t he mean, a; i s t he effect of the SU, b i s t he effect of the wilting intensity (WI), C i s t he effect of the DML and eijk is the residual error. The significance level was set at α=0.05. In order to test for i nteractions, field replicates would have been necessary [31], which were not available i n the present study. As a consequence,s ilos were pooled to avoid an artificially created variation and only the main effects were tested. Particularly due to the l imited extent of the present study, we preferred to cautiously draw conditional conclusions from a smal l er data set as recommended by Lowry [32]. 3. Results 3.1. General Chemical Composition As shown in Table 1, DM content was affected by SU and was slightly higher in SU LS. Concerning the CP content, effects of all three pre-ensiling treatments could be observed, whereby CP proportions ranged f rom 188 to 219 g kg -1 DM and were higher in LS without SU, LI, and 250DML, respectively.The SU treatment also affected the f ibre fractions aNDFom and ADFom, which were lower in SU LS.No treatment factor had an effect on ADL. Table 1. Effect of sucrose addition (SU), wilting intensity (WI), and dry matter (DM) level (DML) on DM content (g kg-1), crude protein content (g kg-1DM), and fibre f ractions (g kg-1DM) in lucerne silages (fresh lucerne values are provided as ease for comparison) Silage DM CP aNDFom ADFom ADL Fresh lucerne 213.1 213 431 340 91 250HISU 254.8 195 458 322 88 250HI 240.5 215 463 364 88 250LISU 255.0 198 422 325 87 250LI 246.8 219 429 355 86 350HISU 344.5 188 416 325 88 350HI 340.0 211 446 338 90 350LISU 346.8 195 390 312 96 350LI 339.0 213 421 336 95 Results of statistical analyses SEM 18 4 9 6 1 SU NS WI NS * NS NS NS DML NS NS NS 250HISU=250 g kg -1, high-intensity wilting and sucrose addition; 250HI=250 g kg-1, high-intensity wilting and no sucrose addit i on; 250LISU=250 g kg-1,low-intensit y wilt i ng and sucrose addition; 250LI=250gkg-1,low-intensity wilting and no sucrose addition; 350HISU=350gkg-1, high-intensity wilting and sucrose addition;350HI=350 g kg1, high-intensity wilting and no sucrose addit i on; 350LISU=350 gkg-1, l ow-intensity wilting a nd sucrose addition; 350LI=350gkg -1, l ow-intensity wil t i ng and no sucrose addition; DM= Dry matter; CP= C r ude protein; aNDFom= Neutral detergent f ibre after incineration and amylase treatment; ADFom = Acid detergent f ibre after incineration; ADL=Acid detergent l ignin; SEM= Standard error of t he mean (without consideration of f resh lucerne); NS = not significant; * =p<0.05; **=p<0.01. 3.2. Crude Protein Fractions and Amino Acids The CP fractionation revealed various differences between the eight silage t reatments (Table 2).Non-protein N was t he largest CP f raction in all LS but was more than 110 g kg CP-1 higher for 250LI when compared to 350HISU. Likewise, NPN (fraction A) was affected by all three factors, i .e., SU, WI ,and DML , with increased proportions i n 250DML silages. Both HI and SU decreased t he NPN proportion in LS. Moderately ruminally degradable TP (fraction B2) was the second largest fraction and highest in silages wi t h 350DML and SU. As with NPN, t he l argest difference for moderately ruminally degradable TP was found between 250LI and 350HISU. Rapidly (fraction B1) and slowly ruminally degradable TP (fraction B3), as well as indigestible TP (fraction C), were present in small proportions of total CP and slowly ruminally degradable TP was partly not quantifiable. Thus, the effects of SU and DML on t hese fractions are negligible. Total TP was calculated by subtracting NPN (fraction A) f rom total CP. Consequently, 250LI had the lowest TP content and, except for 350LI, was clearly separated from 350DML silages. Table 2. Effect of sucrose addition (SU), wilting i ntensity (WI), and dry matter l evel (DML) on crude protein (CP) fractions (g kg -1CP) and true protein content (g kg-1 CP) i n l ucerne silages (f r esh l ucerne values are provided as ease for comparison). Crude Protein Fraction+ Silage A B1 B2 B3 C TP Fresh lucerne 259 289 383 27 42 741 250HISU 772 13 174 54 228 250HI 799 6 154 53 201 250LISU 782 11 16 47 218 250LI 812 11 139 58 188 350HISU 699 6 251 2 49 301 350HI 744 6 206 49 256 350LISU 718 3 253 2 47 282 350LI 779 7 182 46 221 Results of statistical analyses SEM 14 1 27 1 14 SU NS 一 NS WI 一 NS NS NS NS DML NS # + According to the Cornell Net Carbohydrate and Protein system [16]; 250HISU=250gkg-1, high-intensity wilting and sucrose addition; 250HI=250gkg-1, high-intensity wilting and no sucrose addition;250L I SU=250gkg-,low-intensity wilting and sucrose addition; 250LI=250 g kg-, low-intensity wilting and no sucrose addition;350HISU=350 gkg-1, high-intensity wilting and sucrose addition; 350HI=350 gkg-1, high-intensity wilting and no sucrose addition; 350LISU=350 g kg -1,low-intensity wilting and sucrose addition; 350LI=350gkg-I low-i ntensity wilting and no sucrose addition; TP = True protein; SEM=Standard error of the mean (wi t hout consideration of f resh lucerne); NS = not significant;#=0.05
确定


还剩15页未读,是否继续阅读?

产品配置单


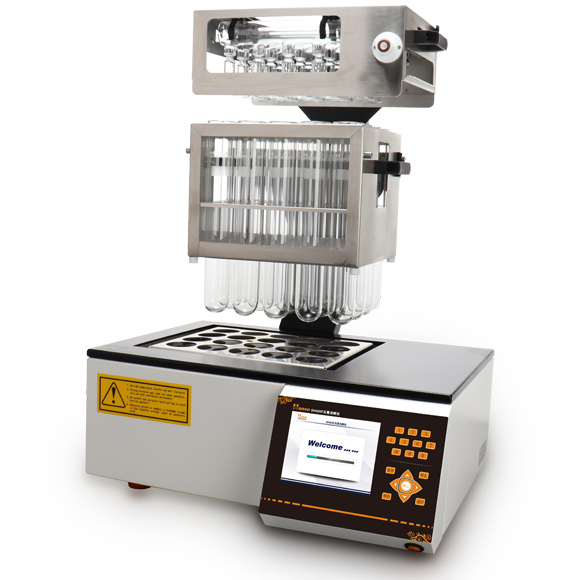
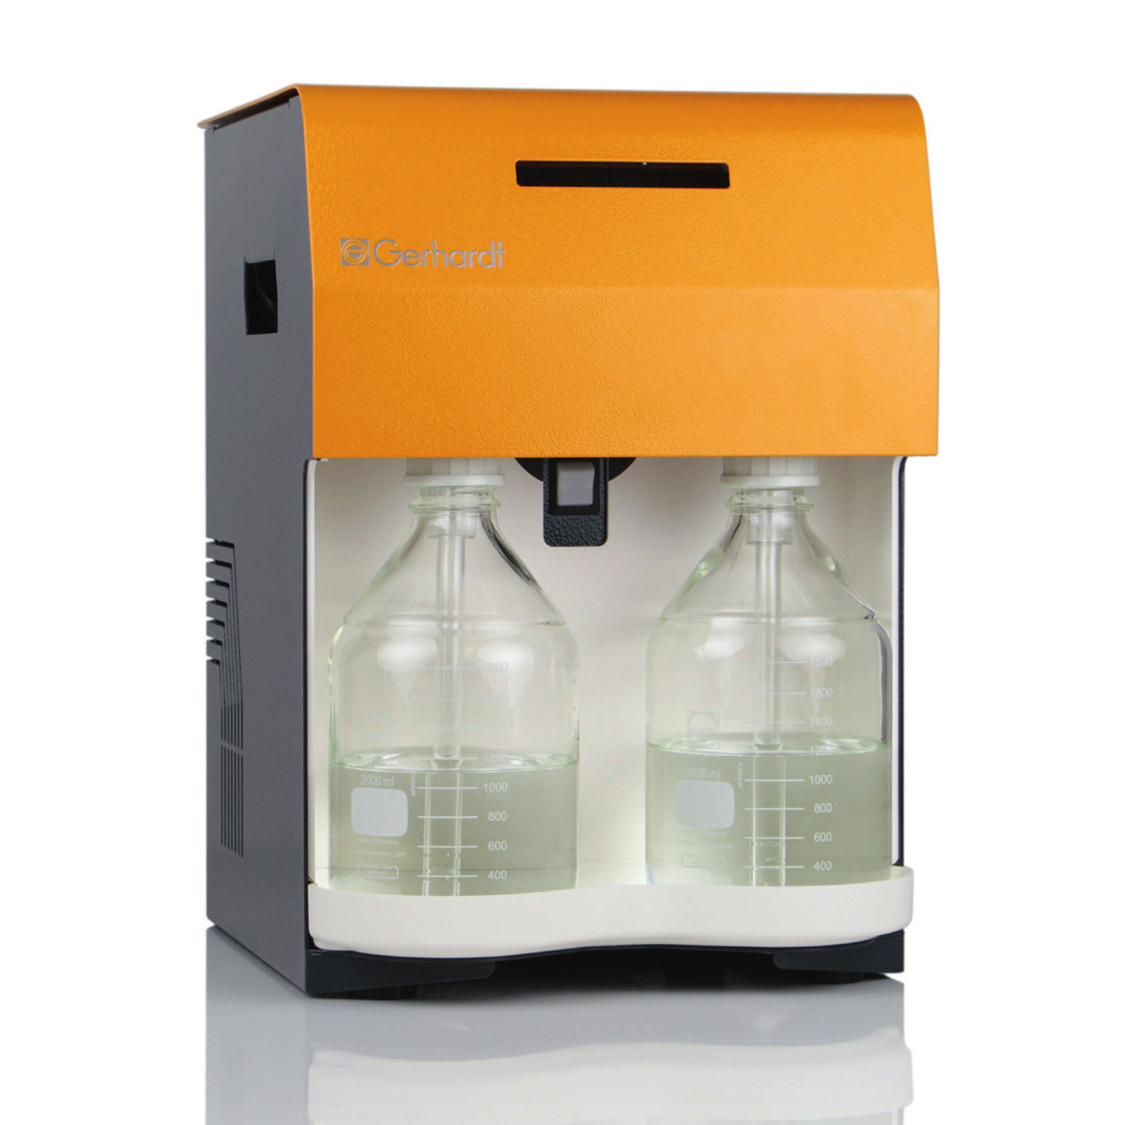
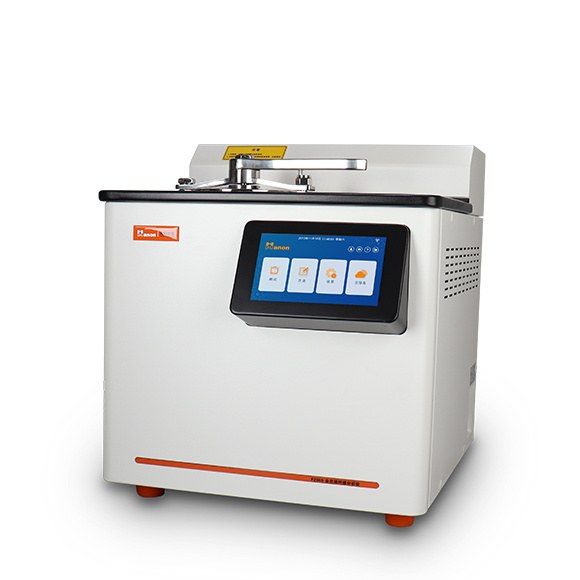
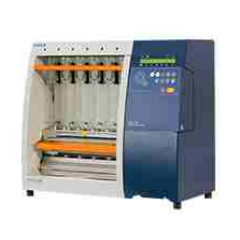
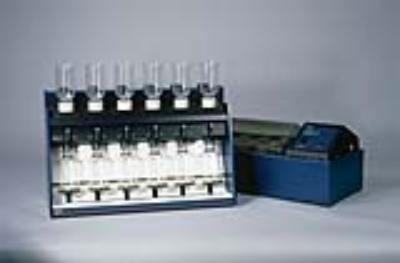
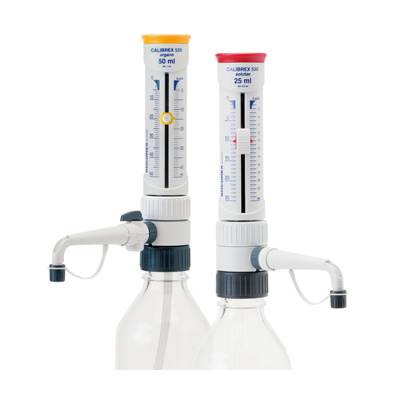
中国格哈特为您提供《紫花苜蓿青贮中蛋白质、a淀粉酶扣灰中性洗涤纤维aNDFom, 扣灰酸性洗涤纤维ADFom, 酸洗木质素ADL含量的检测》,该方案主要用于饲料中营养成分检测,参考标准--,《紫花苜蓿青贮中蛋白质、a淀粉酶扣灰中性洗涤纤维aNDFom, 扣灰酸性洗涤纤维ADFom, 酸洗木质素ADL含量的检测》用到的仪器有格哈特带自动进样器凯氏定氮仪VAP500C、格哈特快速干燥仪STL56、格哈特凯氏消化系统KT8S、格哈特维克松废气实验室废物处理系统涤气VS、格哈特全自动型纤维分析仪FT12、德国加液器MM、凯氏定氮催化片


相关方案
更多
该厂商其他方案
更多