


方案详情
文
马泡瓜中表没食子儿茶素没食子酸酯含量和概略营养的测定Proximate Composition and Determination of Epigallocatechin Gallate Content in Melon Manis Terengganu
方案详情

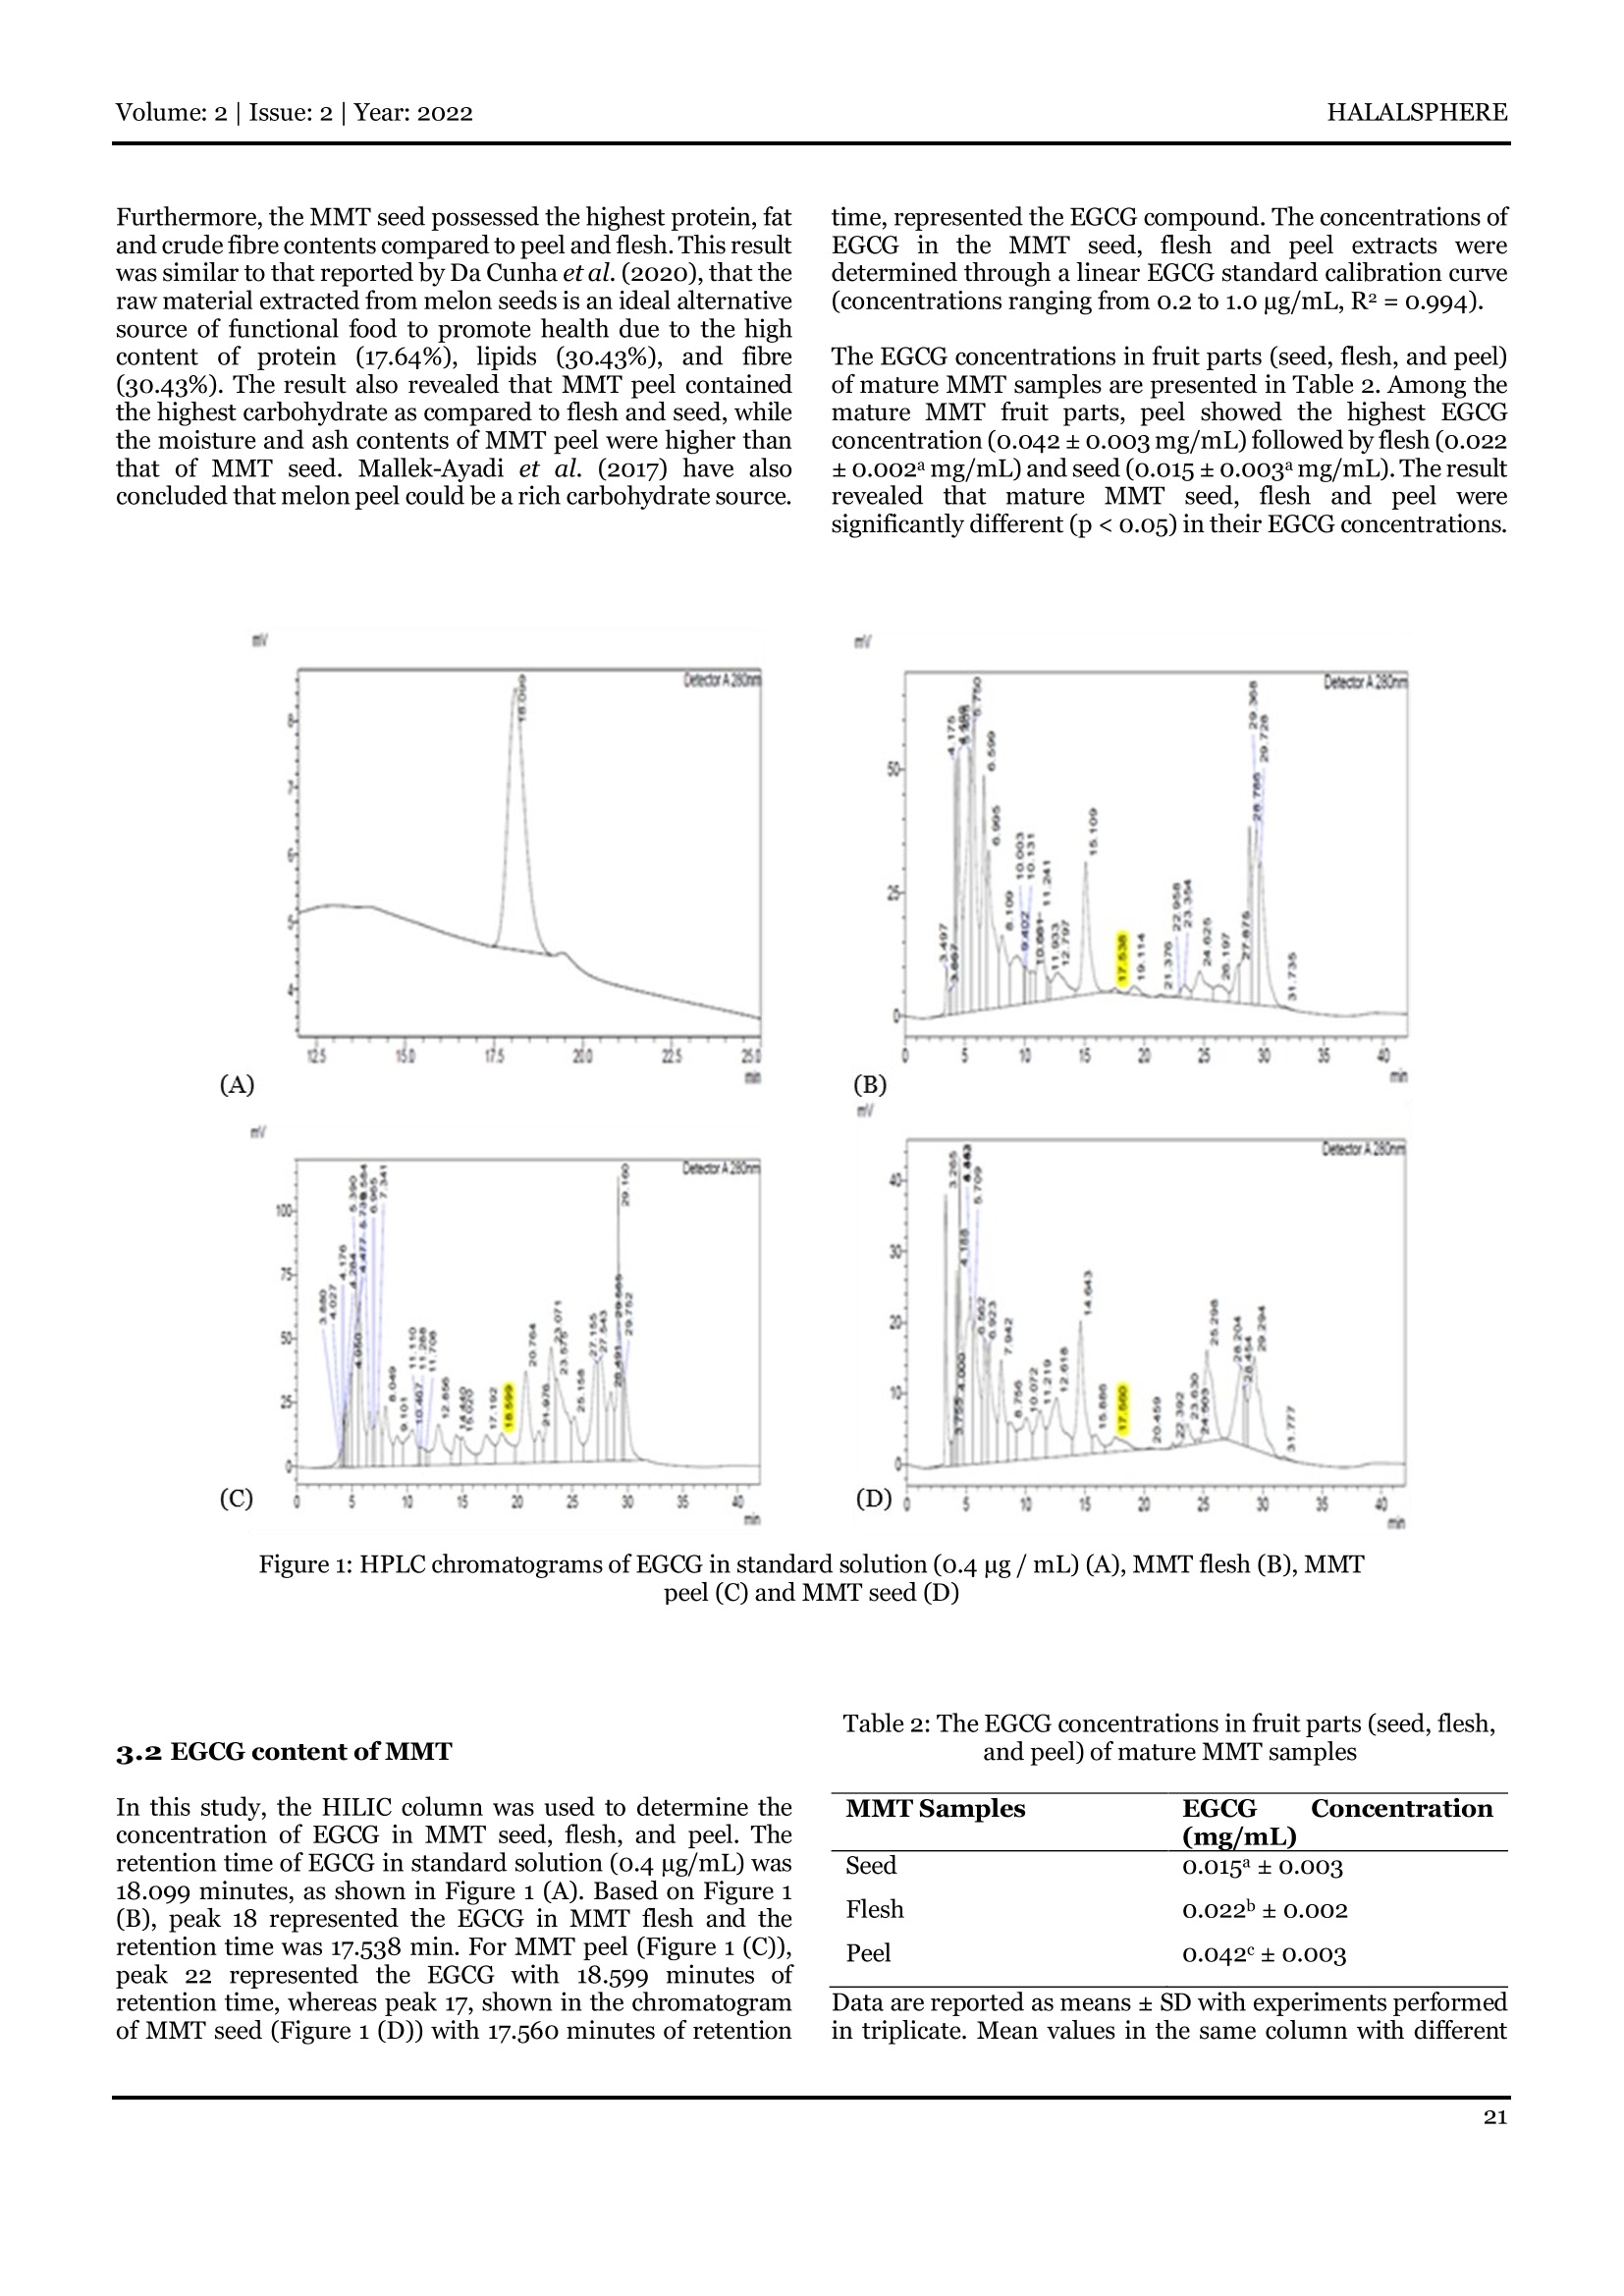
马泡瓜中表没食子儿茶素没食子酸酯含量和概略营养的测定Proximate Composition and Determination of Epigallocatechin Gallate Content in Melon Manis TerengganuHALALSPHEREVolume: 2|Issue: 2| Year: 2022 HALALSPHERE International Islamic University Malaysia --INHART 马泡瓜中表没食子儿茶素没食子酸酯含量和概略营养的测定 Proximate Composition and Determination of Epigallocatechin Gallate Content in Melon Manis Terengganu 色 halalsonere Norshazila Shahidan a, Yi Sia Su, Ying Qian Ongb, Sakinah Harithb, Mohd Razif Shahril, and Hermizi Hapidind aSchool of Food Industry, Faculty of Bioresources and Food Industry, Universiti Sultan Zainal Abidin, Tembila Campus, 22200Besut , Terengganu, Malaysia. bSchool of Nutrition and Dietetics, Faculty of Health Sciences, Universiti Sultan Zainal Abidin, Gong Badak Campus, 21300 Kuala Nerus, Terengganu, Malaysia. cNutrition Program, Center for Healthy Ageing and Wellness, Faculty of Health Sciences, Universiti Kebangsaan Malaysia, Jalan Raja Muda Abdul Aziz, 50300 Kuala Lumpur, Malaysia. dBiomedicine Programme, School of Health Sciences, Health Campus, Universiti Sains Malaysia, 16150 Kubang Kerian, Kelantan,Malaysia. *Corresponding author: E-mail address: n orshazila@unisza.edu.my Abstract Received: 13/9/21 Accepted:7/7/22 Published: 31/7/22 Keywords: Epigallocatechin gallate (EGCG); High performance liquid chromatography (HPLC); Melon Manis Terengganu (MMT); Proximate analyses. 1. Introduction In Malaysia, there are t hree types of melons known as watermelon (Citrullus lanatus), rockmelon (Cucumis melo L.var. Cantalupensis) and honeydew (Cucumis melo L. var.Inodorus ). These melons are widely cultivated and easily obtained in Peninsular Malaysia, such as Johor, Kedabne Kelantan Pahang, and Terengganu (Masde & Mohd, 2016).Melon Manis Terengganu (MMT) is a newly developed variety of melon introduced specifically for Terengganu. Cucumis melo L. has been claimed to have high nutritional value such asV itamin C, fibre, and antioxidants (Silva et al., 2020).Furthermore, MMT can be processed into various products such as ice cream, jelly, juice, and jam (Athirah et al.,2018). MMT is one o f the rockmelon (Cucumis melo L.) species under the Cucurbitaceae family, a moderately large family of flowering plants (Muhamad et al.,2018). According to Ajuru and Okoli (2013), the cucurbitaceae family is an outstanding family of dicotyledons. They have large leaves, creeping or climbing stems with simple or branched tendrils, fleshy fruits with leathery exocarp, numerous seeds and a woody rootstock.These plants are widely produced and consumed in the tropical parts of the world, such as Europe, Asia, and Africa (Mallek-Ayadi et al.,2018). The increased consumption of fruits causes an increment in the volume of waste generated, especially peels and seeds. The production o f melon (Cucumis melo L.) has increased in recent years and has high economic value. However, the parts of fruits such as peels and seeds are wasted and known as by-products.These inedible parts are discarded during processing and consumption (Rolim et al., 2018). In fact, instead of fruit flesh,the by-products (peels and seeds) from different fruits can be essential sources of valuable nutrients such as carbohydrates,fibre and protein due to their proximate composition.The phenolic compounds have been associated with several potential posi t ive health benefits due to their antioxidant activ it ies and free radical-scavenging abilities (Menon & Ramana Rao, 2012). Morais et al. (2017) proved that melon (Cucumis melo L.) contained phenolic and f lavonoid compounds i n all fruit parts (flesh,peels, and seeds). According to Ravindranath et al. (2021), Cucumis melo is rich in phenolic compounds. Meanwhile, according to another study by Ahmed et al.(2021), Cucumis melo is rich in carotenoid, phenolic and flavonoid compounds and high in antioxidant value (Silva et al.,2021). Even though the Cucumis melo is rich in bioactive compounds, several studies on the bioactive compounels seemed to reveal a lack of focus on the epigallocatechin gallate (EGCG) content in the melon (Cucumis melo L.). EGCG Tihe ash content was carried out based on AOAC Official Method Epigallocatechin-3-gallate(EGCG), a polyphenol mainly found in tea leaves and has received significant attention due to i ts protective role in the prevention of the diseases (Chowdhury et al.,2016). Severa l studies found that EGCG has several benef i ts in fighting chronic diseases such as cancer, diabetes, heart diseases, and obesity (Granja et al., 2017). Thus, this study focused on the proximate composition and EGCG content of mature MMT (Cucumis melo L.) f ruit parts (flesh, peels, and seeds). Hopefully, this finding will increase these values to be used as food ingredients in the future. 2. Materials and methods 2.1 Sample preparation The mature MMT with the average weight (650g-700 g),length (11 cm - 13 cm), diameter (10 cm - 12 cm) and sugar content (8°Brix -9 °Brix) was collected from the MMT plantation at Kampung Telaga Papan, Setiu, Terengganu. The mature MMT was washed under running tap water to remove any i mpuri t ies, dust or foreign substances and separated into different parts: flesh, seeds, and peel. Before drying in the cabinet dryer at 50°℃ for 72 hours, the peel , seeds and sliced flesh were soaked in 0.2% sodium metabisulphite (to preserve the sample) for 15 minutes (Muhamad et al., 2018). Then, the dried pieces of frui t parts were ground into powder form using a stainless-steel grinder. The sample powder was then sieved through 500 um mesh and stored in an airtight container in the freezer (-18°C) before extraction. 2.2 Proximate analyses 2.2.1 Determination of moisture content The sample's moisture content was determined through the Association of Official Analytical Chemists (AOAC) Official Method 977.11-1980. Empty crucibles were pre-dried in the oven (Memmert, Schwabach, Germany) at a temperature of 105°C for 4 hours and then cooled at room temperature in a desiccator before being weighed (W1). Approximately 0.5 g of sample (W2) was spread evenly in the crucible and allowed to dry at 105°℃ overnight . After cooled , the weight of the crucible containing the dried sample was taken (W3) to calculate the moisture content based on the loss of weight on drying and the results were expressed as a per cent of dry weight. The following equation was used to compute the percentage of moisture content: % Moisture=(W2-W3)/(W2-W1)×100% Where: W1= Weight of empty crucible (g) W2= Weight of sample (g) W3= Weight of crucible + dried sample (g) 2.2.2 Ash content determination 923.03-1923.A muffle furnace was used to pre-ignite (550℃,3hours) empty crucibles and their lids. Then, they were cooled in a desiccator and weighed (W1). Approximately o.5 g of sample (W2) was i nserted i nto the crucible, then transferred to a muffle furnace (550℃, 6 hours) and incinerated until it was free of black carbon particles. The weight of crucibles with l ids and residues (W3) was taken after cooled i n the desiccator. The following equation was used to compute the percentage of ash content: Where: W1= Weight of empty crucible (g) W2 = Weight of sample (g) W3 = Weight of crucible +ash (g) 2.2.3 Crude protein content determination The nitrogen content was determined using AOAC Official Method 955.04. Approx i mately o.5 g of s ample was digested with 15 mL concentrated sulphuric acid (400℃) using a block digester (Gerhardt, Germany) with the presence of Kjeltabs,which acted as a catalyst in the reaction mixture. The digestion process ended as the sample colour changed from black to coral blue. A blank (without sample) was p repared. The digested mixture was transferred to a d dist i llation unit (Gerhardt,Germany )) and neutralised using sodium hydroxide. The ammonia l iberated was collected in 25 mL of 2% boric acid containing 5 drops of protein indicator solution (methy l red-bromocresol green indicator). The dist il late was t i trated using 0.1 M of hydrochloric acid. The endpoint was noted as the boric acid solution changed from green to pink. The protein conversion factor (6.25) was used based on the assumption that the protein contains 16% nitrogen (Tome, Cordella, Dib, &Peron, 2019). The percentage of crude protein content was calculated using the following equation: % Nitrogen =(0.1x (A-B) x 14.007 x100)/ (Weight of sample (g)x1000) % crude protein= % of Nitrogen x Protein Factor Where: N= normality of HCl used (mol/L) A = volume of HCl used to titrate sample (L) B = volume of HCl used to t i trate blank (L) 14.007 = molecular weight of nitrogen (kg/mol ) W = weight of sample (g) F = protei n conversion factor 2.2.4 Crude fat content determination The crude fat content determination was based on AOAC Official Method 960.39-1960.Approximately o.5 g (W1) of the sample was weighed and folded in a f ilter paper (Whatman No.1). Firstly, the extraction cup was dried in an oven at 105°Cfor 4 hours. After being left to cool at room temperature in a desiccator, the empty extraction cup was weighed (W2). The sample was inserted into a porous cellulose thimble and placed in an extraction cup. Next , 150 mL of petroleum ether (boi l ing point: 40℃ - 60℃) was poured into the cup before being attached to t he automated fat extraction system (Gerhardt,Germany). After the extraction process was completed (2hours), the extraction cup was dried in the oven at 105°℃ for 24hours to evaporate the remaining petroleum ether. After being left to cool in the desiccator, the extraction cup with the fat sample was weighed (W3). The following equation was used to compute the percentage of crude fat content: Where: W1= Weight of sample (g) W2 = Weight of empty extraction cup (g) W3=Weight of extraction cup with sample (g) 2.2.5 Crude fiber content determination The crude f ibre analysis was carried out according to AOAC Official Method 911.43. Empty f ibre bags were dried in an oven at 105C for 4 hours, while the crucibles with l ids were burned in a muffle furnace (Carbolite Gero, UK) at 550℃ for 3 hours.After drying, the fibre bags were let to cool in a desiccator before being weighed (W2). Approximately 0.5 g of sample (W1) was placed in the fibre bag. Glass spacer was inserted in 15the f ibre bag and placed into a carousel, then inserted onto an automated fibre analyser, Fibretherm chamber (Gerhardt,Germany). After the processes were completed, the sample was rinsed with dist i lled water, inserted into the burned crucible,and dried at 105C for 24 hours. The dried crucible containing the dried fibre bag and dried sample were cooled at room temperature in the desiccator before bei n g weighed (W3). The sample in the crucible was burned in a muffle furnace at 550℃for 6 hours. The sample was left to be cool in the desiccator before being weighed (W4). The percentage of crude fibre content was calculated using the following equation: Where: W1= Weight of fiber bar (g) W2 = Weight of sample (g)W3= Weight of crucible and fiber bag after digestion (g)W 4 = Weight of crucible and ash (g) W5= Weight of blank value of the empty fiber bag (g) W6= Weight of crucible (g) 2.2.6 Total carbohydrate content determination The sample's total carbohydrate content was calculated using the following formula: Carbohydrate,%=100%-%(moisture + ash + crude protein + crude fat). 2.3 Extraction of phenolic compounds Samples were extracted with deionised water following the procedure described by Wissam et al. (2012). Accurately 200mg of sample powder was placed in a thermostatic water bath shaker with 10 ml of deionised water at 50°℃ for 20 minutes. The supernatant was collected by centrifugation at 2000 rpm for 10 minutes at 25℃ (Mitchell et al., 2017) and fi l tered through Whatman filter paper No. 1 to obtain a clear solution.Then, 10 ml of deionised water was added to the solid residue and extracted twice for 20 minutes in a thermostatic water bath shaker at 50°C. The supernatants were pooled and freeze-dried using the pilot freeze dryer VirTisTM SP Scientific at -40℃ for 72 hours. 2.4 Reversed-phase high performance liquid chromatography (HPLC) analysis The samples were f iltered through a polypropylene f ilter unit (0.45 um) before being injected for reversed-phase HPLC analysisas described by Pasini et al.(2019)with acetonitrile:acetic acid (98:22v/v) (Merck,,Darmstadt Germany) as mobile phase A and methanol:water:acetic acid (95:3:2 v/v/v) (Merck, Darmstadt Germany) as mobile phase B. The conditions were held at 100% B for 7 minutes before returning to 7% B (starting condition) over 6 minutes. The f low rate i s o.8 ml/min. Shim-pack GIS HILIC column (250 x 4.6mm) (Shimadzu, Japan) was used in t his analysis. The column was allowed to re-equilibrate in 93% solvent A for 10 minutes before the next injection. The temperature of the column was maintained at 35°C. The injection volume was 1 uL. The separation was monitored by UV-Vis at 28o nm. Peak identification will be performed by comparing retention time and UV-Vis spectra. HPLC analysis was performed i n triplicate (analysis for each sample is repeated three times). 2.5 Standard solution preparation Stock solutions containing the standard substances were prepared and diluted to appropriate concentrations ranging from 0.2 - 1 ug/mL with the same solvent. Briefly, the calibration was achieved using the standard substance epigallocatechin gallatee((EGCG)(Merck, Darmstadt,Germany). The standard cal i bration curve of peak areaiany).1. (y)against concentration (x) was plotted. A linear regressionm ethod was used to identify the slope and correlation coefficient of the linear regression equation. 2.6 Statistical analysis Data obtained from all the proximate analyses and the concentration of EGCG were analysed using Analysis of Variance (ANOVA) of IBM SPSS for Windows Version 21.0software. Statistical analysis was used to test whether there was a significant difference between samples based on the result of neI each analysis at a 95% confidence level. Post hoc Tukey's multiple comparison test was used to determine which sample was significantly different from other samples in the analysis. 3. Results and discussion Table 1: The proximate composition of different fruit parts (seed, flesh, and peel) of mature MMT samples Data are reported as means ± SD with experiments performed in triplicate. Mean values in the same row with different superscripts are significantly different (p<0.05) 3.1 Proximate composition of MMT The proximate composition of different fruit parts (seed, flesh, Composition (%) MMT Samples Seed Flesh Peel Moisture 5.83± 19.21°十 9.49± 0.08 0.34 0.05 Ash 4.98a± 14.13°± 8.24± 0.04 0.12 0.04 Protein 27.99°± 0.36 17.31± 13.31± 0.45 0.05 Fat 28.79± 1.37± 1.49± 0.32 0.34 0.35 Carbohydrate 32.40± 0.26 47.98b± 0.25 67.48°± 0.37 Crude Fibre 31.64°± 1.25 14.96a± 0.38 27.78± 0.26 and peel ) of mature MMT samples is presented in Table 1. The moisture, ash, protein, carbohydrate, and crude f ibre analyses showed significant di f ferences (p<0.05) among different MMT fruit parts (seed, f lesh , and peel ). However, the result revealed that MMT f lesh and peel have no significant difference in fat content (p <0.05), whereas they were significantly different from the MMT seed sample (p<0.05). The moisture content of any food material represents a measure of the life span of the food. It suggests how long food material can be stored without becoming mouldy (Raji &Orelaja, 2014). The result showed that the MMT seed possessed the lowest moisture content, followed by the peel and flesh. The moisture content of the MMT seed (5.83±0.08%) was lower than that of Maazoun melon seed (7.16%) laazc (Mallek-Ayadi et al.,2018), while it was almost similar to that of melon (Hybrid 1variety) seed (5.80±0.20%) (Petkova & Antova, 2015).Besides, the moisture content of MMT peel (9.49±0.05%) was higher as compared to Sharlyn melon peel (6.49%) (Al-Sayed &Ahmed, 2013), but lower than that of Maazoun melon peel (16.95%) (Mallek-Ayadi et al., 2017). Besides, the result revealed that MMT fruit parts have a significant amount of ash, an essentia l mineral source. MMT flesh showed the highest ash content, followed by peel and seed. MMT peel possessed the ash content (8.24 ± 0.04%),which is higher than that of Maazoun melon peel (3.67%)(Mallek-Ayadi et al., 2017) and Cantaloupe melon seed (4.12%)(Da Cunha et al., 2020). Moreover, the ash content of MMT seed (4.98±0.04%) was in the range from 4.6o±0.20%to5.10±0.10% of ash content in the seeds of three varieties of melon (Honeydew, Dessert 5, and Hybrid 1) as reported by Petkova and Antova (2015). Protein content of MMT fruit parts ranged from 13-31±0.05%to 27.99±0.36%.The protein content of MMT seed was 27.99± 0.36%, higher than flesh and peel. Koubala et al. (2016)found that the protein content of muskmelon (Cucumis melo L.var. Tibish) endocarp was high and significantly increased during the fruit maturation. The protein content of the MMT seed was almost similar to that reported for melon (Maazoun variety) seeds which contained 27.41% of proteins (Mallek-Ayadi et al., 2018). The high protein content of the seed makes the seed suitable for the fortification of foods (Raji & Orelaja,2014). Protein content in the seed i s the highest compared to the other parts due to i ts essential amino acids, as reported by Siddeeg et al., (2015), Cucumis melo var. Tibish seeds are considered to be good sources of protein and contain most of the essential amino acids i n proportions similar to soybeans where the Cucumis melo var. Tibish contains all ofthe essential amino acids, with isoleucine, threonine, lysine, histidine,methionine, and tryptophan being present in the seeds. Among the fruit parts, MMT seed (28.79±0.32%) showed the fat content, which was significantly higher than those of flesh (1.37±0.34%) and peel (1.49 ±0.35%). Yanty et al.(2007)reported that seeds f rom other varieties of melon alsocontained high amoun ts of fat. The fat content of the MMT seed was higher than that of honeydew melon seed (25.00%) (Yanty et al.,2007) but lower than that of Cucumis melo L. hybrid AF-522 seed (30.83%) (De Melo et al.,2000), Cucumis melo L. var.Saccharinus seed (32.30%) (De Mello et al., 2001) and muskmelon seed (37.167%) (Mehra, Pasricha, & Gupta, 2015).Mallek-Ayadi et al.(2018) concluded that melon seed is a rich source of oil which can be used in industrial applications. In contrast, the fat contents of MMT flesh and peel were significantly lower as compared to a seed. In comparison, the carbohydrate content of MMT peel was the highest, followed by f lesh and seed. Mallek-Ayadi et al. (2017)found that melon (Maazoun variety) peel contained 69.77% of carbohydrates which was slightly higher than that of MMT peel (67.48±0.37%). The carbohydrate content of the MMT seed (32.40±0.26%) was higher than that of Maazoun melon seed (29.96%) (Mallek-Ayadi et al., 2018). Koubala et al. (2016)reported that the total carbohydrate content of muskmelon (Cucumis melo L. var. Tibish) was more abundant in the peel than in mesocarp and endocarp throughout the fruit maturation. The abundance of carbohydrates in peels may be attributed to an increase in the synthesis of cell wall polysaccharides which consist of cellulose, pectin, and hemicelluloses (Wang et al., 2021). According to Raji and Orelaja (2014), the crude f ibre of any seedern dicates the presence of a reasonable cuannayoes apene fibre. The crude f ibre contains indigestible materials, reducing constipation by increasing bowel movement (Dai & Chau,2017). MMT seed showed the highest crude fibre content compared to peel and f lesh. The crude fibre content of the MMT seed was slightly lower than that of golden melon (Cucumis melo L.) seed 33.94±0.01% (Raji & Orelaja,2014), but higher than that of M aazoun melon seed (25-32%) (Mallek-Ayadi et al., 2018), honeydew melon seed (23.30%) and Cucumis melo L. hybrid AF-522 seed (19.00%) (Yanty et al., 2007). The fibre content of muskmelon (Cucumis melo L. var. Tibish) mesocarp (flesh) decreased throughout the fruit maturation, while that of the endocarp (seed) decreased at the early stage and increased at the ent i re stage of maturation (Koubala et al.,2016). In general, the results showed that the moisture and ash contents of MMT flesh were the highest compared to seed and peel. According to Olayinka and Etejere (2018), this result was reasonable since plants in the Cucurbitaceae family have been known to have a high amount of water in their fruits. Olayinka and Etejere (2018) also found that the ash content was respectively high in the amount in the pulp than the rind of both watermelon and cucumber. Therefore, the pulp of both sample fruits could serve as a better source of roughages and minerals than the rind . Furthermore, the MMT seed possessed the highest protein, fat and crude fibre contents compared to peel and f lesh. This result was similar to that reported by Da Cunha et al. (2020), that the raw material extracted from melon seeds is an ideal alternative source of functional food to promote health due to the high content of protein (17.64%), l i pids (30.43%), and f ibre (30.43%). The result also revealed that MMT peel contained the highest carbohydrate as compared to flesh and seed, while the moisture and ash contents of MMT peel were higher than that of MMT seed. Mal l ek-Ayadi et al. (2017) have also concluded that melon peel could be a rich carbohydrate source. time, represented the EGCG compound. The concentrations of EGCG in the MMT seed, flesh and peel extracts were determined through a linear EGCG standard calibration curve (concentrations ranging from 0.2 to 1.0 ug/mL,R2=0.994). The EGCG concentrat i ons in fruit parts (seed, flesh, and peel)of mature MMT samples are presented in Table 2. Among the mature MMT fruit parts, peel showed the highest EGCG concentration (0.042±0.003 mg/mL) followed by flesh (0.022±0.002a mg/mL)and seed (0.015±0.003mg/mL). The result revealed that mature MMT seed, flesh and peel were significantly different (p <0.05) in their EGCG concentrations. Figure 1: HPLC chromatograms of EGCG in standard solution (0.4 ug /mL) (A), MMT flesh (B), MMT peel (C) and MMT seed (D) 3.2 EGCG content of MMT In this study, the HILIC column was used to determine the concentration of EGCG in MMT seed , flesh, and peel. The retention time of EGCG in standard solution (0.4 ug/mL) was 18.099 minutes, as shown in Figure 1 (A). Based on Figure 1(B), peak 18 represented the EGCG in MMT flesh and the retention time was 17.538 min. For MMT peel (Figure 1 (C)),peak 22 represented the EGCG with 18.599 minutes of retention time, whereas peak 17, shown in the chromatogram of MMT seed (Figure 1 (D)) with 17.560 minutes of retention Table 2: The EGCG concentrations in fruit parts (seed, flesh,and peel) of mature MMT samples MMT Samples EGCG (mg/mL) Concentration Seed 0.015±0.003 Flesh 0.022b±0.002 Peel 0.042°±0.003 Data are reported as means ± SD with experiments performed in triplicate. Mean values in the same column with different superscripts are significantly different (p<0.05) The result showed that all the fruit parts of mature MMT contained the amount of EGCG concentration. EGCG is the major catechin abundant in green tea and several fruits,including mature pomegranate (Punica granatum Linn.) fruits (Dey et al., 2015). In addition, Chem and Indies (2010)reported that the amount and types of phenolics might change during the growth and maturity of bitter melon. These changes could affect the antioxidant activity of the extracted phenolics.Besides, Deng et al. (2012) found that different fruit residues (peel and seed) had various antioxidant potency, and the variation was considerable. They also revealed that catechin was one of the main bioactive compounds widely found in these residues. The MMT peel showed the highest EGCG concentration compared to flesh and seed. This finding followed those of Morais et al. (2015), which evaluated the seven tropica l fruit parts (pulp, seed, and peel). Moreover, the results showed that the highest phenolic contents were found i n peels compared to pulps and seeds. Rol i m et al. (2018) found that the melon (Cucumis melo L.) peel extracts showed a higher total phenols compound than the melon seed extracts with 110.7±15.03mg gallic acid equivalent per 1oo gram (mg GAE/100 g) and 75.2±7.39 mg (GAE/100 g) respectively. They also revealed that catechin concentrations in the melon peel aqueous extracts were higher (4.10 ug/mL) than that of the melon seed aqueous extracts (1.77 ug/mL). The melon peel is more exposed to environmental stress conditions, which may have caused higher phenolic contents than in the seeds (Rolim et al., 2018). According to Chel-Guerrero et al . (2022), the peels of t ropical fruits are a potential source of various bioactive compounds,such as flavonoids, polyphenols, terpenoids, carotenoids and alkaloids. In addition, Ayala-Zavala et al. (2011) also reported that the contents of functional compounds in different tissues of exotic tropical fruits are primarily in peels and seeds and a lesser extent, in the pulps. However, the results showed that MMT seed possessed the lowest EGCG concentration compared to peel and f lesh. This finding is in agreement with a previous study by Ibrahim and El-Masry (2016) that revealed the highes t content of total phenolic compounds was detected in the cantaloupe skin extract (8.47 mg GAE/g extract),whereas the lowest content was measured in the seeds extract (1.85 mg GAE/g extract) (p<0.05). The total phenolic content of cantaloupe extracts wasarranged in n the following descending order: skin > flesh > seed (p<0.05). Singh et al. (2016) have investigated the polyphenolic content and antioxidant capacity of peels and pulps of four cucurbit fruits, namely pumpkin, ash gourd , watermelon, and muskmelon. They found that the polyphenolic content in muskmelon peels (44.22 ± 1.00 mg GAE/100 g) was higher than that of muskmelon pulps (22.75±0.95 mg GAE/100 g).The muskmelon fruit extracts (peel and pulp) also showed the highest antioxidant activity. The result of this study revealed that MMT peel has the potential to consider as new sources of natural antioxidants for food and nutraceutical products as it contained the highest EGCG concentration as compared to seed and flesh. 4. Conclusion The MMT seed has the highest protein, fat and crude fibre contents compared to peel and flesh, while the MMT peel contains the highest carbohydrate compared to flesh and seed.Among the mature MMT f ruit parts, peel showed the highest EGCG concentration. Therefore, besides MMT flesh, the MMT by-products (peel and seed) can be considered good sources for the development of novel functional foods due to their nutritional value. Moreover,MMT peel has the potentia l to be considered a new source of natural antioxidants for food and nutraceutical products as it contained the highest EGCG concentration as compared to seed and flesh. Acknowledgement This study was funded by the Ministry of Education, Malaysia under the Fundamental Research Grant Scheme (FRGS/1/2018/TK02/UNISZA/03/1). References Ahmed, I . A. M., Al Juhaimi , F., Ozcan, M. M., Uslu, N.,Babiker,E . E., Ghafoor, K., & Sa l ih,H.A. (2021). A comparative study of bioactive compounds, antioxidant activity and phenolic compounds of melon (Cucumis melo L.) slices dehydrated by oven, microwave and infrared systems. Journal of Food Processing and Preservation, 45(7),e15605. Ajuru, M. G., & Okoli, B. E. (2013). The morphologicalc haracterisation of the melonspecies in -m the family Cucurbitaceae Juss. and their utilisation in 1Nigeria.International Journal of Modern Botany, 3(2), 15-19. Al-Sayed, H. M. A., & Ahmed , A. R. (2013). Utilisation of watermelon rinds and sharlyn melon peels as a natural source of dietary fiber and antioxidants in cake. Annals of Agricultural Sciences,58(1),83-95. AOAC (2000) Official Methods of Analysis. 17th Edition, The Association of Official Analytical Chemists, Gaithersburg, MD,USA. Athirah, A., Firdaus, M., Afzan, W., & Zaliha, W.(2018). Effects of different storage temperatures on physicochemical characteristics and quality of Melon Manis Terengganu (Cucumis melo L. var. Inodorus cv. Manis Terengganu 1).Transactions of Malaysian Society of Plant Physiology, 25(1),2600-9595. Ayala-Zavala, J. F., Vega-Vega, V., Rosas-Dominguez, C.,Palafox-Carlos, H., Villa-Rodriguez, J . A., Siddiqui, M. W.,Davila-Avina, J. E. & Gonzalez-Aguilar, G. A. (2011). Agro-industrial potential of exotic fruit byproducts as a source of food additives. Food Research International, 44(7), 1866-1874. Chel-Guerrero, L. D., Cuevas-Glory, L. F., Sauri-Duch, E.,Sierra-Palacios, E., De Leon-Sanchez, F. D., & Mendoza-Espinoza, J . A. (2022). Tropical fruit peels as sources of bioactive compounds: a review . Pak. J . Bot , 54(3),1169-1179. Chem, F., & Indies, W. (2010). Extraction, quantification, and antioxidant activ it ies of phenolics from pericarp and seeds of bitter melons (Momordica charantia) harvested at three maturity stages (immature, mature, and ripe). Journal of Agricultural and Food Chemistry,58(7),4428-4433. Chowdhury, A., Sarkar, J., Chakraborti, T., Pramanik, P. K., &Chakrabort i , S. (2016). Protect i ve role of epigallocatechin-3-gallate in h ealt h a n d disease: a perspective. Biomedicine &Pharmacotherapy, 78,50-59. Da Cunha, J. A., Rolim, P. M., Da Silva Chaves Damasceno, K.S. F., De Sousa, F. C., Nabas, R. C., & Seabra, L. M.A.J .(2020).From seed to flour: Sowing sustainability in the use of cantaloupe melon residue (Cucumis melo L. var. Reticulatus ).Plos One, 15(1),1-18. Dai, F . J ., & Chau, C. F . (2017). Class i fication and r egu l atory perspectives of dietary f iber. Journal of food a n d drug analysis, 25(1), 37-42. De Mello, M. L. S., Bora, P. S., & Narain, N. (2001). Fatty and amino acids composition of melon (Cucumis melo L. var.Saccharinus) seeds. Journal of Food Composition and Analysis,14(1),69-74. De Melo, M. L. S., Narain, N., & Bora, P. S. (2000).Characterisation of some nutritional constituents of melon (Cucumis melo L. hybrid AF-522) seeds. Food Chemistry,68(4),411-414. Deng, G. F., Shen, C., Xu, X . R., Kuang, R. D., Guo, Y. J., Z eng,L. S., Gao, L. L., Lin, X., Xie, J . F., Xia, E. Q., Li, S., Wu, S.,Chen, F., Ling, W. H., & Li, H. B. (2012). Potential of fruit wastes asnatural resources of bioactive compounds.International Journal of Molecular Sciences, 13(7), 8308-8323. Dey, D., Ray, R., & Hazra, B. (2015). Antimicrobial activity of pomegranate fruit constituents againstdrug-resistant Mycobacteriumtuberculosis and p-lactamase producing Klebsiella pneumoniae. Pharmaceutical Biology,53(10),1474-1480. Granja, A., Frias, I., Neves, A. R., Pinheiro, M., & Reis, S.(2017). Therapeutic potential ofepigallocatechin gal l ate nanodelivery systems . BioMed Research International, 2017. Ibrahim, M. E. E., & El-Masry, H. G. (2016). Phenolic content and antioxidant activity of cantaloupe (Cucumis melo L. var.Cantalupensis) and food application. International Journal of Nutrition and Food Sciences, 5(1),16-24. Koubala, B. B., Bassangna, G., Yapo, B. M., & Raihanatou, R.(2016). Morphological and biochemical changes S during muskmelon (Cucumis melo L. var. Tibish) fruit maturation.Journal of Food and Nutrition Sciences, 4(1),18. Mallek-Ayadi, S., Bahloul, N., & Kechaou,N. (2017).Characterisation., phenolic compounds and functional properties of Cucumis melo L. peels. Food Chemistry. doi:10.1016/j.foodchem.2016.10.117. Mallek-Ayadi, S., Bahloul,N., & Kechaou,N. (2018). Chemical composition and bioactive compounds of Cucumis melo L.seeds: Potential source for new trends of plant oils. Process Safety and Environmental Protection. doi:10.1016/j.psep.2017.09.016. Masde, R. M. M., & Mohd, N. R. N. (2016). Overview of melon industry in Malaysia. FFTC Agricultural Policy Platform. doi:10.1097/NOR.obo13e3181db5459. Mehra, M., Pasricha, V., & Gupta,R. K. (2015). Estimation of nutritional, phytochemical and antioxidant activity of seeds of musk melon (Cucumis melo L.) and water melon (Citrullus lanatus) and nutritional analysis of their respective oils.Journal of Pharmacognosy and Phytochemistry,3(6),98-102. Menon, S. V., & Ramana Rao,T. V. (2012). Nutritiona l qual i ty of muskmelon fruit as revealed by its biochemical properties during different rates of ripening. International Food Research Journal, 19(4), 1621-1628. Mitchel l , A. E.,Robertson, D., & Koh , E. (2017). Optimising the extraction of procyanidins oligomers through decamer.Nutrition and Food Science International Journal, 4(3), 555-636. Morais, D. R., Rotta, E. M., Sargi, S. C., Bonafe, E. G., Suzuki,R. M., Souza, N. E., Matsushita,M., & Visentainer,J.V.(2017).Proximate composition, mineral contents and fatty acid composition of the different parts and dried peels of tropical fruits cultivated in Brazil. Journal of the Brazilian Chemical Society, 28(2),308-318. Morais, D. R., Rotta,E. M., Sargi, S. C., Schmidt, E. M., Bonafe,E. G., Eberlin, M. N., Sawaya, A. C. H. F., & Visentainer, J. V.(2015). Antioxidant activ i ty , phenolics and UPLC-ESI(-)-MS of extracts from different tropical fruits parts and processed peels.F ood Research International. doi:10.1016/j .foodres.2015.08.036. Muhamad, N., Sahadan, W., & Ho,L. H.(2018). Effect ofdrying temperatures and extraction solvents on total phenolic,flavonoid contents and antioxidant properties of immature Manis Terengganu Melon (Cucumis melo L.). Journal of Agrobiotechnology,9(1S), 114-121. Olayinka, B. U., & Etejere, E. O. (2018). Proximate and chemical compositions of watermelon (Citrullus lanatus (Thunb.) Matsum and Nakai cv Red and Cucumber (Cucumis satiuus L. cv Pipino). International Food Research Journal,25(3),1060-1066. Pasini, F., Chinnici, F., Caboni, M. F., & Verardo,V. (2019).Recovery of oligomeric proanthocyanidins and other phenolic compounds with established bioactivity from grape seed by-products. Molecules, 24(4),677-689. Petkova, Z., & Antova, G. (2015). Proximate composition of seeds and seed oils from melon (Cucumis melo L.) cul t ivated in Bulgaria. Cogent Food and Agriculture,1(1),1-15. Raji, O. H., & Orelaja, O. T. (2014). Nutritional composition and oi l characteristics of Golden Melon (Cucumis melo L.)Seeds. Food Science and Quality Management, 27,18-22. Ravindra n ath, V., Si n gh, J., Jayaprakasha, G. K., & Pat i l, B. S.(2021). Optimisatio n of ex t rac t ion solvent and fast blue BB assay for comparative analysis of antioxidant phenolics from Cucumis melo L. Plants,10(7),1379. Rolim, P. M., Fide l is, G. P., Padilha, C. E. A., Santos, E. S.,Rocha, H. A. O., & Macedo, G. R. (2018). Phenolic profile and antioxidant activity from peels and seeds of melon (Cucumis melo L. var. Reticulatus) and their antiprol i ferative effect i n cancer cells. Brazilian Journal of Medical and Biological Research,51(4),1-14. Siddeeg, A., Xu, Y., Jiang, Q., & Xia, W. (2015). In v i tro antioxidant activity of protein f ractions extracted from sei n at (Cucumis melo var. Tibish) seeds. CYTA-Journal of Food, 13(3),472-481. Silva, M. A.,Albuquerq u e, T. G., Alves, R. C ., Oliveira, M. B. P.,& Costa, H. S. (2020). Melon (Cucumis melo L.) by-products:Potent i al food ingredients for n ovel functional foods?. Trends in Food Science & Technology, 98,181-189. Tome, D., Cordella, C., Dib, O., & Peron, C. (2019). Nitrogen and protein content measurement and nitrogen to protein conversion factors for dairy and soy protein-based foods: a systematic review and model l ing analysis. In Food and Agriculture Organization ofthe United Nations. Retrieved from http://apps.who.int/bookorders. Singh, J., Singh, V., Shukla, S., & K Rai, A. (2016). Phenolic content and antioxidant capacity of selected cucurbit fruits extracted with different solvents. Journal of Nutrition and Food Sciences, 6(6),1-8. Wang, H.,Wang,J., Mujumdar, A. S.,Jin, X., Liu, Z. L.,Zhang,Y., & Xiao, H. W. (2021). Effects of postharvest ripening on physicochemical properties, microstructure, cell wall polysaccharides contents (pectin, hemice ll ulose, cellulose) and nanost r ucture e0of kiwifruit (Actinidia deliciosa). Food Hydrocolloids, 118,1068o8. Wissam, Z., Ghada, B., Wassim, A., & Warid, K. (2012).Effective extraction of polyphenols and proanthocyanidins from Pomegranate’s peel. International Journal of Pharmacy and Pharmaceutical Sciences, 4(3),675-682. Yanty, N. A. M., Lai, O. M.,Osman, A., Long, K., & Ghazali, H.M.(2007). Physicochemical propert i es of Cucumis melo L. var.Inodorus (honeydew melon) seed and seed oil . Journal of Food Lipids,15(1),42-55.
确定
还剩6页未读,是否继续阅读?

产品配置单


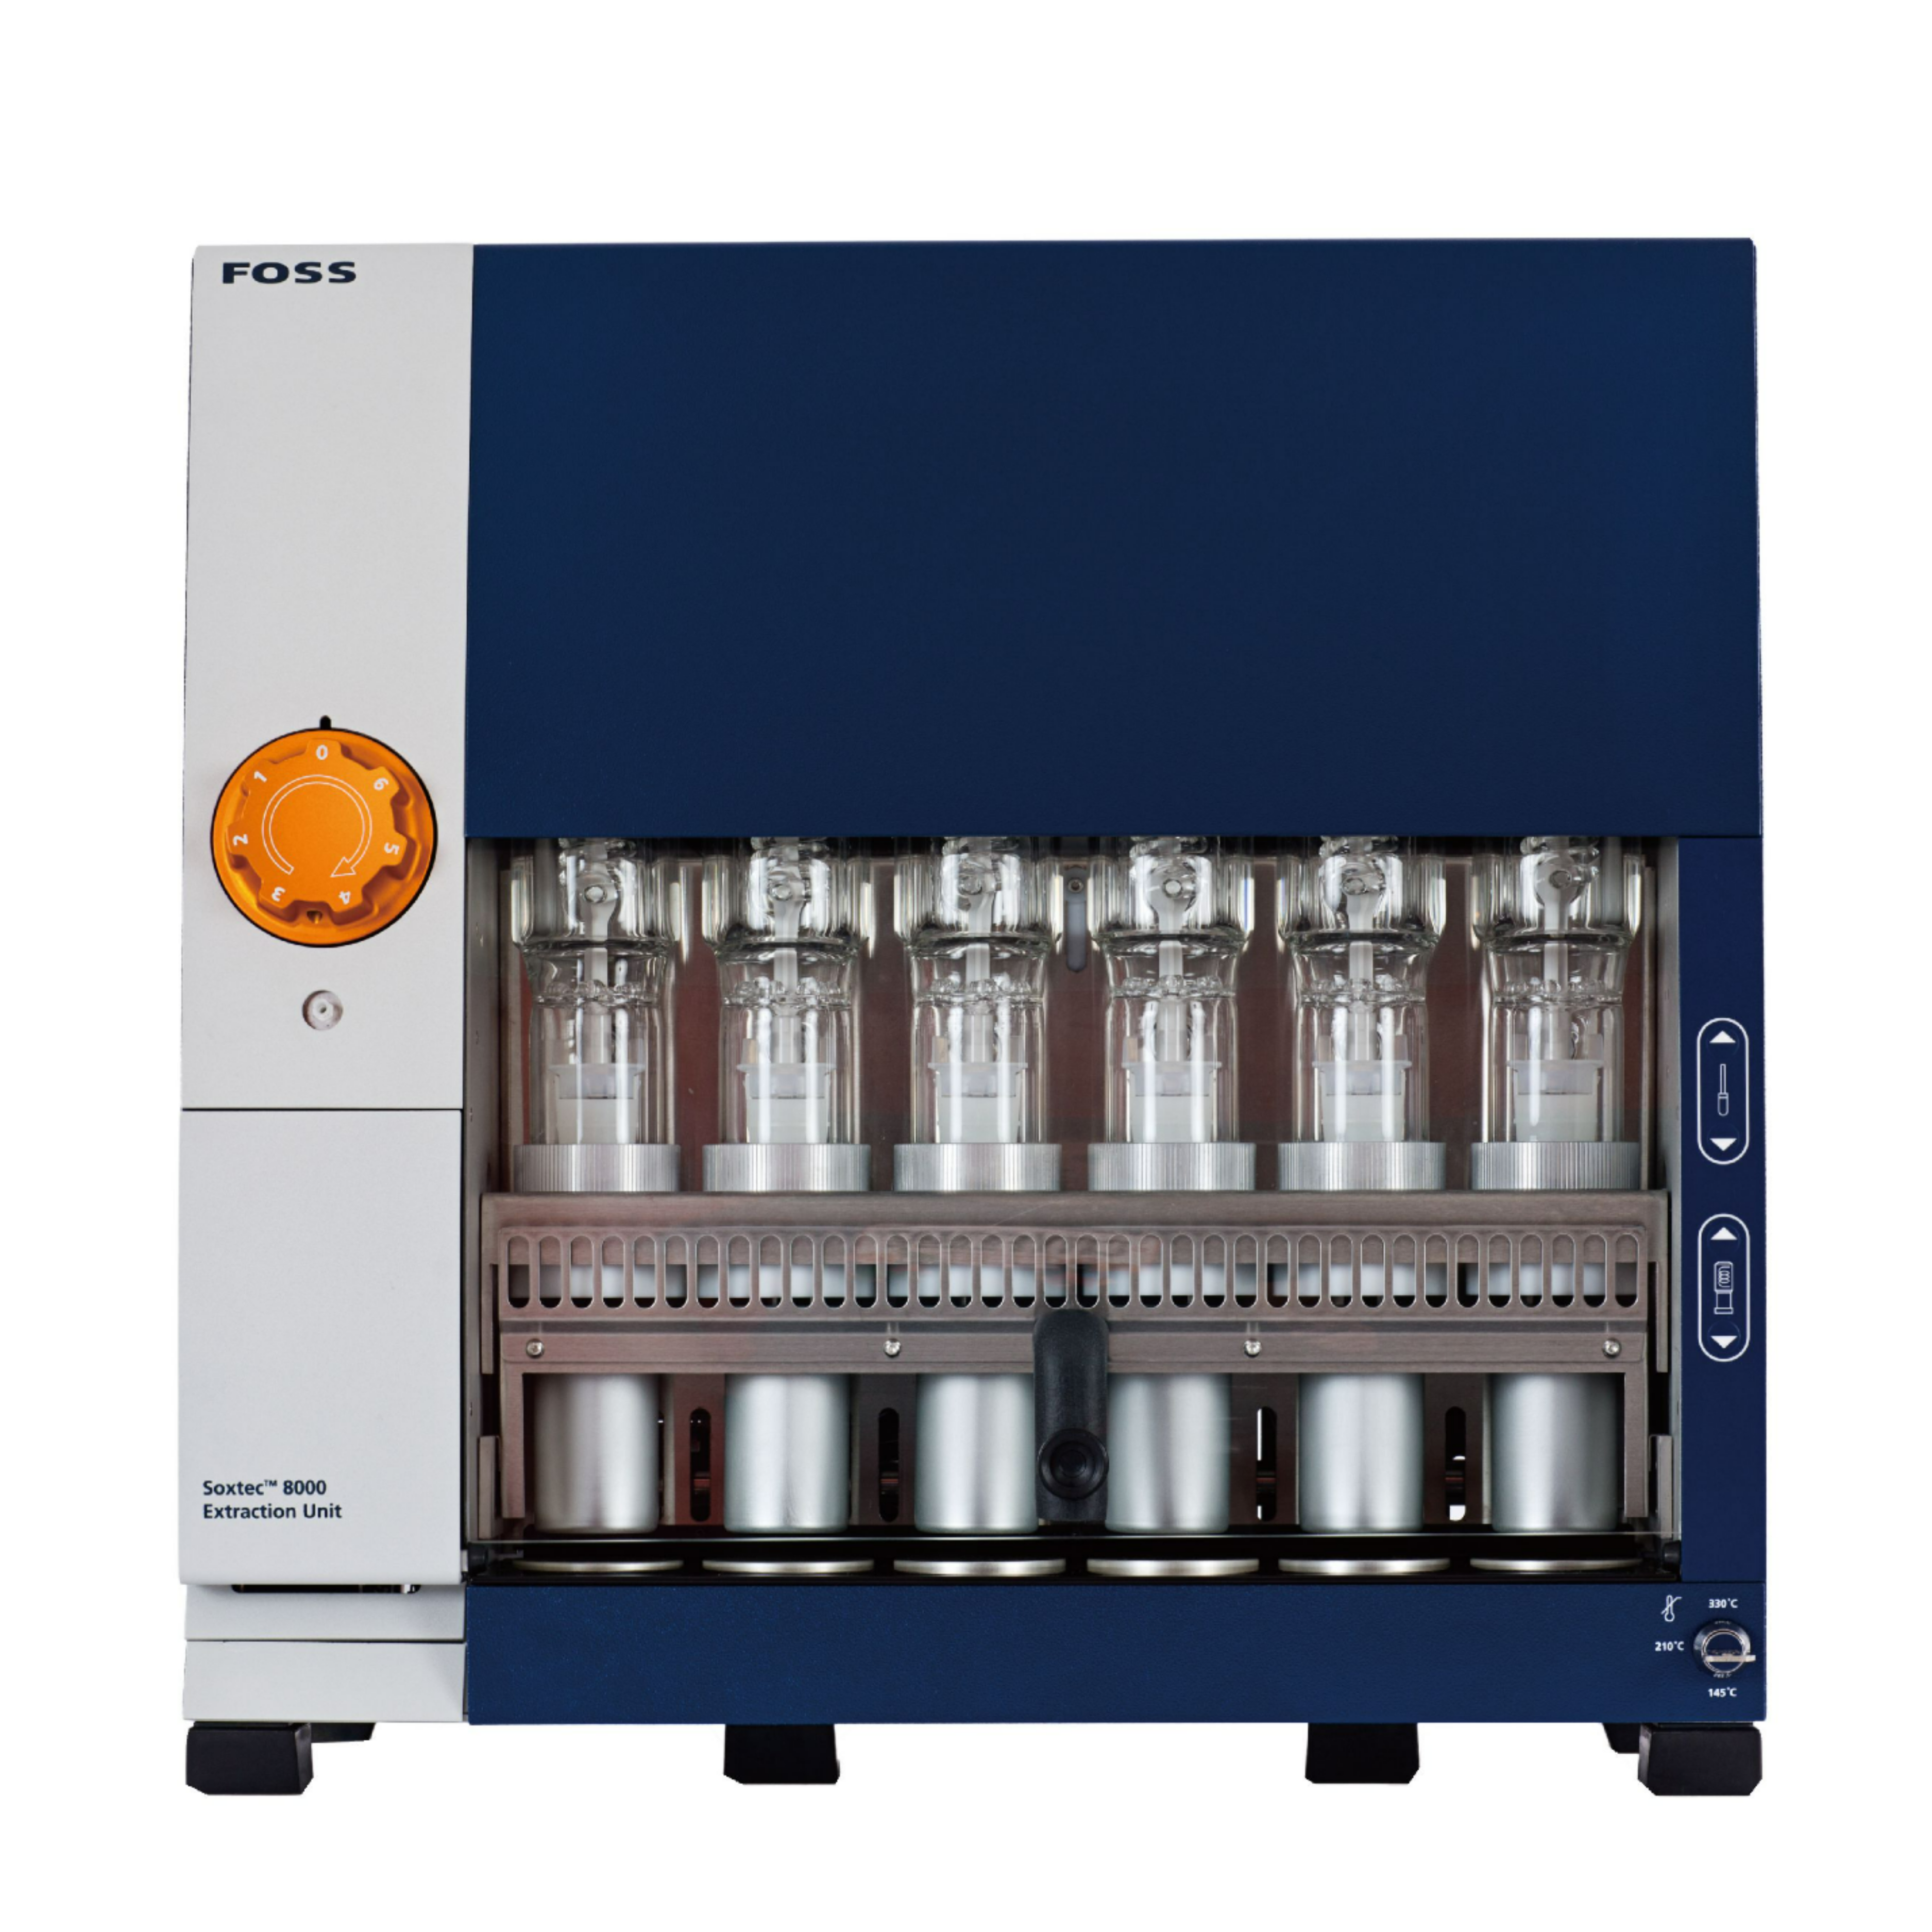
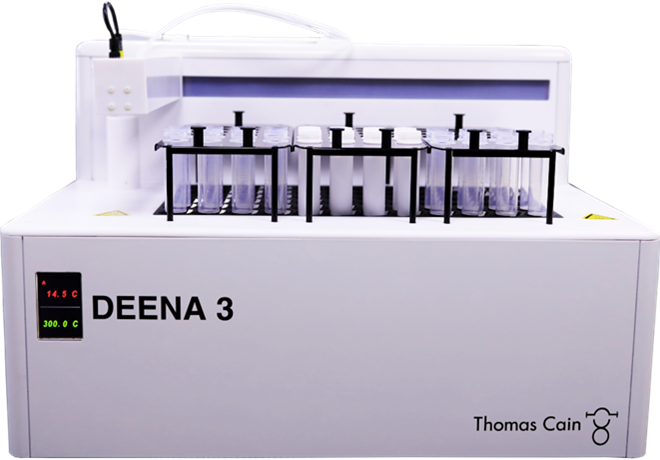
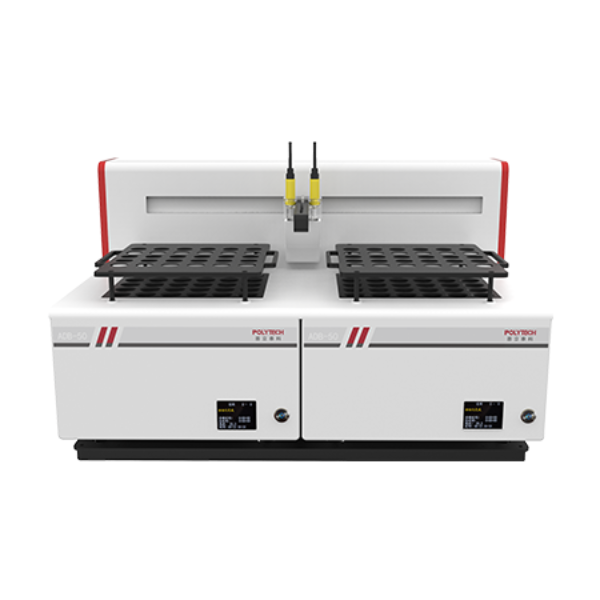
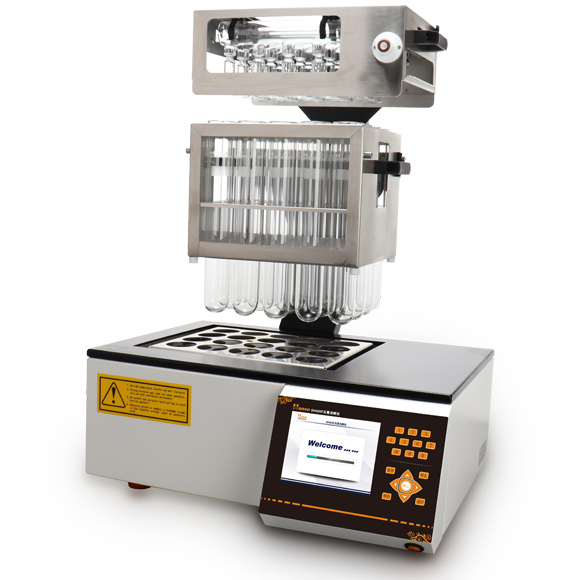
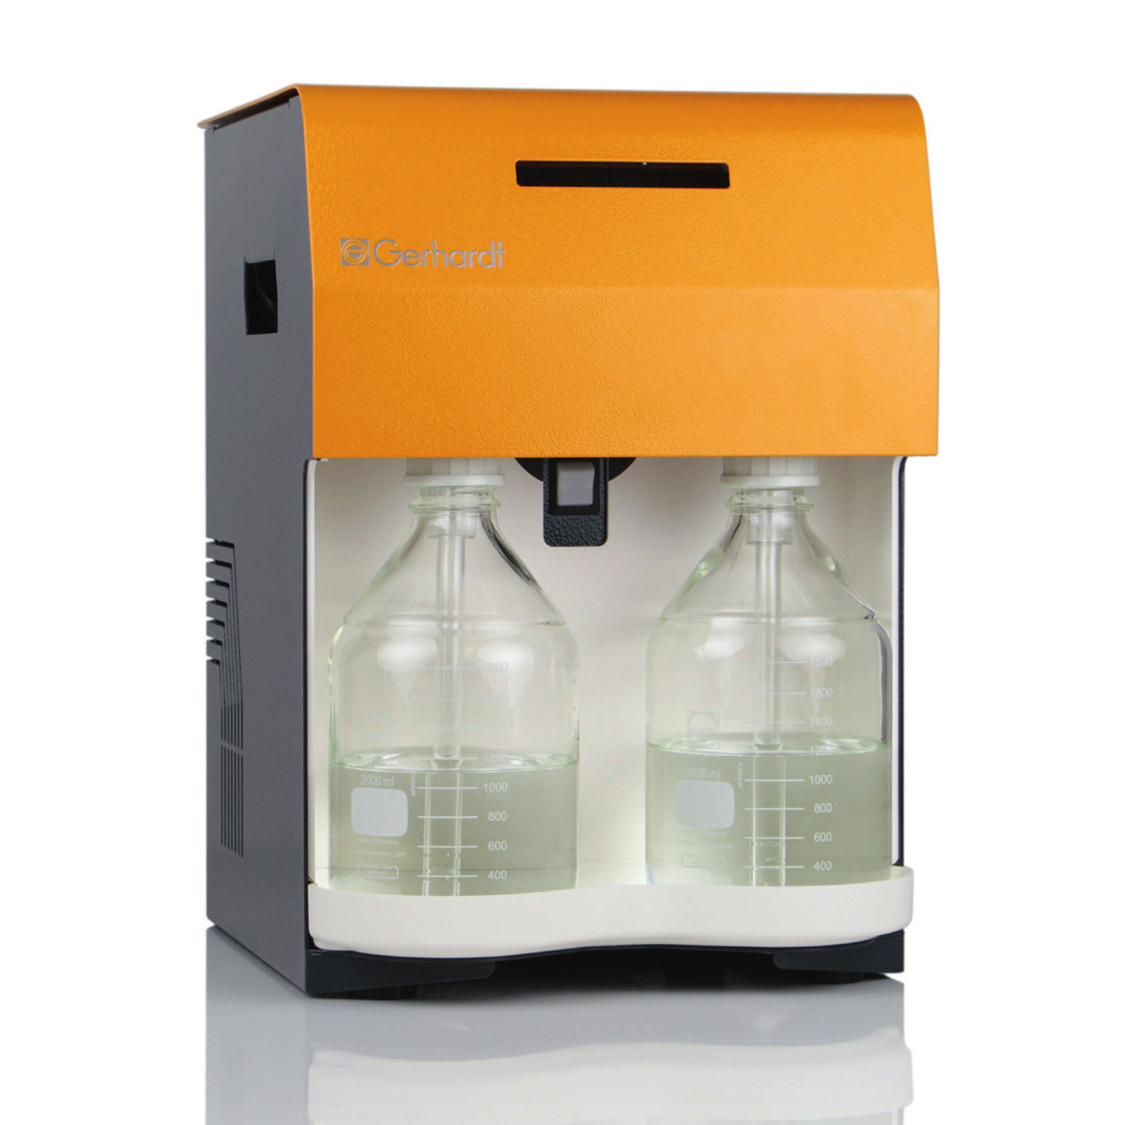
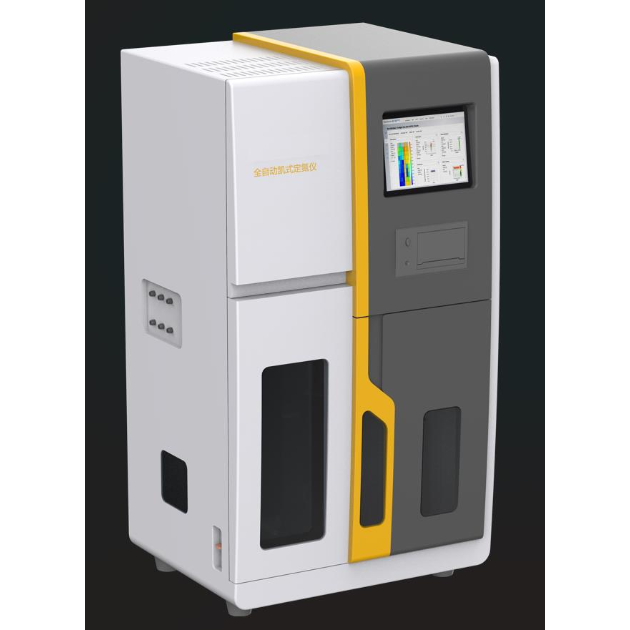
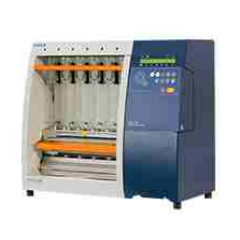
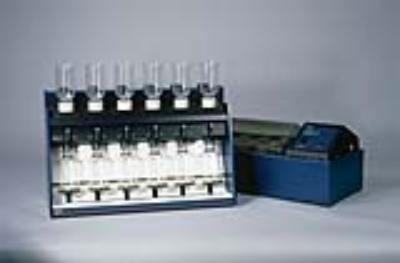
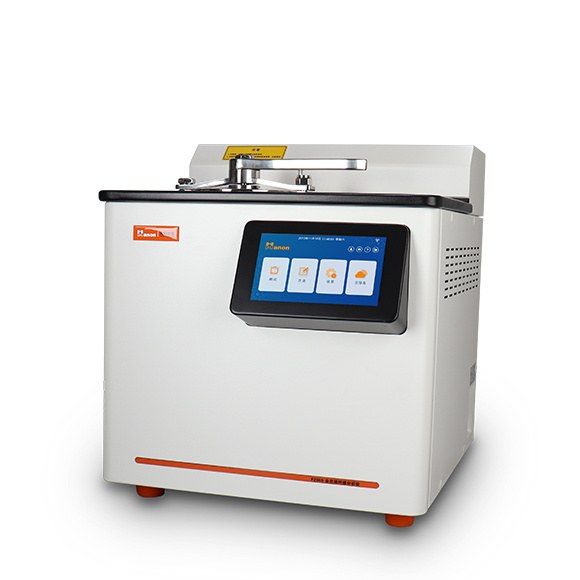
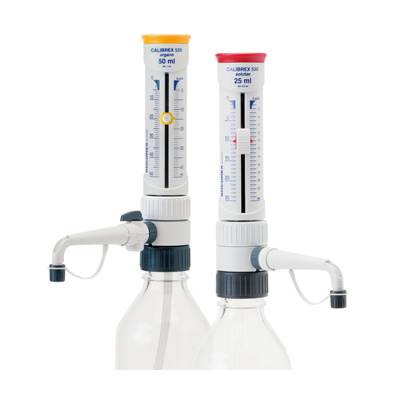
中国格哈特为您提供《马泡瓜 瓜肉、瓜子、瓜皮中蛋白质、脂肪、纤维含量的检测》,该方案主要用于水果中营养成分检测,参考标准《GB 5009.5 食品安全国家标准 食品中蛋白质的测定》,《马泡瓜 瓜肉、瓜子、瓜皮中蛋白质、脂肪、纤维含量的检测》用到的仪器有格哈特全自动快速索氏提取SOXTHERM、格哈特凯氏消化系统KT8S、格哈特维克松废气实验室废物处理系统涤气VS、格哈特自动凯氏定氮仪VAPODEST 200、格哈特全自动型纤维分析仪FT12、德国加液器MM、滤纸筒


相关方案
更多
该厂商其他方案
更多