


方案详情
文
西南民族大学 不同剂量黄曲霉毒素B1对萨能奶山羊的生长性能、消化率和血浆代谢组学的影响Growth performance, digestibility, and plasma metabolomic profiles of Saanen goats exposed to different doses of aflatoxin B1
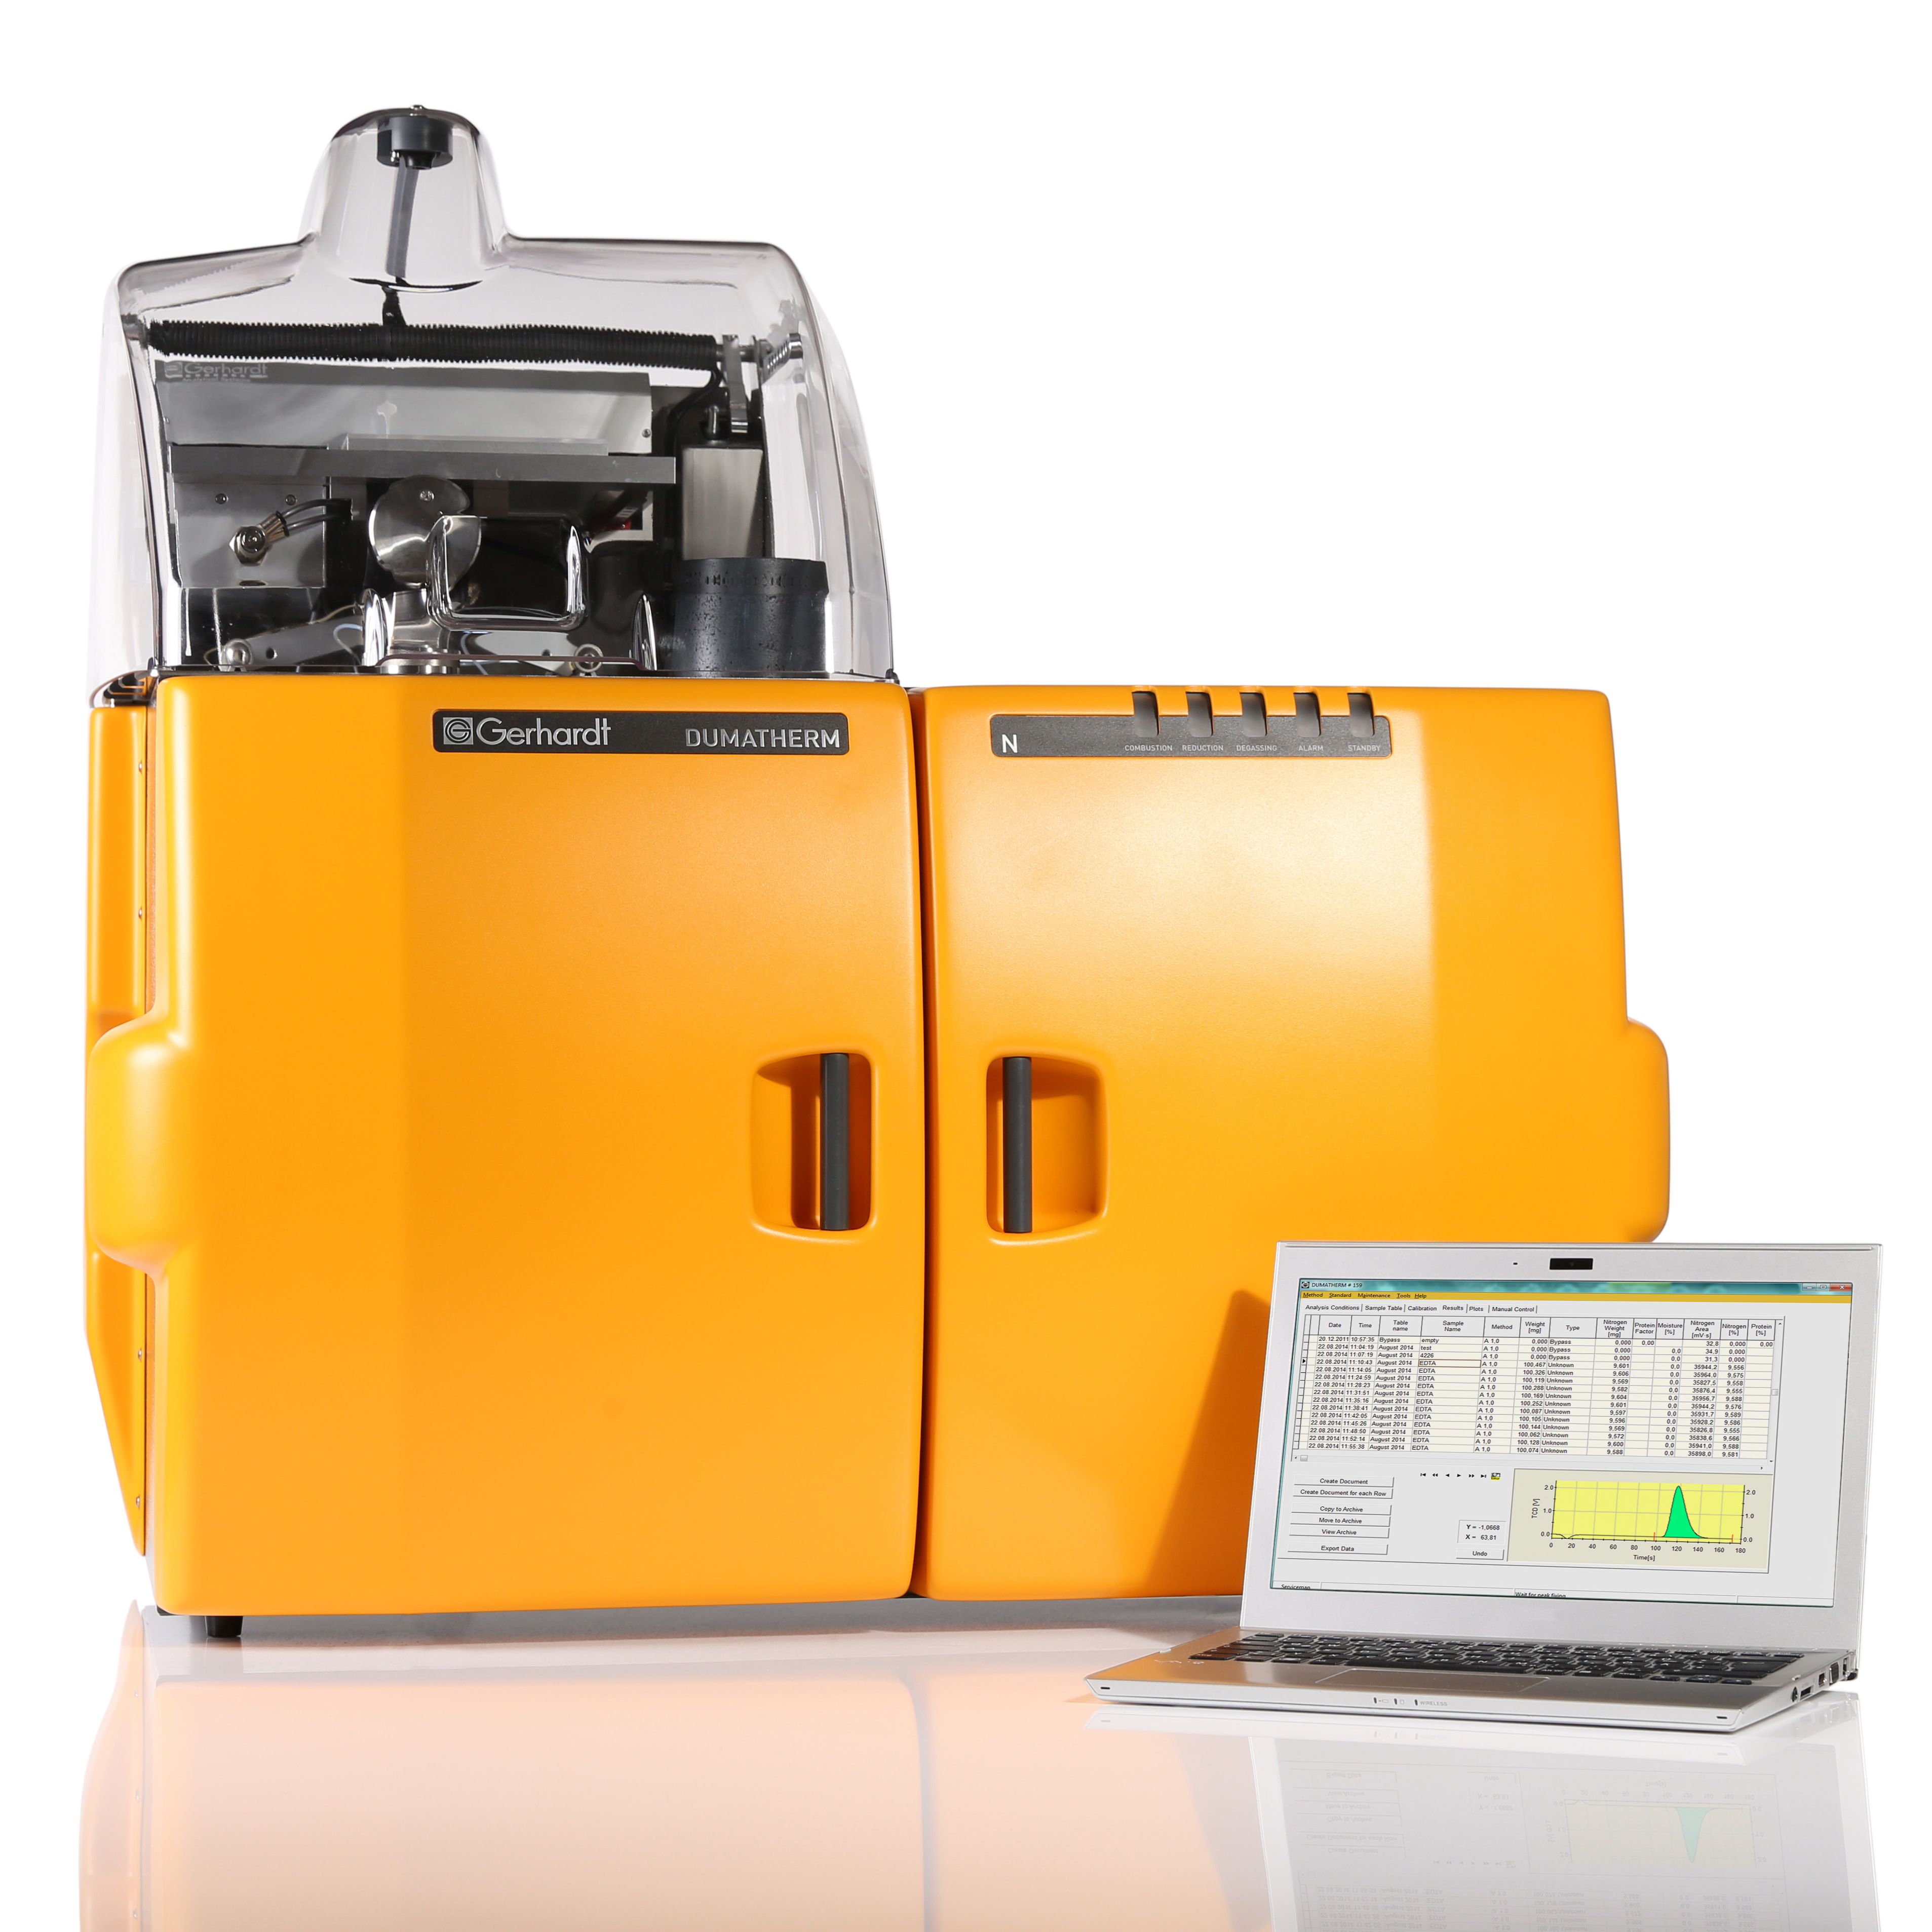
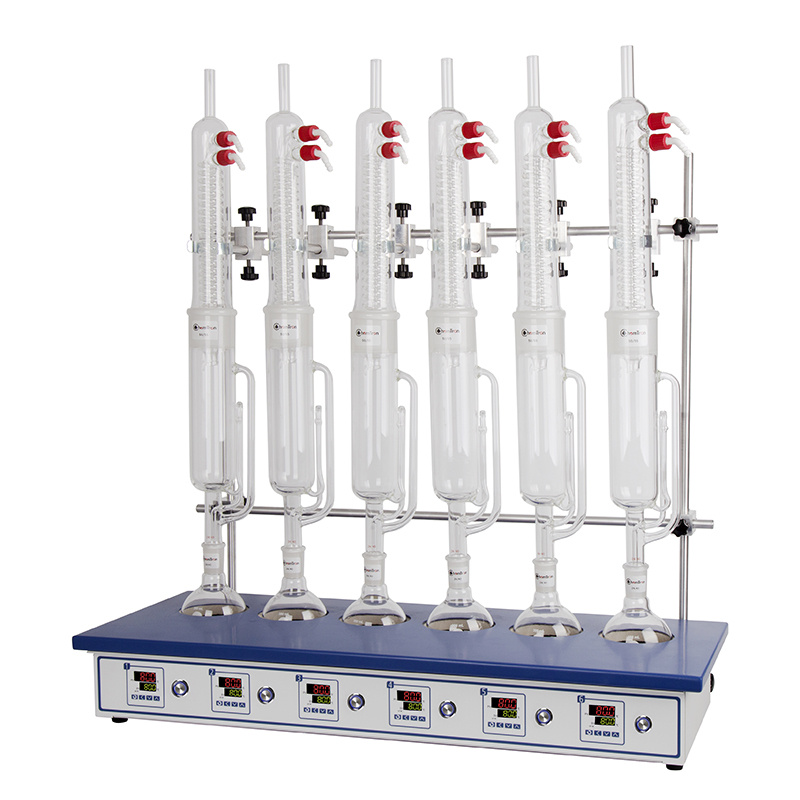
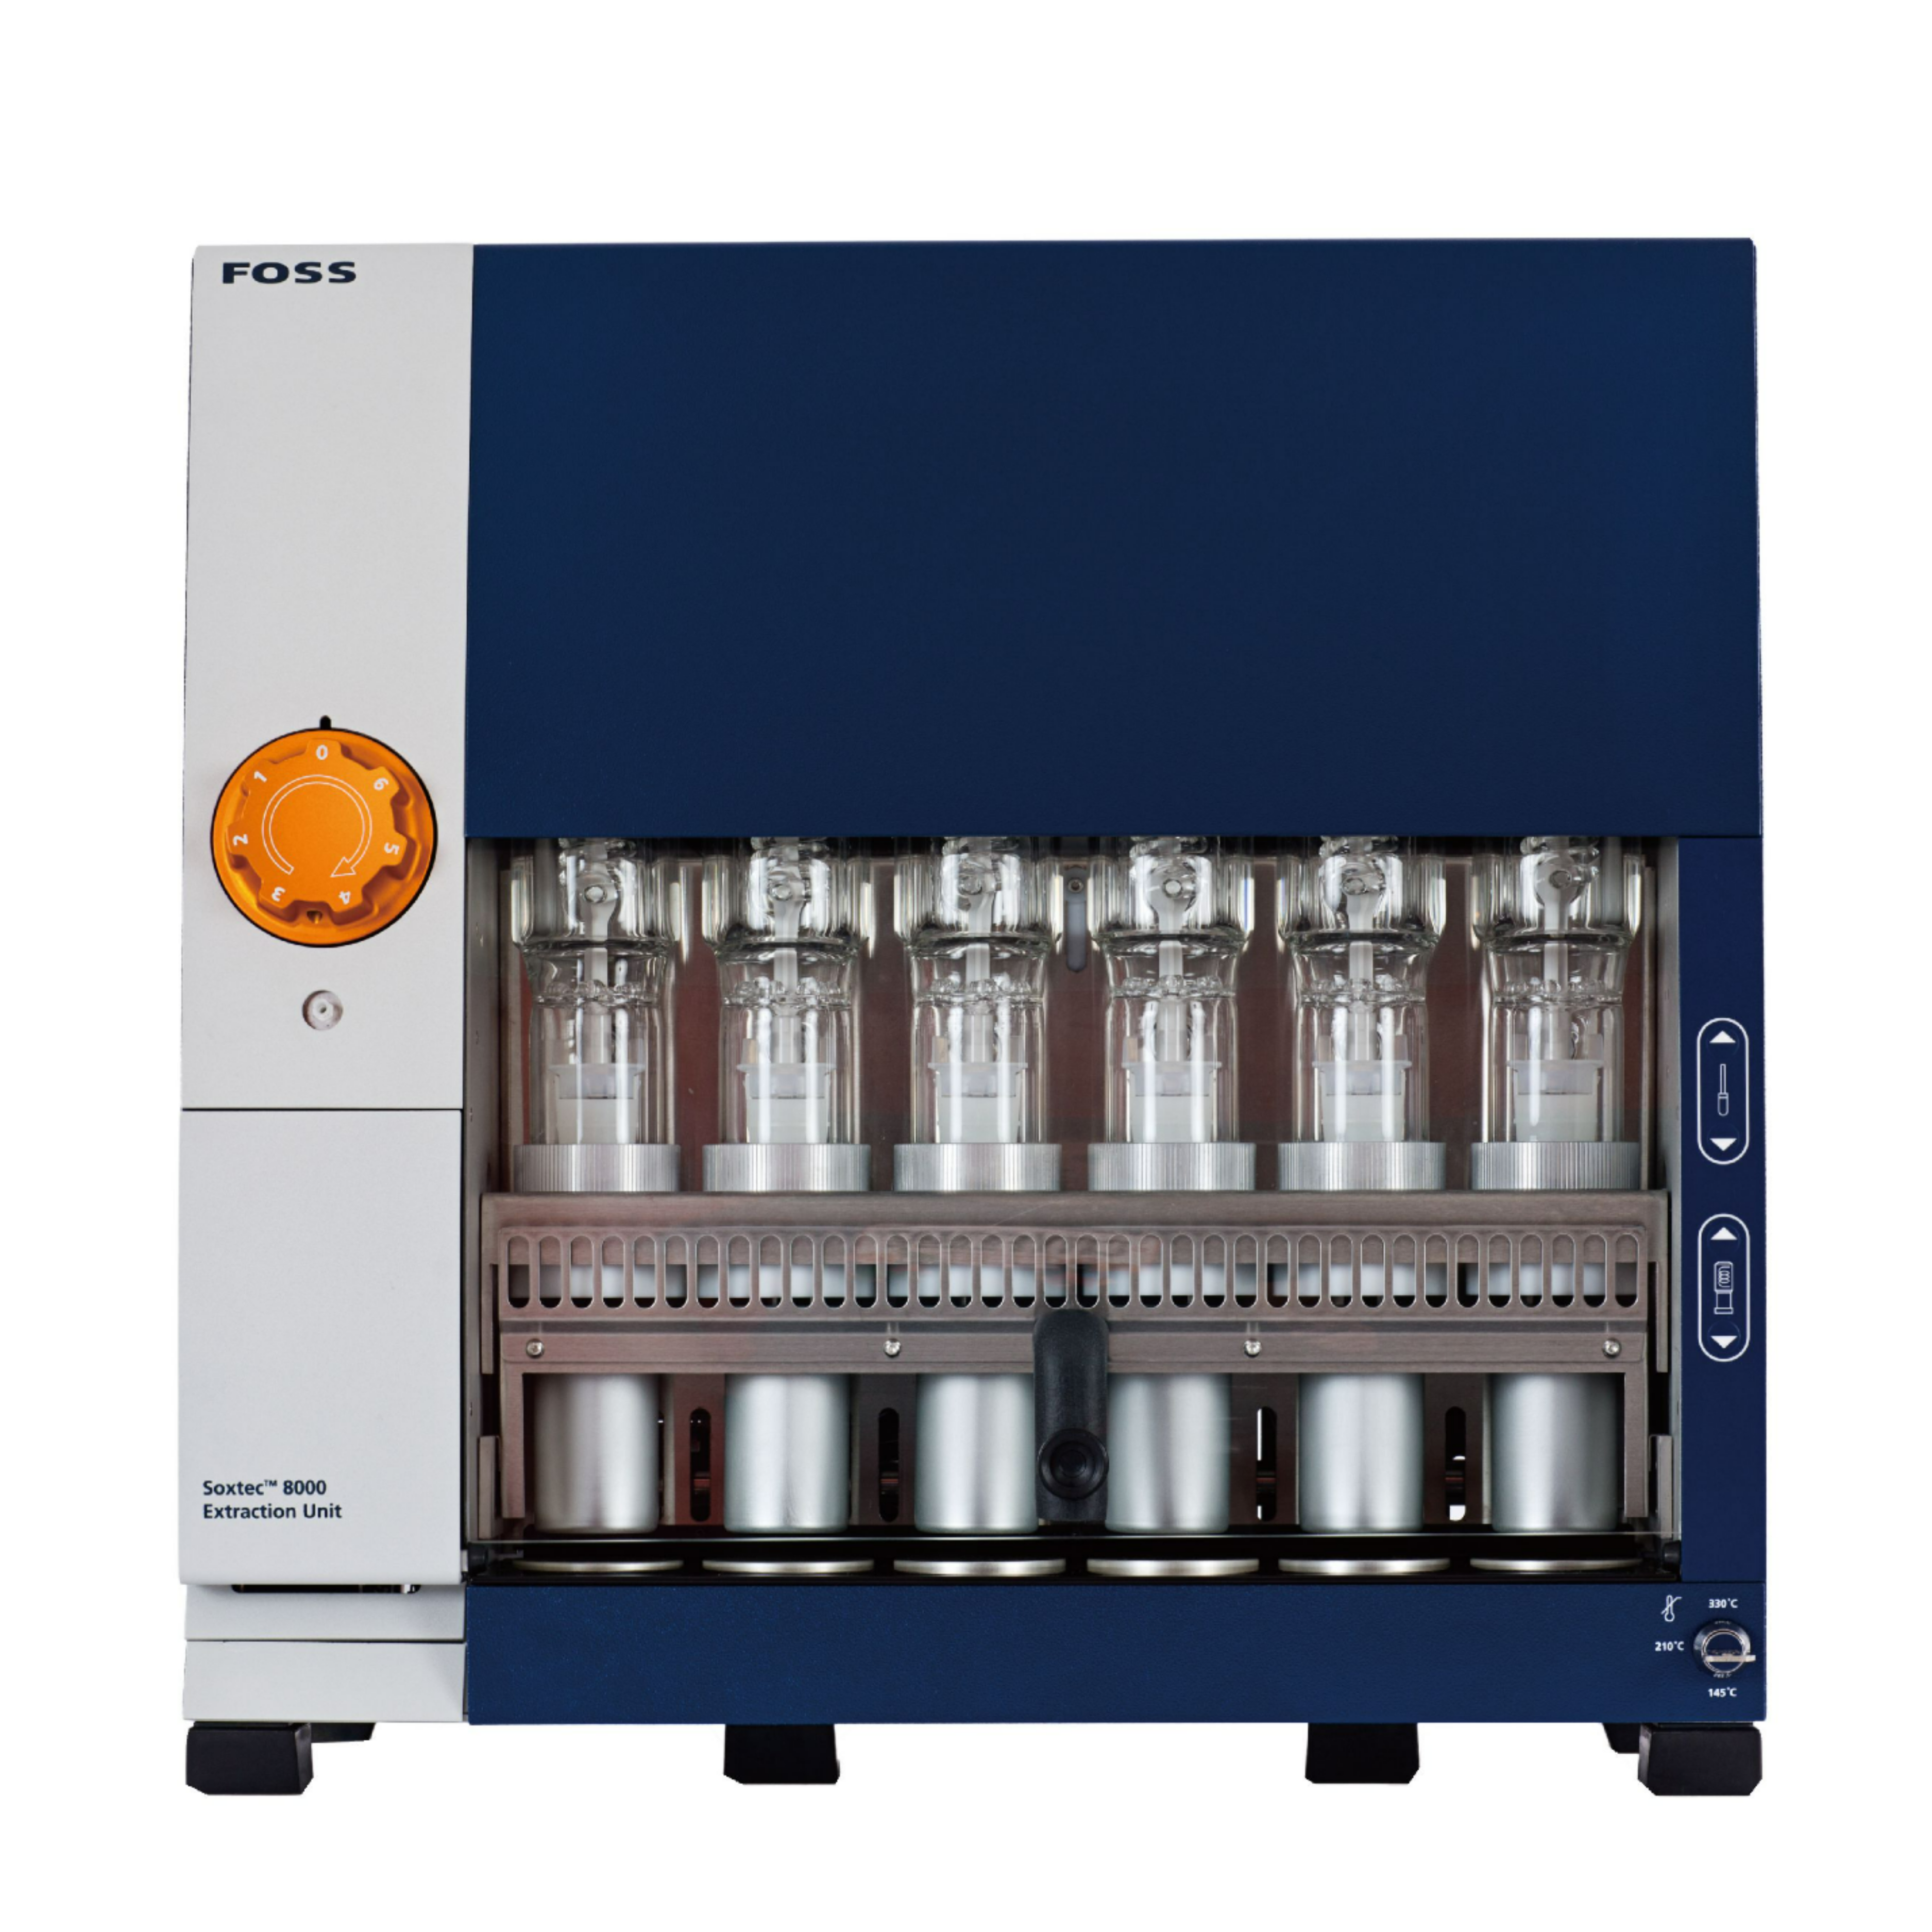
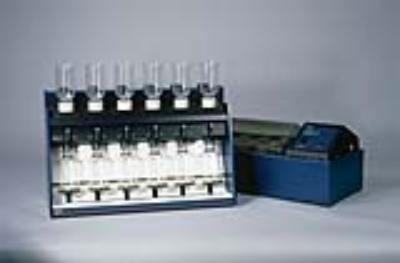
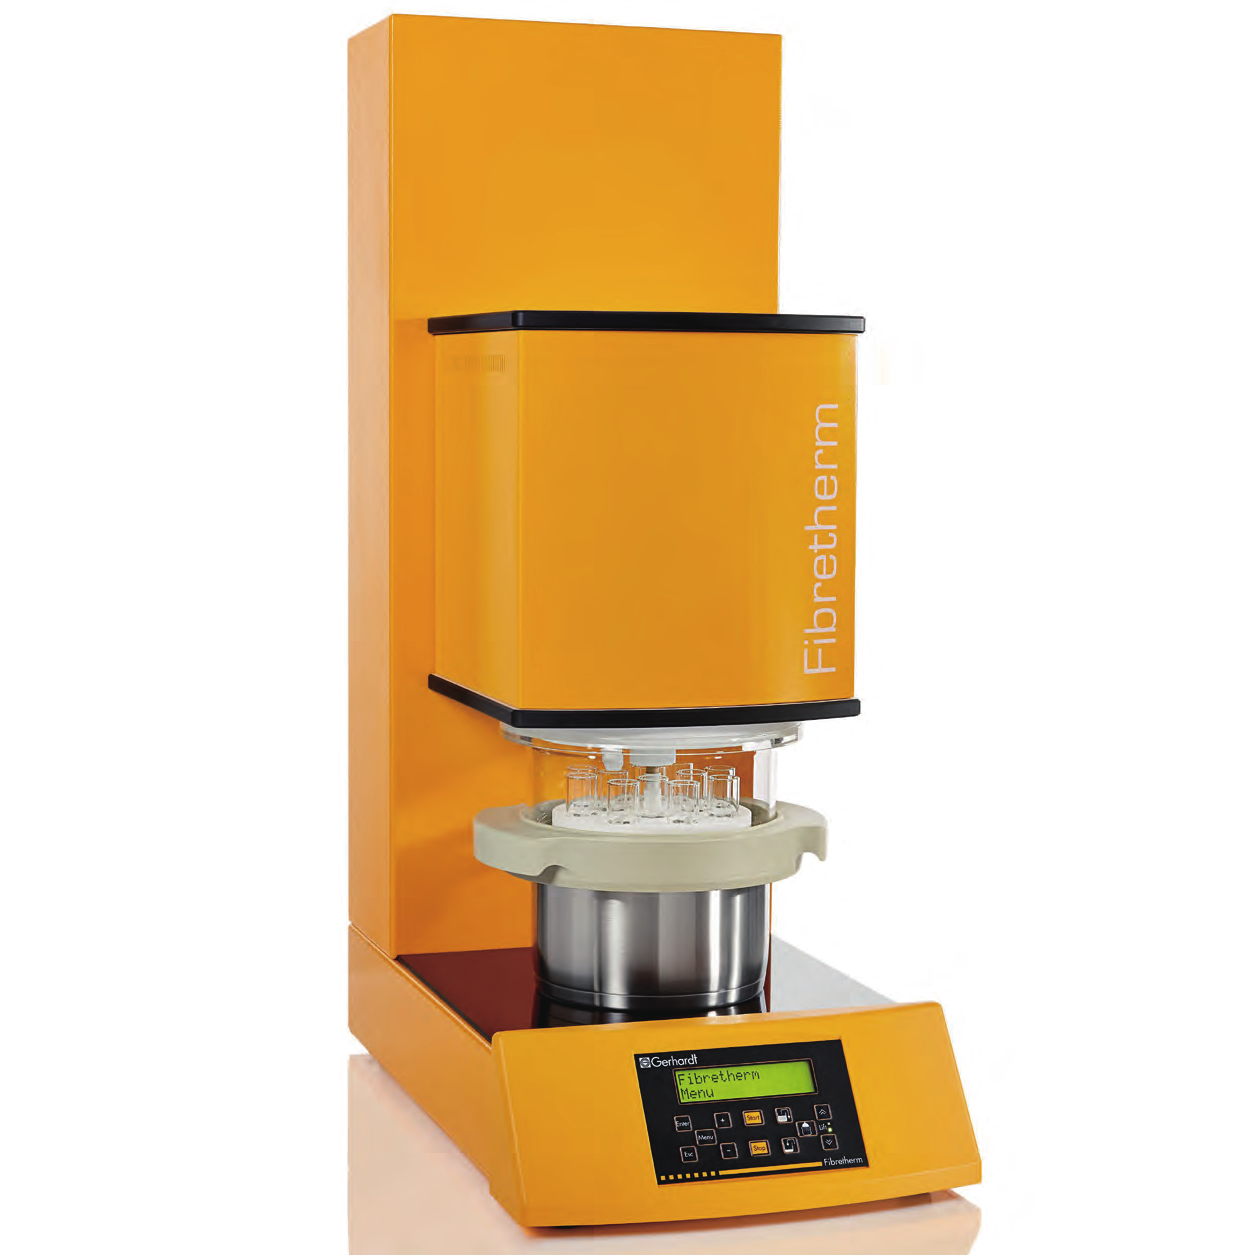
使用格哈特公司全自动杜马斯定氮仪 杜马森Dumatherm测总氮含量,全自动快速索氏提取系统SOX416测脂肪含量,全自动纤维仪 费博森Fibertherm FT12测中性洗涤纤维、酸性洗涤纤维含量。
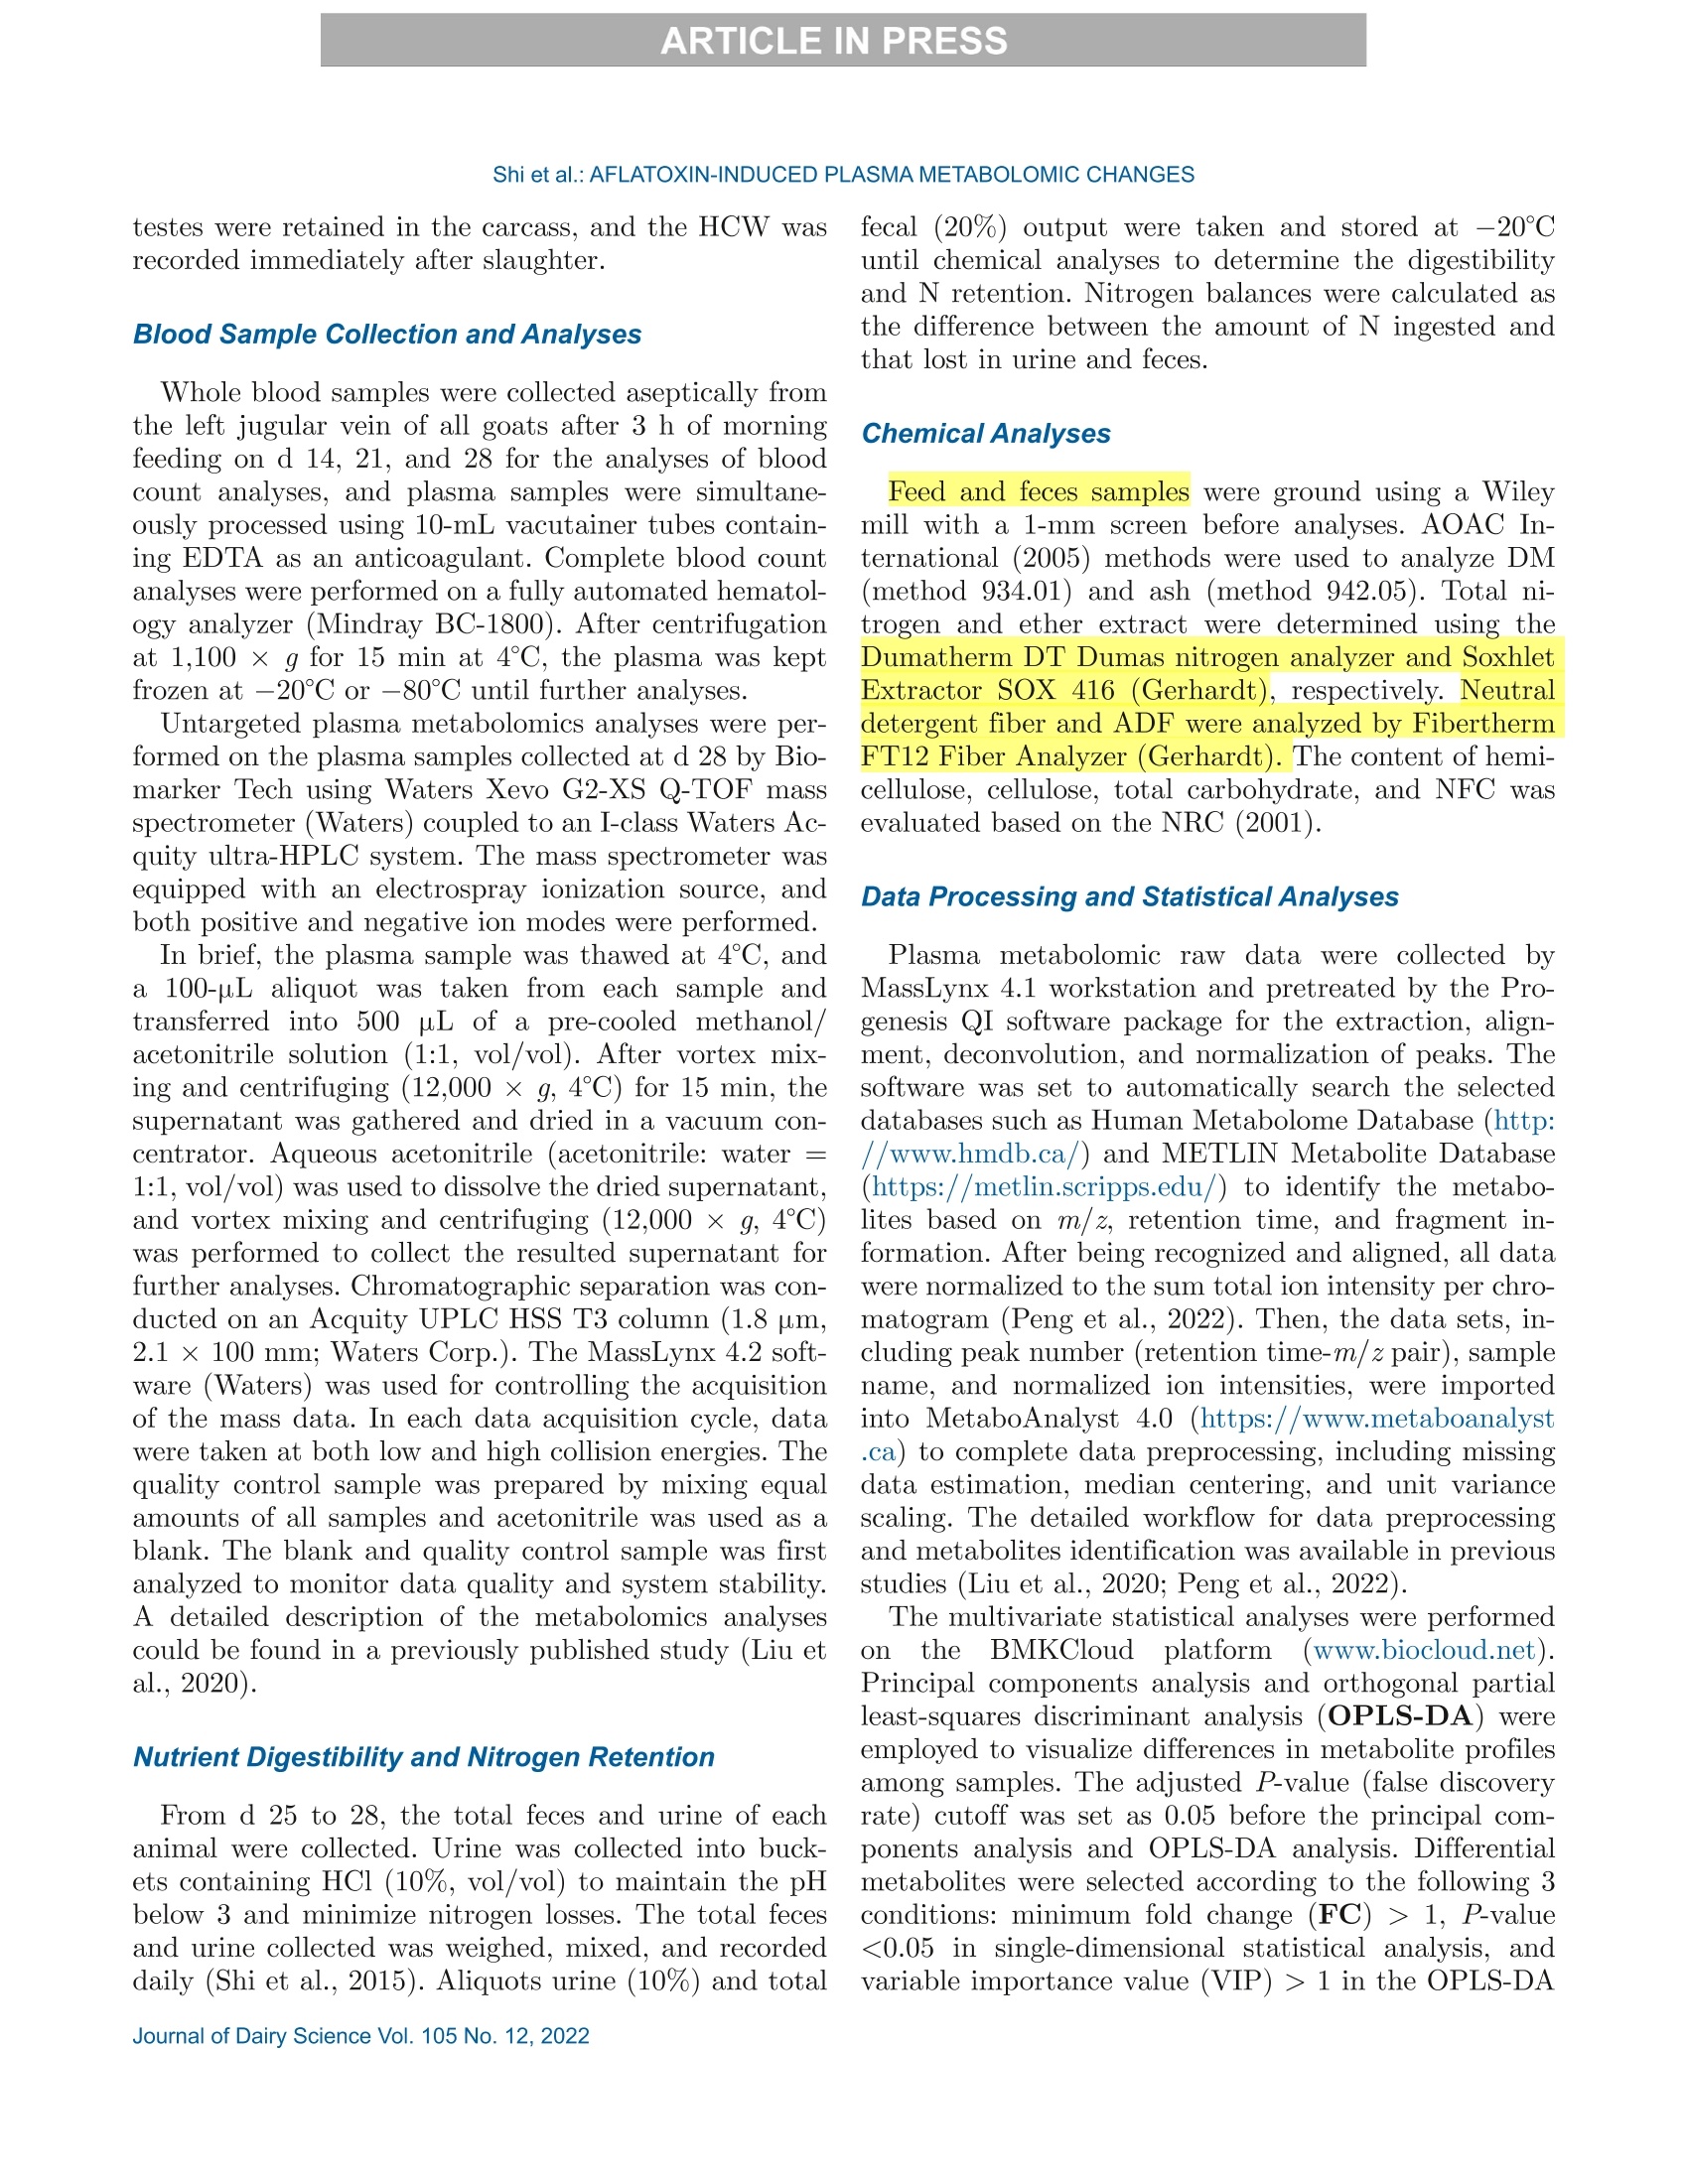
Total nitrogen and ether extract were determined using the Dumatherm DT Dumas nitrogen analyzer and Soxhlet Extractor SOX 416 (Gerhardt), respectively. Neutral detergent fiber and ADF were analyzed by Fibertherm FT12 Fiber Analyzer (Gerhardt).
方案详情

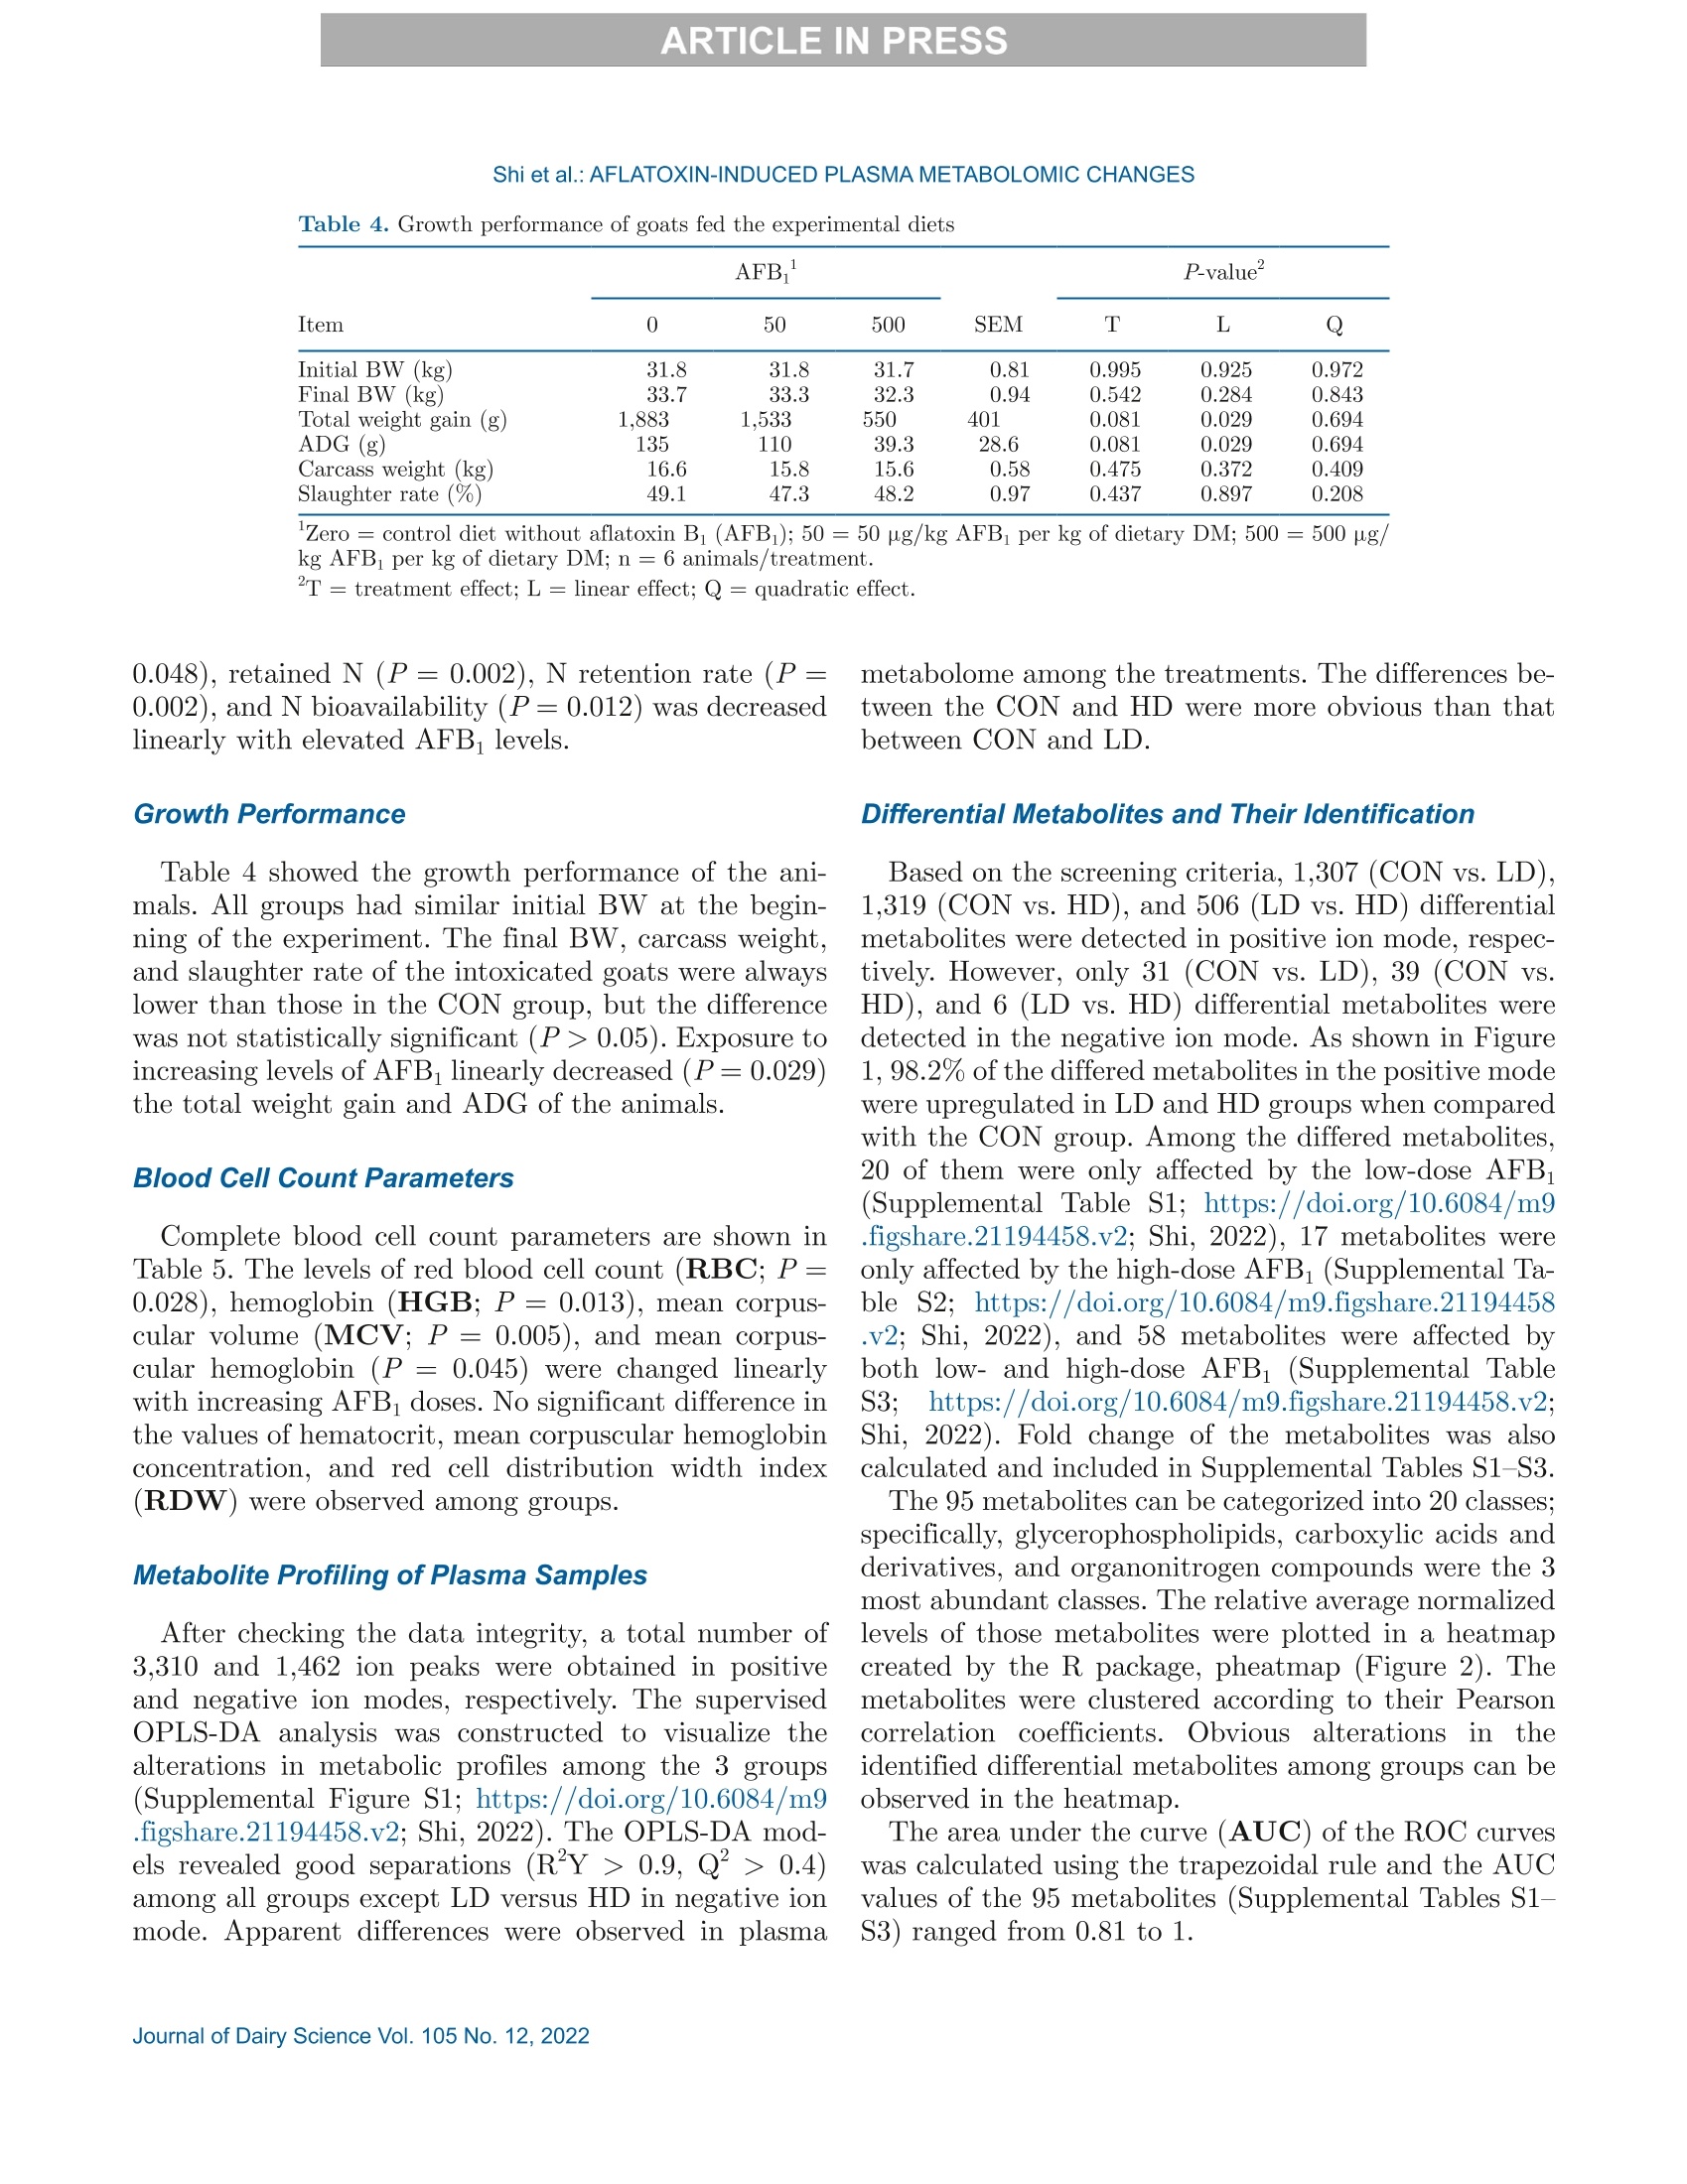
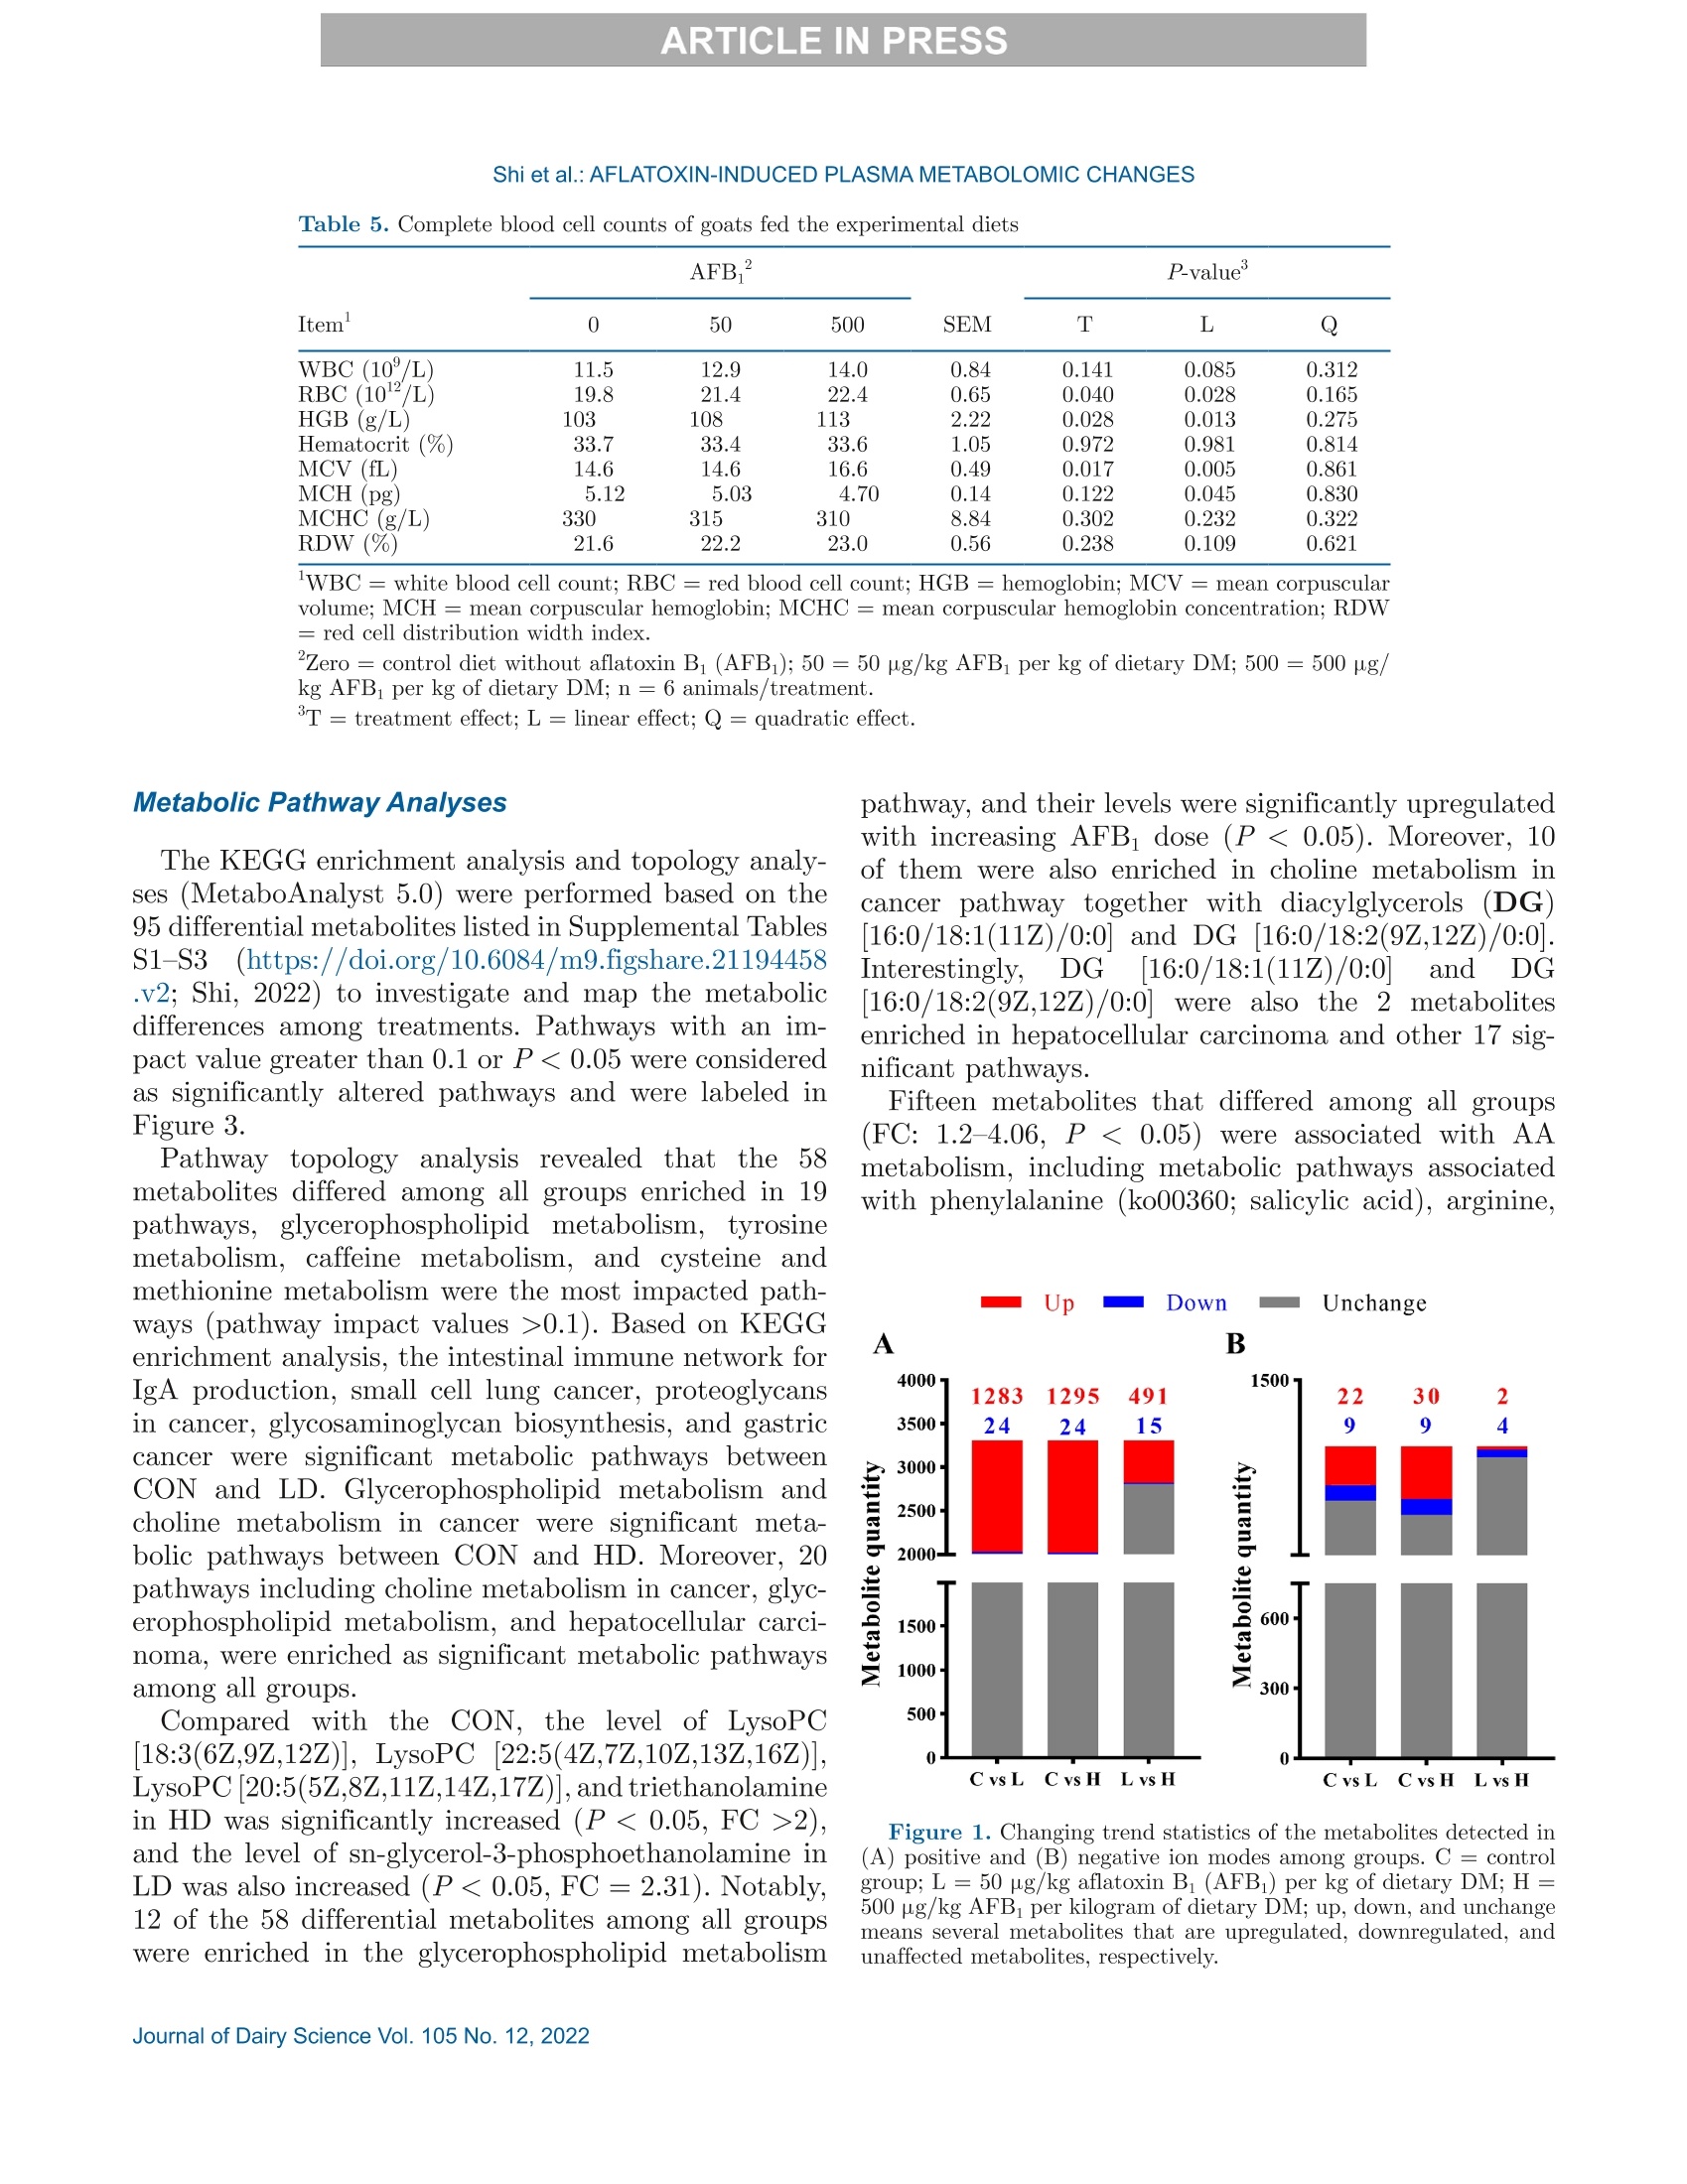
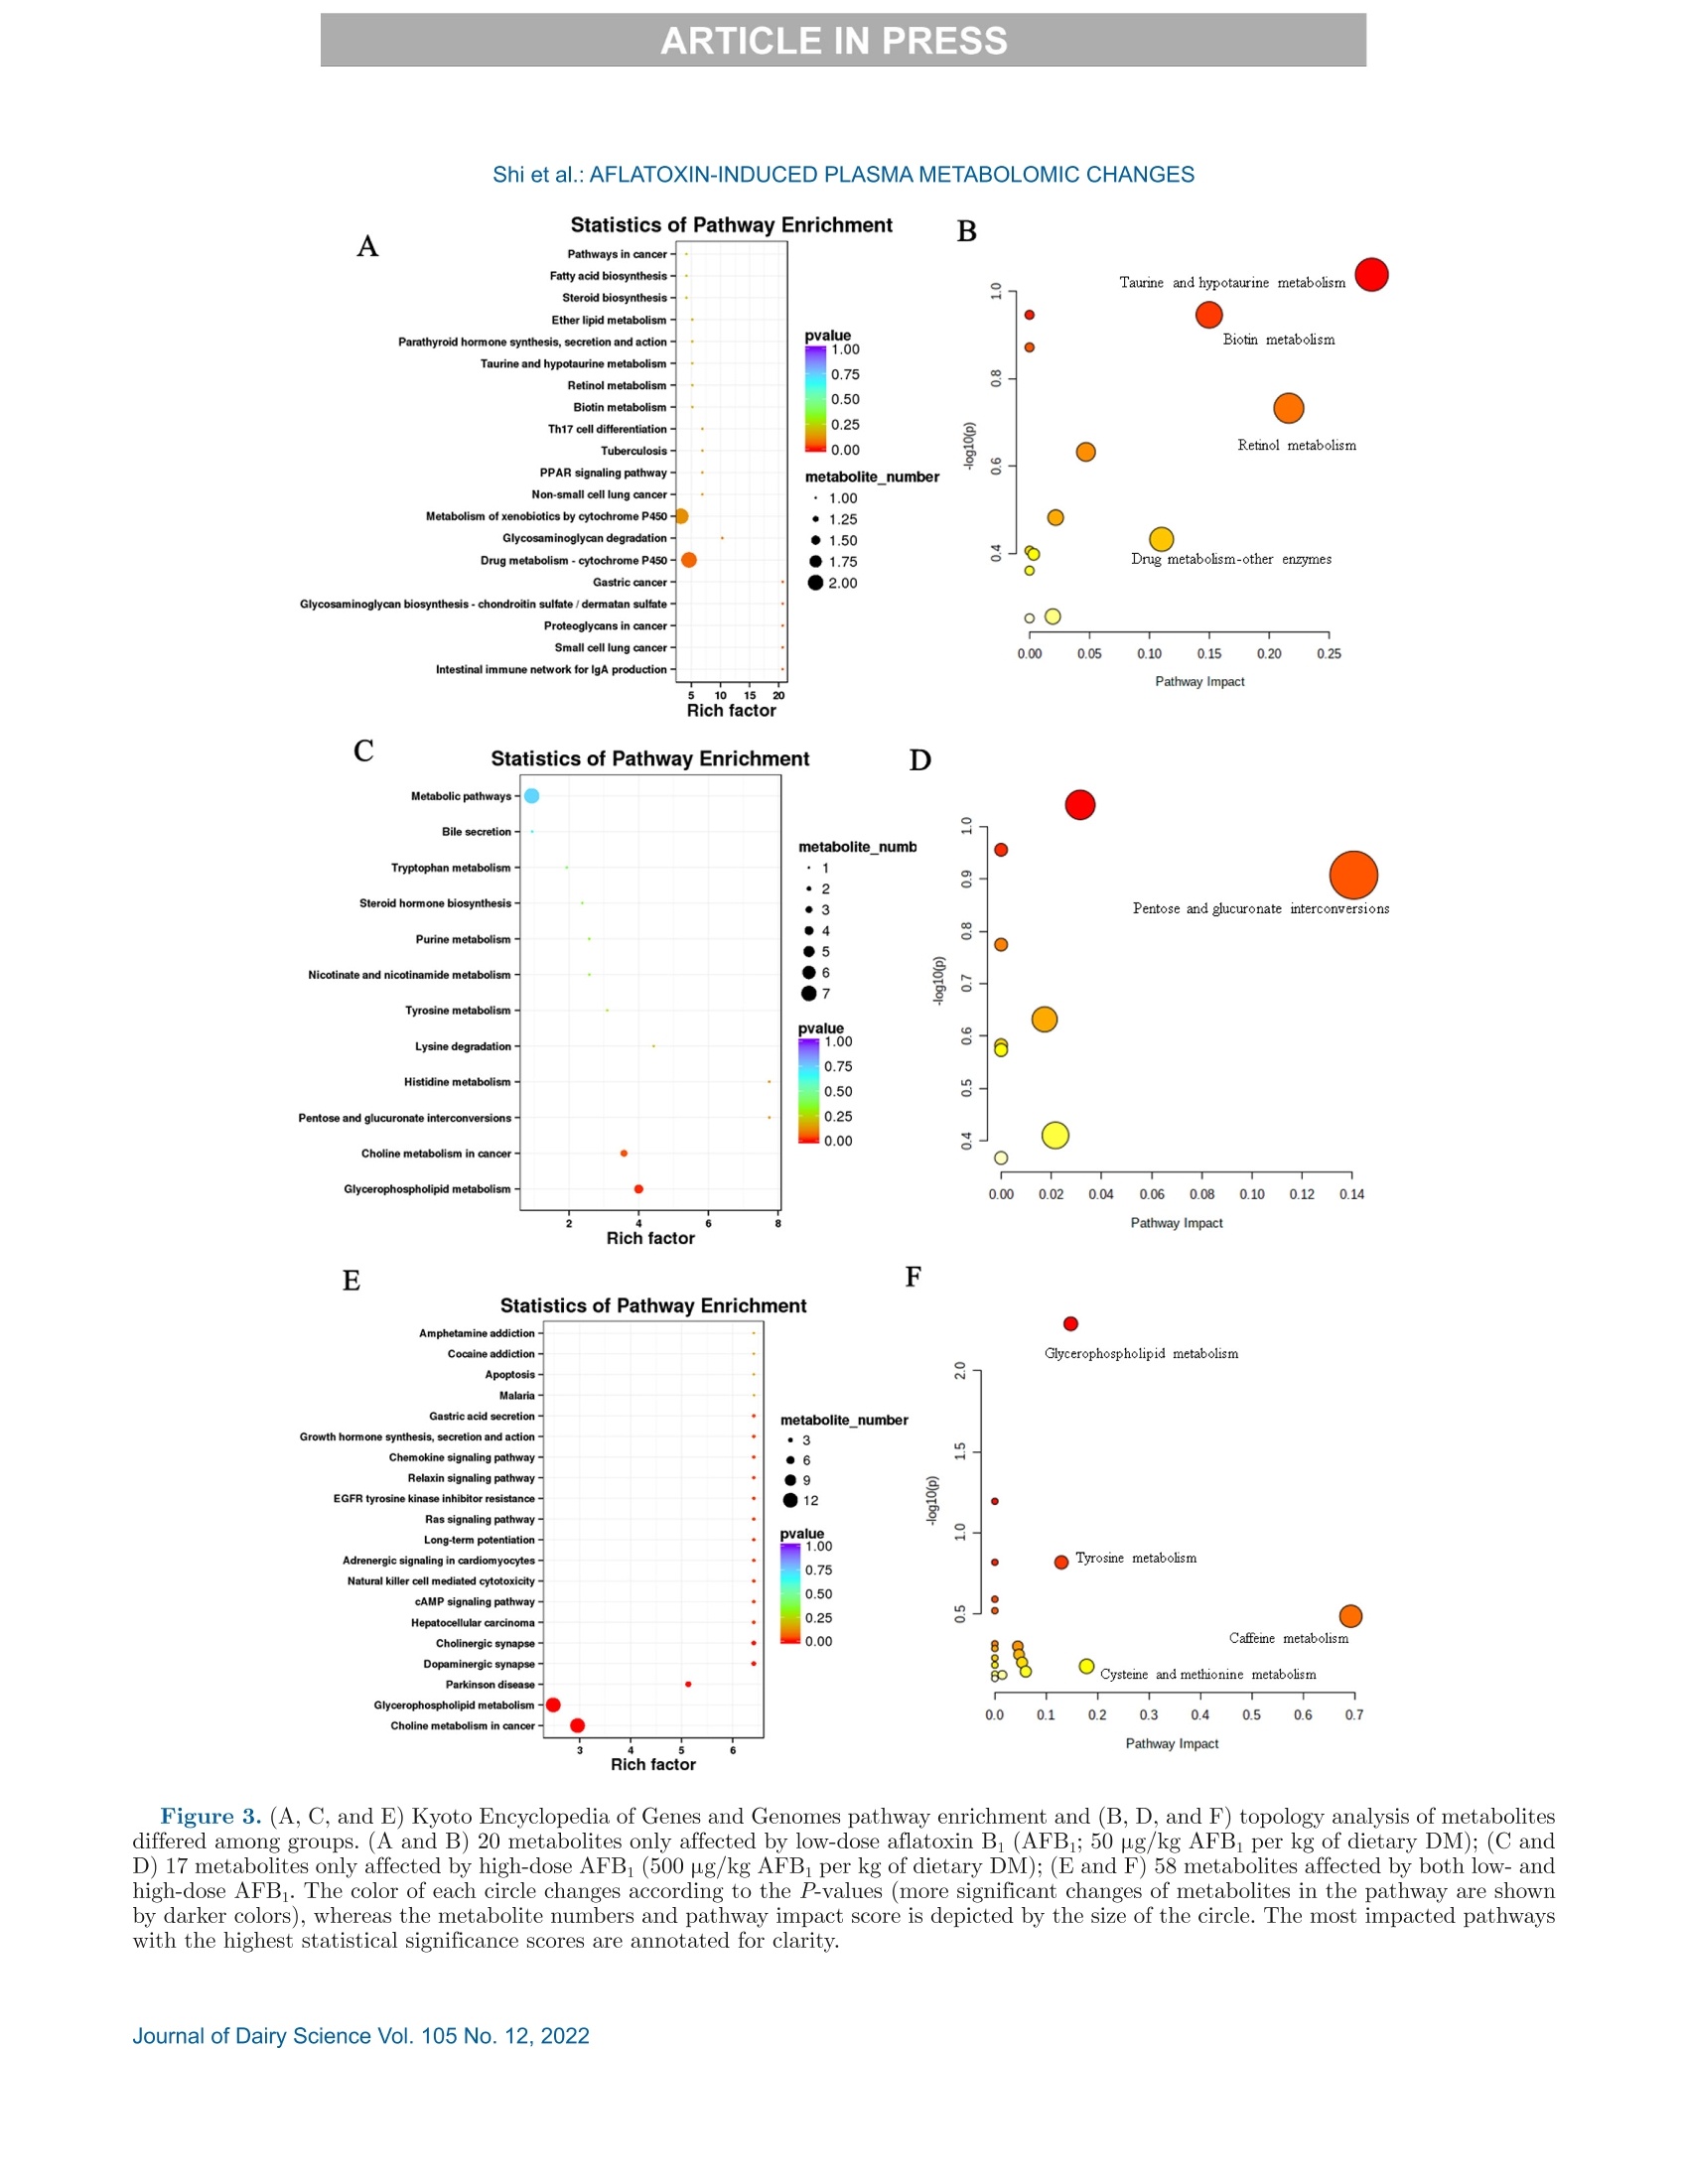
西南民族大学 不同剂量黄曲霉毒素B1对萨能奶山羊的生长性能、消化率和血浆代谢组学的影响Growth performance, digestibility, and plasma metabolomic profiles of Saanen goats exposed to different doses of aflatoxin B1使用格哈特公司全自动杜马斯定氮仪 杜马森Dumatherm测总氮含量,全自动快速索氏提取系统SOX416测脂肪含量,全自动纤维仪 费博森Fibertherm FT12测中性洗涤纤维、酸性洗涤纤维含量。Total nitrogen and ether extract were determined using the Dumatherm DT Dumas nitrogen analyzer and Soxhlet Extractor SOX 416 (Gerhardt), respectively. Neutral detergent fiber and ADF were analyzed by Fibertherm FT12 Fiber Analyzer (Gerhardt).ARTICLE IN PRESS@ ARTICLE IN PRESSShi et al.: AFLATOXIN-INDUCED PLASMA METABOLOMIC CHANGES 不同剂量黄曲霉毒素B1对萨能奶山羊的生长性能、消化率和血浆代谢组学的影响 J. Dairy Sci. 105 https://doi.org/10.3168/jds.2022-22129 ◎ 2022, The Authors. Published by Elsevier Inc. and Fass Inc. on behalf of the American Dairy Science Association.This is an open access article under the CC BY license (http://creativecommons.org/licenses/by/4.0/). Growth performance, digestibility, and plasma metabolomic profilesof Saanen goats exposed to different doses of aflatoxin B Haitao Shi,1* Jing Peng, Jingjing Hao, Xi Wang, Meng Xu, and Shengli Li² 'Key Laboratory of Qinghai-Tibetan Plateau Animal Genetic Resource Reservation and Utilization, Ministry of Education, Southwest Minzu University, Chengdu, Sichuan, 610041, China State Key Laboratory of Animal Nutrition, Beijing Engineering Technology Research Center of Raw Milk Quality and Safety Control, China Agricultural University, Beijing 100193, China Aflatoxin contamination of feed poses a great riskto the global dairy industry. Analyzing the aflatoxinB (AFB_)-induced metabonomic changes in ruminantsand screening potential biomarkers for early diagnosisof AFB exposure is urgently needed. Here, the effectsof different doses (0, 50, and 500 pg/kg of the diet,dry matter basis) of AFB exposure on digestibilityand performance of Saanen goats were studied, and acomprehensive untargeted metabolomic analysisWasperformedtorevealplasma metabonomic cchangescaused by the AFB exposure. In the current study,AFBi exposure decreased total-tract nutrient digest-ibilities, nitrogen retention, total weightgain, andaverage daily gain of Saanen goats in a dose-dependentmanner. Untargeted metabolomics revealed alterationsin the plasma metabolome. A total of 3,310 and 1,462ion peaks were obtained in positive and negative ionmodes, respectively. Based on the screening criteria,1,338 differential metabolites were detected betweencontrol and low-dose AFB (50 pg/kg) groups, 1,358metabolites differed between control and high-doseAFB1 (500 pg/kg))groups, and 58 metabolites dif-fered among all groups. Pathway analyses showed thatcholine metabolism in cancer and glycerophospholipidmetabolism were significantly affected by the AFBtreatments.Moreover, dysregulation of amino acidmetabolism was also observed in AFB treated goats.The findings provided novel insights into the toxicity ofAFB in ruminants. Exploring the underlying molecu-lar causes of the changes may help the development ofrapid diagnostic techniques and effective interventionsfor AFB intoxication. Received April 6,2022. Accepted July 22, 2022. *Corresponding author: shihaitao@swun.edu.cn or shihaitao010@163.com Keywords:afatoxins, untargeted1metabolomics.biomarker, ruminant aflatoxicosis INTRODUCTION Mycotoxins are toxic metabolites mainly producedby certain types of molds from Fusarium,Claviceps,Penicillium, Alternaria, and AspergillusS:genera(Shiet al., 2018). Among all the identified mycotoxins, af-latoxins could be the most documented group due totheir high toxicity and contamination rates. Aflatoxinsare produced primarily by Aspergillus section Flavi(Blankson and Mill-Robertson, 2016). Aflatoxin B(AFB) has been considered as the most carcinogenicand prevalent member, and it can be biotransformedinto aflatoxin M via oxidative reactions, catalyzed byhepatic cytochrome P450 enzymes (Marin et al., 2013;Giovati et al., 2015). Aflatoxin M has a high transferrate to animal products, especially milk (Giovati et al.,2015). Aflatoxin B is very stable and, so far, the commonlyused processing methods (e.g., cooking, baking, extru-sion, and roasting) are unable to completely eliminate it(Marin et al., 2013; Adebo et al., 2017). Previous stud-ies showed that ingestion of AFBi-contaminated feedcCOoUuld decrease performance, impair liver function, andincrease disease susceptibility in cows and goats (Fink-Gremmels, 2008; Battacone et al., 2012; Elgioushy etal., 2020). However, information on aflatoxins in rumi-nants is still limited (Elgioushy et al., 2020). Up to now,most studies on AFB toxicity were conducted on smalllaboratory animals such as rats or established cell lines,partly because purified and standard AFB is very ex-pensive, the digestive systems of ruminants are morecomplicated, and they usually have greater feed intakesthan laboratory animals (Zhang et al., 2011; Rotimi etal., 2017; Wang et al, 2021). Consequently, available11Sstudies on aflatoxicosis in production animals usuallychose naturally contaminated feeds as AFB sources.However, these feeds may contain various mycotoxinsbecause mycotoxin co-contamination is very common in feeds (Shi et al.,2018). The coexistence of multipletoxins in feeds could further complicate the treatmenteffects and make it difficult to identify the specific ef-fects caused by AFB1· At present, it is difficult to evaluate the global effectsof aflatoxicosis in ruminants. The symptoms of aflatoxi-cosis are sometimes similar to many other better-knownailments (Ogunade et al., 2018). Thus, investigatingthe plasma metabolome alterations of AFB -challengedruminants may provide new insights into the toxicity ofAFB and benefit the development of new mitigationstrategies for aflatoxicosis. Untargeted metabolomics aim to examine changes inmetabolite profiles between control and experimentalgroups, which can detect metabolomic alterations andscreen potential markers for disease diagnosis (Luo etal., 2019). In this study, the untargeted metabolomicstechnique, based on ultra-HPLC combined with quad-rupole time-of-flight MS, was applied to investigate theplasma metabolomic profiles and identify potential newbiomarkers of Saanen goats challenged with differentdoses of purified standard AFB . The effect of AFBexposure on performance, nutrient digestion, and nitro-gen metabolism was also evaluated. MATERIALS AND METHODS Animal and Experimental Design The procedure for animal care and handling was ap-proved by the Institutional Animal Care and Use Com-mittee, Southwest Minzu University (Chengdu, Sich-uan, China), and the study complied with the Guide forthe Care and Use of Agricultural Animals in Researchand Teaching (FASS, 2010). Eighteen healthy half-sib male Saanen goats withsimilar BW((31.78±1.81kg) and body condition,aged 6 mo, were selected as experimental animals. Theexperiment was conducted in a completed randomizeddesign with 3 treatments and 6 replications repetitions.Before the experiment started, all goats were treatedwith ivermectin to prevent and control the parasites,and acclimated to the experimental facility and dietfor 14 d. All goats were individually housed in 2-mpens that were protected from wind and rain with freeaccess to fresh water. Afterward, the goats were ran-domly assigned to 1 of the 3 treatments and subjectedto a short-term AFB treatment protocol (Reed et al.,2018). The treatments were (1) control diet (CON;basal diet), (2) low-dose AFB diet (LD; oral dose of50 g/kg diet DM), and (3) high-dose AFB diet (HD;oral dose of 500 pg/kg diet DM). For the 2 AFB treat-ments, the AFB challenge was beginning on d 15 andcontinued for 14 d. The experimental diet (Table 1) was Table 1. Ingredients and chemical composition of the diet (DM basis) Ingredient Chemical % of DM composition % of DM Corn grain 27.0 CP 15.8 Soybean meal 6.00 Ether extract 2.7 Soybean hulls 9.30 OM 90.6 Cottonseed meal 3.00 NFC 29.5 DDGS 1.20 NDF 42.7 Molasses 1.20 ADF 23.2 Corn cob 8.40 Hemicellulose 19.5 Oat hay 16.0 Ca 1.33 Alfalfa hay 24.0 P 0.35 Premix* 3.90 Total 100 Expressed as % of DM unless otherwise stated. NFC=100- CP - ash -NDF - ether extract. DDGS = distillers dried grains with solubles. 4Premix contained: Ca = 15 to 18%; P (minimum)=8%; Mg (mini-mum) = 0.75%; NaCl = 27 to 33%; Cu = 2,500 to 2,700 mg/kg; Se(minimum) = 50 mg/kg; Zn (minimum), 4,000 mg/kg, K (minimum),0.1%; vitamin A (minimum)= 660,000 IU/kg; vitamin D: (minimum)=66,000 IU/kg; vitamin E (minimum) = 4,000 IU/kg. formulated and provided to meet the nutrition require-ments of goats (NRC,2007). To minimize the interference of aflatoxins that al-ready existed in the diet, all feedstuffs were free of moldcontamination and screened for aflatoxins using theAgraQuant aflatoxins test Kit (Romer Labs), and theaflatoxins level in selected feedstuffs were below detec-tion limits (<3 ppb). The amount of diet supplied wasadjusted based on the real capability of consumption ofthe animals to control the orts. Aflatoxin B standard was purchased from PribolabCo., Ltd. and dissolved in methanol to prepare theconcentration of 2 and 0.2 mg/mL as stock solutionsthat were stored in a refrigerator at 4℃ (Cheng et al.,2017). The diet was provided twice daily (0630 and1830 h). During the experimental period, the calculatedamounts of AFB solutions were prepared, mixed with200 g of TMR, and provided to the low-dose and hi工1gh-dose groups before morning feeding. In the meantime,the CON group received similar quantities of methanol.To guarantee the correct ingestion of AFB, the re-maining quantity of the diet for each goat was providedonly when it had consumed all the pre-weighed 200 gof TMR. All goats were weighted weekly at 0600 h beforemorning feeding and the ADG was calculated. Thecarcass study was conducted on d 29 and all goats werekilled at the slaughterhouse using standard commercialprocedures. Slaughter live weight was recorded immedi-ately before slaughter. The tail, kidneys, pelvic fat, and testes were retained in the carcass, and the HCW wasrecorded immediately after slaughter. Blood Sample Collection and Analyses Whole blood samples were collected aseptically fromthe left jugular vein of all goats after 3 h of morningfeeding on d 14, 21, and 28 for the analyses of bloodcount analyses, and plasma samples were simultane-ously processed using 10-mL vacutainer tubes contain-ing EDTA as an anticoagulant. Complete blood countanalyses were performed on a fully automated hematol-ogy analyzer (Mindray BC-1800). After centrifugationat 1,100 × g for 15 min at 4C, the plasma was keptfrozen at -20℃ or -80℃ until further analyses. Untargeted plasma metabolomics analyses were per-formed on the plasma samples collected at d 28 by Bio-marker Tech using Waters Xevo G2-XS Q-TOF massspectrometer (Waters) coupled to an I-class Waters Ac-quity ultra-HPLC system. The mass spectrometer wasequipped with andW electrospray ionization source, andboth positive and negative ion modes were performed. In brief, the plasma sample was thawed at 4℃, anda 100-p.L aliquot was taken from each sample andtransferred into 500 pL of a pre-cooled methanol/acetonitrile solution (1:1, vol/vol). After vortex mix-ing and centrifuging (12,000 × g, 4℃) for 15 min, thesupernatant was gathered and dried in a vacuum con-centrator. Aqueous acetonitrile (acetonitrile: water =1:1, vol/vol) was used to dissolve the dried supernatant,and vortex mixing and centrifuging (12,000 × g,4℃)was performed to collect the resulted supernatant forfurther analyses. Chromatographic separation was con-ducted on an Acquity UPLC HSS T3 column (1.8 pm,2.1×100 mm; Waters Corp.). The MassLynx 4.2 soft-ware (Waters) was used for controlling the acquisitionof the mass data. In each data acquisition cycle, datawere taken at both low and high collision energies. Thequality control sample was prepared by mixing equalamounts of all samples and acetonitrile was used as ablank. The blank and quality control sample was firstanalyzed to monitor data quality and system stability.A detailed description of the metabolomics analysescould be found in a previously published study (Liu etal., 2020). Nutrient Digestibility and Nitrogen Retention From d 25 to 28, the total feces and urine of eachanimal were collected. Urine was collected into buck-ets containing HCl (10%, vol/vol) to maintain the pHbelow 3 and minimize nitrogen losses. The total fecesand urine collected was weighed, mixed, and recordeddaily (Shi et al., 2015). Aliquots urine (10%) and total fecal (20%) output were taken and stored at -20℃until chemical analyses to determine the digestibilityand N retention. Nitrogen balances were calculated asthe difference between the amount of N ingested andthat lost in urine and feces. Chemical Analyses Feed and feces sampleswere ground using a Wileymill with a 1-mm screen before analyses. AOAC In-ternational (2005) methods were used to analyze DM(method 934.01) and ash (method 942.05). Total ni-trogen and ether extract were determined using theDumatherm DT Dumas nitrogen analyzer and SoxhletExtractor SOX 416 (Gerhardt), respectively. Neutraldetergent hber and ADF were analyzed by FiberthermFT12 Fiber Analyzer (Gerhardt). The content of hemi-cellulose, cellulose, total carbohydrate, and NFC wasevaluated based on the NRC (2001). Data Processing and Statistical Analyses Plasma metabolomic raw data were collected byMassLynx 4.1 workstation and pretreated by the Pro-genesis QI software package for the extraction, align-ment, deconvolution, and normalization of peaks. Thesoftware was set to automatically search the selecteddatabases such as Human Metabolome Database (http:///www.hmdb.ca/) and METLIN Metabolite Database(https://metlin.scripps.edu/) to identify the metabo-lites based on m/z, retention time, and fragment in-formation. After being recognized and aligned, all datawere normalized to the sum total ion intensity per chro-matogram (Peng et al., 2022). Then, the data sets, in-cluding peak number (retention time-m/z pair), samplename, and normalized ion intensities, were importedinto MetaboAnalyst 4.0 (https://www.metaboanalyst.ca) to complete data preprocessing, including missingdata estimation, median centering, and unit variancescaling. The detailed workflow for data preprocessingand metabolites identification was available in previousstudies (Liu et al., 2020; Peng et al., 2022). The multivariate statistical analyses were performedOnthe BMKCloud platform(www.biocloud.net).Principal components analysis and orthogonal partialleast-squares discriminant analysis (OPLS-DA) wereemployed to visualize differences in metabolite profilesamong samples. The adjusted P-value (false discoveryrate) cutoff was set as 0.05 before the principal com-ponents analysis and OPLS-DA analysis. Differentialmetabolites were selected according to the following 3conditions: minimum fold change (FC) > 1, P-value<0.05 in single-dimensional statistical analysis, andvariable importance value (VIP) > 1 in the OPLS-DA Table 2. Apparent digestibility (%) of nutrients in goats fed the experimental diets AFB P-value Item 0 50 500 SEM L Q DM 74.0 71.5 71.3 0.71 0.031 0.088 0.033 Ether extract 67.8 66.3 62.8 0.78 0.001 <0.001 0.383 CP 75.2 72.7 70.9 1.22 0.075 0.048 0.235 OM 72.2 69.5 69.0 0.78 0.025 0.048 0.043 NDF 60.9 57.7 55.3 1.23 0.019 0.013 0.130 ADF 58.9 55.6 51.6 1.44 0.009 0.004 0.201 Hemicellulose 63.3 60.2 59.6 1.28 0.125 0.156 0.131 Zero = control diet without aflatoxin B (AFB); 50= 50 pg/kg AFBi per kg of dietary DM; 500 = 500 pg/kg AFBi per kg of dietary DM; n= 6 animals/treatment. model (Peng et al., 2022). Moreover, a permutation testwas conducted to evaluate the quality of the OPLS-DAmodels. The goodness-of-fit was represented by R'Y,and the predictive ability was indicated by Q. The differential metabolites were further annotated toKyoto Encyclopedia of Genes and Genomes (KEGG)pathways by the KEGG PATHWAY database (http://www.kegg.jp/kegg/pathway.html). Furthermore.MetaboAnalyst 4.0 was also used to perform receiveroperating characteristic (ROC) analysis based on theidentified differential metabolites and the ROC curveswere constructed by Random forest algorithms (Liu etal., 2020). The effects of AFB on apparent digestibility, ni-trogen metabolism, growth performance, and bloodcell counts were analyzed using one-way ANOVA bygeneralized linear model procedure in SAS 9.4 software(SAS Institute Inc.). The statistical model for analysiswas yij=以+Ti+ e, where yi is the observation, u isthe overall mean, T is the effects of AFB1 doses (lowand high), and e is the random error. Duncan’s test was used for multiple comparisons if the major effectis significant at a 0.05 level. Orthogonal polynomialcontrasts were performed to determine linear and qua-dratic effects of treatments on the responses analyzed.Significant differences were declared at P≤0.05, andtrends were reported at 0.05 0.05). Exposure toincreasing levels of AFB linearly decreased (P=0.029)the total weight gain and ADG of the animals. Blood Cell Count Parameters Complete blood cell count parameters are shown inTable 5. The levels of red blood cell count (RBC;P=0.028), hemoglobin (HGB; P=0.013), mean corpus-cular volume (MCV; P=0.005), and mean corpus-cular hemoglobin (P =0.045) were changed linearlywith increasing AFB doses. No significant difference inthe values of hematocrit, mean corpuscular hemoglobinconcentration, and red cell distribution width index(RDW) were observed among groups. Metabolite Profiling of Plasma Samples After checking the data integrity, a total number of3,310 and 1,462 ion peaks were obtained in positiveand negative ion modes, respectively. The supervisedOPLS-DAAanalysiss was constructed to visualize thealterations in metabolic profiles among the 3 groups(Supplemental Figure S1; https://doi.org/10.6084/m9.figshare.21194458.v2; Shi, 2022). The OPLS-DA mod-els revealed good separations (RY> 0.9,Q">0.4)among all groups except LD versus HD in negative ionmode. Apparent differences were observed in plasma metabolome among the treatments. The differences be-tween the CON and HD were more obvious than thatbetween CON and LD. Differential Metabolites and Their Identification Based on the screening criteria, 1,307 (CON vs. LD),1,319 (CON vs. HD), and 506 (LD vs. HD) differentialmetabolites were detected in positive ion mode, respec-tively. However, only 31 (CON vs. LD), 39 (CON Vs.HD), and 6 (LD vs. HD) differential metabolites weredetected in the negative ion mode. As shown in Figure1, 98.2% of the differed metabolites in the positive modewere upregulated in LD and HD groups when comparedwith the CON group. Among the differed metabolites,20 of them were only affected by the low-dose AFB(SupplementalTable S1; https://doi.org/10.6084/m9.figshare.21194458.v2; Shi, 2022), 17 metabolites wereonly affected by the high-dose AFB (Supplemental Ta-ble S2; https://doi.org/10.6084/m9.figshare.21194458.v2; Shi, 2022), and 58 metabolites were affected byboth low- and high-dose AFB (Supplemental TableS3;https://doi.org/10.6084/m9.figshare.21194458.v2;Shi, 2022). Fold change of the metabolites was alsocalculated and included in Supplemental Tables S1-S3. The 95 metabolites can be categorized into 20 classes;specifically, glycerophospholipids, carboxylic acids andderivatives, and organonitrogen compounds were the 3l.cooomost abundant classes. The relative average normalizedlevels of those metabolites were plotted in a heatmapcreated by the R package, pheatmap (Figure 2). Themetabolites were clustered according to their Pearsoncorrelationn coefficients.ObviouIsS2alterationsinnttheidentified differential metabolites among groups can beobserved in the heatmap. The area under the curve (AUC) of the ROC curveswas calculated using the trapezoidal rule and the AUCvalues of the 95 metabolites (Supplemental Tables S1-S3) ranged from 0.81 to 1. Shi et al.: AFLATOXIN-INDUCED PLASMA METABOLOMIC CHANGES Table 5. Complete blood cell counts of goats fed the experimental diets AFB P-value” Item* 0 50 500 SEM L Q WBC (10/L) 11.5 12.9 14.0 0.84 0.141 0.085 0.312 RBC (102/L) 19.8 21.4 22.4 0.65 0.040 0.028 0.165 HGB (g/L) 103 108 113 2.22 0.028 0.013 0.275 Hematocrit (%) 33.7 33.4 33.6 1.05 0.972 0.981 0.814 MCV (fL) 14.6 14.6 16.6 0.49 0.017 0.005 0.861 MCH((pg) 5.12 5.03 4.70 0.14 0.122 0.045 0.830 MCHC (g/L) 330 315 310 8.84 0.302 0.232 0.322 RDW (%) 21.6 22.2 23.0 0.56 0.238 0.109 0.621 WBC= white blood cell count; RBC = red blood cell count; HGB=hemoglobin; MCV= mean corpuscularvolume; MCH= mean corpuscular hemoglobin; MCHC = mean corpuscular hemoglobin concentration; RDW= red cell distribution width index. Zero = control diet without aflatoxin B (AFB); 50=50 pg/kg AFBi per kg of dietary DM; 500= 500 pg/kg AFB per kg of dietary DM; n = 6 animals/treatment. Metabolic Pathway Analyses The KEGG enrichment analysis and topology analy-ses (MetaboAnalyst 5.0) were performed based on the95 differential metabolites listed in Supplemental TablesS1-S3)((https://doi.org/10.6084/m9.figshare.21194458.v2; Shi, 2022) to investigate and map the metabolicdifferences among treatments. Pathways with an im-pact value greater than 0.1 or P < 0.05 were consideredas significantly altered pathways and were labeled inFigure 3. Pathway topology analysis revealed that the 58metabolites differed among all groups enriched in 19pathways, glycerophospholipid metabolism, tyrosinemetabolism, caffeine metabolism, and cysteine andmethionine metabolism were the most impacted path-ways (pathway impact values >0.1). Based on KEGGenrichment analysis, the intestinal immune network forIgA production, small cell lung cancer, proteoglycansin cancer, glycosaminoglycan biosynthesis, and gastriccancer were significant metabolic pathways betweenCON and LD. Glycerophospholipid metabolism andcholine metabolism in cancer were significant meta-bolic pathways between CON and HD. Moreover, 20pathways including choline metabolism in cancer, glyc-erophospholipid metabolism, and hepatocellular carci-noma, were enriched as significant metabolic pathwaysamong all groups. Compared with the CON, the level of LysoPC18:3(6Z,9Z,12Z)], LysoPC [22:5(4Z,7Z,10Z,13Z,16Z)],LysoPC [20:5(5Z,8Z,11Z,14Z,17Z)],and triethanolaminein HD was significantly increased (P < 0.05, FC >2),and the level of sn-glycerol-3-phosphoethanolamine inLD was also increased (P <0.05, FC= 2.31). Notably,12 of the 58 differential metabolites among all groupswere enriched in the glycerophospholipid metabolism pathway, and their levels were significantly upregulatedwith increasing AFB dose (P< 0.05). Moreover, 10of them were also enriched in choline metabolism incancer pathway together with diacylglycerols (DG)16:0/18:1(11Z)/0:0and DG 16:0/18:2(9Z,12Z)/0:0]J.nterestingly,DG[16:0/18:1(11Z)/0:0] andDG16:0/18:2(9Z,12Z)/0:0]were also the 2 metabolitesenriched in hepatocellular carcinoma and other 17 sig-nificant pathways. Fifteen metabolites that differed among all groups(FC: 1.2-4.06, P<0.05)were associated with AAmetabolism, including metabolic pathways associatedwith phenylalanine (ko00360; salicylic acid), arginine, Figure 1. Changing trend statistics of the metabolites detected in(A) positive and (B) negative ion modes among groups. C= controlgroup; L= 50 pg/kg aflatoxin Bi (AFB) per kg of dietary DM; H=500 pg/kg AFBi per kilogram of dietary DM; up, down, and unchangemeans several metabolites that are upregulated, downregulated, andunaffected metabolites, respectively. Shi et al.: AFLATOXIN-INDUCED PLASMA METABOLOMIC CHANGES A B ·1-Methylhistidine -7 ·Hypoxanthine -Pipecolic acid -13.5 -LysoPC(17:0) -LysoPC(15:0) -20 -Indinavir - meta 1411 -LysoPC(22:5(4Z,7Z,10Z,13Z,16Z)) -LysoPC(20:1(11Z)) -LysoPC(20:5(5Z,8Z,11Z,14Z,17Z)) -LysoPC(18:3(6Z,9Z,12Z)) -Cholesterol 3-sulfate - meta 262 -Cholesterol glucuronide-Nicotinamide ribotide -Dopaquinone -Triethanolamine 四厂 四' 四' 四w' 四四工 一工四四工工四工N 四'一 C -12.5 Figure 2. Heatmaps are generated by the R package pheatmap with standard settings. The colors from green to red indicate the normalizedrelative levels of metabolites. (A) Metabolites only affected by low-dose aflatoxin B (AFB; 50 pg/kg AFB per kg of dietary DM); (B) me-tabolites only affected by high-dose AFB (500 pg/kg AFBi per kg of dietary DM); (C) metabolites affected by both low- and high-dose AFB;meta_288: sn-glycero-3-phosphoethanolamine; meta_1414: carbamazepine-O-quinone; meta_262: 4-(2-aminophenyl)-2,4-dioxobutanoic acid;meta_1411: 1-palmitoyl-sn-glycero-3-phosphocholine; meta_1310: 3,4-dihydroxyphenylacetaldehyde; meta_1588: a-[3-(nitrosoamino)propyl]-3-pyridinemethanol; meta_3274: 1-palmitoyl-sn-glycero-3-phosphocholine. Shi et al.: AFLATOXIN-INDUCED PLASMA METABOLOMIC CHANGES Statistics of Pathway Enrichment B Rich factor Figure 3. (A, C, and E) Kyoto Encyclopedia of Genes and Genomes pathway enrichment and (B, D, and F) topology analysis of metabolitesdiffered among groups. (A and B) 20 metabolites only affected by low-dose aflatoxin B (AFB; 50 pg/kg AFBi per kg of dietary DM); (C andD) 17 metabolites only affected by high-dose AFB (500 pg/kg AFBi per kg of dietary DM); (E and F) 58 metabolites affected by both low- andhigh-dose AFB. The color of each circle changes according to the P-values (more significant changes of metabolites in the pathway are shownby darker colors), whereas the metabolite numbers and pathway impact score is depicted by the size of the circle. The most impacted pathwayswith the highest statistical significance scores are annotated for clarity. and proline (ko00330; creatinine and pyrrole-2-carbox-ylic acid), lysine (ko00300 and ko00310; saccharopine,2,4-diaminobutyric acid, and L-cystathionine),CyS-teine and methionine (ko00270; L-cystathionine and5-methylthioribose),ttyrosine metabolism(ko00350;3,4-dihydroxyphenylacetaldehyde, homogentisic acid,leucodopachrome,4-fumarylacetoacetic acid),andtryptophan metabolism (ko00380; 3-methyldioxyindole,indole, and tryptophanol, 6-hydroxymelatonin), andtheir content was significantly increased with elevatedAFB doses. To achieve more reliable results, animals used inthis study were strictly selected before the experimenttominimizeeiradividual vvariations.Natural1FAFB-contaminated feeds are usually co-contaminated withmany other mycotoxins; therefore, we selected purifiedstandard AFBi to avoid the interference of other toxinsderived from contaminated feeds. During the feedingexperiment, all goats appeared to be clinically normaland no deaths resulted from the intoxication. Nutrient Digestibility and Nitrogen Balance Our results suggested that when the AFB level inthe diet exceed 50 pg/kg, the total-tract digestibilityof most nutrients in goats could be affected. This isin line with the previously published observations. Forinstance, Edrington et al. (1994) reported decreasedintake, daily gain, and feed efficiency in growing lambsintoxicated with 2.5 mg/kg aflatoxin. Aflatoxin EBexposure also decreased the apparent total-tract di-gestibility of DM and ether extract of pigs at differentgrowing stages (Pu et al., 2021). Growth Performance The decreased growth performance agreed with previ-ous observations. Fernández et al. (1996) reported thatthe reduction in BW is the most sensitive indicator ofaflatoxin intoxication in growing lambs (Fernandez etal., 1996). In another study, Fernandez et al. (2000)also observed a nonsignificant decrease in BW and asignificant decrease in ADG in lambs intoxicated witha diet contaminated with 2 ppm aflatoxin. Sun et al. (2018) found that the AFBj-contaminateddiet decreased BW and ADG of male rabbits. Feedinga diet supplemented with 280 pg/kg AFB tended todecrease the final BW and ADG of pigs (Pu et al.,2021). The decreased growth performance of intoxicatedanimals could have partly resulted from the suppressednutrient digestibility and nitrogen retention. Blood Cell Count Parameters Hematological indices could reflect the pathological,physiological, and nutritional status of intoxicated ani-mals. We found no significant difference in RBC, HGB,and MCV among groups before the AFB challengeErvtl(data not shown). Erythrocytes are the main mediumfor delivering oxygen to tissues and organs. The lev-els of RBC and HGB are associated with erythrocytefunction, which delivers oxygen to organs and supportsaerobic respiration and metabolism (Schaer et al.,2013). Increased RBC and HGB in lambs fed 2.5 ppmof aflatoxins have also been reported by Fernandez etal. (1996). They inferred that the relative polycythemiawas probably associated with thWase decrease in waterintake because many studies observed an increase inhematological parameters in animal aflatoxicosis due tothe hemoconcentration phenomenon. In another study,the MCV and HGB were elevated in mice treated withfumonisin B for 8 wk (Chen et al., 2021). Zhang et al. (2020) found that orally administeredwith 0.75 mg/kg AFB decreasedRBC and HGB,whereas MCV was not affected. The difference in re-sults might be partly due to the discrepancy in animalspecies, dietary level, and sources (purified or naturallycontaminated) of AFB. Metabolite Profiling of Plasma Samples The parameters R'Y (model interpretation rate) andQ(predictive ability of the model) were greater than0.4 of most OPLS-DA models, indicating these modelswere stable and reliable. Cross-validation and permuta-tion tests for these models showed that the Q"interceptis close to or underlies zero, indicating that there wasno overfitting (Yong et al., 2021). Symbols representingdifferent groups were distributed to different sides ofthe OPLS-DA score plots, suggesting that clear dif-ferences existed in the plasma metabolite profiles ofdifferent groups. Our results agreed well with previousstudies that dense peaks and ions identified in plasmaby positive modes are far more than that by negativemodes, because most of the plasma metabolites (e.g.,glycerophospholipid and AA) can be easier ionized atpositive modes (Zhao et al., 2018). Differential Metabolites and Their Identification There is no uniform standard for differential metabo-lites and biomarker selection so far, and the differentialmetabolites selected may not be really useful as clini-cal biomarkers. Receiver operating characteristic curveanalysis has been widely considered as an objective andstatistically valid method for biomarker performance evaluation (Xia et al.,2013). The AUC values >0.8means good utility, and >0.9 means excellent perfor-mance. Researchers suggested all metabolomic studiespresent ROC analysis results to facilitate further dis-covery and validation studies (Xia et al.,2013). When taking the FC and AUC (FC >3, AUC >0.8)into consideration simultaneously, 5 metabolites be-tween CON and LD, 6 metabolites between CON andHD, and 29 metabolites among the 3 groups could beconsidered as the most significantly altered metabo-lites, and might be used as biomarkers for discrimi-nating CON, LD, and HD groups. Those metabolitesmight have the potential to be used as new biomarkersto diagnose aflatoxicosis in goats induced by differentAFB doses. One limitation of our study was that thelevel of some reported blood biomarkers of aflatoxicosisin humans and animals, such as AFBj-albumin ad-duct and AFB-lysine adduct (Xue et al., 2016), wasnot determined. Further studies focused on comparingthe identified metabolites with existing markers andvalidating their effectiveness in aflatoxicosis diagnosisare highly needed. Moreover, the AUC values could beaffected by many factors such as small study samplesizes (Carter et al.,2016), more investigations with dif-ferent animals, and larger sample sizes are encouraged. To exert its carcinogenic potential, AFBi must bemetabolically activated by P450 enzymes in the liver,whereas the critical P450 enzymes in different animalshave yet to be identified. Alpha-[3-(Nitrosoamino)propyl]-3-pyridinemethanol, 4-Oxo-1-(3-pyridyl)-1-bu-一tanone, and 3-hydroxylidocaine were related to cyto-chrome P450 metabolism (ko00980 and ko00982), andtheir levels were significantly upregulated (FC > 2.36,小P < 0.01) with increasing doses of AFB. In the humanliver, P450s are critical for the formation of 4-Oxo-1-(3-pyridyl)-1-butanone (keto aldehyde), which couldmethylate DNA, and is believed to be important in thecarcinogenic progress (Rendic and Guengerich, 2021).Moreover, carbamazepine-O-quinone,S-(1,2-dichlorovinyl) glutathione were also related tocytochrome P450 metabolism (ko00980 and ko00982),and their content was significantly increased (FC >2.38, P <0.01) in LD when compared with CON. Fur-ther study is encouraged to evaluate the potential ofthese metabolites used as targets to block the activa-tion of AFB in the liver. Sphingosine has been reportedfactor in various cell types and may play importantrole in some apoptotic systems. It is also able to in-duce apoptosis in a mitochondrion-dependent manner(Cuvillier, 2002). In the present study, the content ofplasma sphingosine was increased with AFB doses(Supplemental Table S3), and the relationship between sphingosine and cell apoptosis in ruminants deservesfurther research1.. Metabolic Pathway Analyses Based on our results, glycerophospholipid metabolism(ko00564) and choline metabolism in cancer (ko05231)pathways were the most affected pathways in AFB1intoxicated goats, and many common metabolites wereshared between them. The elevation of plasma choline and phosphocholinemight be related to the hepatotoxicity and carcinogenic-ity of AFB. Zhang et al. (2011) observed a significantelevation of choline metabolites (choline, phosphocho-line, glycerophosphocholine) in plasma, and increasedlipids and AA (tyrosine, histidine, phenylalanine, leu-cine, isoleucine, and valine), choline, and nucleic acidmetabolites in the liver of rats exposed to AFB1 Choline metabolism could be affected in varioustypes of cancers, and increased levels of phosphocholineand total choline-containing compounds have increas-ingly been considered as endogenous biomarkers ofmany cancers (Glunde et al., 2015). Detecting changesin choline metabolism in plasma could prove to be auseful way in early tumor identification (Glunde etal., 2015). Research confirmed that several enzymes incholine, ethanolamine, and phospholipid metabolismare involved in tumor progression and carcinogenesisCheng et al., 2016). Further studies on discovering thegenes and signaling pathways leading to the changes incholine-containing metabolites are needed. Glycerophospholipids are major lipid constituents of cell membranes and play vital roles in cell proliferation,differentiation, and apoptosis (van Meer et al., 2008).The content of phospholipids was increased during celltransformation and tumor progression (Cheng et al.,2016). Aberrant choline and ethanolamine phospholipidmetabolism have been observed in all cancers so far(Cheng et al., 2016). Liver injury and disturbed expres-sion of genes associated with lipid metabolism were alsoobserved in rats exposed to 0.5 and 1 mg/kgof AFBfor 7 d (Rotimi et al., 2017). Research on Hep3B cellsreported similar findings. Wang et al. (2021) evaluatedthe effects of AFB exposure on metabolomic changesof Hep3B cells, and a marked elevation in glycerophos-pholipids level was observed. The level of 8 phospho-choline, 12 phosphatidylethanolamine, and 9 phos-phatidylserine metabolites was significantly increasedin high-dose AFB cells. Moreover, elevated level ofcholine and phosphocholine in AFBj-exposed cells wasalso observed. Their results indicated disturbed struc-tural integrity of cell membranes was induced by AFBbecause choline, phosphocholine, and phosphocholine are essential elements of them. Enzymes mediating theabnormal choline metabolism are being investigatedas targets for cancer therapy. The role of the cholinemetabolism in ruminant AFB intoxication and the un-derlying molecular causes merits further investigation. Dysregulation of AA metabolism was also observedin our study. The levels of the 15 differential metabo-lites among all groups related to AA metabolism wereupregulated with increasing AFB levels. This is agreedwith a previous study that AFBi could induce signifi-cant changes in AA metabolism in Hep3B cells (Wanget al., 2021). CONCLUSIONS Exposure to AFB decreased total-tract nutrientdigestibility, N retention, and ADG of Saanen goats.The ability of ruminants to inactivate AFBi mightbe limited and the long-standing hypothesis that ru-minants are less vulnerable to AFBi may need to bereevaluated.UntargetedmetabolomicsSsuccessfullyrevealed the alterations in plasma metabolome. Meta-bolic changes in the high-dose group were more obviousthan that in the low-dose group. Fifty-eight metaboliteswere significantly affected by both low and high dosesof AFB, and there is merit in the further investigationto explore the potential of using them as biomarkersfor AFB intoxication diagnosis. There were remarkablen. plvcercchanges in choline metabolism, glycerophospholipidmetabolism, and AA metabolism pathways. Exploringthe underlying molecular causes of the changes mayhelp the development of rapid diagnostic techniques6+1xTAand preventive strategies for AFB intoxication. ACKNOWLEDGMENTS This study was supported by the National NaturalScience Foundation of China (grant no. 31902187),theFundamental Research Funds for the Central Univer-sities, Southwest Minzu University (Chengdu, China;grant no. 2021HQZZ04, 2021057), and the InnovationTeam Development Funds for Sichuan Mutton Goat &Sheep (Chengdu, China; grant no. cxtd2019-14). Thework described here has not been published previ-ously and is not under consideration for publicationelsewhere. The authors have not stated any conflictsof interest. REFERENCES Adebo, O. A., P. B. Njobeh, S. Gbashi, O. C. Nwinyi, and V. Mavu-mengwana. 2017. Review on microbial degradation of aflatoxins.Crit. Rev. Food Sci. Nutr. 57:3208-3217. https://doi.org/10.1080/10408398.2015.1106440. AOAC International. 2005. Official Methods of Analysis of AOAC.18th ed. AOAC International. Battacone, G., A. Nudda, S. P. G. Rassu, M. Decandia, and G. Pulina.2012. Excretion pattern of aflatoxin M 1 in the milk of goats fed asingle dose of aflatoxin Bj. J. Dairy Sci. 95:2656-2661. https://doi.org/10.3168/jds.2011-5003. Blankson, G. K., and F. C. Mill-Robertson. 2016. Aflatoxin contamina-6.1 1d-tion and exposure in processed cereal-based complementary foodsfor infants and young children in greater Accra, Ghana. Food Con-trol 64:212-217. https://doi.org/10.1016/j.foodcont.2015.12.032. Carter, J. V., J. Pan, S. N. Rai, and S. Galandiuk. 2016. ROC-ingalong: Evaluation and interpretation of receiver operating charac-teristic curves. Surgery 159:1638-1645. https://doi.org/10.1016/j.surg.2015.12.029. Chen, Z., F. Zhang, L. Jiang, Z. Chen, and H. Sun. 2021. Toxic ef-fects of mycotoxin fumonisin B1 at six different doses on femaleBALB/c mice.Toxins(Basel) 14:21. https://doi.org/10.3390/toxins14010021. Cheng, J., S. Huang, C. Fan, N. Zheng, Y. Zhang, S. Li, and J. Wang.2017. Metabolomic analysis of alterations in lipid oxidation, car-bohydrate, and amino acid metabolism in dairy goats caused byexposure to aflotoxin B1. J. Dairy Res. 84:401-406. https://doi.org/10.1017/S0022029917000590. Cheng, M., Z. M. Bhujwalla, and K. Glunde. 2016. Targeting phospho-lipid metabolism in cancer. Front. Oncol. 6:266. https://doi.org/10.3389/fonc.2016.00266. Cuvillier, O. 2002. Sphingosine in apoptosis signaling. Biochim. Bio-phys. Acta Mol. Cell Biol. Lipids 1585:153-162.https://doi.org/10.1016/S1388-1981(02)00336-0. Edrington,T. S., R. B. Harvey, and L. F. Kubena. 1994. Effect of afla-toxin in growing lambs fed ruminally degradable or escape proteinTAsources. J. Anim. Sci. 72:1274-1281. https://doi.org/10.2527/1994.7251274x. Elgioushy, M. M., S. A. Elgaml, M. M. El-Adl, A. M. Hegazy, andE. A. Hashish. 2020. Aflatoxicosis in cattle: Clinical findings andbiochemical alterations. Environ. Sci. Pollut. Res. Int. 27:35526-35534. https://doi.org/10.1007/s11356-020-09489-3. FASS. 2010. Guide for the Care and Use of Agricultural Animals inResearch and Teaching. 3rd ed. FASS Inc. Fernandez, A., M. Hernandez, M. T. Verde, and M. Sanz. 2000. Effectof aflatoxin on performance, hematology, and clinical immunologyin lambs. Can. J. Vet. Res. 64:53-58. Fernandez, A., J. J. Ramos, M. C. Sanz, T. Saez, and D. F. Luco.1996. Alterations in the performance, haematology and clinicalbiochemistry of growing lambs fed with aflatoxin in the diet. J.Appl. Toxicol.16:85-91.https://doi.org/10.1002/(SICI)1099-1263(199601)16:1<85::AID-JAT315>3.0.CO;2-T. Fink-Gremmels, J. 2008. Mycotoxins in cattle feeds and carry-over todairy milk: A review. Food Addit. Contam. Part A Chem. Anal.Control Expo. Risk Assess. 25:172-180. https://doi.org/10.1080/02652030701823142. Giovati, L., W. Magliani, T. Ciociola, C. Santinoli, S. Conti, and L.Polonelli. 2015. AFM1 in milk: Physical, biological, and prophy-lactic methods to mitigate contamination. Toxins (Basel) 7:4330-4349. https://doi.org/10.3390/toxins7104330. Glunde, K., M.-F. Penet, L. Jiang, M. A. Jacobs, and Z. M. Bhujwalla.2015. Choline metabolism-based molecular diagnosis of cancer: Anupdate. Expert Rev. Mol. Diagn. 15:735-747. https://doi.org/10.1586/14737159.2015.1039515. Reed, K., K. Mendoza, J. Abrahante, and R. Coulombe. 2018. Com-parative response of the hepatic transcriptomes of domesticatedand wild turkey to aflatoxin B. Toxins (Basel) 10:42. https://doi.org/10.3390/toxins10010042. Liu, X., M. Zhang, X. Cheng, X. Liu, H. Sun, Z. Guo, J. Li, X. Tang,Z. Wang, W. Sun, Y. Zhang, and Z. Ji. 2020. LC-MS-based plasmametabolomics and lipidomics analyses for differential diagnosis ofbladder cancer and renal cell carcinoma. Front. Oncol. 10:717.https://doi.org/10.3389/fonc.2020.00717. Luo, z. Z., L. H. Shen, J. Jiang, Y. X. Huang, L. P. Bai, S. M. Yu, X.P. Yao, Z. H. Ren, Y. X. Yang, and S. Z. Cao. 2019. Plasma me-tabolite changes in dairy cows during parturition identified using untargeted metabolomics. J. Dairy Sci. 102:4639-4650. https://doi.org/10.3168/jds.2018-15601. Marin, S., A. J. Ramos, G. Cano-Sancho, and V. Sanchis. 2013. My-cotoxins: Occurrence, toxicology, and exposure assessment. FoodChem. Toxicol. 60:218-237. https://doi.org/10.1016/j.fct.2013.07.047. NRC. 2001. Nutrient Requirements of Dairy Cattle. 7th ed. Natl.Acad. Sci. NRC. 2007. Nutrient Requirements of Small Ruminants: Sheep, Goats,Cervids, and New World Camelids. 1st rev. ed. Natl. Acad. Press. Ogunade, I., Y. Jiang, J. Adeyemi, A. Oliveira, D. Vyas, and A. Ad-esogan. 2018. Biomarker of aflatoxin ingestion: H NMR-basedplasma metabolomics of dairy cows fed aflatoxin B with or with-out sequestering agents. Toxins (Basel) 10:545. https://doi.org/10.3390/toxins10120545. Peng, J., L. Ma, L. Y. Kwok, W. Zhang, and T. Sun. 2022. Untar-geted metabolic footprinting reveals key differences between fer-mented brown milk and fermented milk metabolomes.J. Dairy Sci.105:2771-2790. https://doi.org/10.3168/jds.2021-20844. Pu, J., Q. Yuan, H. Yan, G. Tian, D. Chen, J. He, P. Zheng, J. Yu,X. Mao, Z. Huang, J. Luo, Y. Luo, and B. Yu. 2021. Effects ofchronic exposure to low levels of dietary aflatoxin Bi on growthperformance, apparent total tract digestibility and intestinalhealth in pigs. Animals (Basel) 11:336. https://doi.org/10.3390/ani11020336. Rendic, S. P., and F. P. Guengerich. 2021. Human family 1-4 cy-tochrome P450 enzymes involved in the metabolic activation ofxenobiotic and physiological chemicals: an update. Arch. Toxicol.95:395-472. https://doi.org/10.1007/s00204-020-02971-4. Rotimi, O. A., S. O. Rotimi, C. U. Duru, O. J. Ebebeinwe, A. O.Abiodun, B. O. Oyeniyi, and F. A. Faduyile. 2017. Acute aflatoxinB1-Induced hepatotoxicity alters gene expression and disruptslipid and lipoprotein metabolism in rats. Toxicol. Rep. 4:408-414.https://doi.org/10.1016/j.toxrep.2017.07.006. Schaer, D. J., P. W. Buehler, A. I. Alayash, J. D. Belcher, and G. M.Vercellotti. 2013. Hemolysis and free hemoglobin revisited: Explor-ing hemoglobin and hemin scavengers as a novel class of therapeu-tic proteins. Blood 121:1276-1284. https://doi.org/10.1182/blood-2012-11-451229. Shi, H. 2022. JDS22129.pdf. figshare. Online resource. https://doi.org/https://doi.org/10.6084/m9.figshare.21194458.v2. Shi, H., S. Li, Y. Bai, L. L. Prates, Y. Lei, and P. Yu. 2018. Myco-toxin contamination of food and feed in China: Occurrence, detec-tion techniques, toxicological effects and advances in mitigation technologies. Food Control 91:202-215. https://doi.org/10.1016/j.foodcont.2018.03.036. Shi, H. T., S. L. Li, Z. J. Cao, Y. J. Wang, G. M. Alugongo, and P.H. Doane. 2015. Effects of replacing wild rye, corn silage, or corngrain with CaO-treated corn stover and dried distillers grains withsolubles in lactating cow diets on performance, digestibility, andprofitability. J. Dairy Sci. 98:7183-7193. https://doi.org/10.3168/ids.2014-9273. Sun, Y., G. Dong, G. E, M. Liao, L. Tao, and J. Lv. 2018. The effectsof low levels of aflatoxin B1 on health, growth performance and re-productivity in male rabbits. World Rabbit Sci. 26:123-133. https://doi.org/10.4995/wrs.2018.7433. van Meer, G., D. R. Voelker, and G. W. Feigenson. 2008. Membranelipids: Where they are and how they behave. Nat. Rev. Mol. CellBiol. 9:112-124. https://doi.org/10.1038/nrm2330. Wang, S., X. Yang, F. Liu, X. Wang, X. Zhang, K. He, and H. Wang.2021. Comprehensive metabolomic analysis reveals dynamic meta-bolic reprogramming in Hep3B cells with aflatoxin B1 exposure.Toxins (Basel) 13:384. https://doi.org/10.3390/toxins13060384. Xia,, J., D. Y. Broadhurst, M. Wilson, and D. S. Wishart. 2013.Translational biomarker discovery in clinical metabolomics: Anintroductory tutorial. Metabolomics 9:280-299. https://doi.org/10.1007/s11306-012-0482-9. Xue, K. S., W. Cai, L. Tang, and J. S. Wang. 2016. Aflatoxin B1-lysineadduct in dried blood spot samples of animals and humans. FoodChem. Toxicol. 98:210-219. https://doi.org/10.1016/j.fct.2016.11.002. Yong, K., Z. Luo, Q. Luo, Q. Yang, Y. Huang, X. Zhao, Y. Zhang,andS. Cao. 2021. Plasma metabolome alteration in dairy cows withleft displaced abomasum before and after surgical correction. J.Dairy Sci. 104:8177-8187.https://doi.org/10.3168/jds.2020-19761. Zhang, J., P. Wang, F. Xu, W. Huang, Q. Ji, Y. Han, B. Shao, andY. Li. 2020. Protective effects of lycopene against AFB-inducederythrocyte dysfunction and oxidative stress in mice. Res. Vet. Sci.129:103-108. https://doi.org/10.1016/j.rvsc.2020.01.015. Zhang, L., Y. Ye, Y. An, Y. Tian, Y. Wang, and H. Tang. 2011.Systems responses of rats to aflatoxin Bl exposure revealed withmetabonomic changes in multiple biological matrices. J. ProteomeRes. 10:614-623. https://doi.org/10.1021/pr100792q. Zhao, H., C. Wang, N. Zhao, W. Li, Z. Yang, X. Liu, W. Le, and X.Zhang. 2018. Potential biomarkers of Parkinson’s disease revealedby plasma metabolic profiling. J. Chromatogr. B Analyt. Technol.Biomed. Life Sci. 1081-1082:101-108. https://doi.org/10.1016/j.ichromb.2018.01.025.
确定
还剩10页未读,是否继续阅读?

产品配置单


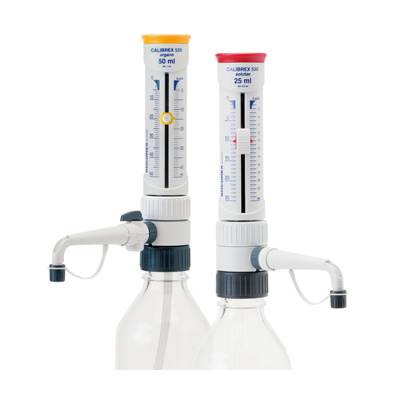
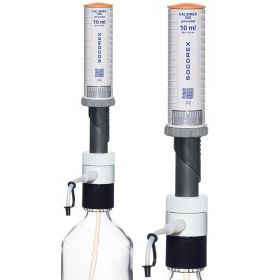
中国格哈特为您提供《萨能奶山羊饲料和排泄物中蛋白质、脂肪、中性洗涤纤维、酸性洗涤纤维》,该方案主要用于饲料中营养成分检测,参考标准--,《萨能奶山羊饲料和排泄物中蛋白质、脂肪、中性洗涤纤维、酸性洗涤纤维》用到的仪器有格哈特杜马斯定氮仪DT N Pro、格哈特全自动超级总脂肪测定系统HT6+SOX416、格哈特全自动型纤维分析仪FT12、德国加液器MM、滤纸筒


相关方案
更多
该厂商其他方案
更多