


生、烤、脱壳鹰嘴豆粉对无麸质面包工艺及营养特性的影响Impact of Raw, Roasted and Dehulled Chickpea Flours on Technological and Nutritional Characteristics of Gluten-Free Bread.
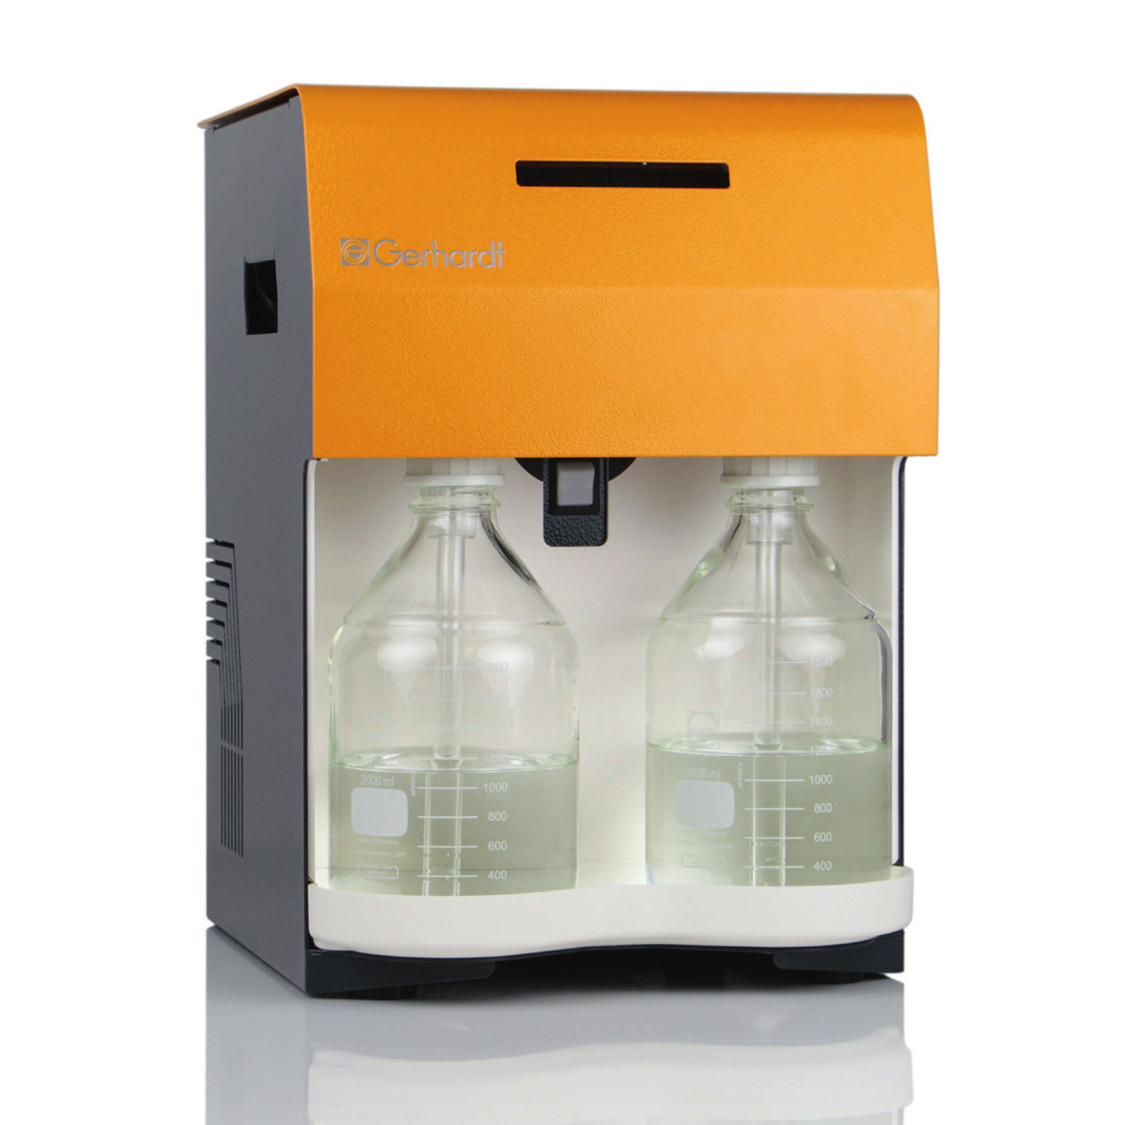
使用格哈特公司蛋白质测定仪和全自动快速脂肪仪检测生、烤、脱壳鹰嘴豆粉无麸质面包蛋白质和脂肪含量
方案详情

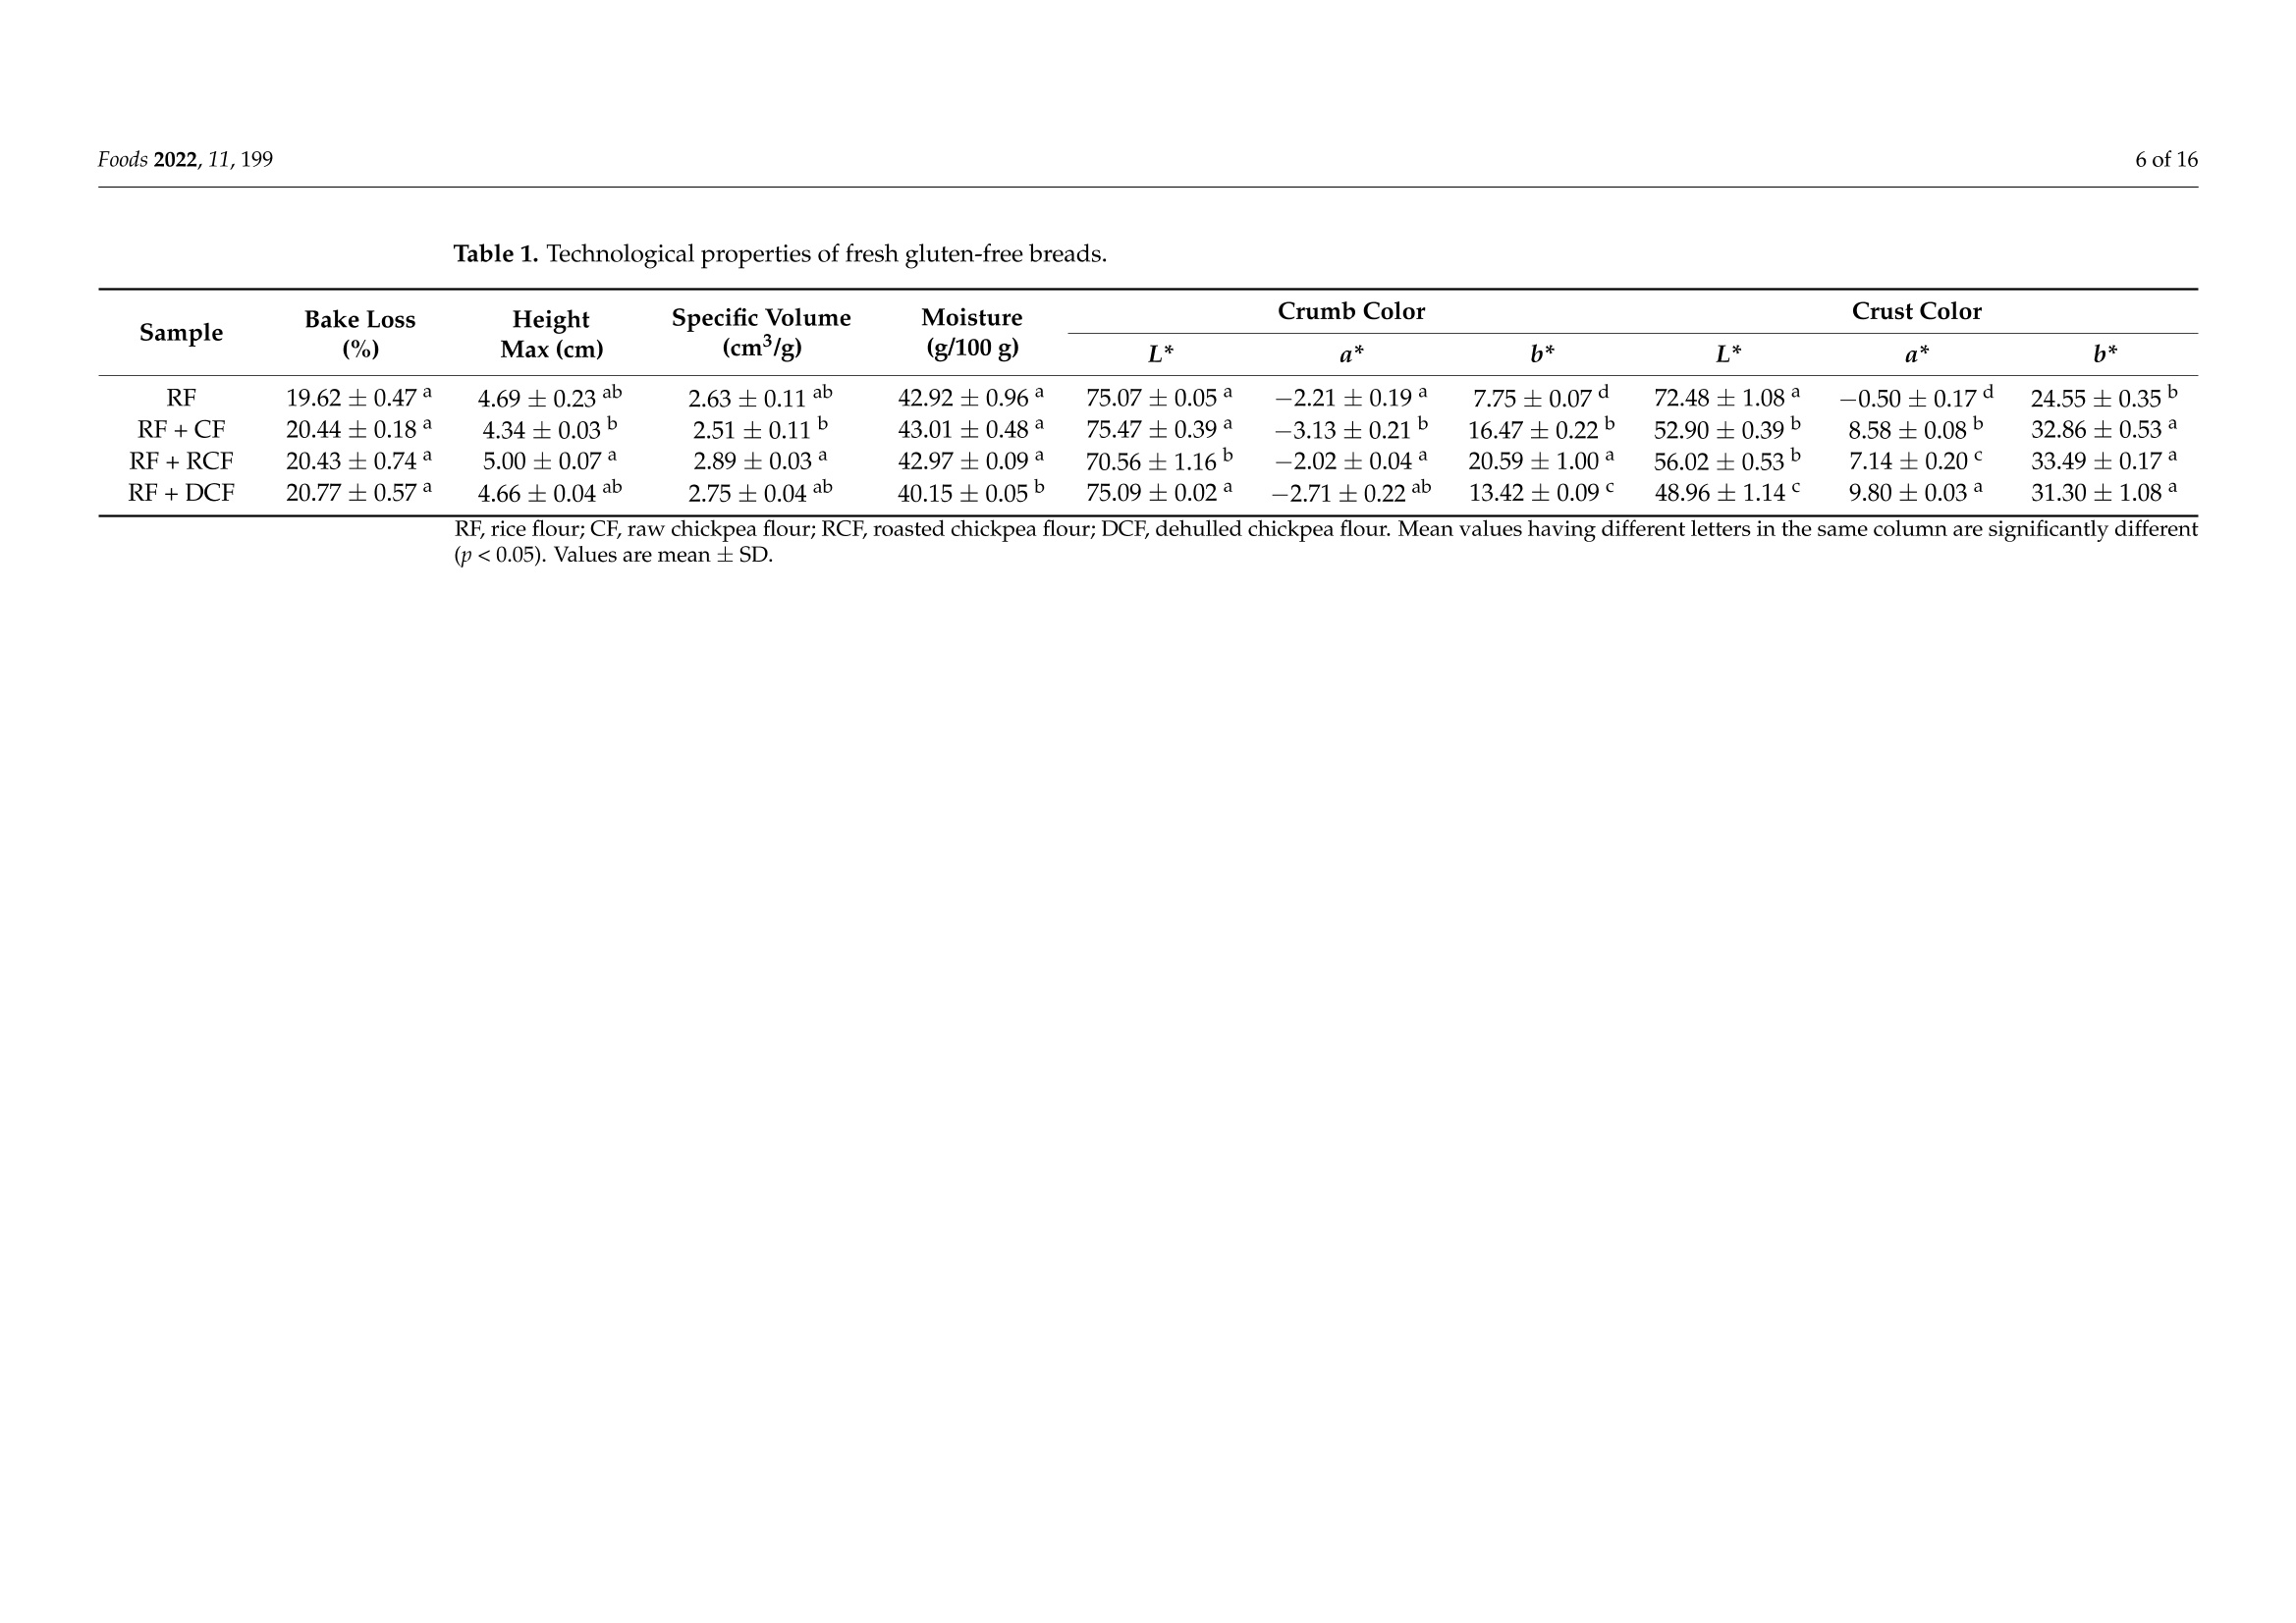
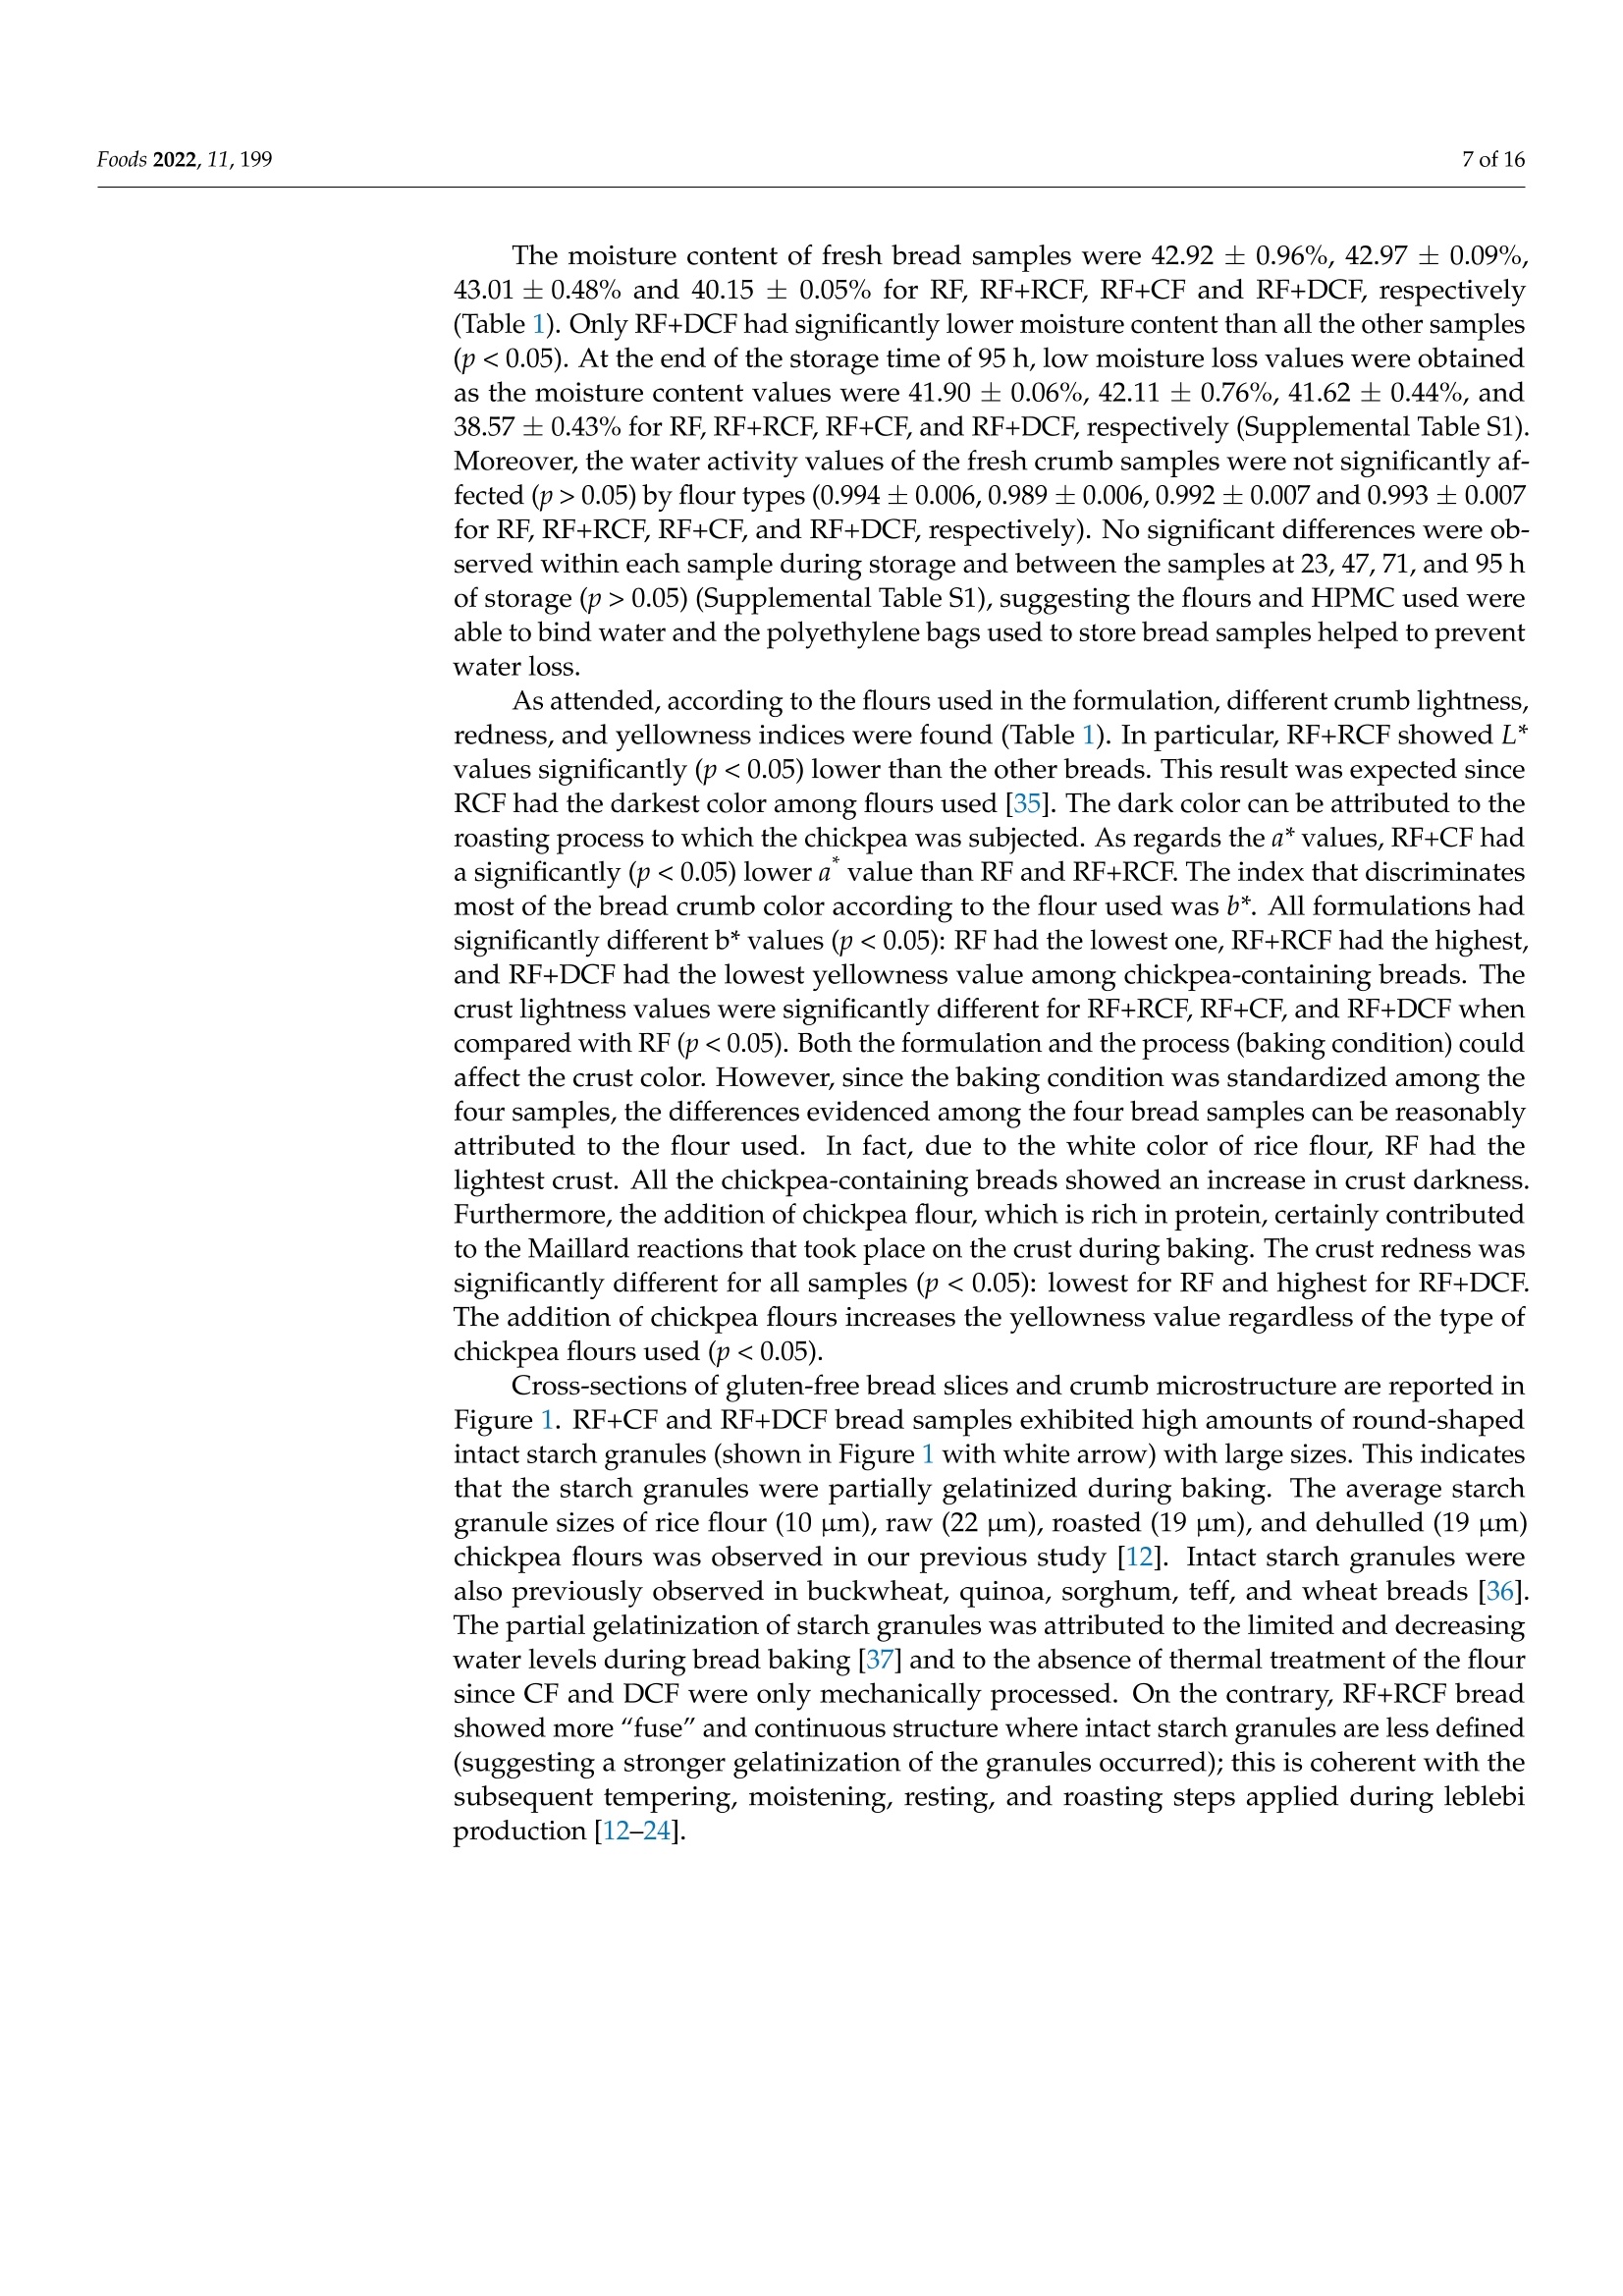
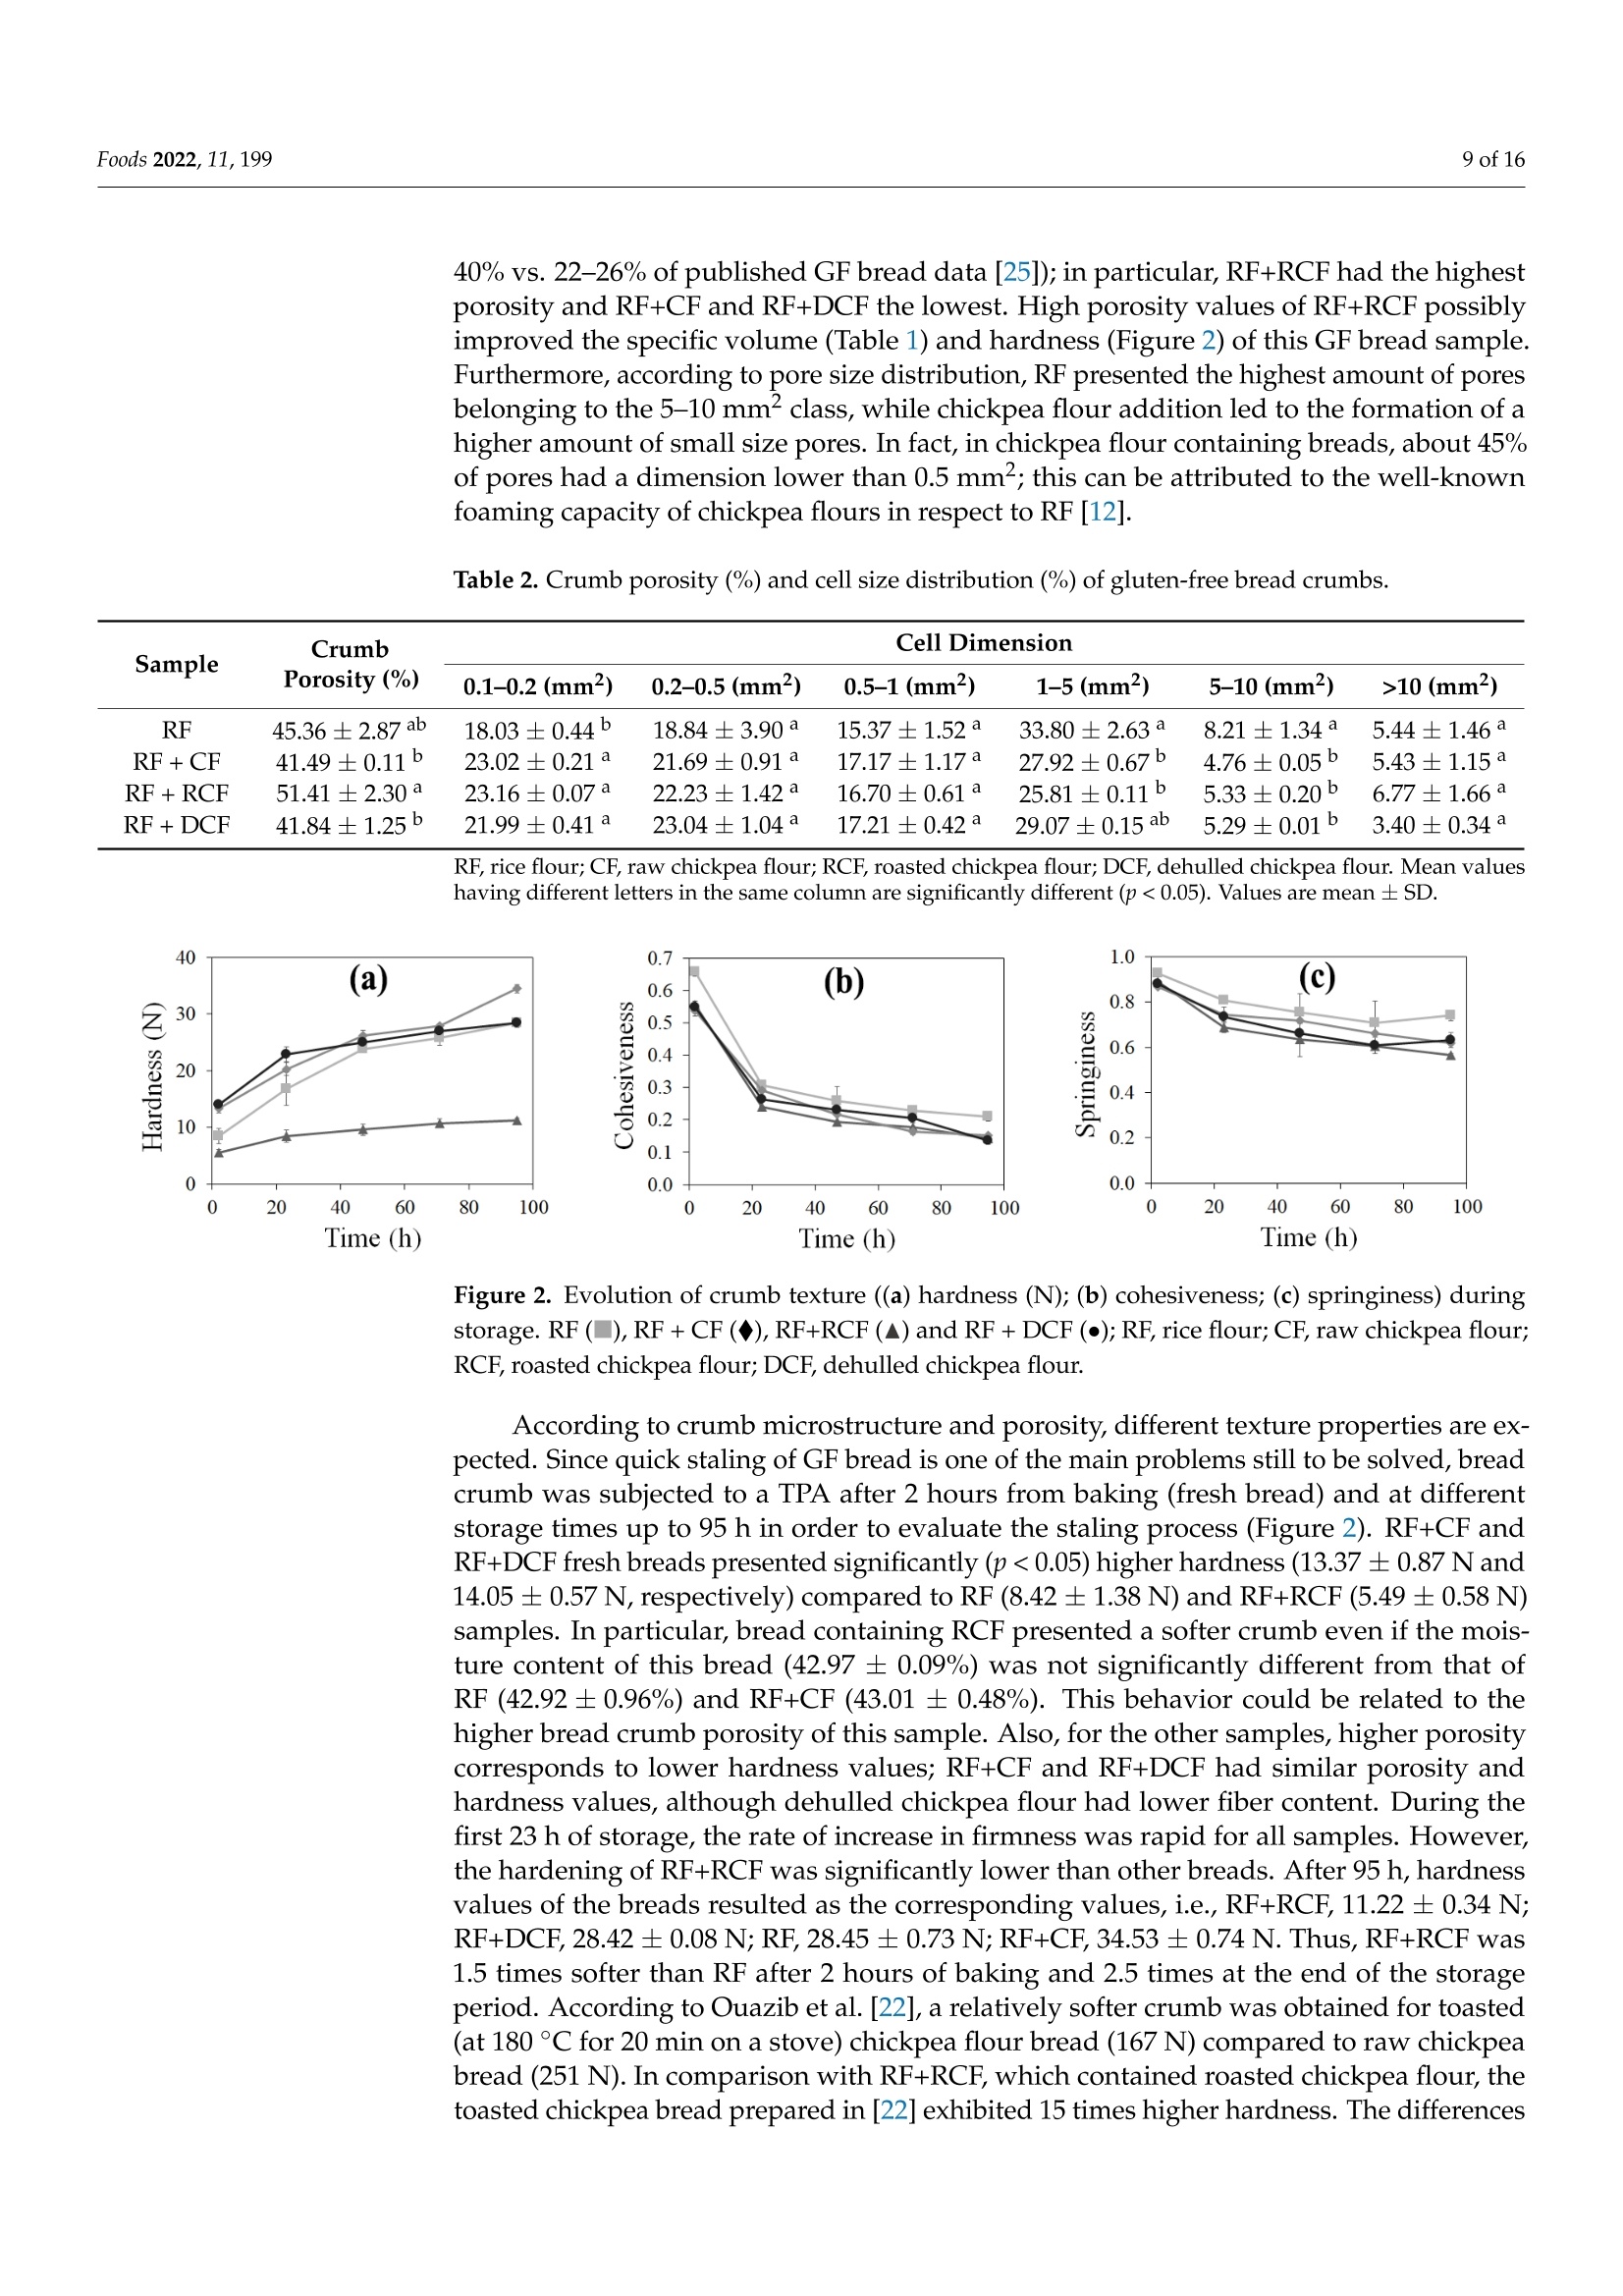
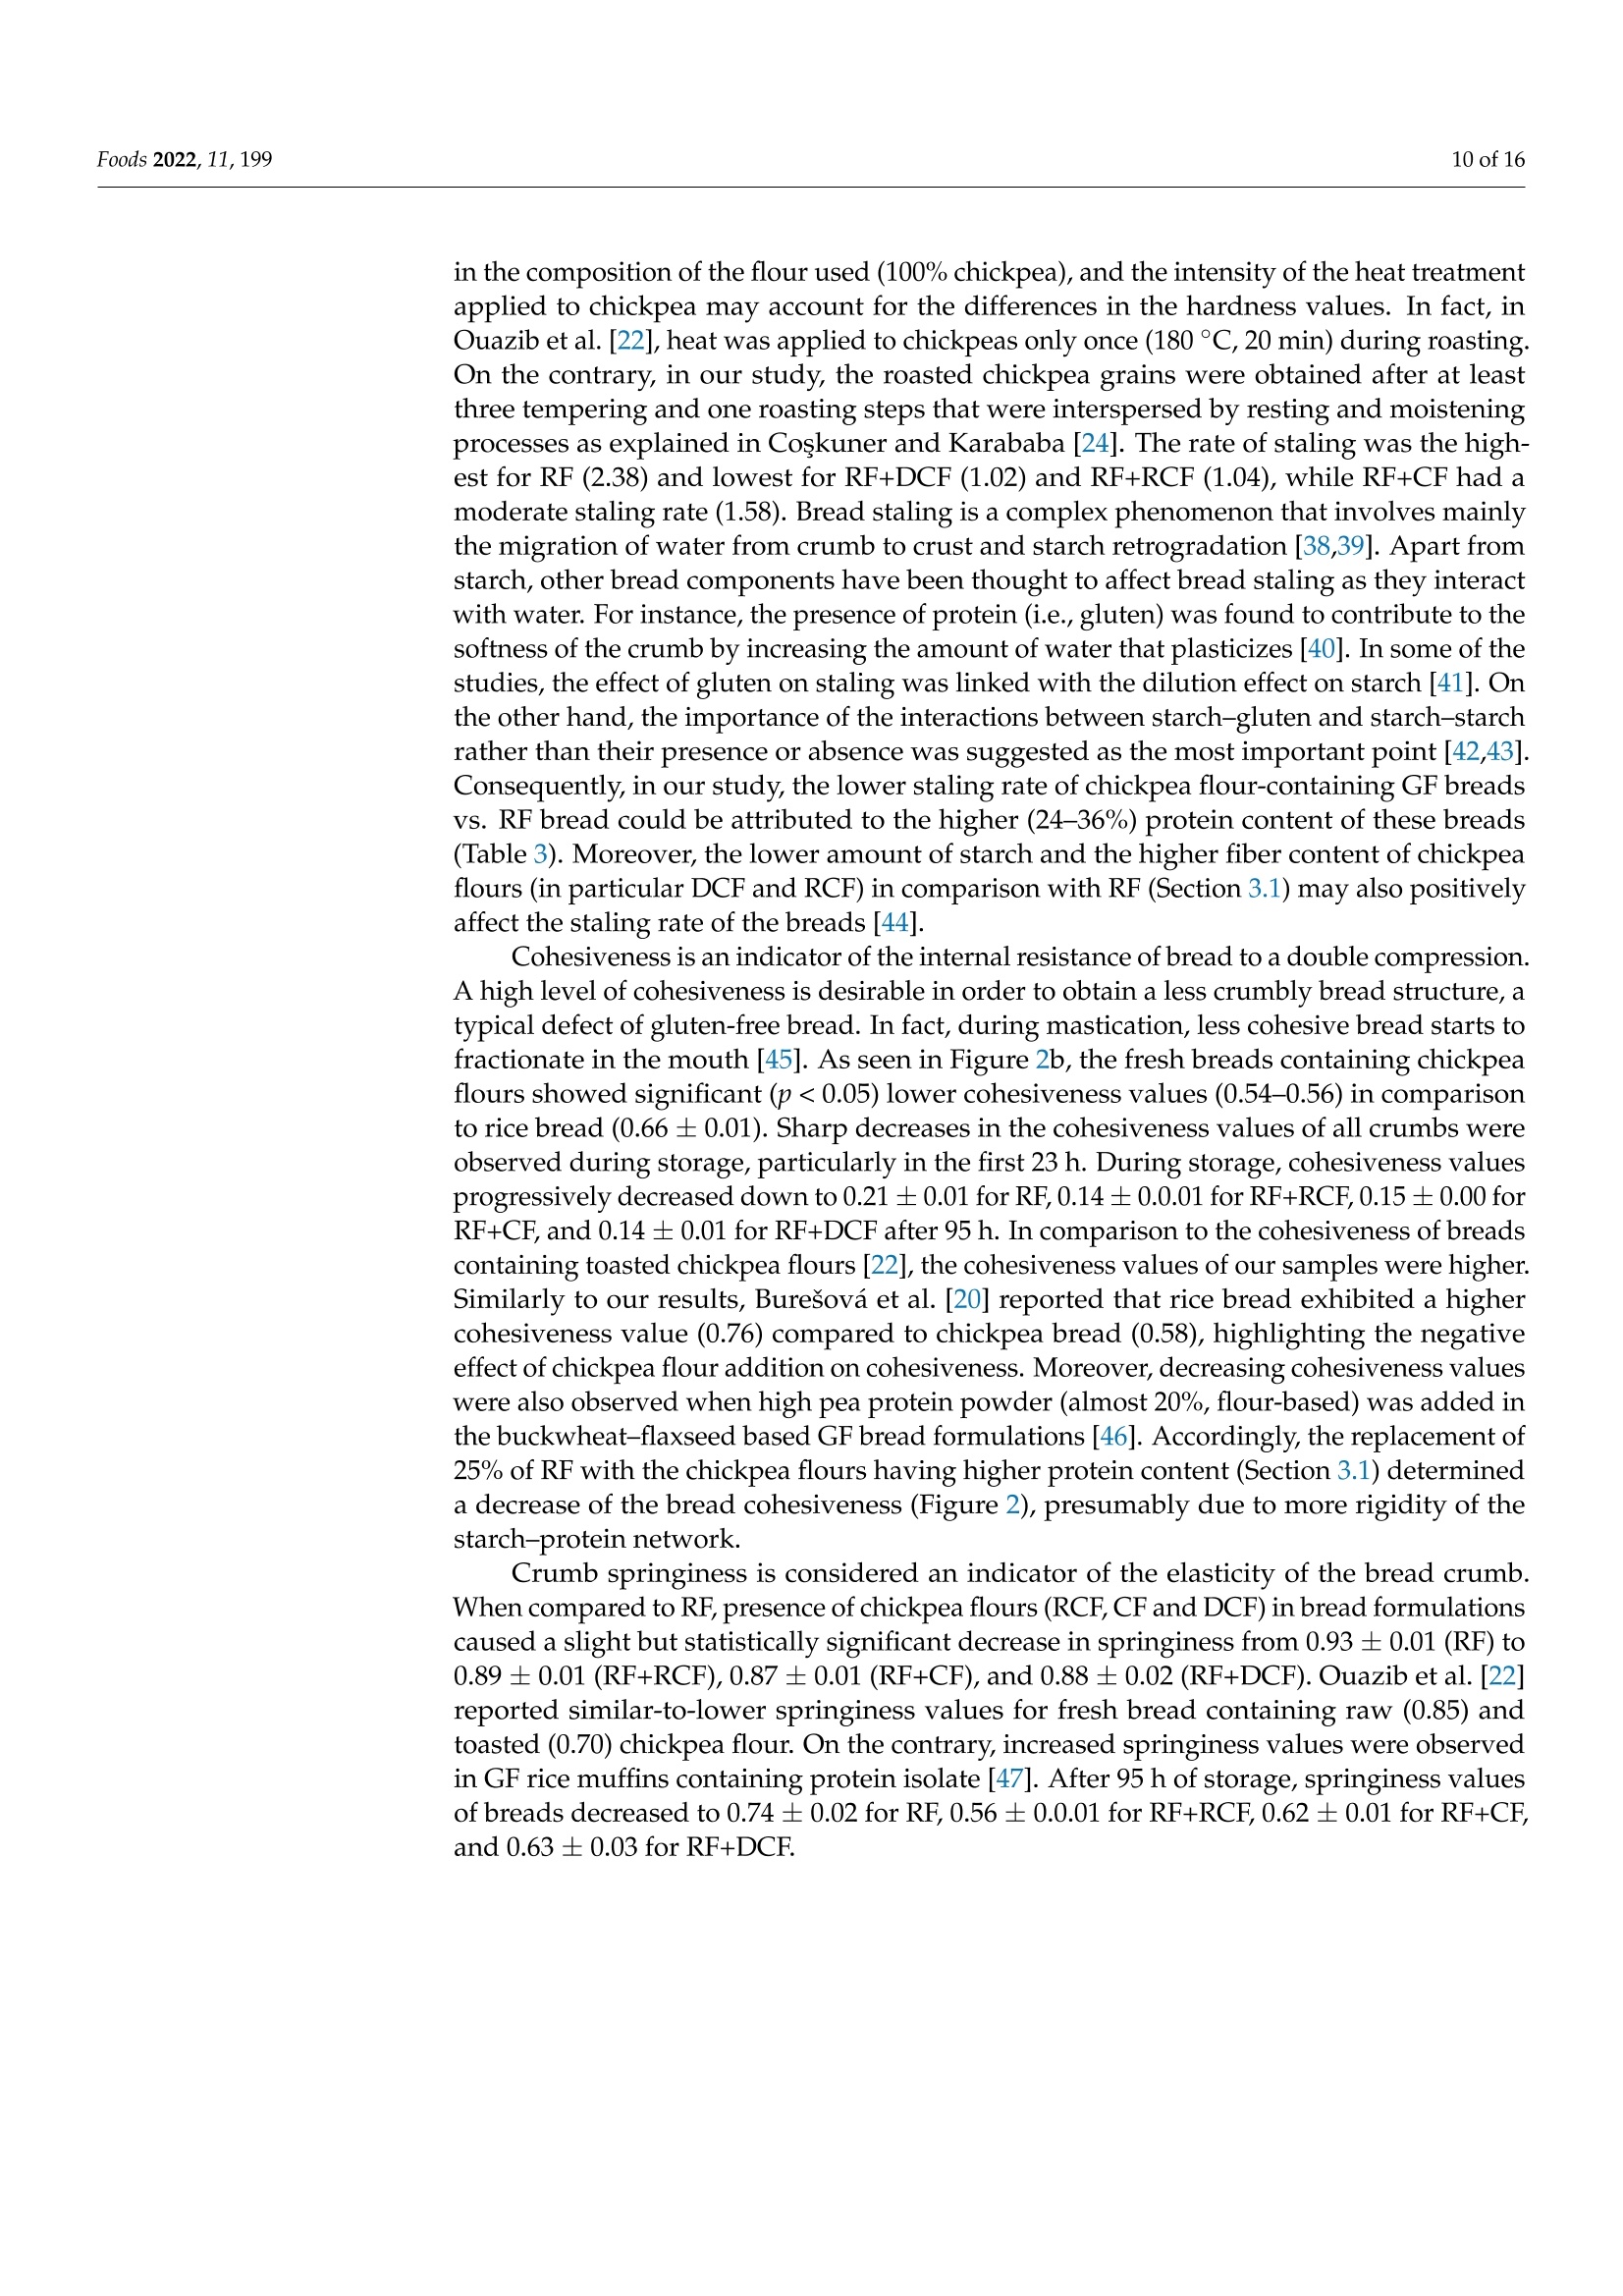
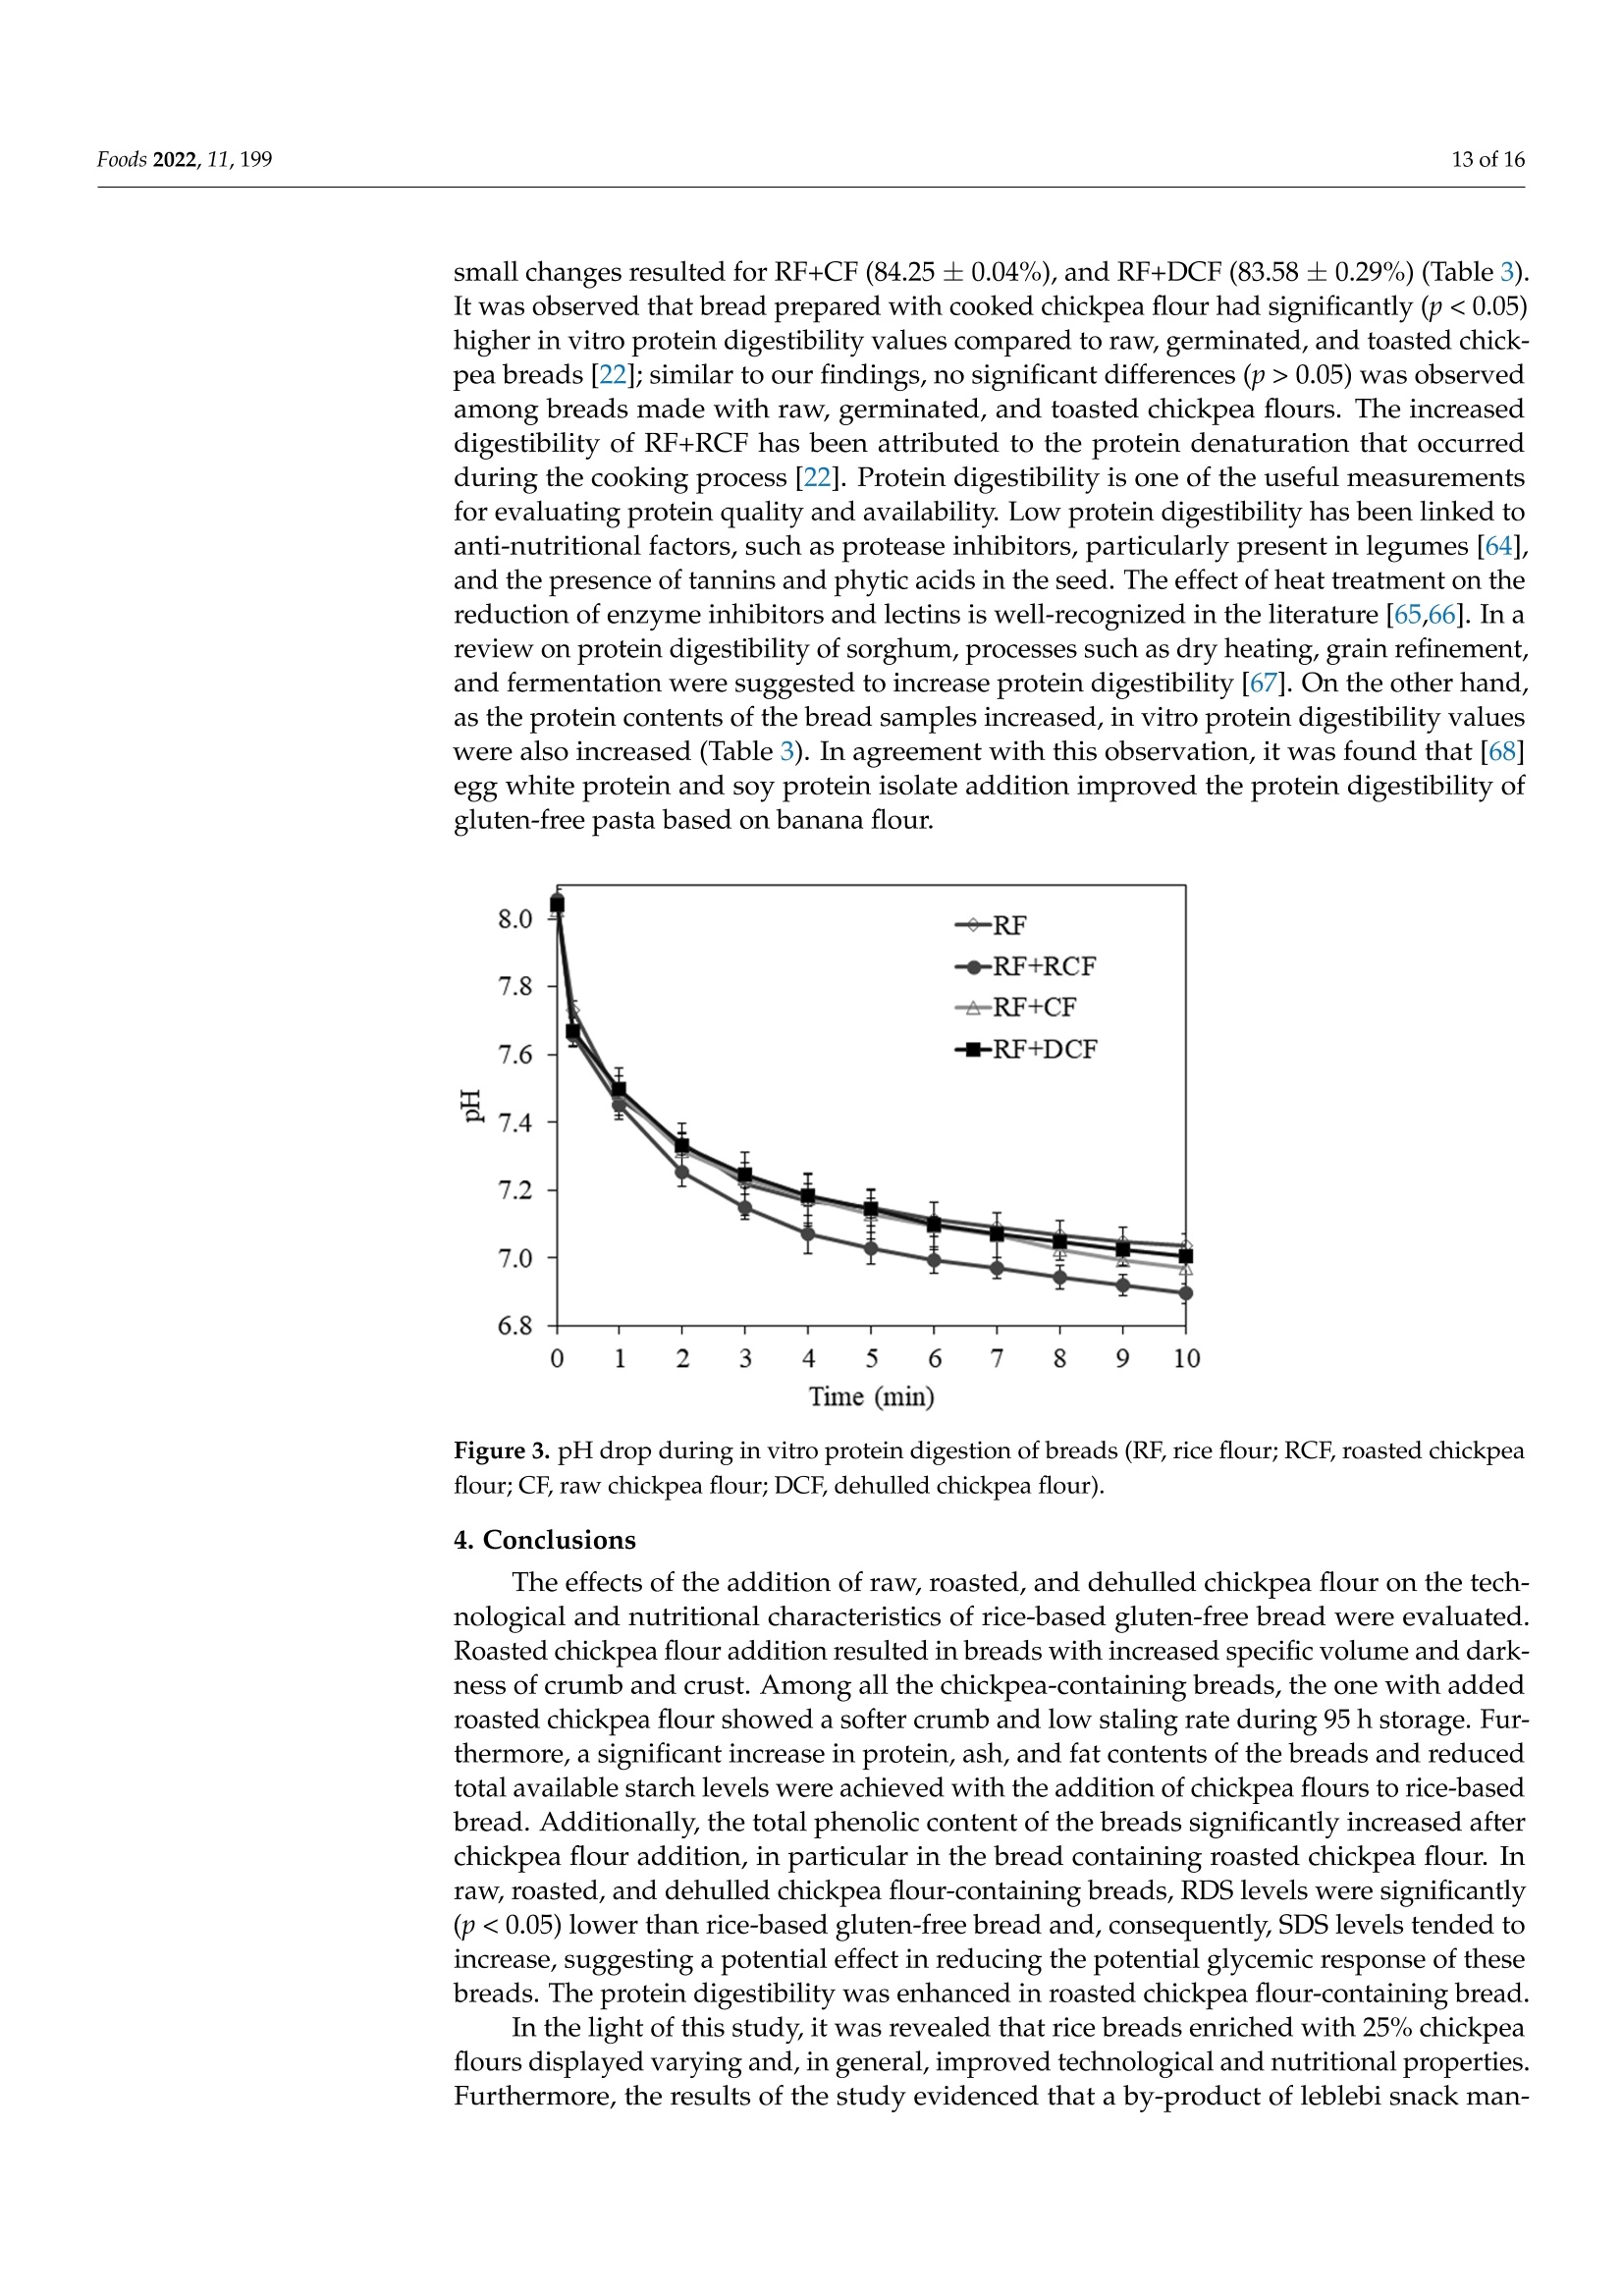
生、烤、脱壳鹰嘴豆粉对无麸质面包工艺及营养特性的影响Impact of Raw, Roasted and Dehulled Chickpea Flours on Technological and Nutritional Characteristics of Gluten-Free Bread.使用格哈特公司蛋白质测定仪和全自动快速脂肪仪检测生、烤、脱壳鹰嘴豆粉无麸质面包蛋白质和脂肪含量OlfoodsMDPI Foods 2022, 11, 1992 of 16 Citation: Kahraman, G.; Harsa, S.; Casiraghi, M.C.; Lucisano, M.; Cappa, C. Impact of Raw, Roasted andDehulled Chickpea Flours onTechnological and NutritionalCharacteristics of Gluten-Free Bread.Foods 2022, 11, 199. https://doi.org/10.3390/foods11020199 Academic Editors: CristinaFernandez-Fraguas and Laura Gazza Received: 29 October 2021 Accepted: 8 January 2022 Published: 12 January 2022 Publisher's Note: MDPI stays neutralwith regard to jurisdictional claims inpublished maps and institutional affil-iations. Copyright: @ 2022 by the authors.Licensee MDPI, Basel, Switzerland.This article is an open access articledistributed under the terms andconditions of the Creative CommonsAttribution (CC BY) license (https://creativecommons.org/licenses/by/4.0/) Impact of Raw, Roasted and Dehulled Chickpea Flours onTechnological and Nutritional Characteristics ofGluten-Free Bread Gokcen Kahraman 1,2D, Sebnem Harsa 1,*, Maria Cristina Casiraghi 2D, Mara Lucisano and Carola Cappa2D 1 Department of Food Engineering, Faculty of Engineering, Izmir Institute of Technology, Izmir 35430, Turkey;gokcenkomen@gmail.com 2 Department of Food, Environmental and Nutritional Sciences (DeFENS), Universita degli Studi di Milano,Via G. Celoria 2, 20133 Milan, Italy; maria.casiraghi@unimi.it (M.C.C.); mara.lucisano@unimi.it (M.L.);carola.cappa@unimi.it (C.C.) Correspondence: sebnemharsa@iyte.edu.tr; Tel.: +90-232-750-6903 Abstract: The main objective of this study was to develop a healthy rice-based gluten-free bread byusing raw, roasted, or dehulled chickpea flours. All breads containing chickpea flours showed adarker crust and were characterized by an alveolar (porosity 41.5-51.4%) and soft crumb (hardness5.5-14.1 N). Roasted chickpea flour bread exhibited the highest specific volume, the softest crumb, andthe slowest staling rate. Enriching rice-based breads with the chickpea flours resulted in increasedprotein (from 9.72 to 12.03-13.21 g/100 g dm), ash (from 2.01 to 2.45-2.78 g/100 g dm), fat (from 1.61to 4.58-5.86 g/100 g), and total phenolic contents (from 49.36 up to 80.52 mg GAE/100 g dm), and inreduced (~10-14% and 13.7-17%, respectively) available starch levels and rapidly digestible starchcompared to rice bread. Breads with roasted chickpea flour also showed the highest in vitro proteindigestibility. The results of this study indicated that the enrichment of rice-based gluten-free breadswith chickpea flours improved the technological and nutritional quality of the breads differentlyaccording to the processed chickpea flour used, also allowing recovery of a waste product. Keywords: gluten-free bread; chickpea; crumb texture; staling; nutritional properties 1. Introduction The market for gluten-free (GF) products is continuously expanding due to the increas-ing number of people who have dietary restrictions caused by celiac disease and non-celiacgluten sensitivity. Nutrient deficiencies are a problem in the GF diet, arising from the lackof protein, dietary fiber, vitamins, and minerals [1-3]. This might be attributed to the largeuse of refined flours and starches, especially in GF baked goods and pasta products [4].Since bread can be considered a staple food for consumers, its fortification could consider-ably affect the nutrient intake of people suffering from gluten-related disorders. To thisend, fortifying bread formulations with legumes could be a promising way to enhancethe nutritional value of GF bread due to their high protein, mineral, and dietary fibercontent [5]. According to legume production statistics for 2018, soybeans, beans, and chickpeasare the most cultivated legumes in the world [6]. India, Australia, Turkey, and the RussianFederation are the top four chickpea producers [6]. Chickpea flour is considered a goodnutrient source, containing 22.39% protein, 57.82% carbohydrate, 10.80% total dietary fiber,and 6.69% fat (rich in polyunsaturated fatty acids), in addition to B complex vitamins andminerals according to the USDA nutrient database [7]. Chickpeas can be consumed in many different ways, boiled, roasted, pressure-cooked,or used as an ingredient in many food formulations after milling. The heat processing ofchickpeas may cause some alterations in the structure, functional properties, and macronu-trient bioavailability [8-10]. Additionally, as a result of roasting and milling, the hulls of the chickpea might be partially and/or completely lost. The removal of the hulls causessome reductions in the levels of mineral and dietary fiber. However, enhanced bioavail-ability of other nutrients can be observed due to the removal of phytic acid and tannins,which are the anti-nutritional factors mainly present in the hulls [11]. In our earlier pub-lication [12], the positive effect of the addition of roasted, dehulled, and raw chickpeaflour to GF dough was demonstrated in terms of enhanced viscoelastic properties andslower retrogradation tendency of the dough. Furthermore, the advantages of addingchickpea flour [13-17] and roasted chickpea flour [18] in breadmaking have been discussedin literature for gluten-containing bread. To date, studies related to the development of yeast-leavened GF bread containingchickpea flour are limited [19-21], and few efforts on the use of untreated and treated (e.g.thermally treated) chickpea flours have been discussed [22,23]. This study investigates the effect of the addition of flours obtained from differentlyprocessed chickpea to a rice-based bread in terms of technological and nutritional quality.Untreated (i.e.,raw), thermally treated (i.e., roasted), and refined (i.e., dehulled) chickpeaswere used. The thermally treated chickpea flour used in this research represents a wasteproduct of leblebi, a chickpea snack widely consumed in Turkey and nearby countries,manufacturing [16,17]. 2. Materials and Methods 2.1. Materials Rice flour (RF;Remyflo R7-200) and dehulled chickpea flour (DCF; Homecraft Pulse4101) were provided by Beneo-Remy NV (Leuven-Wijgmaal, Leuven, Belgium) and Ingre-dion GmbH (Hamburg, Germany), respectively. Raw chickpeas (Yayla, Ankara, Turkey)and leblebi, or roasted chickpeas, (Tugba, Aydin, Turkey) (same chickpea variety as DCF)were obtained from a local Turkish market and milled by a laboratory mill (Yuksel KayaMakina, Ankara, Turkey) to obtain chickpea flour (CF) and roasted chickpea flour (RCF),with >95% of particles below 500 um (measured by an analytical sieve shaker, OctagonDigital, Endecotts Ltd., London, UK), as reported in Kahraman et al. [12]. The roastedchickpeas were obtained after three tempering (preheating and resting) steps, followed bymoistening, resting, and roasting steps, as described in [24]. A structuring and a thickening agent commonly used in GF bread production, hydrox-ypropylmethylcellulose (HPMC, Benecel F4M, Ashland, Covington,KY, USA), was usedin the bread formulations. Instant yeast (Pakmaya, Istanbul, Turkey), sugar (Bal Kiipu,Aksaray, Turkey), salt (Billur, Izmir, Turkey), and sunflower oil (Yudum, Balikesir, Turkey)were the other ingredients used in the GF bread formulations. 2.2. Methods 2.2.1. Flour Characterization Protein, fat, and ash contents of RF and chickpea flours have already been reportedin our previous study [12], while total starch was determined using the “Total StarchAssay Kit" (Megazyme International Ireland Ltd., Bray Business Park, Bray, Co. Wicklow,Ireland). All determinations were performed in triplicate. Since the dietary fiber assay istime-consuming and commercial flours were used, fiber contents were extrapolated directlyfrom the sample data sheet in order to complete the proximate composition of RF andchickpea flours. Furthermore, the flour phenolic compounds were evaluated as reported in Section 2.2.4. 2.2.2. Bread Preparation Ten bread loaves for four different GF bread formulations were prepared. For theGF reference bread (RF bread), the formulation contained only commercial rice flour. Forthe supplemented chickpea breads, 25% of the rice flour was replaced with RCF, CF, orDCF. In addition, the bread dough formulation included HPMC (1.7 g/100 g), sugar(2.0g/100 g), salt (1.5g/100 g), instant yeast (2.5 g/100 g), sunflower oil (5.3 g/100 g),and water (amounts required to reach 125 ±5 Brabender units (BU) as reported by Kahramanet al. [12]). All these percentages were based on flour (RF or RF combined with differentlyprocessed chickpea flour) weight. Dry ingredients were blended in a Hobart N-50 mixer (Hobart Corporation, Troy,OH,USA) equipped with a flat beater for 1 min at 281 rpm. Then, water and oil wereadded and mixed for 2 min at 281 rpm and 3 min at 580 rpm. The obtained dough (150g)was placed in baking pans and proofed in a proofing cabinet (HC0020, Haereus Votsch,Frommern, Germany) at 32 °C and 85% relative humidity (RH) for 30 min. The proofedloaves were placed in a preheated oven (Lotus P4, Treviso, Italy) and baked for 45 min at225°C (top) and 205°C (bottom). The loaves were removed from the pans and cooled atroom temperature for 2 h. The bread samples were stored in polyethylene bags at 20 °℃and 60% RH for 23, 47, 71, and 95 h after baking 2.2.3. Technological Properties of GF Bread Fresh bread was characterized in terms of bake loss (%), moisture (g/100 g; gravimet-rically by drying the sample at 105 °C to constant weight), water activity (CX-2, AquaLab,Pullman, WA, USA), volume (cm) determined by the rapeseed displacement method, andspecific volume (cm/g) calculated as the ratio between bread volume and weight. Theheight (cm) of each loaf was measured using a caliper. Moisture content and water activitywere also analyzed at 23, 47, 71, and 95 h of storage. Crust and crumb color parameters were measured by a colorimeter (Chroma MeterII Reflectance, Minolta, Osaka, Japan) in CIE-Lab color space where L* (Lightness rangedfrom 0 = black to 100 = white), a* (+a, red; -a, green), and b* (+b,yellow;-b, blue). Theillumination system consisted of a high-power pulsed xenon arc lamp, using C illuminant.Before measurements, the colorimeter was calibrated using the standard white reflectorplate (Y=87.7; x=0.308;y=0.315). For each bread formulation, the color of 10 loaveswas evaluated by applying the head of the colorimeter (8 mm in diameter) directly to thesample surface and taking three measurements per loaf (n=30) for both crust and crumb. Crumb microstructure was analyzed with environmental scanning electron microscopy(ESEM; Quanta 250 FEG, FEI, Hillsboro, OR, USA). Samples were cut and attached todouble-sided carbon tapes without any pretreatment. Images were captured at a voltage of10 kV and a pressure of 400 Pa. Crumb porosity was evaluated according to Cappa et al. [25]. Two slices for eachbread formulation were scanned at 600 dpi using a flatbed scanner (HP SCANJET 8300,Hewlett-Packard,CA, USA), selecting a crop area of 80% of the total slice area. Based onthe crumb pore size (0.1≤x<0.2 mm², 0.2≤x<0.5 mm²,0.5≤x<1mm²,1≤x<5mm²,5≤x<10mm²,andx> 10 mmX21²), the pores were classified into 6 groups. For each group,the number and area of the crumb pores were given as the percentage of the total numberand crop area, respectively. The crumb porosity (%; expressed as the total alveolate area ofthe crop divided by the total surface) was determined. The crumb texture of the bread was evaluated by texture profile analysis (TPA) withTA-HDplus (Stable Micro Systems, Surrey, UK) after 2 (fresh bread), 23,47,71, and 95 hfrom baking. The texture analyzer was equipped with a 50 kg load cell and a 25 mmcylinder probe. Bread slices of 25 mm thick were compressed in the center to 40% of theiroriginal height with a test speed of 1 mm/s. Hardness, cohesiveness, and springiness werecalculated using software (Exponent software 6.1.9, Stable Micro Systems, Surrey, UK).Hardness (N) was the maximum peak force obtained in the first compression (SupplementalFigure S1). Springiness was calculated as the ratio of time for second compression (time 4-5)to first compression (time 1-2). Cohesiveness is the property regarding the disintegrationof the tested food under mechanical action, and it is defined as the ratio of the positiveforce area during the second compression (area 4-6) to that during the first compression(area 1-3). At least six slices for each formulation were analyzed. The rate of staling([Hardness95h -Hardness2h]/Hardness2h) was also calculated [26]. 2.2.4. Nutritional Properties of GF Bread The total nitrogen content of bread samples was determined according to the Offi-cial Standard Method AOAC 920.87 [27] by using a block digestion system (Kjeldatherm,Gerhardt, Konigswinter, Germany) and a distillation system (Vapodest 50s, Gerhardt,Konigswinter, Germany). To estimate the protein contents of rice and chickpea-containingbreads, conversion factors of 5.95 and 6.25 were used,respectively. Fat content was mea-sured by an automatic extraction system (Soxtherm, Gerhardt, Konigswinter, Germany) ona 4 g sample with hexane. The ash content was analyzed according to AACC [28] using amuffle furnace (Protherm, Ankara, Turkey). The phenolic compounds were extracted from flour and bread according to Alveset al. [29] with some modifications. Samples (1g) were mixed with acetone (10 mL,70%,v/o)(24201, Riedel-de Haēn, Seelze, Germany), shaken (Reax 2, Heidolph,Schwabach, Germany)for 1 h at 400 rpm in the dark, and centrifuged (Universal 320R, Hettich, Germany) at2860× g, at 20 °℃ for 5 min, and then the supernatant was transferred to another tube; thisprocedure was repeated 3 times, then all the supernatants were combined. Extractions wereperformed in duplicate. The total phenolic content (TPC) of the acetone/water extracts wasdetermined according to Singleton et al. [30] and Sakaě et al. [31] with some modifications.The extract (0.5 mL) was mixed with distilled water (7.5 mL) and Folin-Ciocalteu's reagent(0.5mL) (109001,Merck, Darmstadt, Germany). After 5 min, 1.5 mL of sodium carbonate(13418, Sigma-Aldrich, St. Louis, MO, USA) solution (20%, w/v) was added. The tubes werevortexed, put in a shaker (KS 130 Basic, IKA, Staufen, Germany) in a dark place, and shakenat 480 rpm for 120 min at room temperature. The absorbance values were recorded at760 nm with a spectrophotometer (UV-1601, Shimadzu, Tokyo, Japan). The standard curvewas prepared by using gallic acid (G7384, Sigma, St. Louis,MO, USA), and the results wereexpressed as gallic acid equivalent (GAE) (mg GAE/100 g sample, dry weight). The slowly digestible starch (SDS) and rapidly digestible starch (RDS) of bread sampleswere assessed according to the method described by Englyst et al. [32]. RDS and SDSfractions are likely to become available for rapid or slow absorption from the small intestine,thus modulating glycemic response. Fresh bread samples were minced by using a manualmeat mincer (particle size less than 0.9 cm), and aliquots containing an estimated amount(500-600 mg) of carbohydrates were treated with pepsin from porcine gastric mucosa(≥250 units/mg solid, P7000, Sigma, St. Louis, MO, USA). Then the material was incubatedwith a mixture of pancreatin from porcine pancreas (8 ×USP, P7545, Sigma, St. Louis,MO,USA),amyloglucosidase from Aspergillus niger (A7095, Sigma, St. Louis, MO,USA)and invertase (I4504, Sigma, St. Louis, MO, USA) under controlled conditions of pH,temperature (37℃), viscosity (by adding guar gum) and mechanical mixing (160 rpm) [32].Rapidly (RDS) and slowly (SDS) digestible starch fractions were calculated from the glucosereleased at 20 min and between 20 and 120 min of incubation with the mixture of hydrolyticenzymes, respectively. Glucose was detected by HPLC Anion Exchange Chromatographywith Pulsed Amperometric Detection (HPAEC-PAD) as reported by Englyst et al. [32]. Theglucose contents were measured by High-Performance Liquid Chromatography (HPLC)(Series 200, Perkin Elmer, Norwalk, CT, USA) equipped with 4× 250 mm CarboPacTM PA1column (Dionex, Sunnyvale, CA, USA) and PAD detector (ED50, Dionex, Sunnyvale, CA,USA). The sample (20 uL) was injected into the column at room temperature using NaOH(160 mM) as the mobile phase at a flow rate of 1 mL/min. RDS and SDS fractions wereexpressed as the percentage of available starch (AVST =RDS+SDS). The in vitro protein digestibility (IVPD) of bread samples was determined accordingto Hsu et al. [33] with some modifications. Oven-dried bread samples were ground witha mortar and sieved (≤1 mm) before the analysis. Samples were mixed with water toobtain 6.25 mg crude protein/mL and rehydrated at 4C for 1 h. The pH of the samplemix was adjusted to 8.0, and the temperature was set as 37 ±0.3 °C. Na-p-Tosyl-L-argininemethyl ester hydrochloride (TAME) (T4626, Sigma-Aldrich, St. Louis, MO, USA) was usedas substrate. The trypsin activity of pancreatin (P7545, Sigma, St. Louis, MO, USA) wasmeasured as 7.53 TAME units/mg according to the method described by Minekus et al. [34]. A proper amount of pancreatin (P7545, Sigma, St. Louis, MO, USA) was dissolved in1 mM HCl in order to obtain 13,766 BAEE units/mg protein (1 TAME unit =57.5 BAEE(N-benzoyl-L-arginine ethyl ester) units), and pH was adjusted to 8.0. The enzyme solution(5mL) was added to the sample solution (50 mL), and the pH drop was recorded for 10 min.The pH of the solution immediately after 10 min of digestion with enzyme solution (x) wasused to calculate the percentage of in vitro protein digestibility (Y) by using the equation:Y=210.46-18.10x[33]. 2.2.5. Statistical Analysis The results were given as mean ± SD. If not differently specified, measurementswere done in duplicate on two bread loaves (n= 4). Statistical evaluation of the data wasperformed with MINITAB 16 (Minitab Inc., State College, PA, USA). Data were tested byanalysis of variance (ANOVA) at p<0.05, and means were compared by Tukey's test at a95% confidence interval. 3. Results and Discussion 3.1. Flour Properties Total starch ranged from 40.53 ±0.86 g/100 g dm (CF) to 46.63±0.94g/100gdm(RCF) and 48.51±1.0 g/100 g dm (DCF) for chickpea flours, while it was significantly(p<0.05) higher (82.25±1.48 g/100 g dm) in RF. On the other hand, as reported in ourprevious study [12], chickpea flours showed higher protein (21-23.5 g/100 g dm), fat(5.7-7.6g/100g dm), and ash (2.3-3.1 g/100 g dm) contents than RF (8.29 g/100 g dm,1.3 g/100 g dm, and 0.7 g/100 g dm, respectively). Furthermore, according to the productdatasheet, RF had a very low fiber content as it was obtained by polished rice, while CF,RCF, and DCF had a fiber content of 23, 17-20, and 10 g/100 g, respectively, confirmingthat roasting and dehulling processes partially remove chickpea hulls. 3.2. Technological Properties of Bread Bake loss, height, specific volume, and color of fresh bread are reported in Table 1.RCF, CF, and DCF containing bread formulations had slightly higher bake loss values(p>0.05). Regarding the specific volume, as attended, the RF+CF bread showed a lowervolume than RF bread, presumably due to the presence of fibers (Section 3.1) that somehowinterfered with the protein networking. Accordingly, bread containing RCF that wasthermally treated and processed by partially removing hulls [12] exhibited significantly(p <0.05) higher volumes compared to RF+CF bread; this can also be attributed to thesignificantly (p<0.05) higher gas retention coefficient of RF+RCF dough (98.60 ±0.5%)compared to RF+CF dough (97.70±0.3%) as evaluated with a Chopin RheofermentometerF3 (Chopin, Villeneuve-La-Garenne, Cedex,France) in our previous study [12]. This resultis also in accordance with the findings of Ouazib et al. [22], where breads made with 100%toasted chickpea flours had higher specific loaf volume than breads prepared with raw,germinated, and cooked chickpea flours. Contrary, Buresova et al. [20] found that there wasno significant difference between the specific volumes of rice and chickpea breads, whileAguilar et al. [19] observed only a slight increase in specific volume upon the addition of7.8% chickpea flour to cornstarch-based GF bread formulation. Minarro et al. [21] showedthat chickpea flour added to cornstarch-based GF bread resulted in an enhanced specificvolume that was attributed to the high foam stabilizing capacity of chickpea protein. Thesecontradictory findings reported in literature are mainly due to the different amounts ofchickpea flour added into the formulations and the type of flours in the blend. Table 1. Technological properties of fresh gluten-free breads. Sample Bake Loss (%) Height Max (cm) Specific Volume (cm’/g) Moisture (g/100 g) Crumb Color Crust Color L* a* b* L* a* b* RF 19.62±0.47a 4.69±0.23ab 2.63±0.11ab 42.92±0.96 75.07±0.05a -2.21±0.19a 7.75±0.07d 72.48±1.08= -0.50±0.17 24.55±0.35b RF+ CF 20.44±0.18a 4.34±0.03b 2.51±0.11b 43.01±0.48a 75.47±0.39a -3.13±0.21b 16.47±0.22 52.90±0.39b 8.58±0.08b 32.86±0.53a RF+RCF 20.43±0.744 5.00±0.07a 2.89±0.03 42.97±0.09a 70.56±1.16D -2.02±0.04 20.59±1.00a 56.02±0.53b 7.14±0.20C 33.49±0.17a RF+DCF 20.77±0.57a 4.66±0.04ab 2.75±0.04ab 40.15±0.05b 75.09±0.02a -2.71±0.22ab 13.42±0.09℃ 48.96±1.14° 9.80±0.03a 31.30±1.08a RF, rice flour; CF, raw chickpea flour; RCF, roasted chickpea flour; DCF, dehulled chickpea flour. Mean values having different letters in the same column are significantly different(p<0.05). Values are mean ± SD. The moisture content of fresh bread samples were 42.92 ±0.96%,42.97±0.09%,43.01±0.48% and 40.15±0.05% for RF, RF+RCF, RF+CF and RF+DCF, respectively(Table 1). Only RF+DCF had significantly lower moisture content than all the other samples(p<0.05). At the end of the storage time of 95 h, low moisture loss values were obtainedas the moisture content values were 41.90 ±0.06%,42.11±0.76%,41.62±0.44%, and38.57 ±0.43% for RF,RF+RCF, RF+CF, and RF+DCF, respectively (Supplemental Table S1).Moreover, the water activity values of the fresh crumb samples were not significantly af-fected (p>0.05) by flour types (0.994 ±0.006,0.989±0.006,0.992±0.007 and 0.993 ±0.007for RF, RF+RCF, RF+CF, and RF+DCF, respectively). No significant differences were ob-served within each sample during storage and between the samples at 23, 47, 71, and 95 hof storage (p >0.05) (Supplemental Table S1), suggesting the flours and HPMC used wereable to bind water and the polyethylene bags used to store bread samples helped to preventwater loss. As attended, according to the flours used in the formulation, different crumb lightness,redness, and yellowness indices were found (Table 1). In particular, RF+RCF showed L*values significantly (p<0.05) lower than the other breads. This result was expected sinceRCF had the darkest color among flours used [35]. The dark color can be attributed to theroasting process to which the chickpea was subjected. As regards the a* values, RF+CF hada significantly (p<0.05)lower a value than RF and RF+RCF. The index that discriminatesmost of the bread crumb color according to the flour used was b*. All formulations hadsignificantly different b* values (p<0.05): RF had the lowest one, RF+RCF had the highest,and RF+DCF had the lowest yellowness value among chickpea-containing breads. Thecrust lightness values were significantly different for RF+RCF, RF+CF,and RF+DCF whencompared with RF (p<0.05). Both the formulation and the process (baking condition) couldaffect the crust color. However, since the baking condition was standardized among thefour samples, the differences evidenced among the four bread samples can be reasonablyattributed to the flour used. In fact, due to the white color of rice flour, RF had thelightest crust. All the chickpea-containing breads showed an increase in crust darkness.Furthermore, the addition of chickpea flour, which is rich in protein, certainly contributedto the Maillard reactions that took place on the crust during baking. The crust redness wassignificantly different for all samples (p<0.05): lowest for RF and highest for RF+DCF.The addition of chickpea flours increases the yellowness value regardless of the type ofchickpea flours used (p<0.05). IYTEMAM Figure 1. Crumb microstructure (Magnification ×2000) and cross-section of gluten-free bread (RF,rice flour; RCF, roasted chickpea flour; CF, raw chickpea flour; DCF, dehulled chickpea flour). Thestarch granules are shown with a white arrow. The differences evidenced by ESEM were also reflected at the macroscopic level. Infact, different crumb porosity and pore distribution (Figure 1 and Table 2, respectively)were evidenced through image analysis. All breads exhibited high porosity values (above 40% vs. 22-26% of published GF bread data [25]); in particular, RF+RCF had the highestporosity and RF+CF and RF+DCF the lowest. High porosity values of RF+RCF possiblyimproved the specific volume (Table 1) and hardness (Figure 2) of this GF bread sample.Furthermore, according to pore size distribution, RF presented the highest amount of poresbelonging to the 5-10 mm² class, while chickpea flour addition led to the formation of ahigher amount of small size pores. In fact, in chickpea flour containing breads, about 45%of pores had a dimension lower than 0.5 mm²; this can be attributed to the well-knownfoaming capacity of chickpea flours in respect to RF [12]. Table 2. Crumb porosity (%) and cell size distribution (%) of gluten-free bread crumbs. Sample Crumb Porosity (%) Cell Dimension 0.1-0.2(mm²) 0.2-0.5(mm²) 0.5-1(mm²) 1-5(mm²) 5-10(mm²) >10(mm²) RF 45.36±2.87ab 18.03±0.44 18.84±3.90a 15.37±1.52a 33.80±2.63a 8.21±1.34a 5.44±1.46a RF+ CF 41.49±0.11b 23.02±0.21a 21.69±0.91a 17.17±1.17a 27.92±0.67b 4.76±0.05b 5.43±1.15a RF+ RCF 51.41±2.30a 23.16±0.07a 22.23±1.42a 16.70±0.61a 25.81±0.11D 5.33±0.20D 6.77±1.66a RF+DCF 41.84±1.25b 21.99±0.41a 23.04±1.04a 17.21±0.42a 29.07±0.15ab 5.29±0.01D 3.40±0.34a RF, rice flour; CF, raw chickpea flour; RCF, roasted chickpea flour; DCF, dehulled chickpea flour. Mean valueshaving different letters in the same column are significantly different (p <0.05). Values are mean ± SD. Time (h) Figure 2. Evolution of crumb texture ((a) hardness (N); (b) cohesiveness; (c) springiness) duringstorage. RF (),RF+CF (◆),RF+RCF() and RF+ DCF();RF, rice flour; CF, raw chickpea flour;RCF, roasted chickpea flour;DCF, dehulled chickpea flour. in the composition of the flour used (100% chickpea), and the intensity of the heat treatmentapplied to chickpea may account for the differences in the hardness values. In fact, inOuazib et al. [22], heat was applied to chickpeas only once (180°℃, 20 min) during roasting.On the contrary, in our study, the roasted chickpea grains were obtained after at leastthree tempering and one roasting steps that were interspersed by resting and moisteningprocesses as explained in Coskuner and Karababa [24]. The rate of staling was the high-est for RF (2.38) and lowest for RF+DCF (1.02) and RF+RCF (1.04), while RF+CF had amoderate staling rate (1.58). Bread staling is a complex phenomenon that involves mainlythe migration of water from crumb to crust and starch retrogradation [38,39]. Apart fromstarch, other bread components have been thought to affect bread staling as they interactwith water. For instance, the presence of protein (i.e., gluten) was found to contribute to thesoftness of the crumb by increasing the amount of water that plasticizes [40]. In some of thestudies, the effect of gluten on staling was linked with the dilution effect on starch [41]. Onthe other hand, the importance of the interactions between starch-gluten and starch-starchrather than their presence or absence was suggested as the most important point [42,43].Consequently, in our study, the lower staling rate of chickpea flour-containing GF breadsvs. RF bread could be attributed to the higher (24-36%) protein content of these breads(Table 3). Moreover, the lower amount of starch and the higher fiber content of chickpeaflours (in particular DCF and RCF) in comparison with RF (Section 3.1) may also positivelyaffect the staling rate of the breads [44]. Cohesiveness is an indicator of the internal resistance of bread to a double compression.A high level of cohesiveness is desirable in order to obtain a less crumbly bread structure, atypical defect of gluten-free bread. In fact, during mastication, less cohesive bread starts tofractionate in the mouth [45]. As seen in Figure 2b, the fresh breads containing chickpeaflours showed significant (p<0.05) lower cohesiveness values (0.54-0.56) in comparisonto rice bread (0.66±0.01). Sharp decreases in the cohesiveness values of all crumbs wereobserved during storage, particularly in the first 23 h. During storage, cohesiveness valuesprogressively decreased down to 0.21 ± 0.01 for RF, 0.14 ±0.0.01 for RF+RCF, 0.15 ±0.00 forRF+CF,and 0.14±0.01 for RF+DCF after 95 h. In comparison to the cohesiveness of breadscontaining toasted chickpea flours [22], the cohesiveness values of our samples were higher.Similarly to our results, Buresova et al. [20] reported that rice bread exhibited a highercohesiveness value (0.76) compared to chickpea bread (0.58), highlighting the negativeeffect of chickpea flour addition on cohesiveness. Moreover, decreasing cohesiveness valueswere also observed when high pea protein powder (almost 20%, flour-based) was added inthe buckwheat-flaxseed based GF bread formulations [46]. Accordingly, the replacement of25% of RF with the chickpea flours having higher protein content (Section 3.1) determineda decrease of the bread cohesiveness (Figure 2), presumably due to more rigidity of thestarch-protein network. Crumb springiness is considered an indicator of the elasticity of the bread crumb.When compared to RF, presence of chickpea flours (RCF, CF and DCF) in bread formulationscaused a slight but statistically significant decrease in springiness from 0.93 ± 0.01 (RF) to0.89 ±0.01 (RF+RCF), 0.87 ±0.01 (RF+CF), and 0.88 ±0.02 (RF+DCF). Ouazib et al. [22]reported similar-to-lower springiness values for fresh bread containing raw (0.85) andtoasted (0.70) chickpea flour. On the contrary, increased springiness values were observedin GF rice muffins containing protein isolate [47]. After 95 h of storage, springiness valuesof breads decreased to 0.74± 0.02 for RF, 0.56 ±0.0.01 for RF+RCF,0.62±0.01 for RF+CF,and 0.63 ±0.03 for RF+DCF. Table 3. Nutritional properties of gluten-free breads. Bread Protein (g/100g dm) Fat (g/100g dm) Ash (g/100g dm) TPC (mg GAE/100g dm) RDS (g/100 g dm) SDS (g/100 g dm) Total Available Starch (g/100 g dm) %RDS (g/100 g Available Starch) %SDS (g/100 g Available Starch) IVPD (%) RF 9.72±0.08b 1.61±0.38° 2.01±0.03D 49.36±2.47℃ 81.04±0.31a 5.90±0.62 bc 86.94±0.60a 93.2±0.7a 6.8±0.7℃ 83.07±0.64b84.25±0.04ab RF+ CF 13.02±0.14a 4.78±0.10b 2.78±0.09a 65.29±2.25b 68.81±0.96D 6.98±0.49b 75.79±0.90° 90.8±0.7b 9.2±0.7b RF+RCF 13.21±0.03a 4.58±0.07b 2.45±0.01ab 80.52±5.13a 69.87±0.61b 5.33±0.60° 75.20±0.59C 92.9±0.8ab 7.1±0.8° 85.57±0.52a RF+ DCF 12.03±0.71a 5.86±0.16a 2.63±0.21a 71.87±2.05ab 67.29±1.63b 11.14±0.43a 78.43±1.29b 85.8±0.7℃ 14.2±0.7a 83.58±0.29D RF, rice flour; CF, raw chickpea flour; RCF, roasted chickpea flour; DCF, dehulled chickpea flour; TPC, total phenolic content; RDS, rapidly digestible starch; SDS, slowly digestible starch;total available starch (RDS+SDS); IVPD, in vitro protein digestibility; dm, dry matter. Means having different letters at the same column are significantly different (p<0.05). Values aremean ± SD. 3.3. Nutritional Properties of Bread The composition of breads is shown in Table 3 together with the results of rapidly(RDS) and slowly (SDS) digestible starch fractions. The substitution of 25% of rice flourwith differently processed chickpeas flours increased the protein content by 33.9% (CF),35.9% (RCF), and 23.7%(DCF). Moreover, a significant (p <0.05) increase in the amount offat and phenolic compounds was noticed in chickpea breads when compared to rice flourbread. The TPC of flour samples were 44.55 ± 4.94 mg GAE/100 g dm for rice flour,119.63±0.85,118.32±3.56, and 115.98 ±4.52 mg GAE/100 g dm for roasted, raw,and dehulled chickpea flour, respectively. These results were close to the values inliterature where TPC contents of commercial raw chickpea samples were reported as141±8 mg GAE/100 g [48] and 157±6-147±7 mg GAE/100 g dm [49]. In comparisonto rice flour, chickpea flours had significantly higher (p <0.05) TPC values regardless ofthe type of processing applied. However, no significant change (p >0.05) was observedamong the raw, roasted, and dehulled chickpea flours. Unlike our findings, Fares andMenga [50] reported a significant increase in TPC after toasting chickpea flour, whichwas attributed to the compounds such as Amadori and Heyns products formed duringtoasting. Toasting also increased the TPC of buckwheat grains [51]. The TPC valuesof RF+RCF, RF+CF, and RF+DCF breads were significantly different (p<0.05) than RF(Table 3): RF had the lowest TPC (49.36 ±2.47 mg GAE/100 g dm), followed by RF+CF(65.29±2.25 mg GAE/100 g dm), RF+DCF (71.87±2.05 mg GAE/100 g dm) and RF+RCF(80.52 ±5.13 mg GAE/100 g dm). When the TPC contents of chickpea flour-containingbreads were compared, the TPC content of RF+RCF bread was significantly (p<0.05) higherthan RF+CF bread. The total available starch levels were significantly higher for RF (86.94±0.60 g/100 g dm)when compared to chickpea flour-containing breads (p<0.05). Among the chickpea con-taining breads, RF+CF (75.79 ±0.90 g/100 g dm) and RF+RCF (75.20±0.59 g/100g dm)had significantly lower available starch contents than RF+DCF (78.43±1.29 g/100 g dm)(p<0.05). These values were in accordance with Gularte et al. [52]. RDS and SDS are indicative of high and low glycemic responses, and so as high andlow glycemic index, respectively [53]. The Glycemic index (GI) term is used to evaluatethe blood glucose response of foods. According to GI values, foods are classified as low(<55), medium (55-69), or high (>70) GI foods [54]. The nature of starch, monosaccharidecomponents, food processing, heat treatment/cooking, and food components such as fatand protein play an important role in the GI [55]. In our study, significant differences indigestible starch fractions were observed between bread samples. In particular, all thedifferently treated chickpea containing bread samples (RF+CF, RF+RCF, and RF+DCF)had significantly (p<0.05) lower RDS fractions than those determined in RF. The possibleexplanation for this might be the presence of dietary fiber in chickpea flours and thehigher amylose content of chickpea starches (30-35% on average) [56-58] compared torice flour (26.2 g/100 g dm) [44]. Interestingly, when compared to RF, only RF+DCF hada significantly (p<0.05) higher SDS fraction; this feature may be of interest from thenutritional point of view since it could reduce the glycemic potential [59] of the bread.Wolter et al. [60] reported a key role of factors such as the size of starch granules, degreeof gelatinization, starch composition, protein, and lipid content/interactions in affectingthe starch digestibility of bread. The relatively high SDS content in DCF containing breadmight be related to the presence of intact starch granules in breads (Figure 1). Indeed, theglycemic response appears to be directly related to the amount of RDS, and the insulindemand is inversely correlated to the SDS fraction [61]. In general, RDS represents theprevailing fraction in GF products [52,62]. Figure 3 reports pH drop caused by the increase in H+ ions due to the breakdownof peptide bonds and formation of free carboxyl groups of amino acids [63] duringin vitro protein digestion of breads. An improved digestibility for roasted chickpea bread(85.57±0.52%;p<0.05) in comparison with RF (83.07 ±0.64%) was observed, while only small changes resulted for RF+CF (84.25±0.04%), and RF+DCF (83.58±0.29%) (Table 3).It was observed that bread prepared with cooked chickpea flour had significantly (p<0.05)higher in vitro protein digestibility values compared to raw, germinated, and toasted chick-pea breads [22]; similar to our findings, no significant differences (p >0.05) was observedamong breads made with raw, germinated, and toasted chickpea flours. The increaseddigestibility of RF+RCF has been attributed to the protein denaturation that occurredduring the cooking process [22]. Protein digestibility is one of the useful measurementsfor evaluating protein quality and availability. Low protein digestibility has been linked toanti-nutritional factors, such as protease inhibitors, particularly present in legumes [64],and the presence of tannins and phytic acids in the seed. The effect of heat treatment on thereduction of enzyme inhibitors and lectins is well-recognized in the literature [65,66].In areview on protein digestibility of sorghum, processes such as dry heating, grain refinement,and fermentation were suggested to increase protein digestibility [67]. On the other hand,as the protein contents of the bread samples increased, in vitro protein digestibility valueswere also increased (Table 3). In agreement with this observation, it was found that [68]egg white protein and soy protein isolate addition improved the protein digestibility ofgluten-free pasta based on banana flour. Figure 3. pH drop during in vitro protein digestion of breads (RF, rice flour; RCF, roasted chickpeaflour; CF, raw chickpea flour; DCF, dehulled chickpea flour). 4. Conclusions The effects of the addition of raw, roasted, and dehulled chickpea flour on the tech-nological and nutritional characteristics of rice-based gluten-free bread were evaluated.Roasted chickpea flour addition resulted in breads with increased specific volume and dark-ness of crumb and crust. Among all the chickpea-containing breads, the one with addedroasted chickpea flour showed a softer crumb and low staling rate during 95 h storage. Fur-thermore, a significant increase in protein, ash, and fat contents of the breads and reducedtotal available starch levels were achieved with the addition of chickpea flours to rice-basedbread. Additionally, the total phenolic content of the breads significantly increased afterchickpea flour addition, in particular in the bread containing roasted chickpea flour. Inraw, roasted, and dehulled chickpea flour-containing breads, RDS levels were significantly(p <0.05) lower than rice-based gluten-free bread and, consequently, SDS levels tended toincrease, suggesting a potential effect in reducing the potential glycemic response of thesebreads. The protein digestibility was enhanced in roasted chickpea flour-containing bread. In the light of this study, it was revealed that rice breads enriched with 25% chickpeaflours displayed varying and, in general, improved technological and nutritional properties.Furthermore, the results of the study evidenced that a by-product of leblebi snack man- ufacturing (i.e.,RCF) can be successfully valorized in GF bread formulations as a cheap,sustainable, and nutritious ingredient. Supplementary Materials: The following are available online at https://www.mdpi.com/article/10.3390/foods11020199/s1, Figure S1: Representative force (g) versus time (s) curve of TPA; Table S1:Changes in moisture content (g/100g) and water activity of breads during 95 hours of storage. Author Contributions: Conceptualization, G.K., S.H., M.C.C., M.L. and C.C.; Data curation, G.K.,S.H., M.C.C., M.L. and C.C.; Formal analysis, G.K., M.C.C. and C.C.; Investigation, G.K., M.C.C. andC.C.; Project administration, S.H. and M.L.; Resources, S.H., M.L. and C.C.; Supervision, S.H., M.C.C.,M.L. and C.C.; Writing-original draft,G.K., M.C.C. and C.C.; Writing-review & editing, G.K., S.H.,M.C.C., M.L. and C.C. All authors have read and agreed to the published version of the manuscript. Funding: This research received no external funding. Institutional Review Board Statement: Not applicable Informed Consent Statement: Not applicable. Data Availability Statement: The datasets generated for this study are available on request to thecorresponding author. Acknowledgments: The authors would like to thank the Izmir Institu te of Technology, Biotech-nology, and Bioengineering Research and Application Center (BIOMER), and Center for MaterialResearch (CMR) for providing their facilities for raw material analysis and microscopic analysis,respectively. The authors would like to thank Giovanni Fiorillo, Elisabetta La Gala and AgostinaMoles (Department of Food, Environmental and Nutritional Sciences, Universita degli Studi diMilano) for their assistance during RDS, SDS and total starch determinations, and Universita degliStudi di Milano, for partially covering the open-access APC (Article processing charge). Conflicts of Interest: The authors declare no conflict of interest. The funders had no role in the designof the study; in the collection, analyses, or interpretation of data; in the writing of the manuscript, orin the decision to publish the results. References 1. Hallert, C.;Grant, C.;Grehn, S.; Granno, C.; Hulten, S.; Midhagen, G.; Strom, M.;Svensson, H.; Valdimarsson, T. Evidence of poorvitamin status in coeliac patients on a gluten-free diet for 10 years. Aliment. Pharmacol. Ther. 2002, 16, 1333-1339. [CrossRef][PubMed] 2. Mariani, P.; Viti, M.; Montuori, M.; La Vecchia, A.; Cipolletta, E.; Calvani, L.; Bonamico, M. The gluten-free diet: A nutritional riskfactor for adolescents with celiac disease? J. Pediatr. Gastroenterol. Nutr. 1998,27,519-523. [CrossRef] 3Thompson, T. Folate, iron, and dietary fiber contents of the gluten-free diet. J. Am. Diet. Assoc. 2000,100,1389-1396.[CrossRef]45 Saturni, L.; Ferretti, G.; Bacchetti, T. The Gluten-Free Diet: Safety and Nutritional Quality. Nutrients 2010, 2,16-34.[CrossRef] Foschia, M.; Horstmann, S.W.; Arendt, E.K.; Zannini, E. Legumes as functional ingredients in gluten-free bakery and pastaproducts. Annu. Rev. Food Sci. Technol. 2017,8,75-96. [CrossRef] 6. FAOSTAT, Food and Agriculture Organization of the United Nations. Available online: http://www.fao.org/faostat/ (accessedon 1 June 2020). 7. National Nutrient Database for Standard Reference, USDA. Available online: https://fdc.nal.usda.gov/(accessed on 1 June2020). 8. Alajaji, A.A.; El-Adawy, T.A. Nutritional composition of chickpea (Cicer arietinum L.) as affected by microwave cooking and othertraditional cooking methods. J. Food Compost. Anal. 2006, 19,806-812.[CrossRef] 9. Koksel, H.; Sivri, D.; Scanlon, M.G.; Bushuk, W. Comparison of physical properties of raw and roasted chickpeas (leblebi). FoodRes. Int. 1998, 31,659-665.[CrossRef] 10. Ma, Z.; Boye, J.I.; Simpson, B.K.; Prasher, S.O.; Monpetit, D.; Malcolmson, L. Thermal processing effects on the functionalproperties and microstructure of lentil, chickpea, and pea flours. Food Res. Int. 2011,44,2534-2544. [CrossRef] 11. Ghavidel, R.A.; Prakash, J. The impact of germination and dehulling on nutrients, antinutrients, in vitro iron and calcium bioavailability and in vitro starch and protein digestibility of some legume seeds. LWT-Food Sci. Technol. 2007,40,1292-1299.[CrossRef| 12. Kahraman, G.; Harsa, S.; Lucisano, M.; Cappa, C. Physicochemical and rheological properties of rice-based gluten-free blendscontaining differently treated chickpea flours. LWT-Food Sci. Technol. 2018, 98,276-282.[CrossRef] 13. Mohammed, I.; Ahmed, A.R.; Senge, B. Dough rheology and bread quality of wheat-chickpea flour blends. Ind. Crop. Prod. 2012,36,196-202. [CrossRef] 15. Utrilla-Coello, R.G.;Osorio-Diaz, P; Bello-Perez, L.A. Alternative use of chickpea flour in breadmaking: Chemical compositionand starch digestibility of bread. Food Sci. Technol. Int. 2007, 13,323-327.[CrossRef] 16. Yamsaengsung, R.; Schoenlechner, R.; Berghofer, E. The effects of chickpea on the functional properties of white and whole wheatbread. Int. J. Food Sci. Technol. 2010, 45, 610-620.[CrossRef] 17. Zafar, T.A.; Al-Hassawi,F.; Al-Khulaifi,F.; Al-Rayyes, G.; Waslien, C.; Huffman, F.G. Organoleptic and glycemic properties ofchickpea-wheat composite breads. J. Food Sci. Technol. 2015,52,2256-2263. [CrossRef] [PubMed] 18. Baik, B.-K.; Han, I.H. Cooking, roasting, and fermentation of chickpeas, lentils, peas, and soybeans for fortification of leavenedbread. Cereal Chem. 2012, 89,269-275.[CrossRef] 19. Aguilar,N.; Albanell, E.; Minarro, B.; Capellas, M. Chickpea and tiger nut flours as alternatives to emulsifier and shortening ingluten-free bread.LWT-Food Sci. Technol. 2015, 62,225-232. [CrossRef 20. Buresova, I.; Kragmar, S.; Dvorakova, P.; Streda, T. The relationship between rheological characteristics of gluten-free dough andthe quality of biologically leavened bread. J. Cereal Sci. 2014, 60, 271-275.[CrossRef] 21. Minarro, B.; Albanell, E.; Aguilar, N.; Guamis, B.; Capellas, M. Effect of legume flours on baking characteristics of gluten-freebread. J. Cereal Sci. 2012, 56, 476-481. [CrossRef] 22..Ouazib, M.;Garzon, R.; Zaidi, F.; Rosell, C.M. Germinated, toasted and cooked chickpea as ingredients for breadmaking. J. FoodSci. Technol. 2016,53,2664-2672. [CrossRef] [PubMed] 23. Santos,F.G.; Aguiar, E.V.; Rosell, C.M.; Capriles, V.D. Potential of chickpea and psyllium in gluten-free breadmaking:bread's quality, sensory acceptability, and glycemic and satiety indexes. Food Hydrocoll. 2021,113,106487. [CrossRef] 24. Coskuner, Y.; Karababa, E. Leblebi: A roasted chickpea product as a traditional Turkish snack food. Food Rev. Int. 2004,20,257-274.[CrossRef 25. Cappa, C.; Lucisano, M.; Mariotti, M. Influence of Psyllium, sugar beet fibre and water on gluten-free dough properties and breadquality. Carbohydr. Polym. 2013, 98, 1657-1666.[CrossRef] 26. Hager, A.-S.; Wolter, A.; Czerny, M.; Bez,J.;Zannini, E.; Arendt, E.K.; Czerny, M. Investigation of product quality, sensory profileand ultrastructure of breads made from a range of commercial gluten-free flours compared to their wheat counterparts. Eur. FoodRes. Technol. 2012,235,333-344. [CrossRef] 27. Association of Official Analytical Chemists (AOAC). Official Methods of Analysis, Protein (Total) in Flour; AOAC: Gaithersburg,MD,USA, 1999. 28. American Association of Cereal Chemists (AACC) International. Approved Methods of Analysis, Ash-Basic Method, for Corn (Method08-01.01), 11th ed.; AACC: St. Paul,MN,USA, 1999. 29. Alves, G.H.; Ferreira, C.D.; Vivian, P.G.; Monks,J.L.F.; Elias, M.C.; Vanier, N.L.; de Oliveira, M. The revisited levels of free andbound phenolics in rice: Effects of the extraction procedure. Food Chem. 2016, 208, 116-123.[CrossRef] 30. Singleton, V.L.;Orthofer, R.; Lamuela-Raventos, R.M. Analysis of total phenols and other oxidation substrates and antioxidantsby means of Folin-Ciocalteu reagent. Methods Enzymol. 1999,299, 152-178. 31. Sakac,M.; Torbica, A.;Sedej, I.; Hadnadev, M. Influence of breadmaking on antioxidant capacity of gluten free breads based onrice and buckwheat flours. Food Res. Int. 2011,44, 2806-2813. [CrossRef] 32. Englyst, K.N.; Hudson, G.J.; Englyst, H.N. Starch analysis in food. In Encyclopedia of Analytical Chemistry; Meyers, R.A., Ed.; JohnWiley & Sons Ltd.: Chichester, UK, 2000; pp. 4246-4262. 33. Hsu, H.W.;Vavak, D.L.; Satterlee, L.D.; Miller, G.A. A multienzyme technique for estimating protein digestibility. J. Food Sci. 1977,42, 1269-1273.[CrossRef] 35. Kahraman, G. Development of Gluten-Free Bread Formulations Based on Chickpea Flour: Optimization of Formulation,Evaluation of Dough Properties and Bread Quality. Ph.D. Thesis, Izmir Institute of Technology, Izmir, Turkey, 2016. 36. Wolter, A.; Hager, A.-S.; Zannini, E.; Czerny, M.; Arendt, E.K. Influence of dextran-producing Weissella cibaria on baking propertiesand sensory profile of gluten-free and wheat breads. Int. J. Food Microbiol. 2014,172,83-91. [CrossRef] 37. Schober, T.J. Manufacture of Gluten-Free Specialty Breads and Confectionery Products. In Gluten-Free Food Science and Technology;Gallagher, E., Ed.; Wiley-Blackwell: Oxford, UK, 2009; pp. 130-180. 38. Gray, J.A.; Bemiller, J.N. Bread staling: Molecular basis and control. Compr. Rev. Food Sci. Food Saf. 2003,2,1-21. [CrossRef][PubMed] 41. Kim, S.K.; D'Appolonia, B.L. Bread staling studies. I. Effect of protein content on staling rate and bread crumb pasting properties.Cereal Chem. 1977,54,207-215. 42. Every, D.; Gerrard, J.A.; Gilpin, M.J; Ross, M.; Newberry, M.P. Staling in starch bread: The effect of gluten additions on specificloaf volume and firming rate. Starch-Stairke 1998, 50, 443-446. [CrossRef] 43. Martin, M.L.; Zeleznak, K.J.; Hoseney, R.C. A mechanism of bread firming. I. Role of starch swelling. Cereal Chem. 1991, 68,498-503. 44. Cappa, C.; Lucisano, M.; Mariotti, M. Rheological properties of gels obtained from gluten-free raw materials during a short termaging. LWT-Food Sci. Technol. 2013,53, 464-472. [CrossRef] 45. Onyango,C.; Mutungi,C.; Unbehend, G.; Lindhauer, M.G. Modification of gluten-free sorghum batter and bread using maize,potato, cassava or rice starch. LWT-Food Sci. Technol. 2011,44,681-686.[CrossRef] 46. Wójcik, M.; Rozylo,R.; Schonlechner, R.; Berger, M.V. Physicochemical properties of an innovative gluten-free, low-carbohydrateand high protein-bread enriched with pea protein powder. Sci. Rep. 2021, 11, 14498.[CrossRef] [PubMed] 47. Shevkani, K.; Kaur, A.; Kumar, S.; Singh, N. Cowpea protein isolates: Functional properties and application in gluten-free ricemuffins. LWT-Food Sci. Technol. 2015, 63, 927-933.[CrossRef] 48. Xu, B.J.; Chang, S.K.C. A comparative study on phenolic profiles and antioxidant activities of legumes as affected by extractionsolvents. J. Food Sci. 2007, 72, S159-S166.[CrossRef] [PubMed] 49. Padhi, E.M.T.; Liu, R.; Hernandez, M.; Tsao,R.;Ramdath,D.D. Total polyphenol content, carotenoid, tocopherol and fatty acidcomposition of commonly consumed Canadian pulses and their contribution to antioxidant activity. J. Funct. Foods 2016, 38 Pt B,602-611.CrossRef 50. Fares, C.; Menga, V. Effects of toasting on the carbohydrate profile and antioxidant properties of chickpea (Cicer arietinum L.) flouradded to durum wheat pasta. Food Chem. 2012,131,1140-1148. 52. Gularte, M.A.; Gomez, M.;Rosell, C.M. Impact of legume flours on quality and in vitro digestibility of starch and protein fromgluten-free cakes. Food Bioprocess Technol. 2012, 5,3142-3150.[CrossRef] 53. Hoover, R.; Hughes, T.; Chung, H.J.; Liu, Q. Composition, molecular structure, properties, and modification of pulse starches: Areview. Food Res. Int. 2010, 43,399-413. [CrossRef] 54. Zhang, Z.; Tian, X.; Wang, P;Jiang, H.; Li, W. Compositional, morphological, and physicochemical properties of starches from redadzuki bean, chickpea, faba bean, and baiyue bean grown in China. Food Sci. Nutr. 2019, 7, 2485-2494. [CrossRef] 55. Sandhu, K.S.; Lim, S.-T. Digestibility of legume starches as influenced by their physical and structural properties. Carbohydr.Polym. 2008, 71,245-252. [CrossRef] 56. Englyst, H.N.; Kingman, S.M.; Cummings,J.H. Classification and measurement of nutritionally important starch fractions. Eur.J.Clin. Nutr. 1992, 46 (Suppl. S2), S33-S50. 57. Venn, B.J.; Green, T.J. Glycemic index and glycemic load: Measurement issues and their effect on diet-disease relationships. Eur. J.Clin. Nutr. 2007, 61 (Suppl. S1), S122-S131.[CrossRef] 58. FAO, Food and Agriculture Organization of the United Nations. Carbohydrates in Human Nutrition, FAO Food and NutritionPaper 66. Available online: www.fao.org/docrep/w8079e/w8079e00.htm (accessed on 15 November 2016). 59. EFSA Panel on Dietetic Products; Nutrition and Allergies (NDA). Scientific Opinion on the substantiation of a health claim relatedto "slowly digestible starch in starch-containing foods" and "reduction of post- prandial glycaemic responses" pursuant to Article13(5) of Regulation (EC) No 1924/20061.EFSA J. 2011,9,2292. 60. Wolter, A.; Hager, A.-S.; Zannini, E.; Arendt, E.K. In vitro starch digestibility and predicted glycaemic indexes of buckwheat, oat,quinoa, sorghum, teff and commercial gluten-free bread. J. Cereal Sci. 2013,58,431-436. [CrossRef] 61. Garsetti, M.; Vinoy, S.; Lang, V.; Holt, S.; Loyer, S.; Brand-Miller, J.C. The glycemic and insulinemic index of plain sweet biscuits:Relationships to in vitro starch digestibility. J. Am. Coll. Nutr. 2005,24,441-447.[CrossRef] 62. de La Hera, E.; Rosell, C.M.; Gomez, M. Effect of water content and flour particle size on gluten-free bread quality and digestibility.Food Chem. 2014,151,526-531. [CrossRef] 63. Tavano, O.L.;Neves, V.A.; da Silva Junior, S.I. In vitro versus in vivo protein digestibility techniques for calculating PDCAAS (protein digestibility-corrected amino acid score) applied to chickpea fractions. Food Res. Int. 2016, 89,756-763. [CrossRef] 64. Coda,R.;Melama, L.;Rizzello, C. Effect of air classification and fermentation by Lactobacillus plantarum VTT E-133328 on fababean (Vicia faba L.) flour nutritional properties. Int. J. Food Microbiol. 2015, 193,34-42.[CrossRef] [PubMed] 65. Machado, F.P.P.;Queiroz, J.H.;Oliveira, M.G.A.; Piovesan, N.D.; Peluzio, M.C.G.; Costa, N.M.B.; Moreira, M.A. Effects of heatingon protein quality of soybean flour devoid of Kunitz inhibitor and lectin. Food Chem. 2008, 107, 649-655. [CrossRef] 66. Shi, L.; Mu, K.; Arntfield, S.D.; Nickerson, M.T. Changes in levels of enzyme inhibitors during soaking and cooking for pulsesavailable in Canada. J. Food Sci. Technol. 2017, 54,1014-1022.[CrossRef] [PubMed] 68. Rachman, A.; Brennan, M.A.; Morton, J.; Brennan, C.S. Effect of Egg White Protein and Soy Protein Isolate Addition on NutritionalProperties and In-Vitro Digestibility of Gluten-Free Pasta Based on Banana Flour. Foods 2020, 9,589. [CrossRef] [PubMed]
确定

还剩14页未读,是否继续阅读?

产品配置单


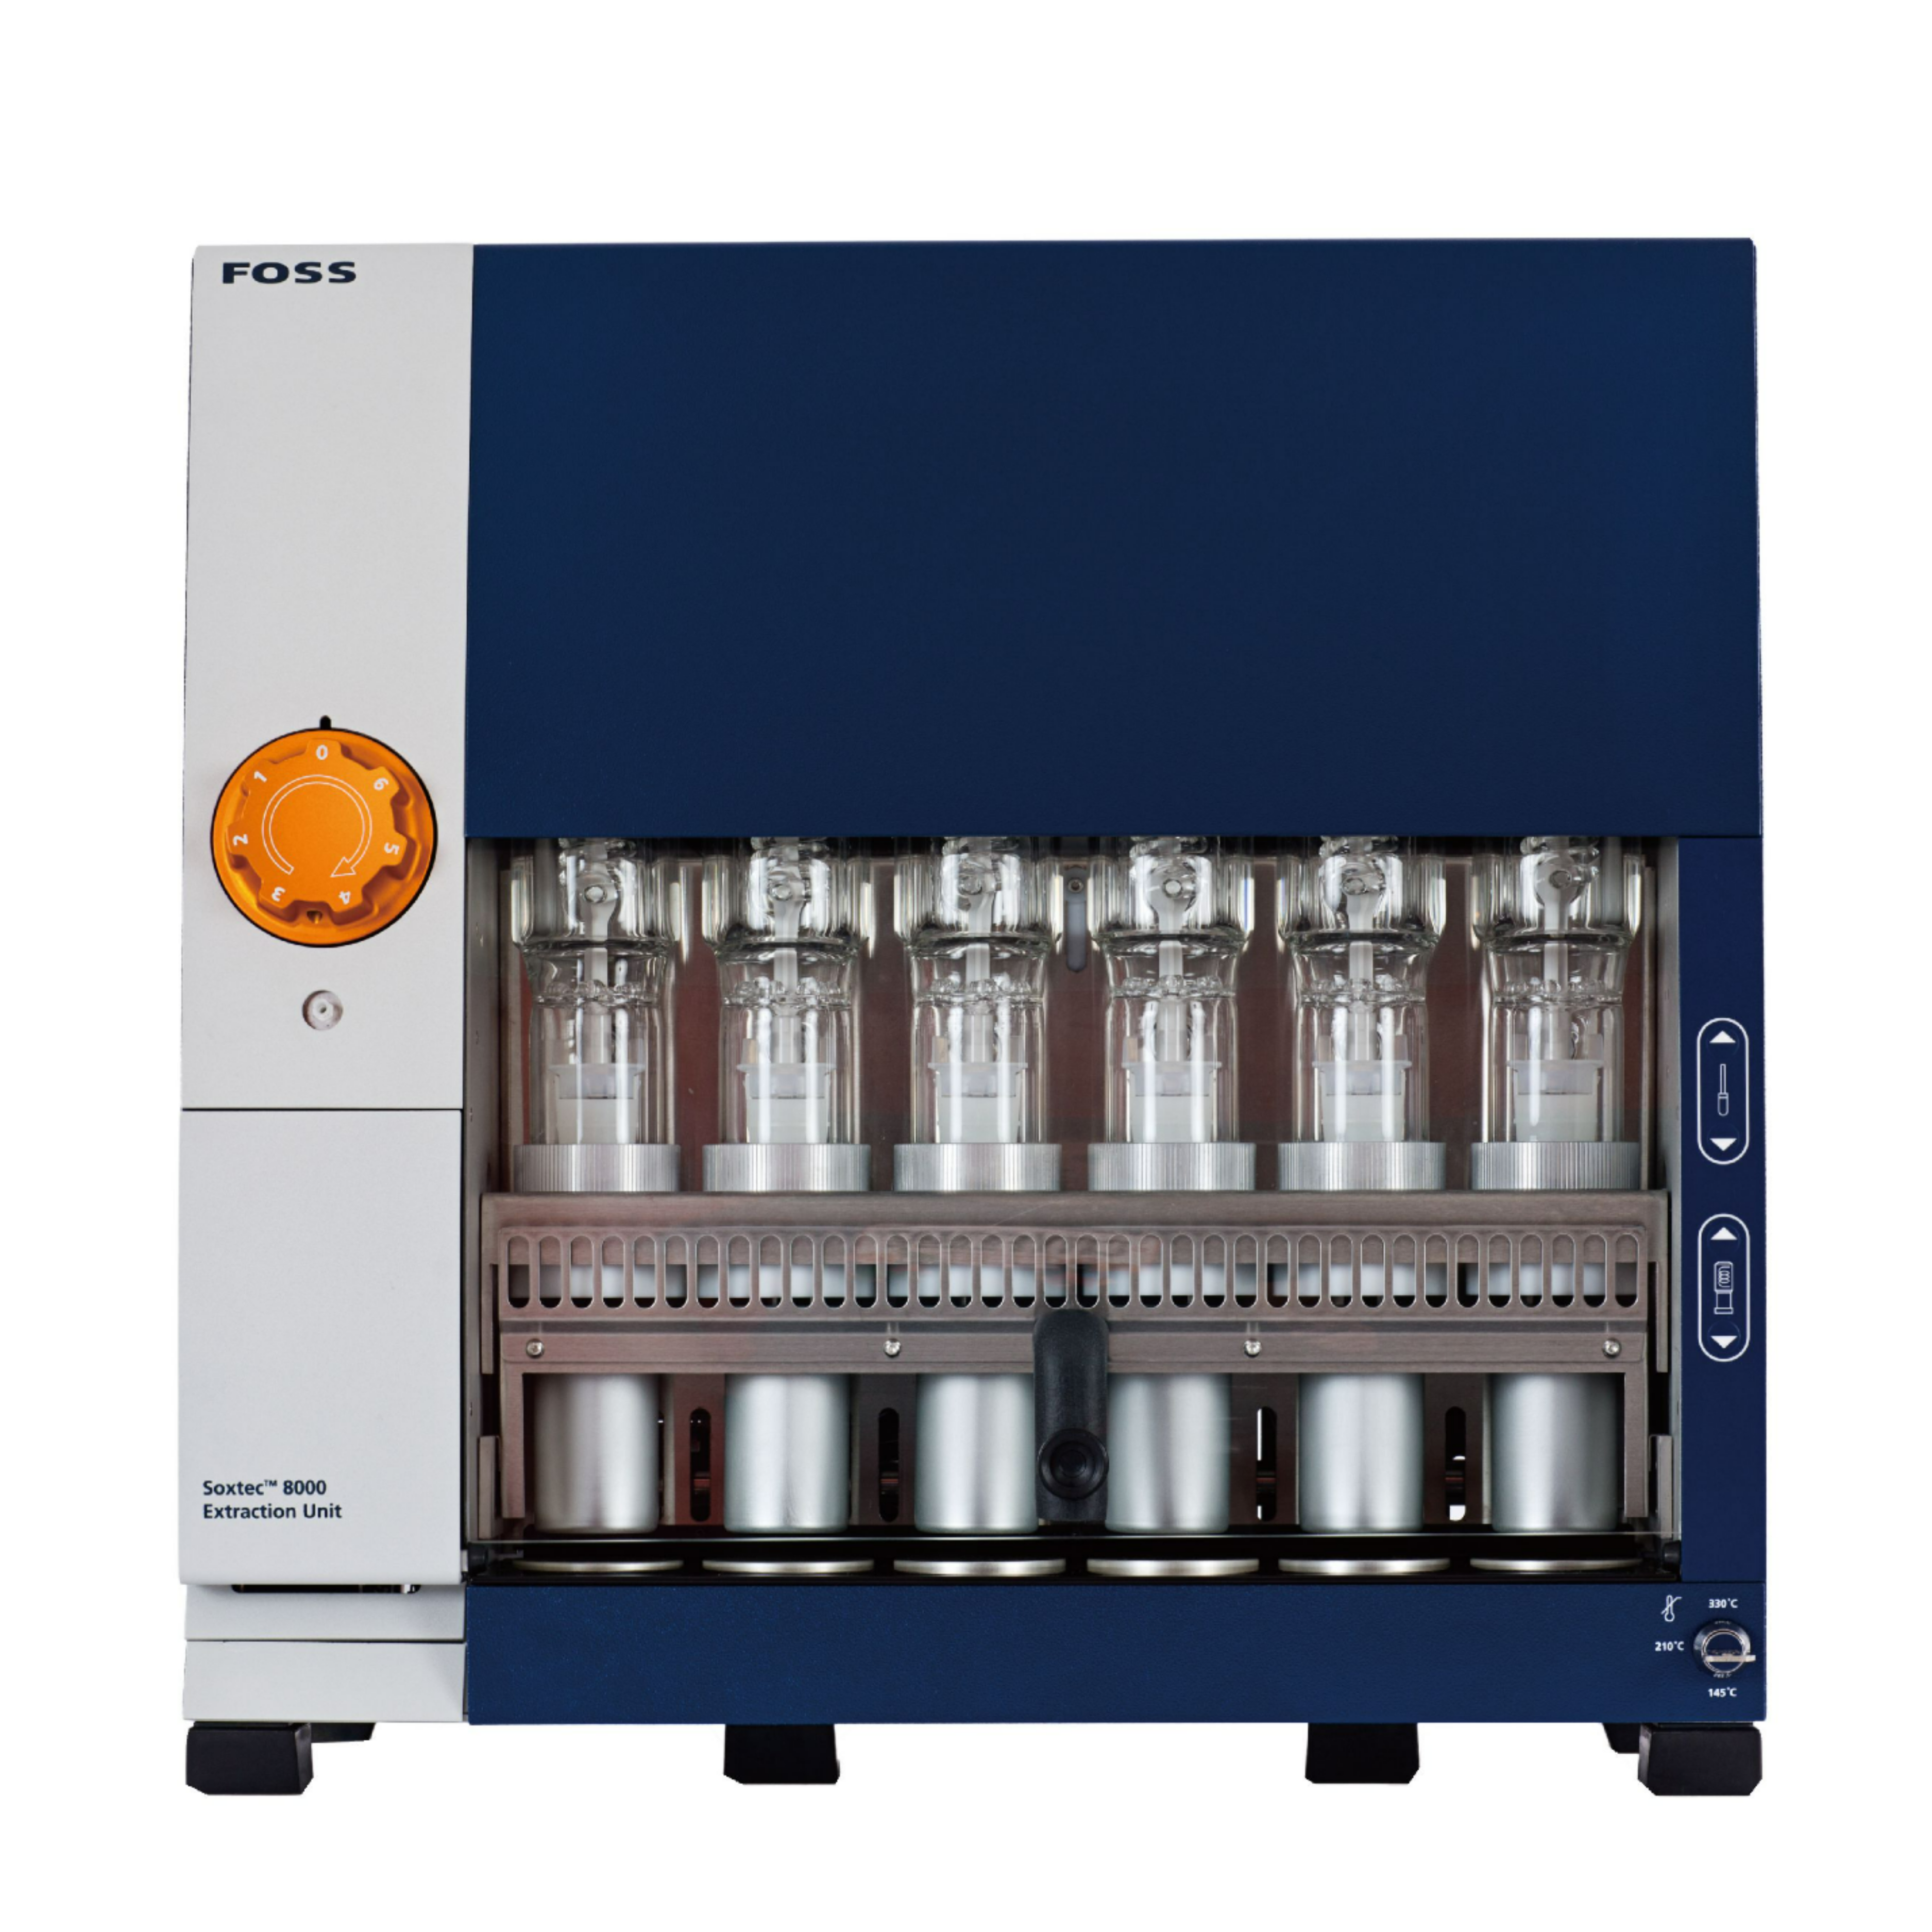
中国格哈特为您提供《生、烤、脱壳鹰嘴豆粉无麸质面包蛋白质和脂肪含量的检测》,该方案主要用于糕点/月饼/粽子中营养成分检测,参考标准--,《生、烤、脱壳鹰嘴豆粉无麸质面包蛋白质和脂肪含量的检测》用到的仪器有格哈特带自动进样器凯氏定氮仪VAP500C、格哈特全自动超级总脂肪测定系统HT6+SOX416、格哈特凯氏消化系统KT8S、格哈特维克松废气实验室废物处理系统涤气VS、德国加液器MM、滤纸筒


相关方案
更多
该厂商其他方案
更多