


方案详情
文
提出了激光诱导击穿光谱(LIBS)作为确定鲨鱼牙齿内F分布的替代和快速有效的测试方法。使用激光剥蚀样品池(T woVol3)和创新的LIBS嵌入式采集系统,研究了沙虎鲨(Carcharias Taurus)、虎鲨(Galeocerdo Cuvier)和锤头鲨(Spyrnidae)的鲨鱼牙齿。
方案详情

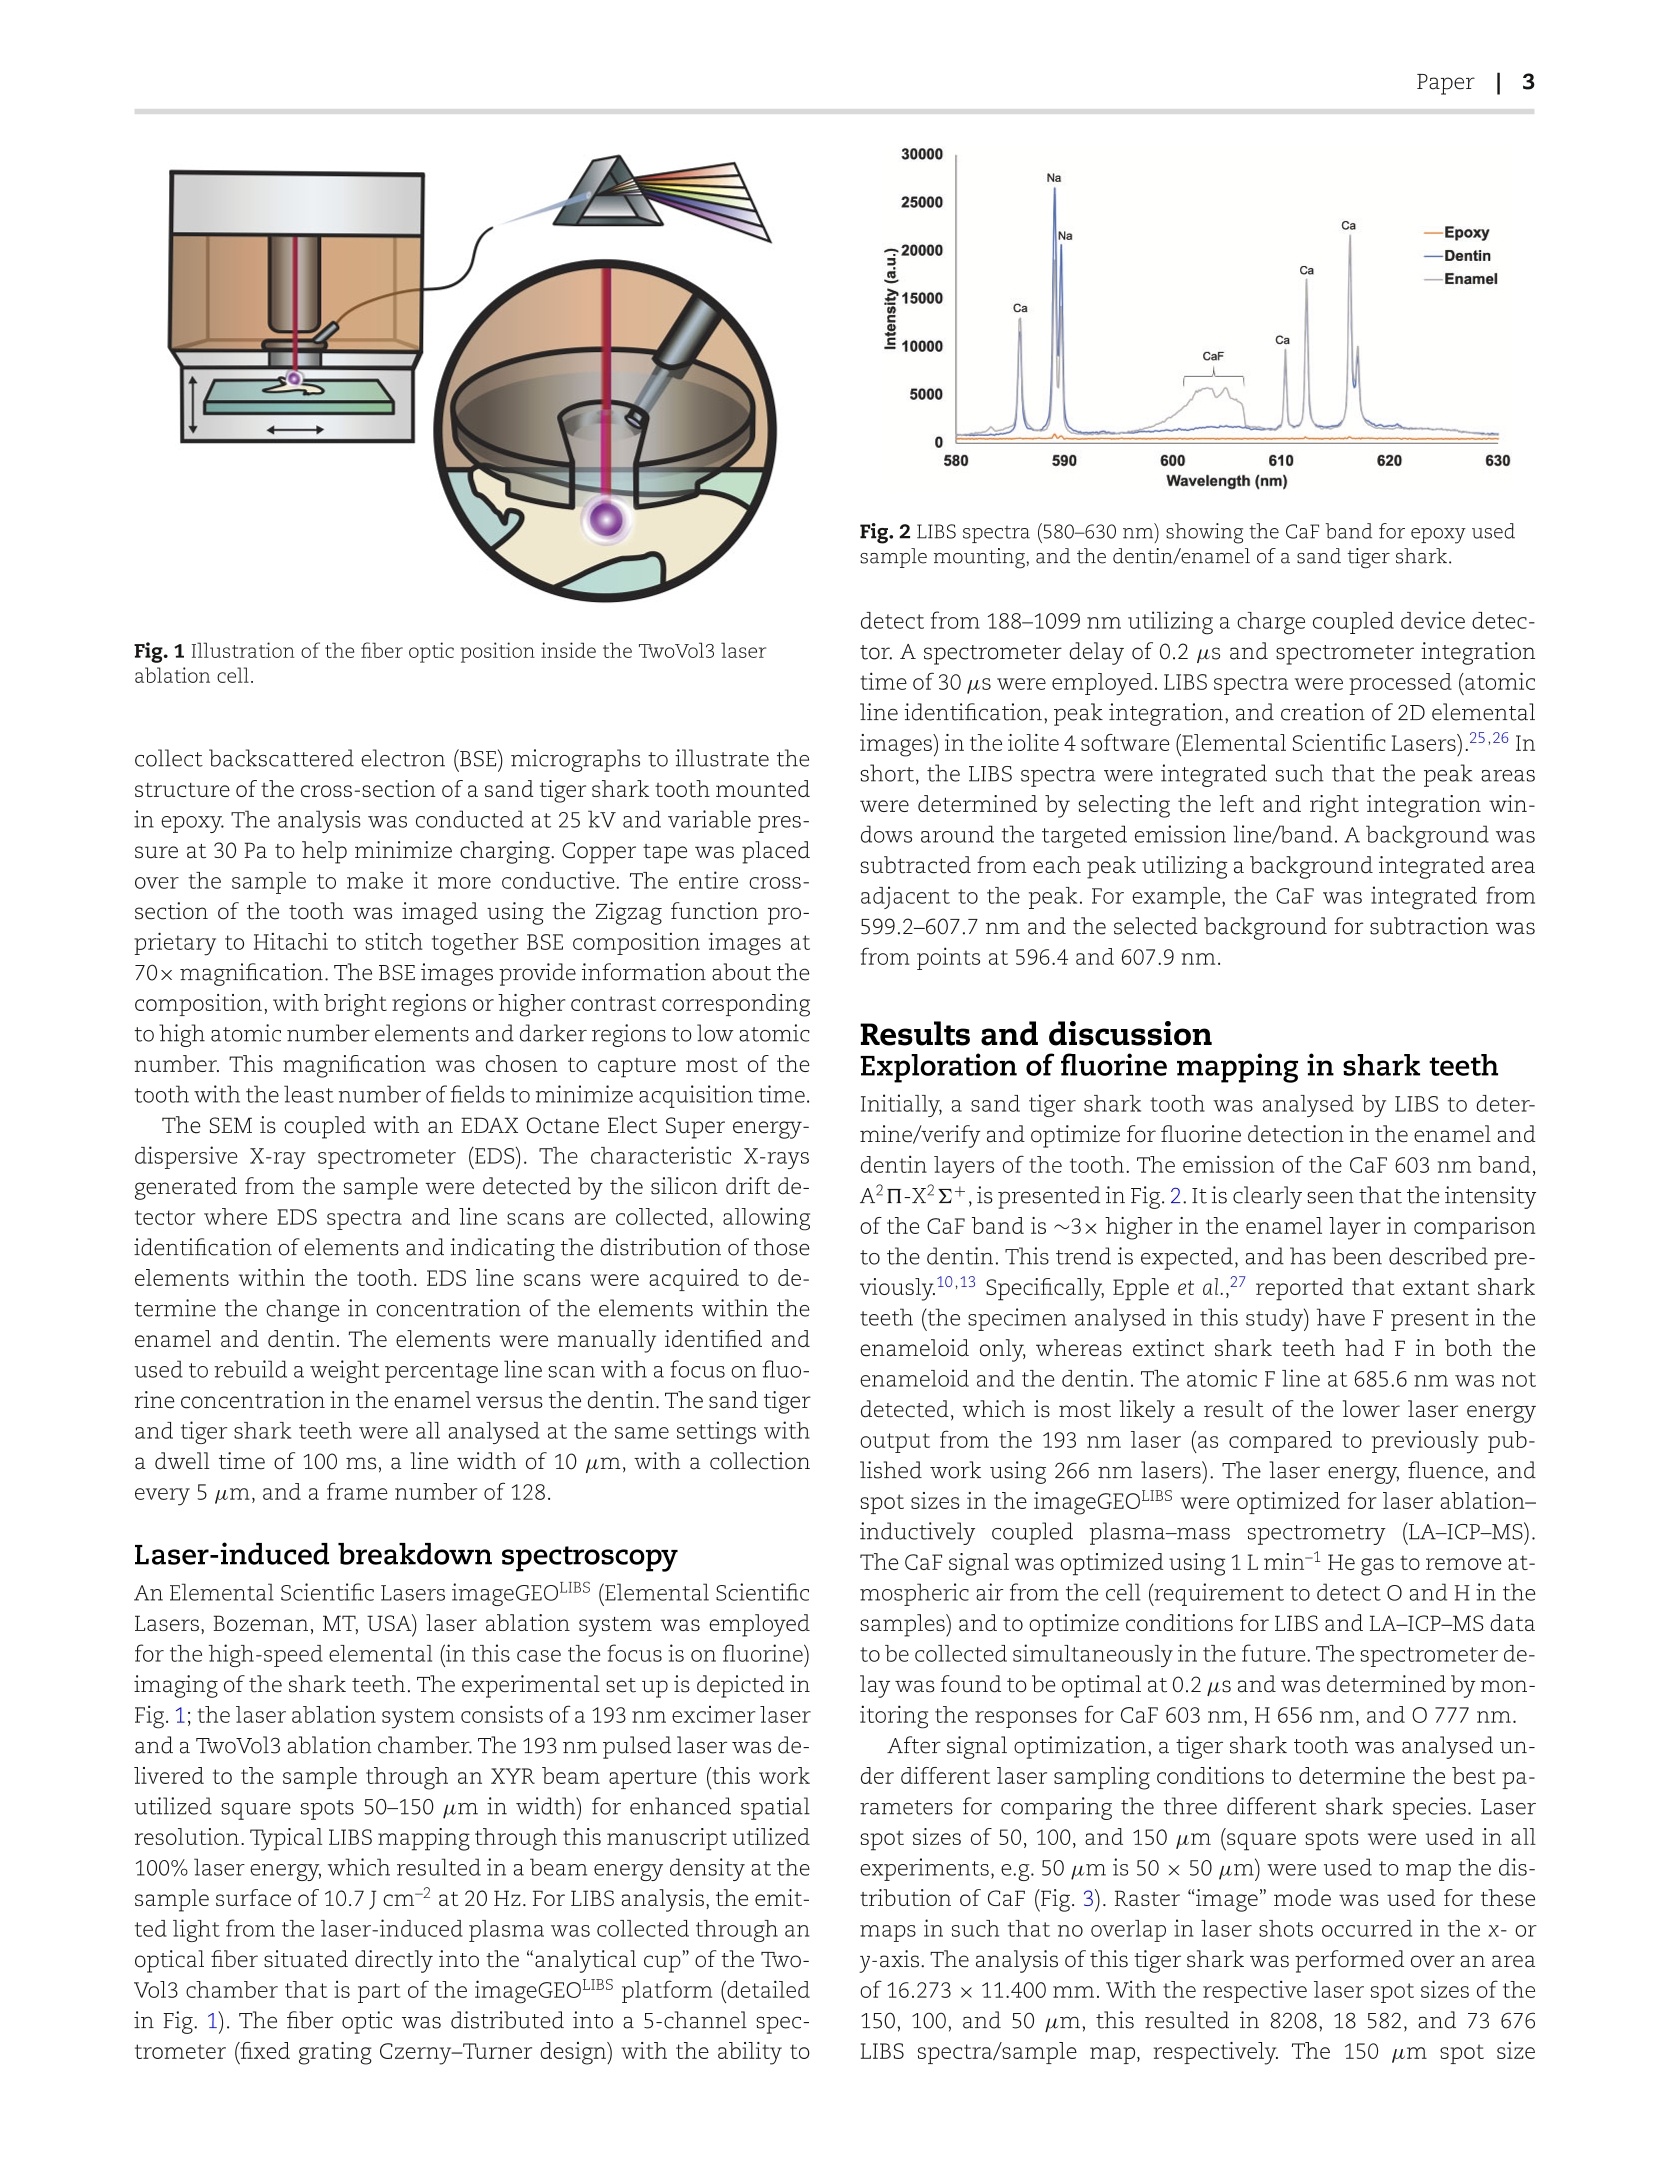
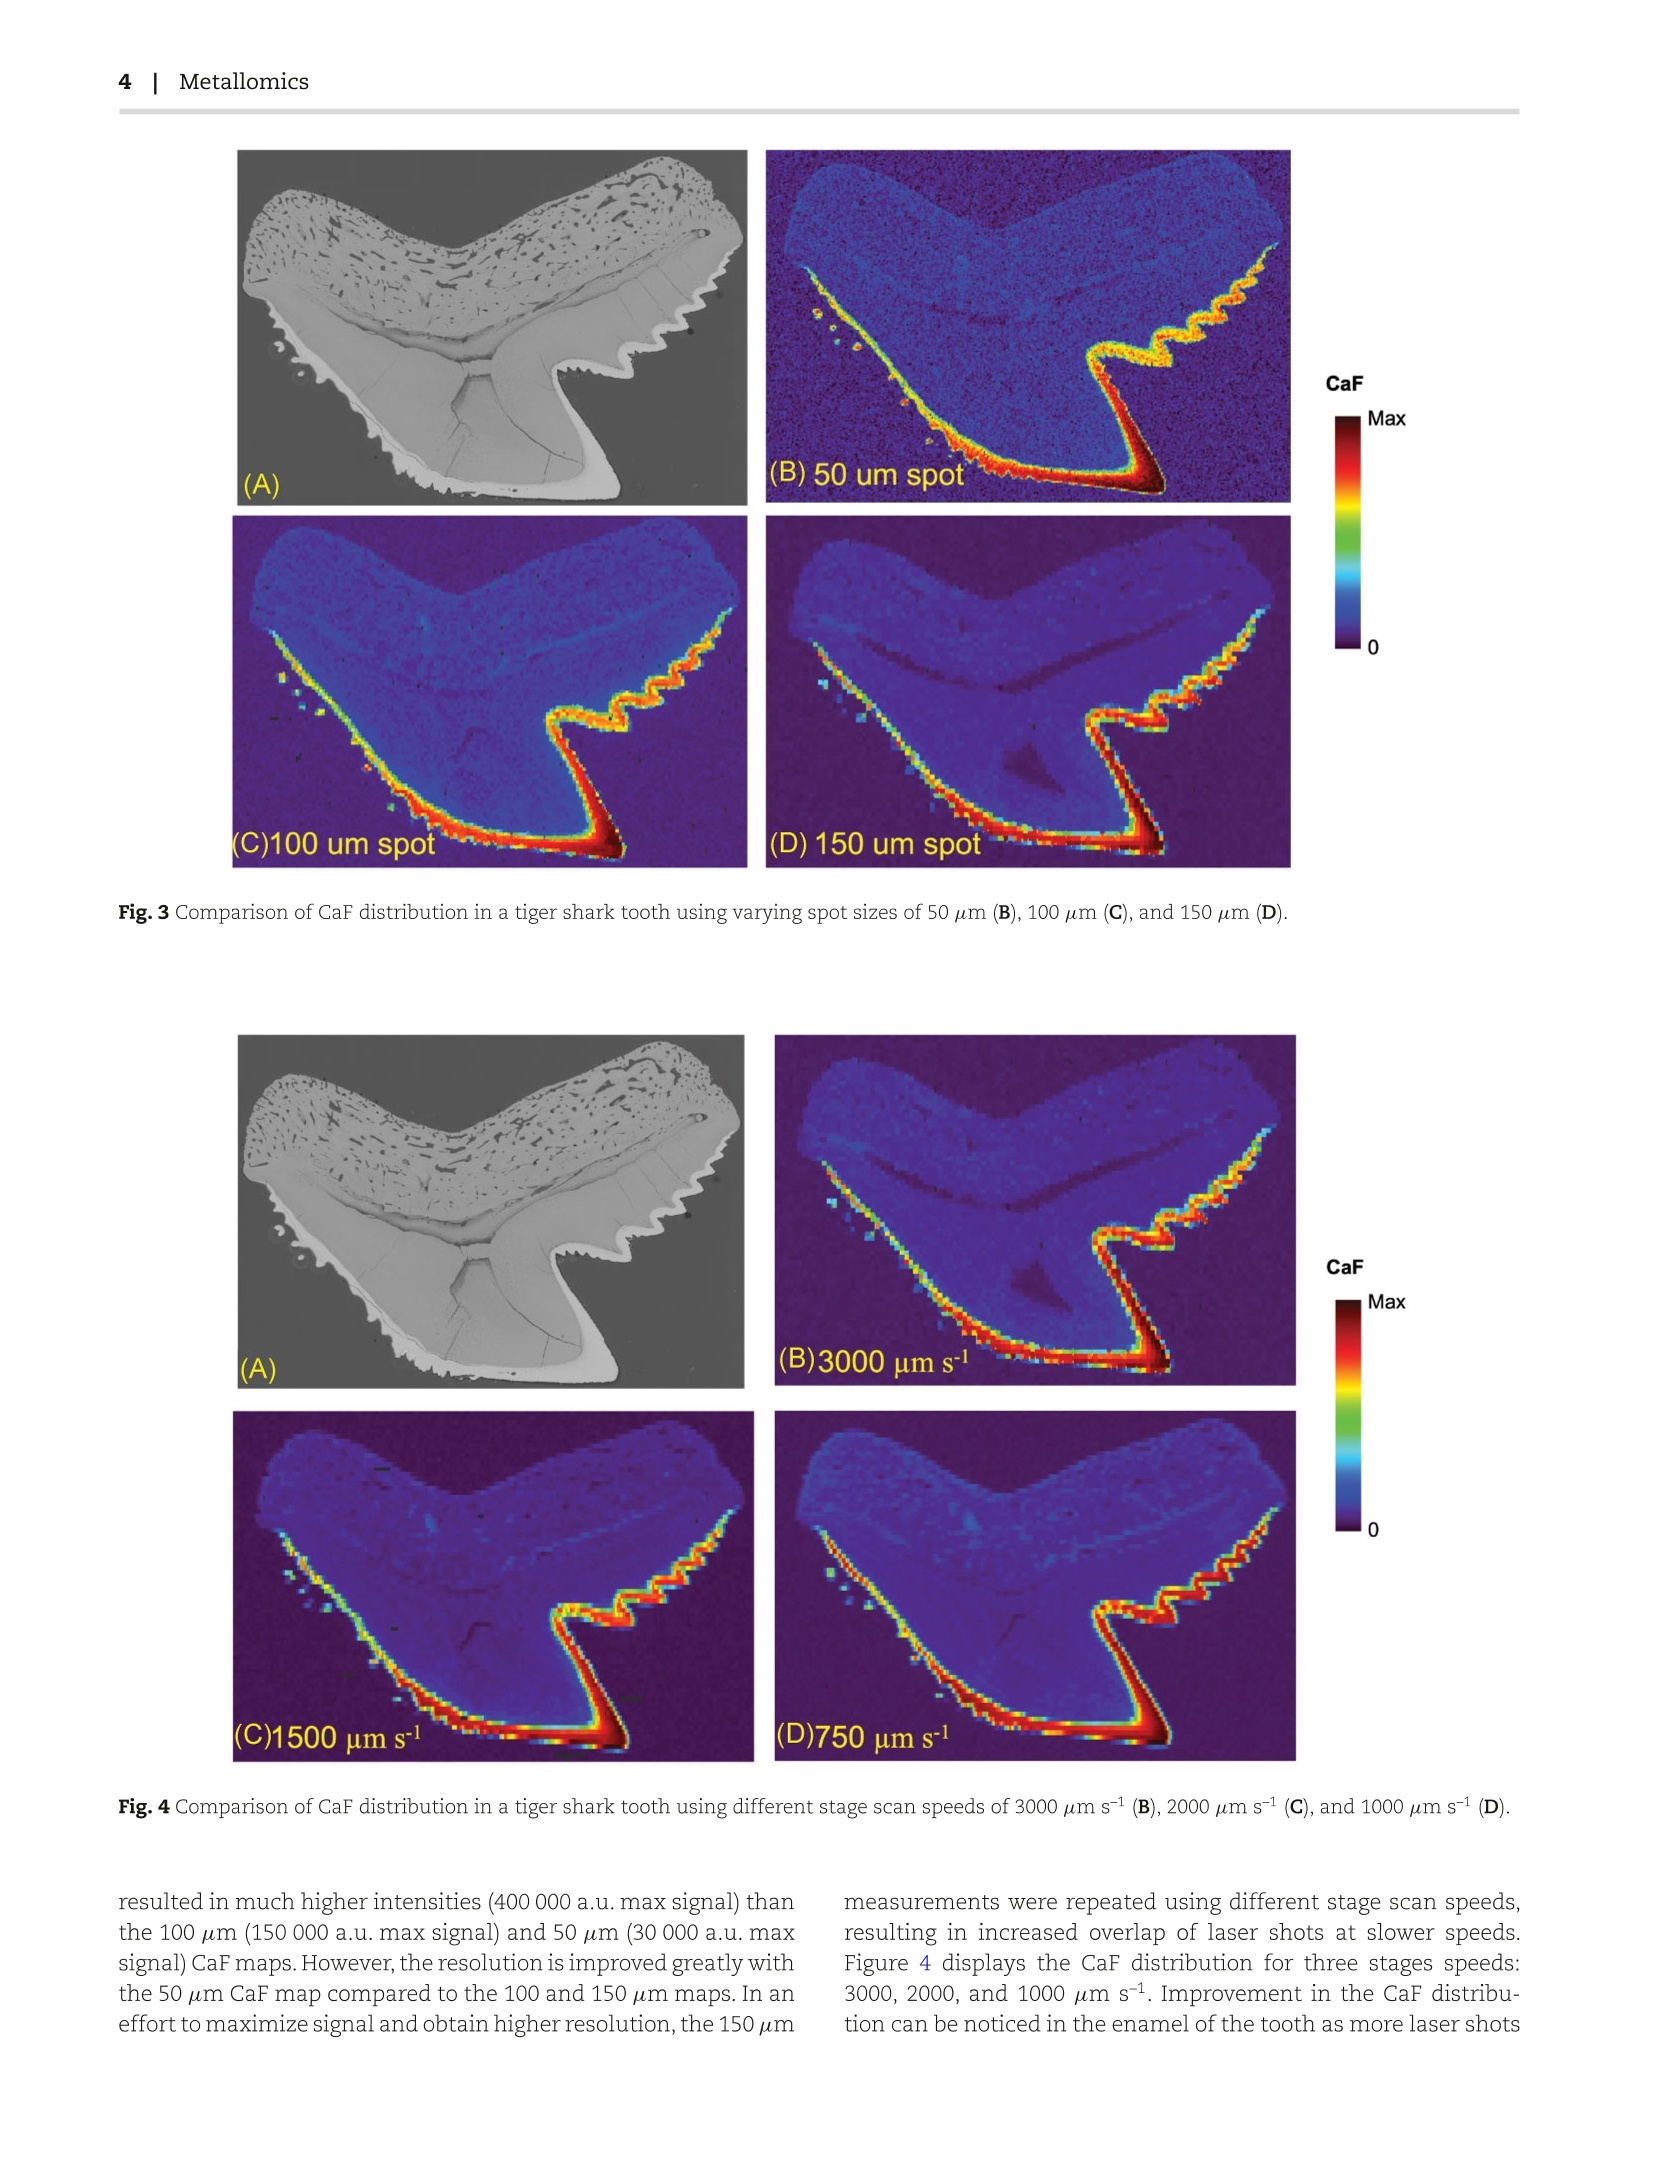
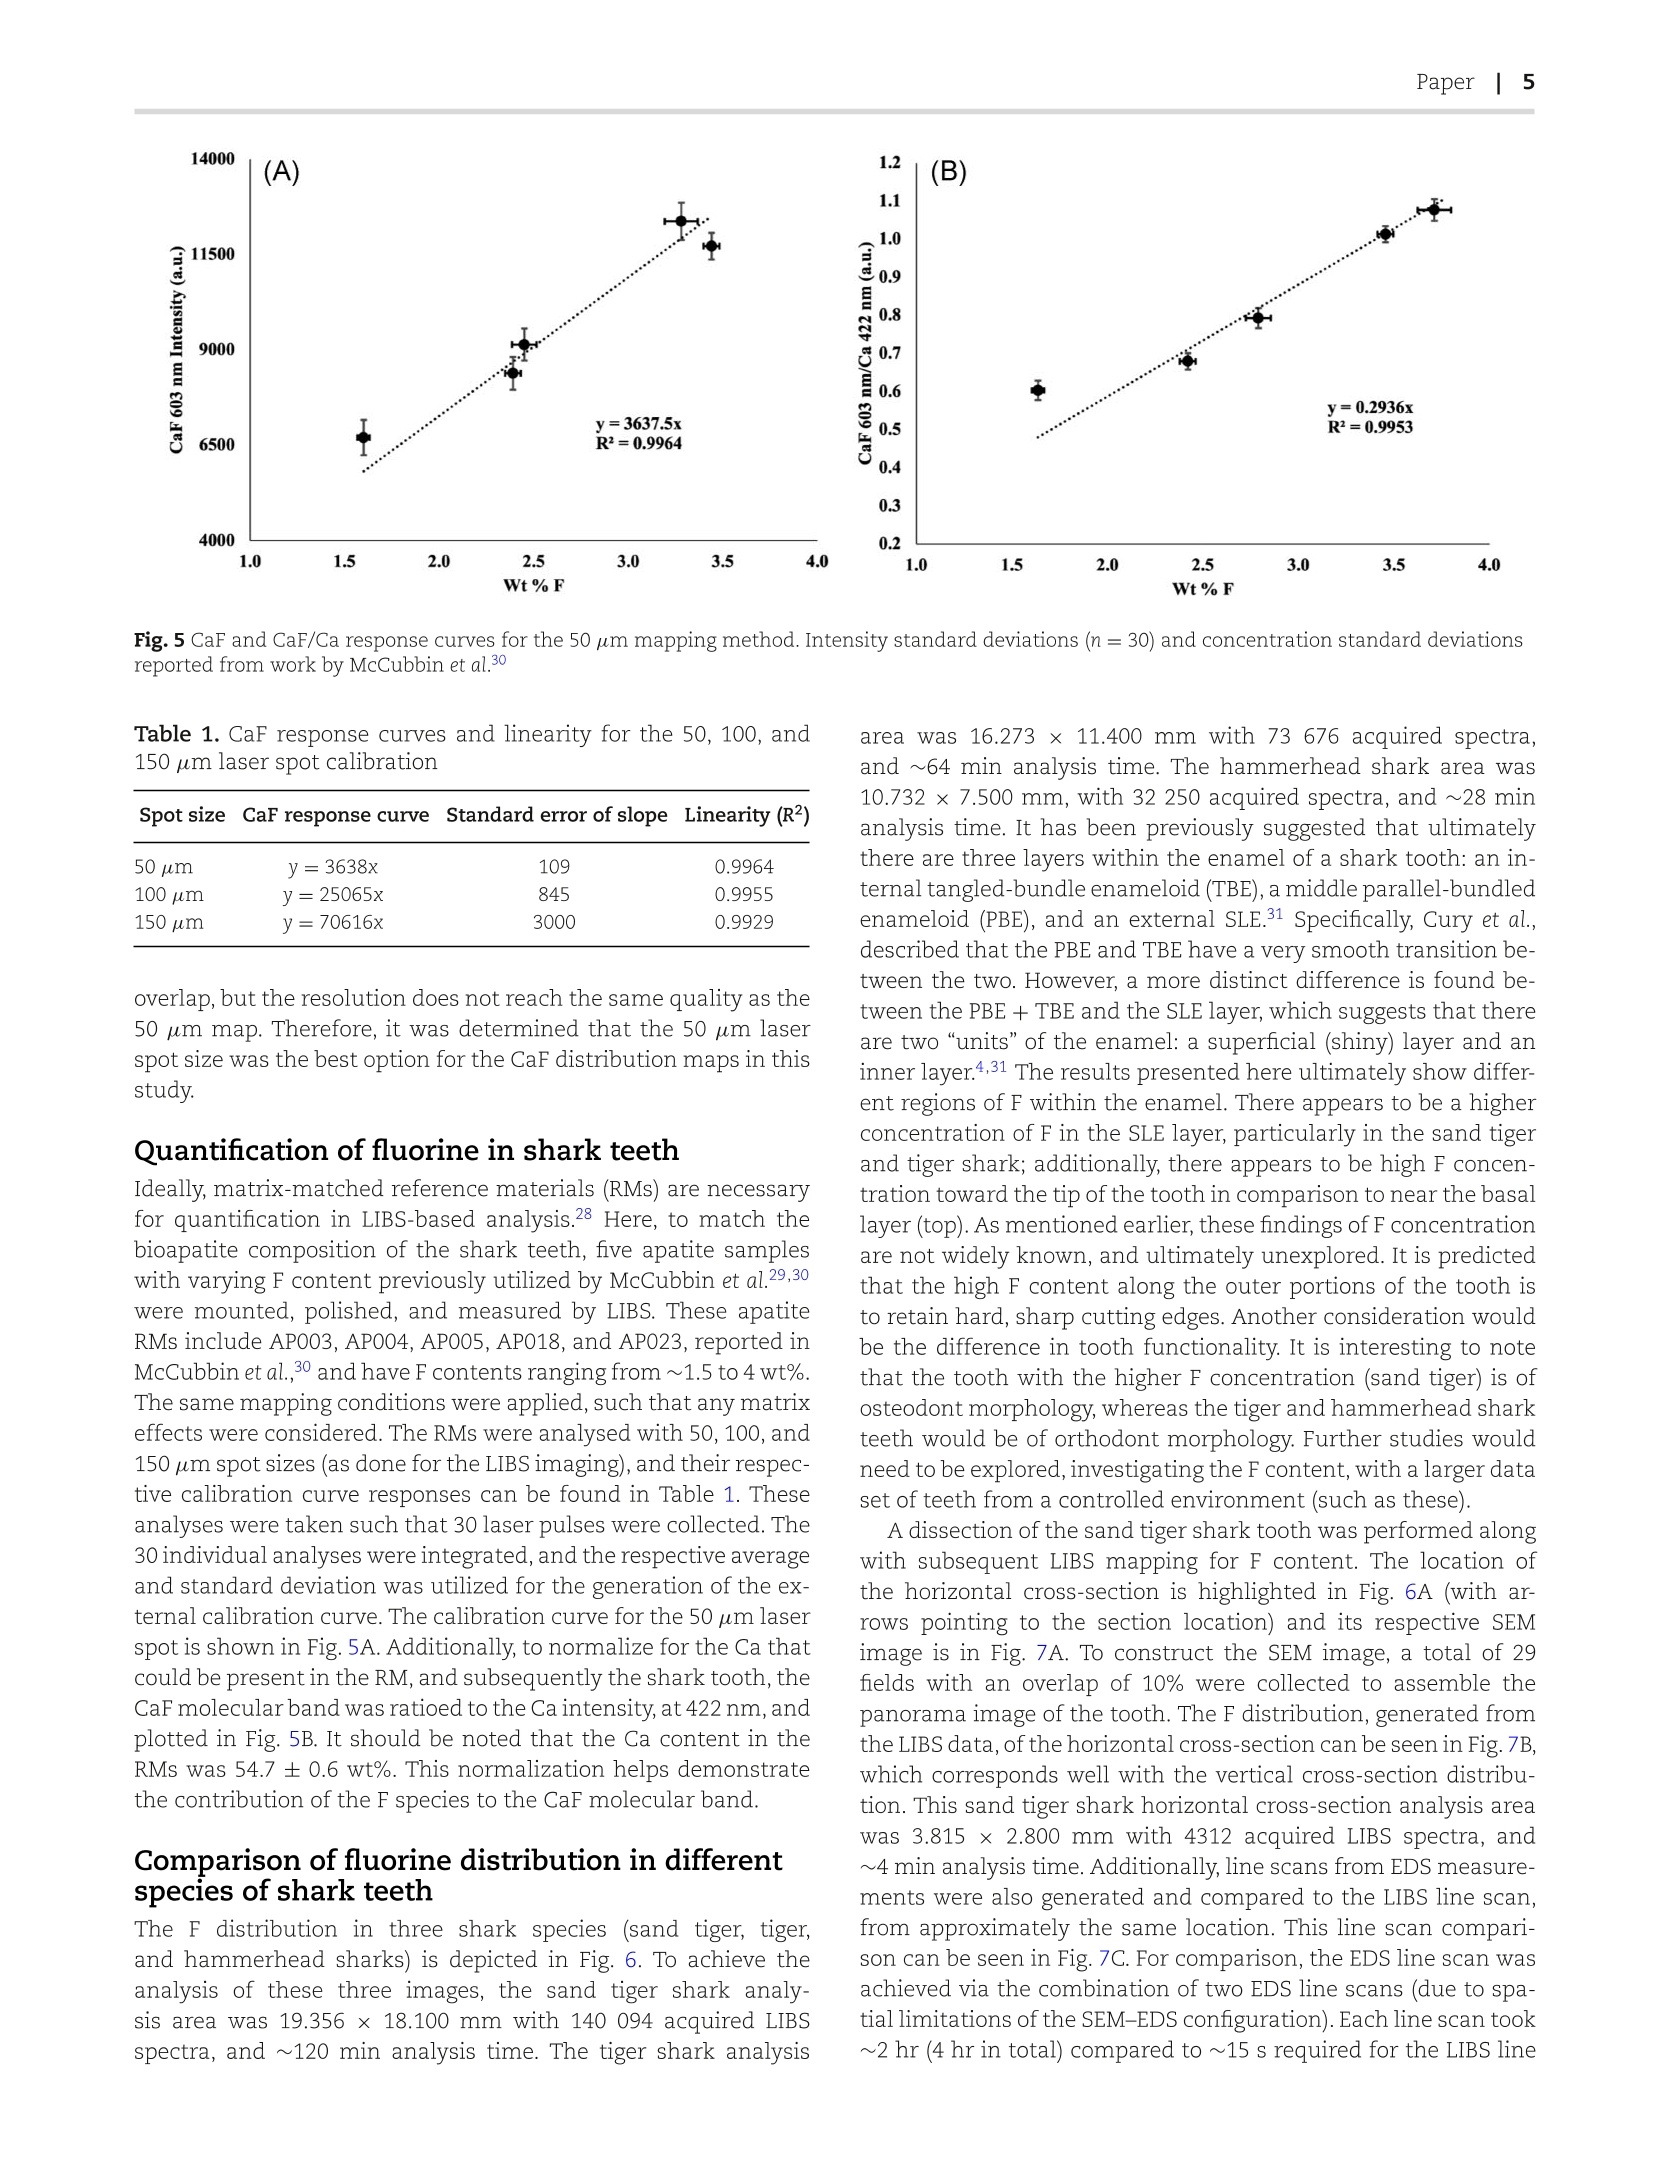
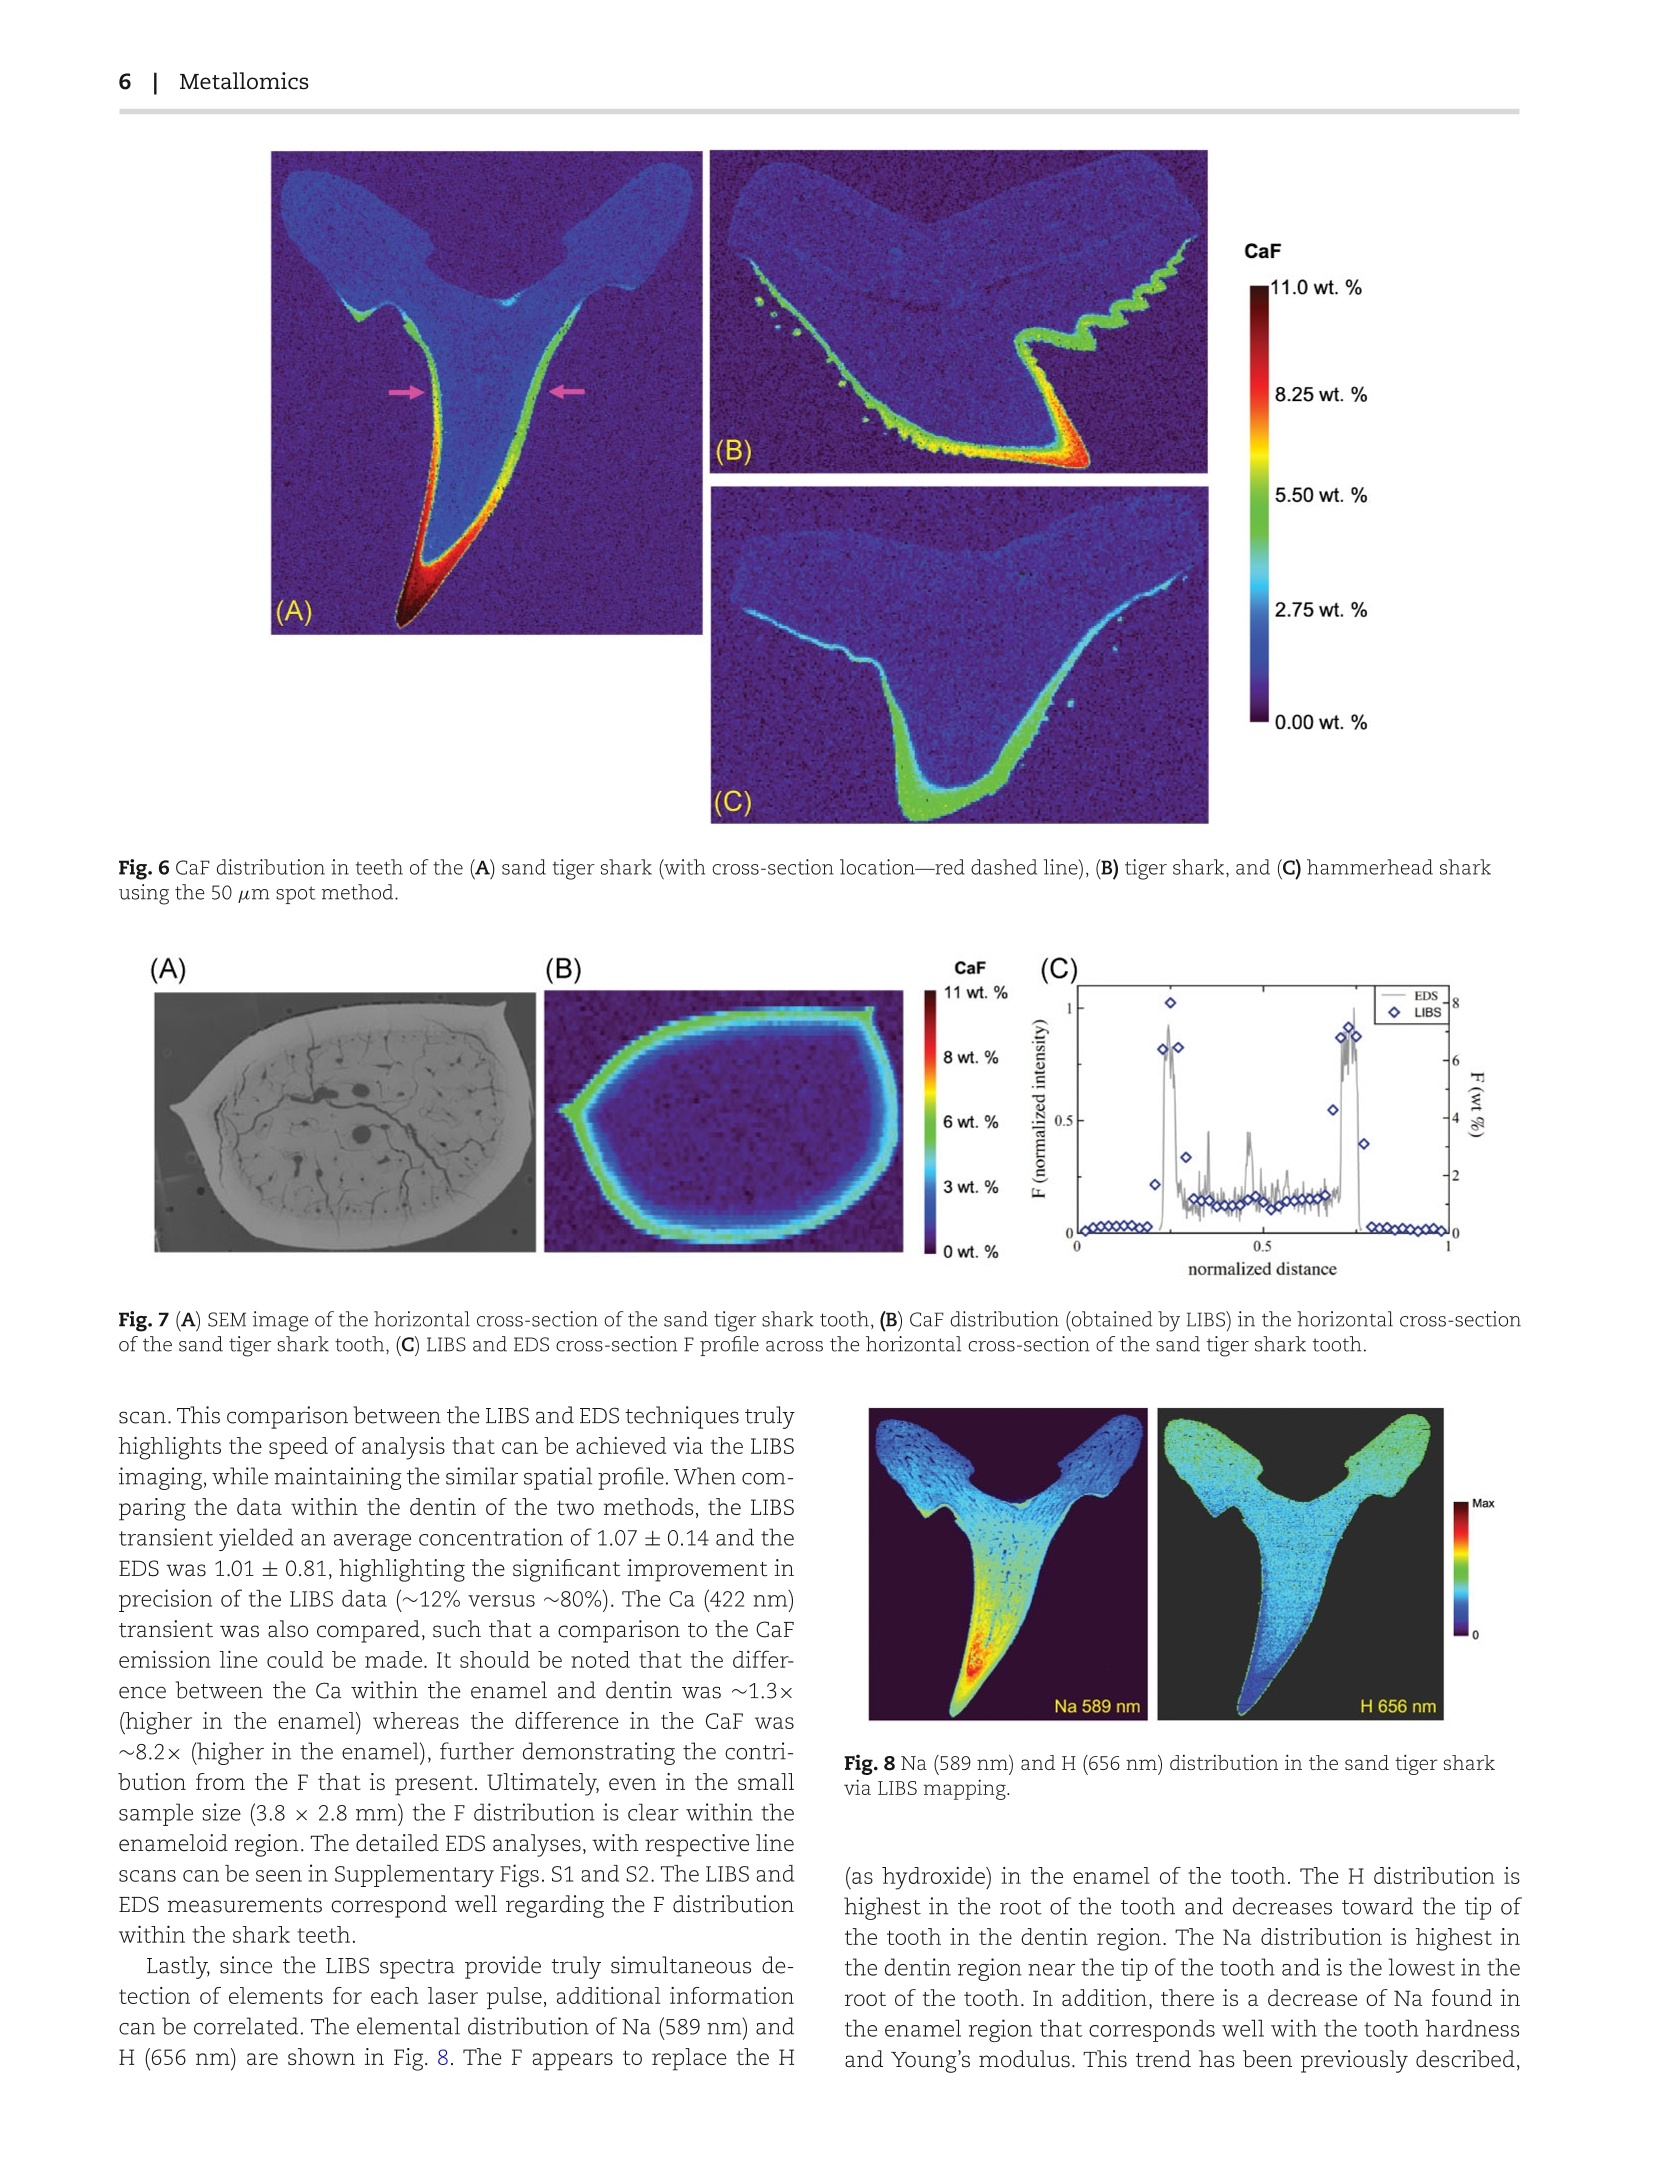
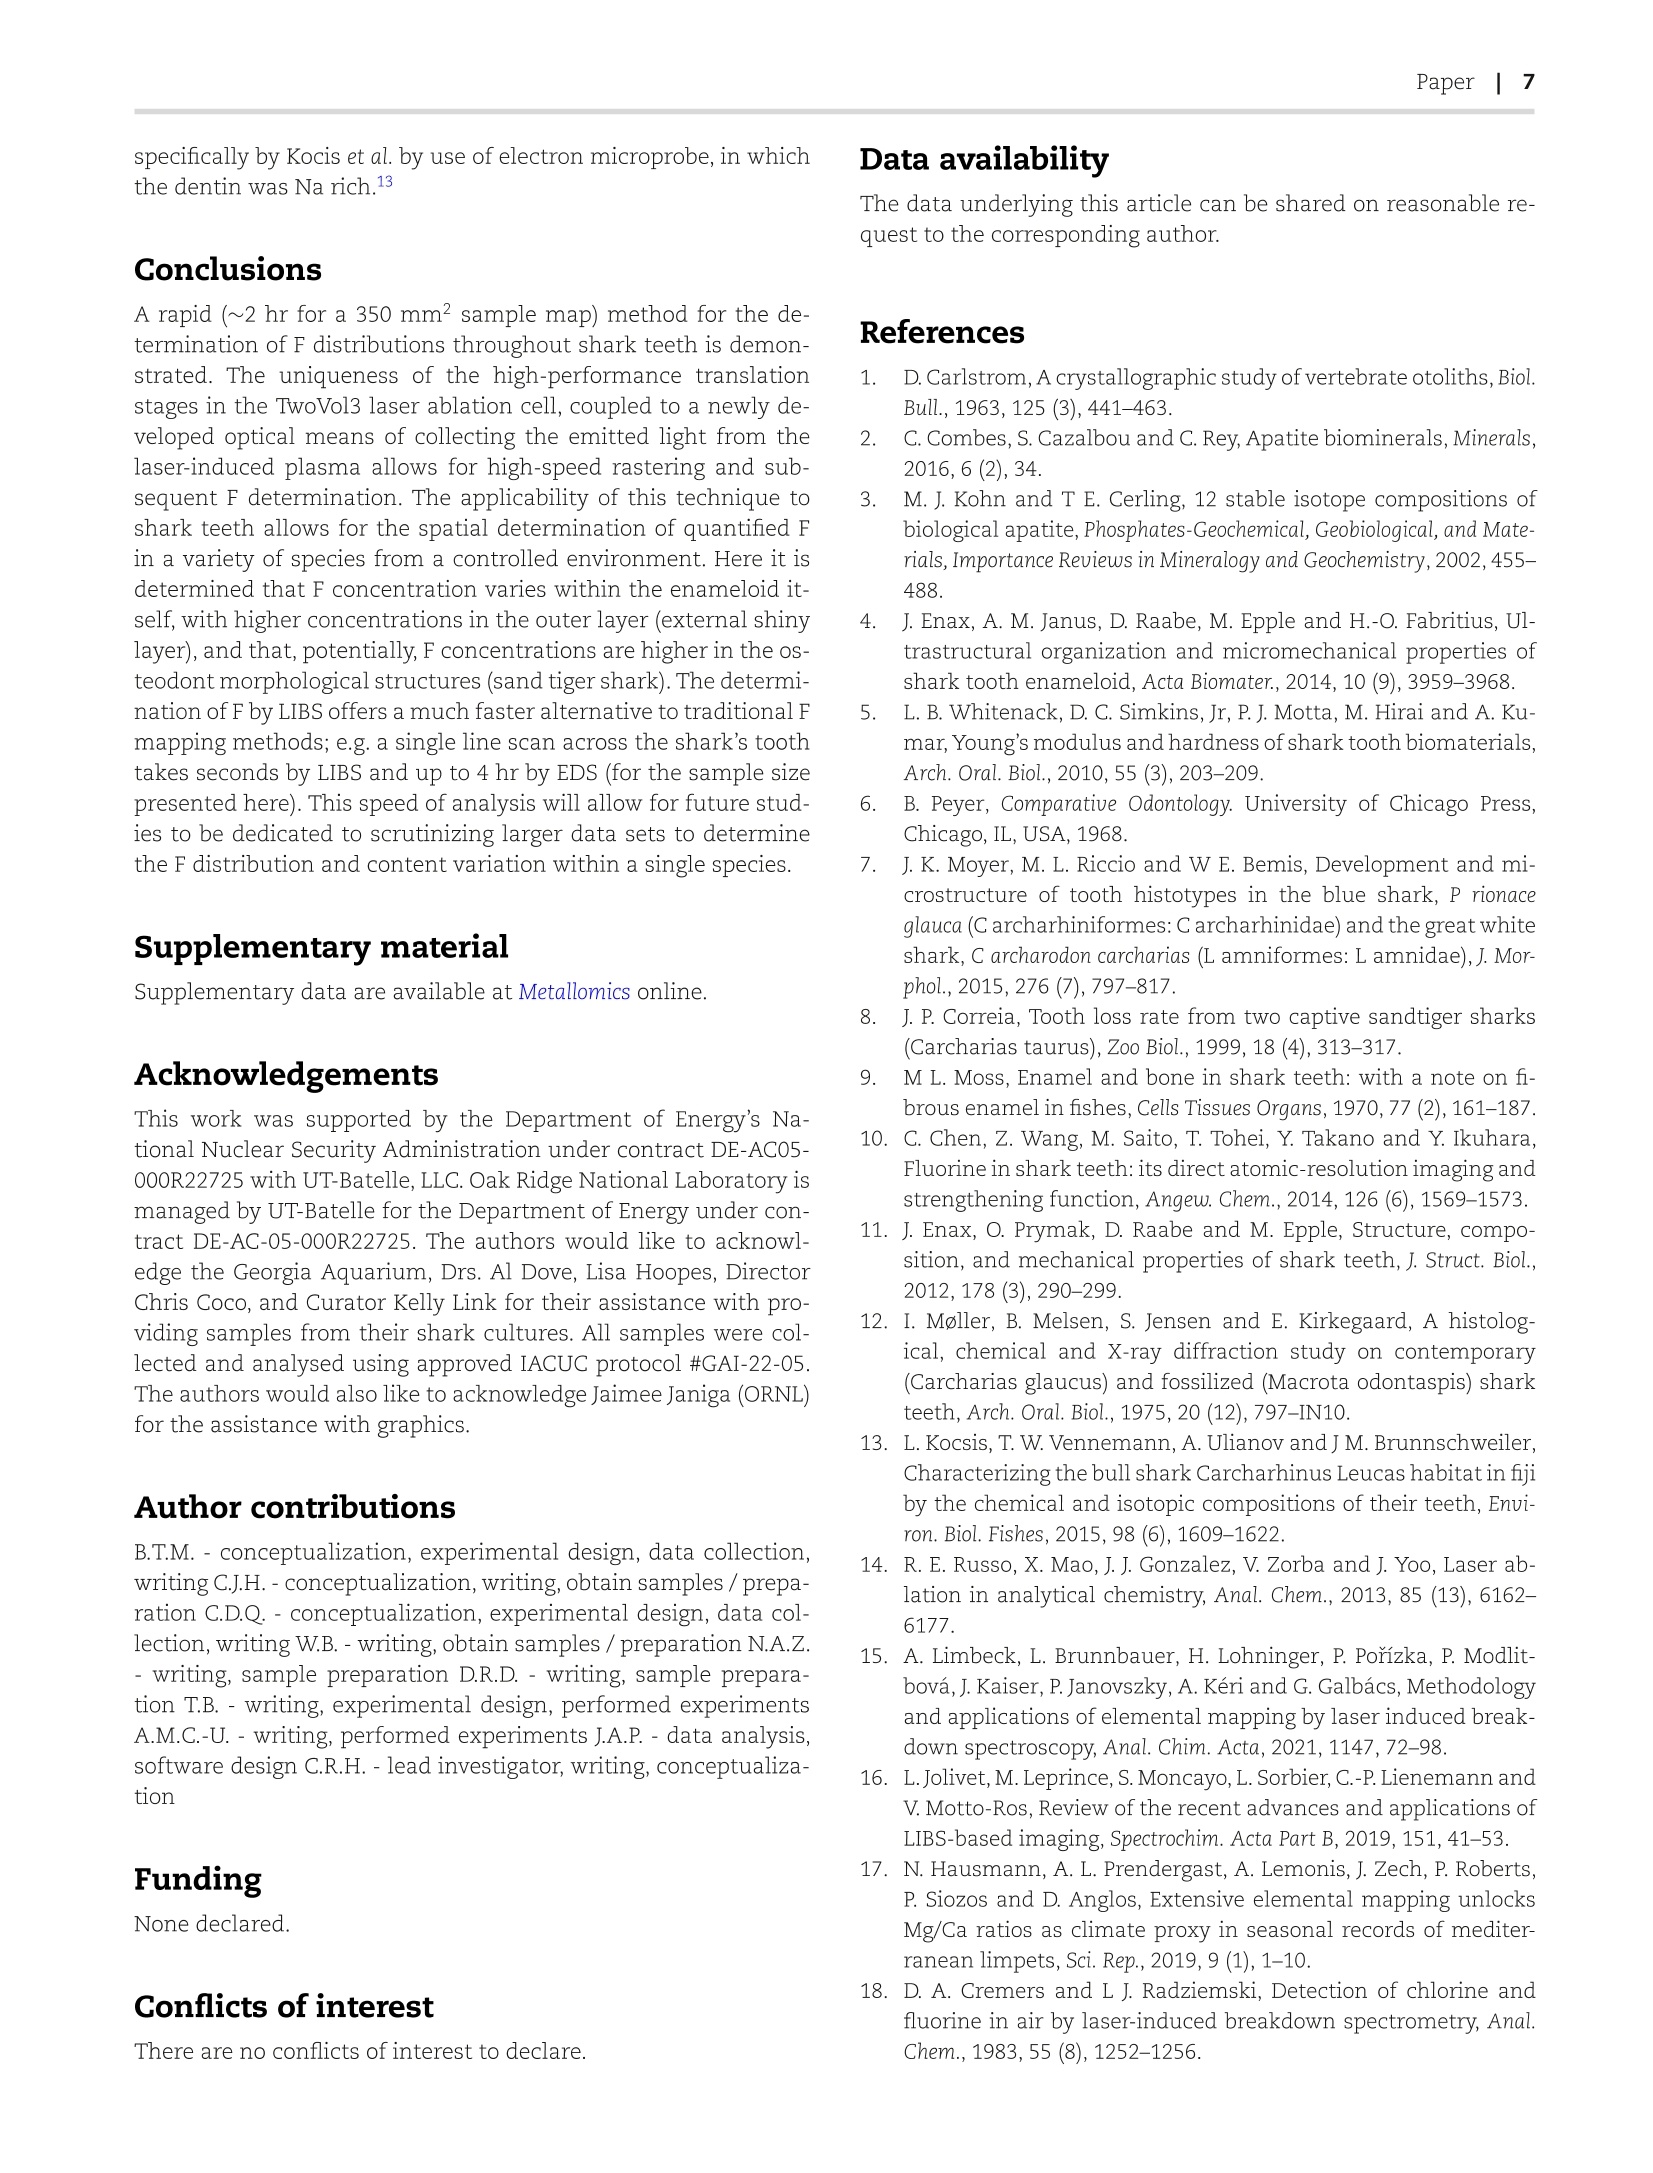
量化环境中快速生长的硬组织中的化学成分,可以为研究史前和现代生态系统提供有价值的信息。化学成分的变化通常与环境条件相关,并有效提供了有关生物体生命的信息。不同物种的鲨鱼每天大约会掉0.1到1.1颗牙齿,这形成了一个在短时间内记录环境变化的独特研究手段。鲨鱼牙齿含有由氟磷灰石[Ca5(PO4)3F]组成的生物矿物相,牙齿内的F分布与牙齿硬度相关。通常F分布是通过样本酸消解、能量色散X射线光谱(EDS)或波长色散光谱来确定的。在这里,提出了激光诱导击穿光谱(LIBS)作为确定鲨鱼牙齿内F分布的替代和快速有效的测试方法。使用激光剥蚀样品池(T woVol3)和创新的LIBS嵌入式采集系统,研究了沙虎鲨(Carcharias Taurus)、虎鲨(Galeocerdo Cuvier)和锤头鲨(Spyrnidae)的鲨鱼牙齿。使用CaF 603 nm波段(CaF,Β2+ → X2+)并使用磷灰石标样进行定量。此外,F测量值与EDS分析相互参考,以验证结果。牙齿内F(603 nm)、Na(589 nm)和H(656 nm)的分布与预期的生物矿物组成和预期的牙齿硬度密切相关。这种高效的方法是目前测定F分布的方法的重大进展,特别是针对大样本(此处为350 mm2)及数量较多的样本测试时。使用50μm斑点,(A)沙虎鲨(横截面位置为红色虚线)、(B)虎鲨和(C)锤头鲨的牙齿中CaF分布通过LIBS获得沙虎鲨中Na(589nm)和H(656nm)的分布OXFORDMetallomics, 14,2022,mfac050https://doi.org/10.1093/mtomcs/mfac050Advance access publication date: 5 July 2022 2Metallomics Paper Determination of fluorine distribution in shark teeth bylaser-induced breakdown spectroscopy Benjamin T. ManardiD1,,*, Christopher J. Hintz2, C. Derrick Quarles, Jr, William Burns, N. Alex Zirakparvar, Daniel R. Dunlap,Toya Beiswenger, Alicia M. Cruz-Uribe5, Joseph A. Petrus and Cole R. Hexel1 1Chemical Sciences Division, Oak Ridge National Laboratory, Oak Ridge, TN, USA, 2Marine and Environmental Sciences, Savannah State University, Savannah, GA,USA, 3Elemental Scientific, Inc., Omaha,NE, USA, 4Nuclear Nonproliferation Division, Oak Ridge National Laboratory, Oak Ridge, TN, USA,School of Earth andClimate Sciences, University of Maine, Orono,ME, USA and 6Elemental Scientific Lasers, Bozeman, MT, USA *Correspondence: Benjamin T.Manard, 1 Bethel Valley Rd.,Oak Ridge, TN 37830, USA. E-mail: manardbt@ornl.gov Abstract Quantifying the chemical composition of fast-growing hard tissues in the environment can shed valuable information in terms ofunderstanding ecosystems both prehistoric and current. Changes in chemical composition can be correlated with environmentalconditions and can provide information about the organism’s life. Sharks can lose 0.1 to 1.1 teeth/day, depending on species, whichoffers a unique opportunity to record environmental changes over a short duration of time. Shark teeth contain a biomineral phasethat is made up of fluorapatite [Cas(PO4)3F],and the F distribution within the tooth can be correlated to tooth hardness. Typically,this is determined by bulk acid digestion, energy-dispersive X-ray spectroscopy (EDS), or wavelength-dispersive spectroscopy. Herewe present laser-induced breakdown spectroscopy (LIBS) as an alternative and faster approach for determining F distribution withinshark teeth. Using a two-volume laser ablation chamber (TwoVol3) with innovative embedded collection optics for LIBS, shark teethwere investigated from sand tiger (Carcharias Taurus), tiger (Galeocerdo Cuvier), and hammerhead sharks (Sphyrnidae). Fluorinedistribution was mapped using the CaF 603 nm band (CaF, B 2)+→x2z+) and quantified using apatite reference materials. Inaddition,F measurements were cross referenced with EDS analyses to validate the findings. Distributions of F (603 nm), Na (589 nm),and H (656 nm) within the tooth correlate well with the expected biomineral composition and expected tooth hardness. This rapidmethodology could transform the current means of determining F distribution, particularly when large sample specimens (350 mm,presented here) and large quantities of specimens are of interest. Keywords: fluorine,laser-induced breakdown spectroscopy (LIBS), mapping, shark teeth Graphical abstract Utilization of laser induced breakdown spectroscopy for the determination of fluorine distribution in sharks teeth. Introduction Apatite (calcium phosphate mineral) exhibits wide biologicaladaptability making it useful in a variety of biological processes,such as the construction of shells and scales, skeletal structure,and tusks and antlers.1,2 Apatite biominerals, or bioapatite,always exist in association with organic matrices. Historically,analysis of bulk elemental composition of whole hard tissues haslimitations in the precision and the spatial distribution of thesemeasurements has hindered impactful interpretations. Isotopiccompositions of bioapatite are dependent on ecology, climate,and geology, evidence of many different factors at the time ofmineralization,including environment,nutrition, and health,can be gleaned from elemental substitution into the parent mineralmatrix.’ In natural environments the chemical compositions of fast-growing hard tissues are often changing in response to biology andchemistry in these ecosystems. Analysis of the hard tissues frommodern and prehistoric species can yield an understanding ofthe environmental variations the organism experienced during itslife. Few animals create hard tissues that are naturally discardedthroughout their life. However, selachimorph elasmobranchs (i.e.sharks) replace their teeth regularly and can lose thousands overtheir lifetime. This creates a record of the environmental condi-tions over relatively discrete time bands (4-10 weeks) throughoutthe shark's life. Sharks have high fluoride content in their teeth, ( Received: April 13, 2022. Accepted: June 17, 2022 ) ( C The Author(s) 2022. Published by Oxford University Press. This is an Open Access article distributed under the terms of the Creative Commons Attribution License ( htt ps ://creat i vecommons.or g / l i censes/ by /4.0 /), which permits unrestricted reuse, distribution, and reproduction in any medium, provided the originalwork is properly cited. This article i s published and distributed under the terms of the Oxford University Press, Standard Journals Publication Model ( https:// a cademic . ou p .com/journ als/ p a ges/open_a c cess/ fu nder _ p ol i cies/chorus/ s tand a rd_publi c at i o n _mo d el ) ) close to stoichiometric fluorapatite in the enameloid; fluoride inthe enamel is higher than in the dentine layer, which is closer toa fluorohydroxyapatite.4 Shark teeth can be separated into two morphological groups.Orthodont teeth retain a prominent pulp cavity, whereas os-teodont teeth are fully formed teeth without a pulp cavity.For both histotypes, mineralization of the osteodentine rootis in the same relative location. In osteodont teeth, the regionwhere the pulp cavity is would be filled with osteodentine follow-ing the mineralization of the root. This suggests that odontoblastsproduce osteodentine in the pulp cavity after root formation.Further, osteodont teeth appear to contain different distributionsof osteo- and orthodentine; specifically, osteodonts completelylack orthodentine. Beyond internal morphology and biolaminatecomposition, there are differences observed in the two histotypesattributed to tooth development and replacement rates. Sandtiger sharks (osteodont) replace teeth at a rate of 1.06 teeth/day,which is faster than 0.13 teeth/day reported for orthodont teeth(tiger shark, hammerhead, etc.).8,9 The replacement rate isrelated to tooth morphology, which in turn is related to targetprey species for the shark; thus, diet may directly impact toothreplacement rate and have a relationship to tooth histotype. Shark teeth contain fluorapatite [Cas(PO4)3F] as a biomineralphase that can contain carbonate as a phosphate substitutionand hydroxide as a fluoride substitution. The presence of F in theenameloid is important as it provides structure to the tooth. Eventhough the P-O bonds are stronger than the Ca-F bonds, with-out the F for the Ca to bond to, the tooth becomes structurallyweaker.10 Tooth hardness and Young's modulus are positively cor-related with calcium and phosphate content, whereas sodium isnegatively correlated.11,12 Overall, hardness and Young's modulusin shark teeth are very similar to those of other vertebrates, in-cluding humans. This is intriguing since fluorapatite is generallyharder than hydroxyapatite.11 The enameloid of osteodont teethand orthodont teeth have the same hardness and Young's mod-ulus, though there are differences within the osteodentine andorthodentine. It is believed this effect is a function of chemicalcomposition and microstructure. Overall, shark teeth have an optimized structure for theSTdifferent functional purposes, like cutting or grasping, but thechemical composition is very similar for tooth morphologicaltypes. Since the use of fluorapatite as a biomineral does notresult in a higher hardness of the tooth, it must serve a differentbut currently unknown purpose.11 For teeth that draw, hold,andpuncture (e.g. sand tigers) most of the stress is focused on thetop of the tooth, near the root. However, there will also be stresslocated along the cutting/puncturing edges. It is possible thatthe purpose of high concentrations of fluorine along the edgeof the tooth is to retain hard, sharp cutting edges. Additionalanalytical data sets are needed to quantify F content as well asspatial distribution to explain the biologic/ecologic drivers andfunctional purpose of the F behavior in shark teeth. Researchhas been dedicated to performing F analysis of sharks teethby various techniques including energy-dispersive X-ray spec-troscopy (EDS),1100wavelength-dispersive spectroscopy (WDS),13and ion-selective potentiometry. Most commonly, EDS and WDSserve as useful techniques for elemental mapping, whereas ion-selective potentiometry would require a sample dissolution priorto analysis. An alternative technique, laser-induced breakdownspectroscopy (LIBS), is proposed here. In LIBS analysis, a short-lived laser pulse is focused onto thesample surface in which a laser-induced plasma is generated.Within this plasma, a finite amount of material (fg-ng's) is vaporized from the sample surface, and subsequently ex-cited/ionized. The emission of the plasma (generated photons)can be captured via collection optics, separated by wavelengthvia a spectrometer, and detected with a respective detector(e.g. charged coupled device)14 This technique, coupled withthe ability to raster samples of interest, allows for the abilityto construct elemental maps (i.e. LIBS imaging).15-17 Since thefirst utilization of LIBS for F analysis by Cremers et al.,18 thetechnique has shown promising results for the detection of F in avariety of applications 19-21 More recently, the ability to raster thesample and generate F distribution maps has been achieved.21,22Quarles et al. utilized the F 685.6 nm emission line to map theF distribution in bastnaesite, ultimately detecting 5-7 wt%.1Weiss et al. more recently demonstrated the ability to map amolecular band (CaF, B?z+→x?习+).22 The ability to detect Fis quite challenging due to its low excitation efficiency. Utiliz-ing a CaF molecular band has been recently reviewed by Gaftet al.,23 and could be the most promising means of detecting thepresence of F, assuming Ca is present. If Ca is not present,studieshave explored online nebulization of a Ca solution, to generatethis molecular species.24 Presented here is the first utilization ofthe LIBS technique and high-speed rastering abilities to rapidlycharacterize the F content in shark teeth, specifically sand tiger,tiger, and hammerhead sharks. This work employs innovativeoptics to collect the emitted light directly at the sample surface(within a two-volume cell) and a high-speed translational stageto rapidly raster the shark teeth (e.g. largest map in this work was19.356x18.100 mm). The work described herein results in highspatial resolution maps of quantifiled F distributions using a newlaser ablation cell (TwoVol3), with extremely high throughput. Inaddition, laser spots of 50-150 um and laser pulse overlappingare explored as options for improved spatial resolution. ExperimentalSample preparation Teeth were acquired through a donation of naturally discardedteeth collected at the Georgia Aquarium (Atlanta, GA, USA) bythe aquarium staff. Species analysed here include sand tiger,hammerhead, and tiger shark. Shark teeth were imbedded inan epoxy mold before sectioning. Buehler (Lake Bluff, IL, USA)EpoThin2 epoxy resin and hardener were mixed per directions:it was stirred for 2 min to allow the mixture to fully saturateand to avoid “soft" molds before being poured into a siliconemold. The shark tooth was placed inside the epoxy and centeredusing a plastic mixing tube. Coronal sections were created bysanding the bottom of the molds to expose the tooth. A series ofincreasing grit wet-dry sandpapers (ca. 400 grit) removed initialmaterial aggressively. Upon approaching target depth for thecoronal section, higher grit papers (1000 grit) slowed materialremoval and improved surface smoothness, removing previoustooling marks. Target layers to expose in the shark tooth includethe shiny-layered enameloid (SLE) and the inner enameloidand dentin. Sagittal cuts were made with a Buehler Isometslow-spinning abrasive 102 mm diamond saw at 1.3 mm spatialintervals, with 0.3 mm sawblade kerf, across the teeth. Lastly forall sections, 5000-grit sandpaper was used for a final polishing tofacilitate a consistent surface for subsequent analysis. Scanning electron microscopy/energy-dispersiveX-ray spectroscopy A thermionic-emission electron gun scanning electron micro-scope (SEM; Hitachi SU3800, Tokyo, Japan) was utilized to Fig. 1 Illustration of the fiber optic position inside the TwoVol3 laserablation cell. collect backscattered electron (BSE) micrographs to illustrate thestructure of the cross-section of a sand tiger shark tooth mountedin epoxy. The analysis was conducted at 25 kV and variable pres-sure at 30 Pa to help minimize charging. Copper tape was placedover the sample to make it more conductive. The entire cross-section of the tooth was imaged using the Zigzag function pro-prietary to Hitachi to stitch together BSE composition images at70xmagnification. The BSE images provide information about thecomposition, with bright regions or higher contrast correspondingto high atomic number elements and darker regions to low atomicnumber. This magnification was chosen to capture most of thetooth with the least number of fields to minimize acquisition time. The SEM is coupled with an EDAX Octane Elect Super energy-dispersive X-ray spectrometer (EDS). The characteristic X-raysgenerated from the sample were detected by the silicon drift de-tector where EDS spectra and line scans are collected, allowingidentification of elements and indicating the distribution of thoseelements within the tooth. EDS line scans were acquired to de-termine the change in concentration of the elements within theenamel and dentin. The elements were manually identified andused to rebuild a weight percentage line scan with a focus on fluo-rine concentration in the enamel versus the dentin. The sand tigerand tiger shark teeth were all analysed at the same settings witha dwell time of 100 ms, a line width of 10 um, with a collectionevery 5 um, and a frame number of 128. Laser-induced breakdown spectroscopy An Elemental Scientific Lasers imageGEO BS (Elemental ScientificLasers, Bozeman, MT, USA) laser ablation system was employedfor the high-speed elemental (in this case the focus is on fluorine)imaging of the shark teeth. The experimental set up is depicted inFig.1; the laser ablation system consists of a 193 nm excimer laserand a TwoVol3 ablation chamber. The 193 nm pulsed laser was de-livered to the sample through an XYR beam aperture (this workutilized square spots 50-150 um in width) for enhanced spatialresolution. Typical LIBS mapping through this manuscript utilized100% laser energy, which resulted in a beam energy density at thesample surface of 10.7 J cmat 20 Hz. For LIBS analysis, the emit-ted light from the laser-induced plasma was collected through anoptical fiber situated directly into the “analytical cup”of the Two-Vol3 chamber that is part of the imageGEOLBS platform (detailedin Fig. 1). The fiber optic was distributed into a 5-channel spec-trometer (fixed grating Czerny-Turner design) with the ability to Fig. 2 LIBS spectra (580-630 nm) showing the CaF band for epoxy usedsample mounting, and the dentin/enamel of a sand tiger shark. detect from 188-1099 nm utilizing a charge coupled device detec-tor. A spectrometer delay of 0.2 us and spectrometer integrationtime of 30 us were employed. LIBS spectra were processed (atomicline identification, peak integration, and creation of 2D elementalimages) in the iolite 4 software (Elemental Scientific Lasers).25,26 Inshort, the LIBS spectra were integrated such that the peak areaswere determined by selecting the left and right integration win-dows around the targeted emission line/band. A background wassubtracted from each peak utilizing a background integrated areaadjacent to the peak. For example, the CaF was integrated from599.2-607.7 nm and the selected background for subtraction wasfrom points at 596.4 and 607.9 nm. Results and discussionExploration of fluorine mapping in shark teeth Initially, a sand tiger shark tooth was analysed by LIBS to deter-mine/verify and optimize for fluorine detection in the enamel anddentin layers of the tooth. The emission of the CaF 603 nm band,A’II-X22+,is presented in Fig. 2. It is clearly seen that the intensityof the CaF band is ~3x higher in the enamel layer in comparisonto the dentin. This trend is expected,and has been described pre-viously 10,13 Specifically, Epple et al.,2 reported that extant sharkteeth (the specimen analysed in this study) have F present in theenameloid only, whereas extinct shark teeth had F in both theenameloid and the dentin. The atomic F line at 685.6nm was notdetected, which is most likely a result of the lower laser energyoutput from the 193 nm laser (as compared to previously pub-lished work using 266 nm lasers). The laser energy, fluence, andspot sizes in the imageGEOLIBS were optimized for laser ablation-inductively coupled plasma-mass spectrometry (LA-ICP-MS).The CaF signal was optimized using 1 L min- He gas to remove at-mospheric air from the cell (requirement to detect O and H in thesamples) and to optimize conditions for LIBS and LA-ICP-MS datanlzto be collected simultaneously in the future. The spectrometer de-lay was found to be optimal at 0.2 us and was determined by mon-itoring the responses for CaF 603 nm, H 656 nm, and O 777 nm. After signal optimization, a tiger shark tooth was analysed un-der different laser sampling conditions to determine the best pa-rameters for comparing the three different shark species. Laserspot sizes of 50, 100, and 150 um (square spots were used in allexperiments, e.g. 50 um is 50x50 um) were used to map the dis-tribution of CaF (Fig.3). Raster“image" mode was used for thesemaps in such that no overlap in laser shots occurred in the x-ory-axis. The analysis of this tiger shark was performed over an areaof 16.273×11.400 mm. With the respective laser spot sizes of the150, 100, and 50 um, this resulted in 8208, 18 582,and 73 676LIBS spectra/sample map, respectively. The 150 um spot size Max 0 Fig. 3 Comparison of CaF distribution in a tiger shark tooth using varying spot sizes of 50 um (B), 100 um (C), and 150 um (D). Fig. 4 Comparison of CaF distribution in a tiger shark tooth using different stage scan speeds of 3000 um s- (B), 2000 um s-1(C), and 1000 um s-1(D). resulted in much higher intensities (400 000 a.u. max signal) thanthe 100 um (150 000 a.u. max signal) and 50 um (30 000 a.u. maxsignal) CaF maps. However, the resolution is improved greatly withthe 50 um CaF map compared to the 100 and 150 um maps. In aneffort to maximize signal and obtain higher resolution, the 150 um measurements were repeated using different stage scan speeds,resulting in increased overlap of laser shots at slower speedsFigure 4 displays the CaF distribution for three stages speeds:3000, 2000, and 1000 um s-. Improvement in the CaF distribu-tion can be noticed in the enamel of the tooth as more laser shots (A) (ne)mu, 导 y=3637.5x R²=0.9964 1.21.11.00.90.80.70.60.580.4 0.3 0.2 (B) y=0.2936XR²=0.9953 Table 1. CaF response curves and linearity for the 50, 100,and150 um laser spot calibration 50 um y=3638x 109 0.9964 100 um y=25065x 845 0.9955 150 um y=70616x 3000 0.9929 overlap, but the resolution does not reach the same quality as the50 um map. Therefore, it was determined that the 50 um laserspot size was the best option for the CaF distribution maps in thisstudv. Quantification of fluorine in shark teeth Ideally, matrix-matched reference materials (RMs) are necessaryfor quantification in LIBS-based analysis.28 Here, to match thebioapatite composition of the shark teeth, five apatite sampleswith varying F content previously utilized by McCubbin et a1.29,30were mounted, polished, and measured by LIBS. These apatiteRMs include AP003, AP004, AP005, AP018, and AP023, reported inMcCubbin et al.,30 and have F contents ranging from ~1.5 to 4 wt%.The same mapping conditions were applied, such that any matrixeffects were considered. The RMs were analysed with 50, 100,and150 um spot sizes (as done for the LIBS imaging), and their respec-tive calibration curve responses can be found in Table 1. Theseanalyses were taken such that 30 laser pulses were collected. The30 individual analyses were integrated,and the respective averageand standard deviation was utilized for the generation of the ex-ternal calibration curve. The calibration curve for the 50 um laserspot is shown in Fig. 5A. Additionally, to normalize for the Ca thatcould be present in the RM, and subsequently the shark tooth, theCaF molecular band was ratioed to the Ca intensity, at 422nm,andplotted in Fig. 5B. It should be noted that the Ca content in theRMs was 54.7 ±0.6 wt%. This normalization helps demonstratethe contribution of the F species to the CaF molecular band. Comparison of fluorine distribution in differentspecies of shark teeth The F distribution in three shark species (sand tiger, tiger,and hammerhead sharks) is depicted in Fig. 6. To achieve theanalysis of these three images, the sand tiger shark analy-sis area was 19.356×18.100 mm with 140 094 acquired LIBSspectra, and ~120 min analysis time. The tiger shark analysis area was 16.273 ×11.400 mm with 73 676 acquired spectra,and ~64 min analysis time. The hammerhead shark area was10.732x 7.500 mm, with 32 250 acquired spectra, and ~28 minanalysis time. It has been previously suggested that ultimatelythere are three layers within the enamel of a shark tooth: an in-ternal tangled-bundle enameloid (TBE), a middle parallel-bundledenameloid (PBE), and an external SLE 31 Specifically, Cury et al.,described that the PBE and TBE have a very smooth transition be-tween the two. However, a more distinct difference is found be-tween the PBE + TBE and the SLE layer, which suggests that thereare two “units" of the enamel: a superficial (shiny) layer and aninner layer 4,31 The results presented here ultimately show differ-ent regions of F within the enamel. There appears to be a higherconcentration of F in the SLE layer, particularly in the sand tigerand tiger shark; additionally, there appears to be high F concen-tration toward the tip of the tooth in comparison to near the basallayer (top). As mentioned earlier, these findings of F concentrationare not widely known, and ultimately unexplored. It is predictedthat the high F content along the outer portions of the tooth isto retain hard, sharp cutting edges. Another consideration wouldbe the difference in tooth functionality. It is interesting to notethat the tooth with the higher F concentration (sand tiger) is ofosteodont morphology, whereas the tiger and hammerhead sharkteeth would be of orthodont morphology. Further studies wouldneed to be explored,investigating the F content, with a larger dataset of teeth from a controlled environment (such as these) A dissection of the sand tiger shark tooth was performed alongwith subsequent LIBS mapping for F content. The location ofthe horizontal cross-section is highlighted in Fig. 6A (with ar-rows pointing to the section location) and its respective SEMimage is in Fig. 7A. To construct the SEM image, a total of 29fields with an overlap of 10% were collected to assemble thepanorama image of the tooth. The F distribution, generated fromthe LIBS data, of the horizontal cross-section can be seen in Fig. 7B,which corresponds well with the vertical cross-section distribu-tion. This sand tiger shark horizontal cross-section analysis areawas 3.815 ×2.800 mm with 4312 acquired LIBS spectra, and~4 min analysis time. Additionally, line scans from EDS measure-ments were also generated and compared to the LIBS line scan,from approximately the same location. This line scan compari-son can be seen in Fig. 7C. For comparison, the EDS line scan wasachieved via the combination of two EDS line scans (due to spa-tial limitations of the SEM-EDS configuration). Each line scan took~2 hr (4 hr in total) compared to ~15 s required for the LIBS line Fig. 6 CaF distribution in teeth of the (A) sand tiger shark (with cross-section location-red dashed line), (B) tiger shark, and (C) hammerhead sharkusing the 50 um spot method. Fig. 7 (A) SEM image of the horizontal cross-section of the sand tiger shark tooth, (B) CaF distribution (obtained by LIBS) in the horizontal cross-sectionof the sand tiger shark tooth, (C) LIBS and EDS cross-section F profile across the horizontal cross-section of the sand tiger shark tooth scan. This comparison between the LIBS and EDS techniques trulyhighlights the speed of analysis that can be achieved via the LIBSimaging, while maintaining the similar spatial profile. When com-paring the data within the dentin of the two methods, the LIBStransient yielded an average concentration of 1.07 ±0.14 and theEDS was 1.01 ±0.81,highlighting the significant improvement inprecision of the LIBS data (~12% versus ~80%). The Ca (422 nm)transient was also compared, such that a comparison to the CaFemission line could be made. It should be noted that the differ-ence between the Ca within the enamel and dentin was ~1.3×(higher in the enamel) whereas the difference in the CaF was~8.2x (higher in the enamel), further demonstrating the contri-bution from the F that is present. Ultimately, even in the smallsample size (3.8×2.8 mm) the F distribution is clear within theenameloid region. The detailed EDS analyses, with respective linescans can be seen in Supplementary Figs. S1 and S2. The LIBS andEDS measurements correspond well regarding the F distributionwithin the shark teeth. Fig. 8 Na (589 nm) and H (656 nm) distribution in the sand tiger sharkvia LIBS mapping Lastly, since the LIBS spectra provide truly simultaneous de-tection of elements for each laser pulse, additional informationcan be correlated. The elemental distribution of Na (589 nm) andH (656 nm) are shown in Fig. 8. The F appears to replace the H (as hydroxide) in the enamel of the tooth. The H distribution ishighest in the root of the tooth and decreases toward the tip ofthe tooth in the dentin region. The Na distribution is highest inthe dentin region near the tip of the tooth and is the lowest in theroot of the tooth. In addition, there is a decrease of Na found inthe enamel region that corresponds well with the tooth hardnessand Young's modulus. This trend has been previously described, Conclusions A rapid (~2 hr for a 350 mm’ sample map) method for the de-termination of F distributions throughout shark teeth is demon-strated. The uniqueness of the high-performance translationstages in the TwoVol3 laser ablation cell, coupled to a newly de-veloped optical means of collecting the emitted light from thelaser-induced plasma allows for high-speed rastering and sub-sequent F determination. The applicability of this technique toshark teeth allows for the spatial determination of quantified Fin a variety of species from a controlled environment. Here it isdetermined that F concentration varies within the enameloid it-self, with higher concentrations in the outer layer (external shinylayer), and that, potentially, F concentrations are higher in the os-teodont morphological structures (sand tiger shark). The determi-nation of F by LIBS offers a much faster alternative to traditional Fmapping methods; e.g. a single line scan across the shark's toothtakes seconds by LIBS and up to 4 hr by EDS (for the sample sizepresented here). This speed of analysis will allow for future stud-ies to be dedicated to scrutinizing larger data sets to determinethe F distribution and content variation within a single species. Supplementary material Supplementary data are available at Metallomics online Acknowledgements This work was supported by the Department of Energy's Na-tional Nuclear Security Administration under contract DE-AC05-000R22725 with UT-Batelle, LLC. Oak Ridge National Laboratory ismanaged by UT-Batelle for the Department of Energy under con-tract DE-AC-05-000R22725. The authors would like to acknowl-edge the Georgia Aquarium, Drs. Al Dove, Lisa Hoopes, DirectorChris Coco, and Curator Kelly Link for their assistance with pro-viding samples from their shark cultures. All samples were col-lected and analysed using approved IACUC protocol #GAI-22-05.The authors would also like to acknowledge Jaimee Janiga (ORNL)for the assistance with graphics. Author contributions B.T.M.-conceptualization, experimental design, data collection,writing C.J.H. -conceptualization, writing, obtain samples / prepa-ration C.D.Q.- conceptualization, experimental design, data col-lection, writing W.B.-writing, obtain samples / preparation N.A.Z.- writing, sample preparation D.R.D.- writing, sample prepara-tion T.B. - writing, experimental design, performed experimentsA.M.C.-U. -writing, performed experiments J.A.P. - data analysis,software design C.R.H.-lead investigator, writing, conceptualiza-tion Funding None declared. Conflicts of interest There are no conflicts of interest to declare. The data underlying this article can be shared on reasonable re-quest to the corresponding author. ( References ) 1. D. Carlstrom, A crystallographic study of vertebrate otoliths,Biol.Bull., 1963, 125 (3), 441-463. 2 C. Combes, S. Cazalbou and C. Rey, Apatite biominerals, Minerals,2016,6(2),34. ( 3. M. J. Kohn and T E. Cerl i ng, 12 stable isotope compositions of biological apatite,Phosphates-Geochemical, Geobiological, and Mate-rials, Importance Reviews in Mineralogy and Geochemistry, 2002,455- 4 88. ) ( 4 . J. Enax, A. M. Janus, D . Raabe, M. Epple and H.-O. Fabritius, Ul-trastructural organization and micromechanical properties of shark tooth enameloid, Acta Biomater. , 2014, 10(9),3959-3968. ) ( 5. L. B. Whitenack, D. C. Simkins,Jr, P. J. Motta , M. Hirai and A. Ku- mar, Young's modulus and hardness of shark tooth biomaterials, Arch. Oral . Biol., 2010,55(3),203-209. ) ( 6. B. Peye r , Comparative Odontology. University of Chicago Press,Chicago, IL , USA, 1968. ) 7 J. K. Moyer, M. L. Riccio and W E. Bemis, Development and mi-crostructure of tooth histotypes in the blue shark, P rionaceglauca (C archarhiniformes: C archarhinidae) and the great whiteshark, C archarodon carcharias (L amniformes: L amnidae),J. Mor-phol., 2015, 276 (7),797-817. ( 8 J. P. Correia, Tooth loss rate from two captive sandtiger sharks (Carchar i as taurus), Zoo Biol., 1999,18(4),313-317. ) ( 9 M L. Moss, Enamel and bone in shark teeth: with a note on fi - brous enamel i n fishes , Cells T i ssues Organs, 1970, 77 (2),161 - 187. ) ( 10. C. Chen, Z. Wang, M. Saito, T. Tohei, Y. Takano and Y. Ikuhara,Fluorine in shark teeth: its direct atomic-resolution imaging andstrengthening function, Angew. Chem., 2014,126(6),1569 - 1573. ) ( 11. J. Enax, O. Prymak, D. Raabe and M. Epple , Structure, compo- si t ion, and mechanical properties of shark teeth,J. Struct. Biol . , 2012,178(3),290 - 299. ) 12.I. Moller, B. Melsen, S. Jensen and E. Kirkegaard, A histolog-ical, chemical and X-ray diffraction study on contemporary(Carcharias glaucus) and fossilized (Macrota odontaspis) sharkteeth, Arch. Oral. Biol., 1975,20 (12),797-IN10. 13.L. Kocsis, T. W. Vennemann, A. Ulianov and JM. Brunnschweiler,Characterizing the bull shark Carcharhinus Leucas habitat in fijiby the chemical and isotopic compositions of their teeth,Enui-ron. Biol. Fishes, 2015,98(6), 1609-1622. ( 14. R. E. Russo,X. Mao,J. J. Gonzalez, V. Zorba and J . Yoo, Laser ab - lation in analytical chemistry, Anal. Chem., 2013,85 (13), 6162 - 6177. ) 15. A. Limbeck, L. Brunnbauer, H. Lohninger, P. Porizka, P. Modlit-bova,J. Kaiser, P. Janovszky, A. Keri and G. Galbacs, Methodologyand applications of elemental mapping by laser induced break-down spectroscopy, Anal. Chim. Acta, 2021, 1147,72-98. 16. L. Jolivet, M. Leprince,S. Moncayo,L. Sorbier,C.-P. Lienemann andV. Motto-Ros, Review of the recent advances and applications ofLIBS-based imaging, Spectrochim. Acta Part B, 2019,151,41-53. 17. N. Hausmann, A. L. Prendergast, A. Lemonis,J. Zech, P. Roberts,P. Siozos and D. Anglos, Extensive elemental mapping unlocksMg/Ca ratios as climate proxy in seasonal records of mediter-ranean limpets, Sci. Rep.,2019,9 (1),1-10. 18.D. A. Cremers and L J. Radziemski, Detection of chlorine andfluorine in air by laser-induced breakdown spectrometry, Anal.Chem.,1983,55(8),1252-1256 19.C. K. Williamson, R. G. Daniel, K. L. McNesby and A W. Miziolek,Laser-induced breakdown spectroscopy for real-time detectionof halon alternative agents, Anal. Chem., 1998, 70 (6),1186-1191. 20.M. Gondal, Y. Maganda, M. Dastageer, F. Al Adel, A. Naqvi andT. Qahtan, Detection of the level of fluoride in the commer-cially available toothpaste using laser induced breakdown spec-troscopy with the marker atomic transition line of neutral fluo-rine at 731.1 nm, Opt. Laser Technol., 2014,57,32-38. 21.(C. D. Quarles, J. J. Gonzalez, L. J. East, J. H. Yoo, M. Morey and R E.Russo, Fluorine analysis using laser induced breakdown spec-troscopy (LIBS), J. Anal. At. Spectrom.,2014,29 (7),1238-1242. 22. M. Weiss,Z. Gajarska, H. Lohninger,M. Marchetti-Deschmann,G.Ramer, B. Lendl and A. Limbeck, Elemental mapping of fluorineby means of molecular laser induced breakdown spectroscopy,Anal. Chim. Acta, 2022, 1195,339422. 3.M. Gaft, L. Nagli, I. Gornushkin and Y. Raichlin,Review on recentadvances in analytical applications of molecular emission andmodelling, Spectrochim. Acta Part B, 2020, 173, 105989. 24. C. Alvarez-Llamas, J. Pisonero and N. Bordel, A novel approachfor quantitative LIBS fluorine analysis using CaF emission incalcium-free samples,J Anal. At. Spectrom., 2017,32(1),162-166. 25.C. Paton, J. Hellstrom, B. Paul,J. Woodhead and H J. Iolite, Free-ware for the visualisation and processing of mass spectrometricdata,J. Anal. At. Spectrom., 2011,26(12),2508-2518. ( 26 B. Paul, C. Paton, A. Norris,J . Woodhead,J. Hellstrom,J. Hergt and A. Greig, CellSpace: a module for creating spatially registeredlaser ablation images within the iolite freeware environment,J. Anal . At . Spectrom.,2012,27 (4 ) ,700-706. ) 27..A. Lubke, J. Enax, K. Loza, O. Prymak, P. Gaengler, H.-O. Fabri-tius, D. Raabe and M. Epple, Dental lessons from past to present:ultrastructure and composition of teeth from plesiosaurs, di-nosaurs,extinct and recent sharks,RSC Adu.,2015,5(76),61612-61622. 28 D. W. Hahn and N. Omenetto, Laser-induced breakdown spec-troscopy (LIBS), part II: review of instrumental and methodolog-ical approaches to material analysis and applications to differ-ent fields, Appl. Spectrosc., 2012, 66(4),347-419. 29. F.M.McCubbin, A. Steele, E. H. Hauri,H. Nekvasil, S. Yamashitaand R. J. Hemley, Nominally hydrous magmatism on the Moon,Proc. Natl. Acad. Sci., 2010, 107 (25),11223-11228. 30. F. M.McCubbin, E. H. Hauri, s. M. Elardo, K. E. Vander Kaaden,J. Wang and C. K. Shearer, Jr, Hydrous melting of the martianmantle produced both depleted and enriched shergottites, Geol-ogy, 2012, 40 (8),683-686. ( 31G. Cuny and S. Risnes, The enameloid microstructure of theeteethoff:synechodontiform sharks (Chond r ichthyes: Neoselachii), PalArch’s J. Vertebr . Palaeontol.,,2005,3 (2) , 1-19 )
确定
还剩6页未读,是否继续阅读?

产品配置单
上海凯来仪器有限公司为您提供《激光诱导击穿光谱法测定鲨鱼牙齿中氟的分布》,该方案主要用于牙齿中生化检验检测,参考标准--,《激光诱导击穿光谱法测定鲨鱼牙齿中氟的分布》用到的仪器有ESLumen LIBS: LIBS & LA-ICP-MS 同步进行
推荐专场
该厂商其他方案
更多