


方案详情
文
线粒体活性氧(ROS)的过度产生是糖尿病并发症发生的中心机制。最近,缺氧已被证实在糖尿病中发挥额外的致病作用。在这项研究中,我们假设ROS 过量产生是继发于高血糖抑制缺氧诱导因子-1 (HIF-1)导致的缺氧反应受损。研究人员分析了暴露于低氧环境下的健康人和1 型糖尿病患者血液中的ROS 水平。在糖尿病小鼠模型中,研究了肾mIMCD-3 细胞和肾脏中HIF-1、葡萄糖水平、ROS 产生及其功能后果的关系。研究发现在糖尿病患者中,低氧暴露会增加循环ROS,但在非糖尿病患者中则不会;高糖通过HIF 脯氨酸羟化酶(PHD)依赖机制抑制了糖尿病动物的缺氧细胞和肾脏中的HIF-1 的表达;HIF-1 信号通路受损,通过丙酮酸脱氢酶激酶1 (PDK1)介导的线粒体呼吸增加,促进线粒体ROS 的过量产生;在糖尿病患者中,HIF-1 功能的恢复降低了持续高血糖情况下ROS 的过度产生,并对细胞凋亡和肾损伤具有保护作用。表明HIF-1 的抑制在糖尿病线粒体ROS 过剩产生中起着核心作用,并且是糖尿病并发症的潜在治疗靶点。
方案详情

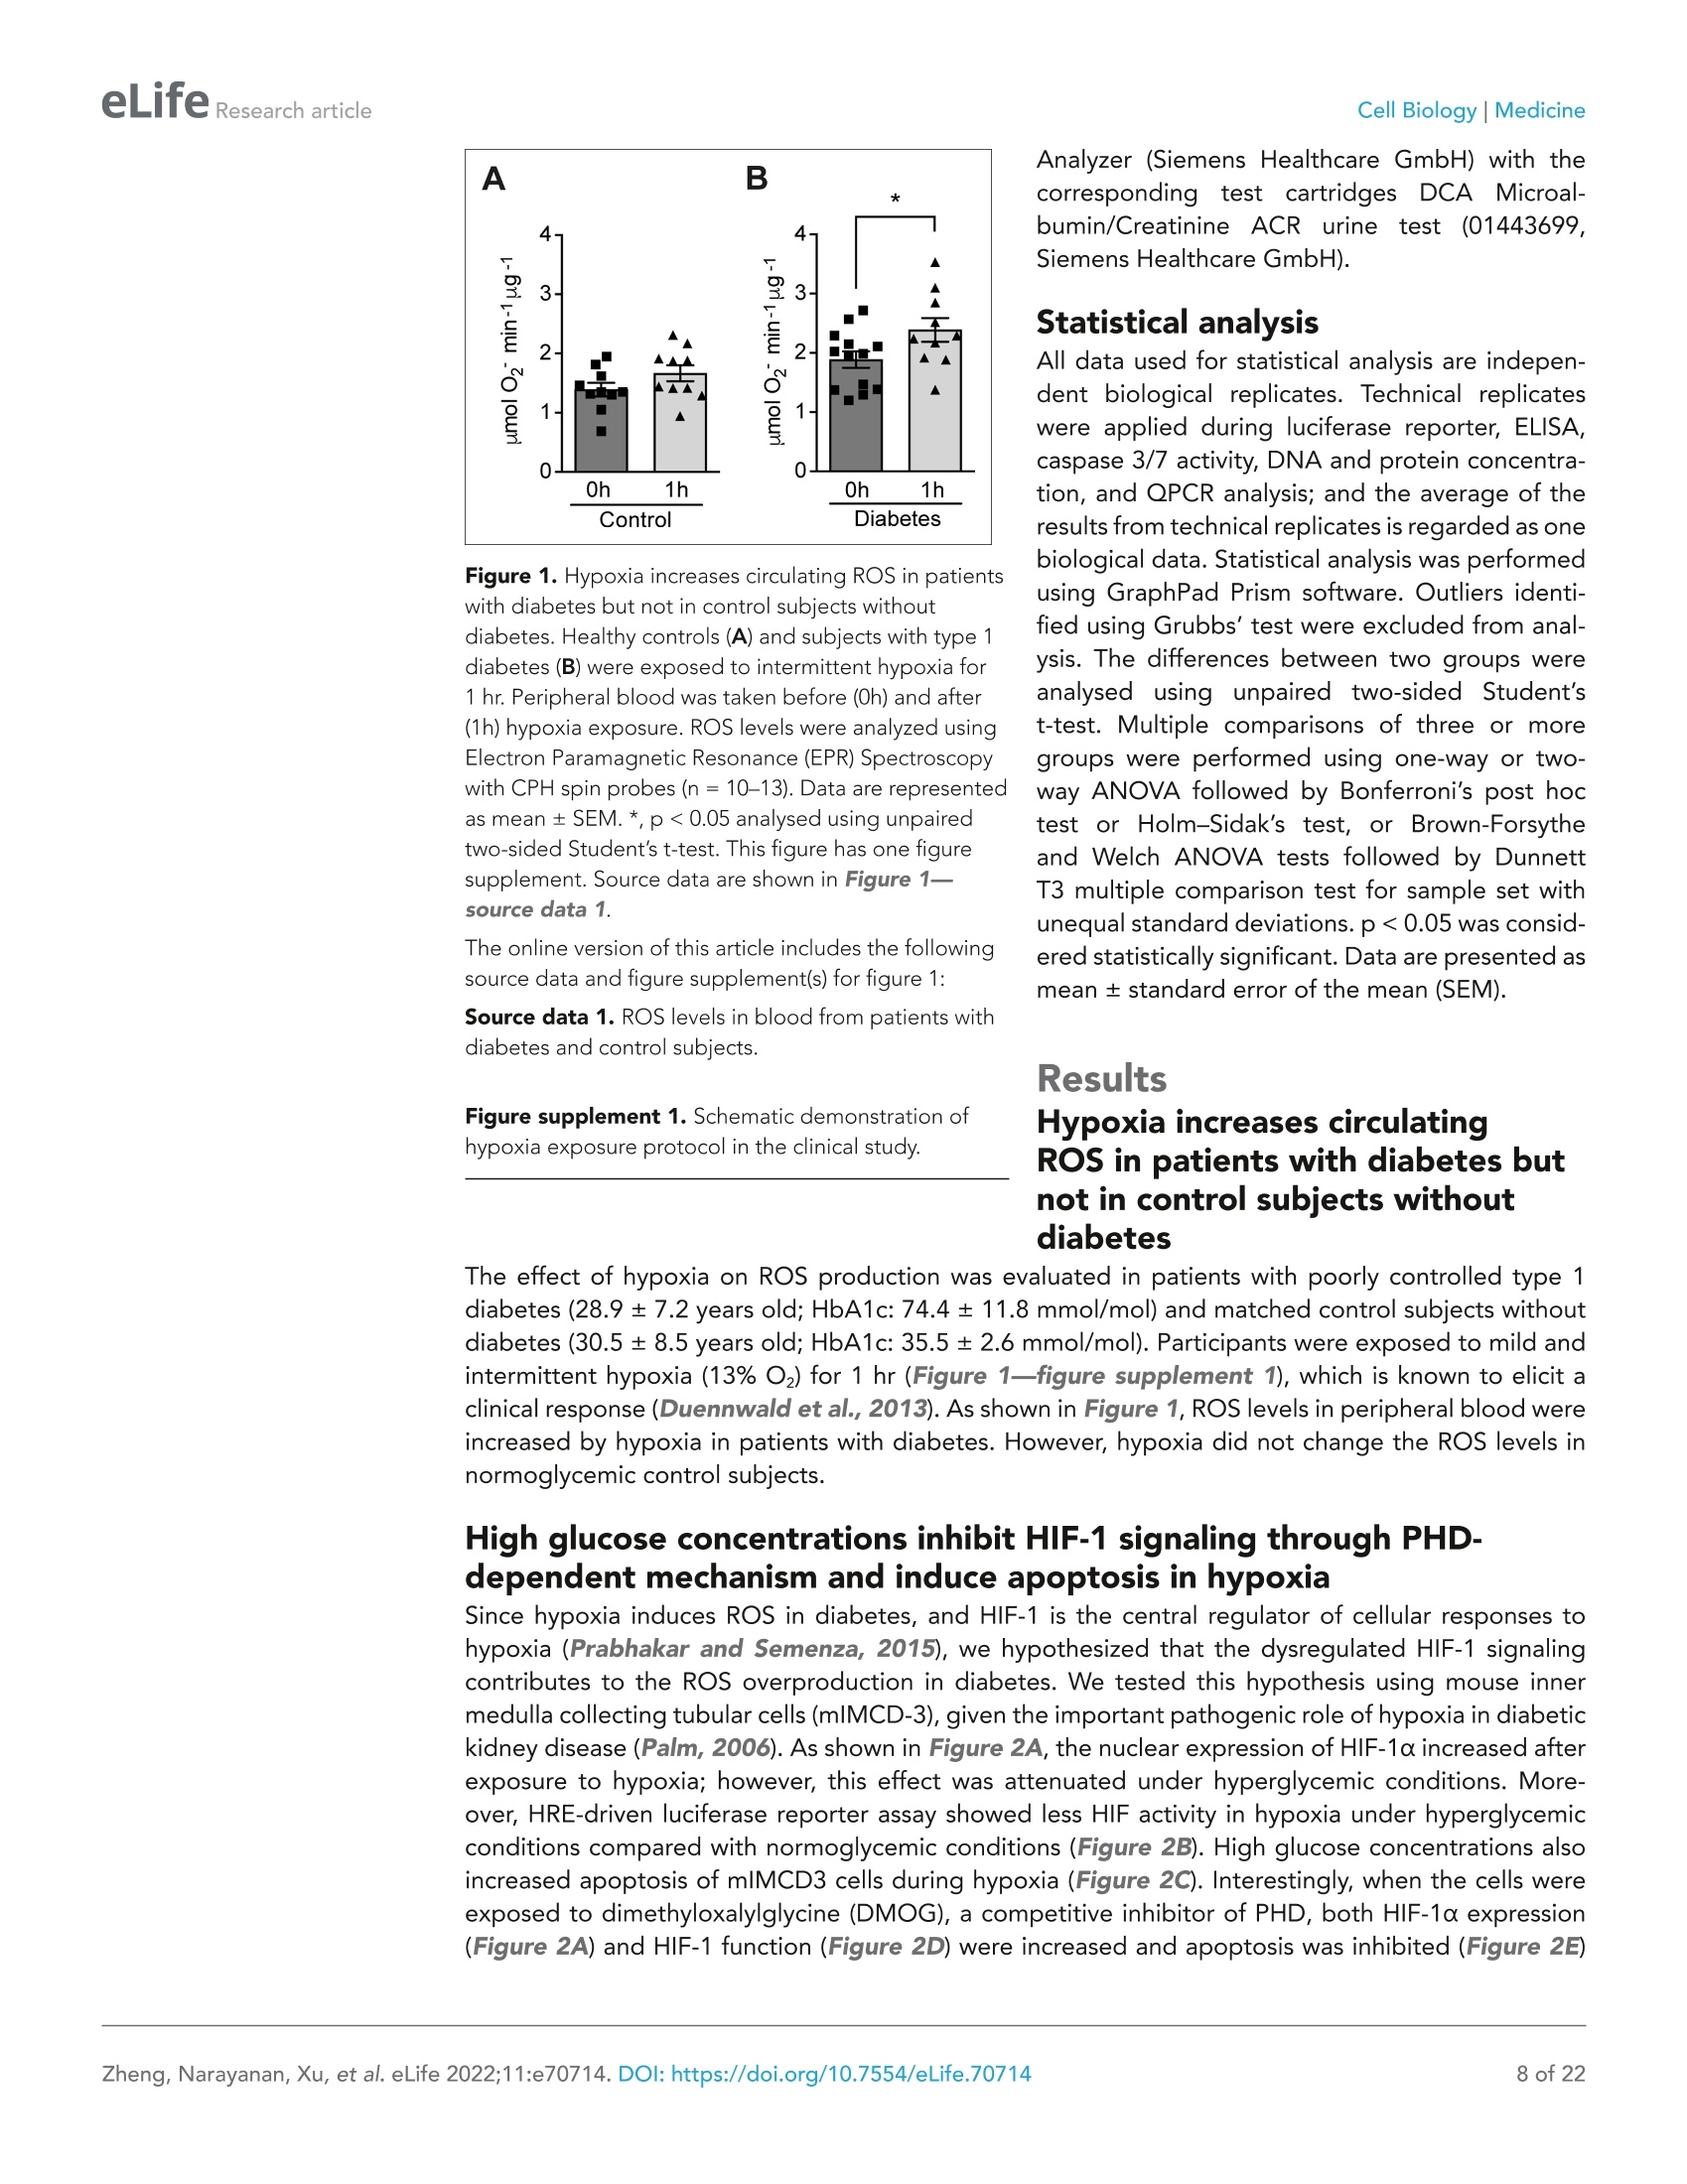
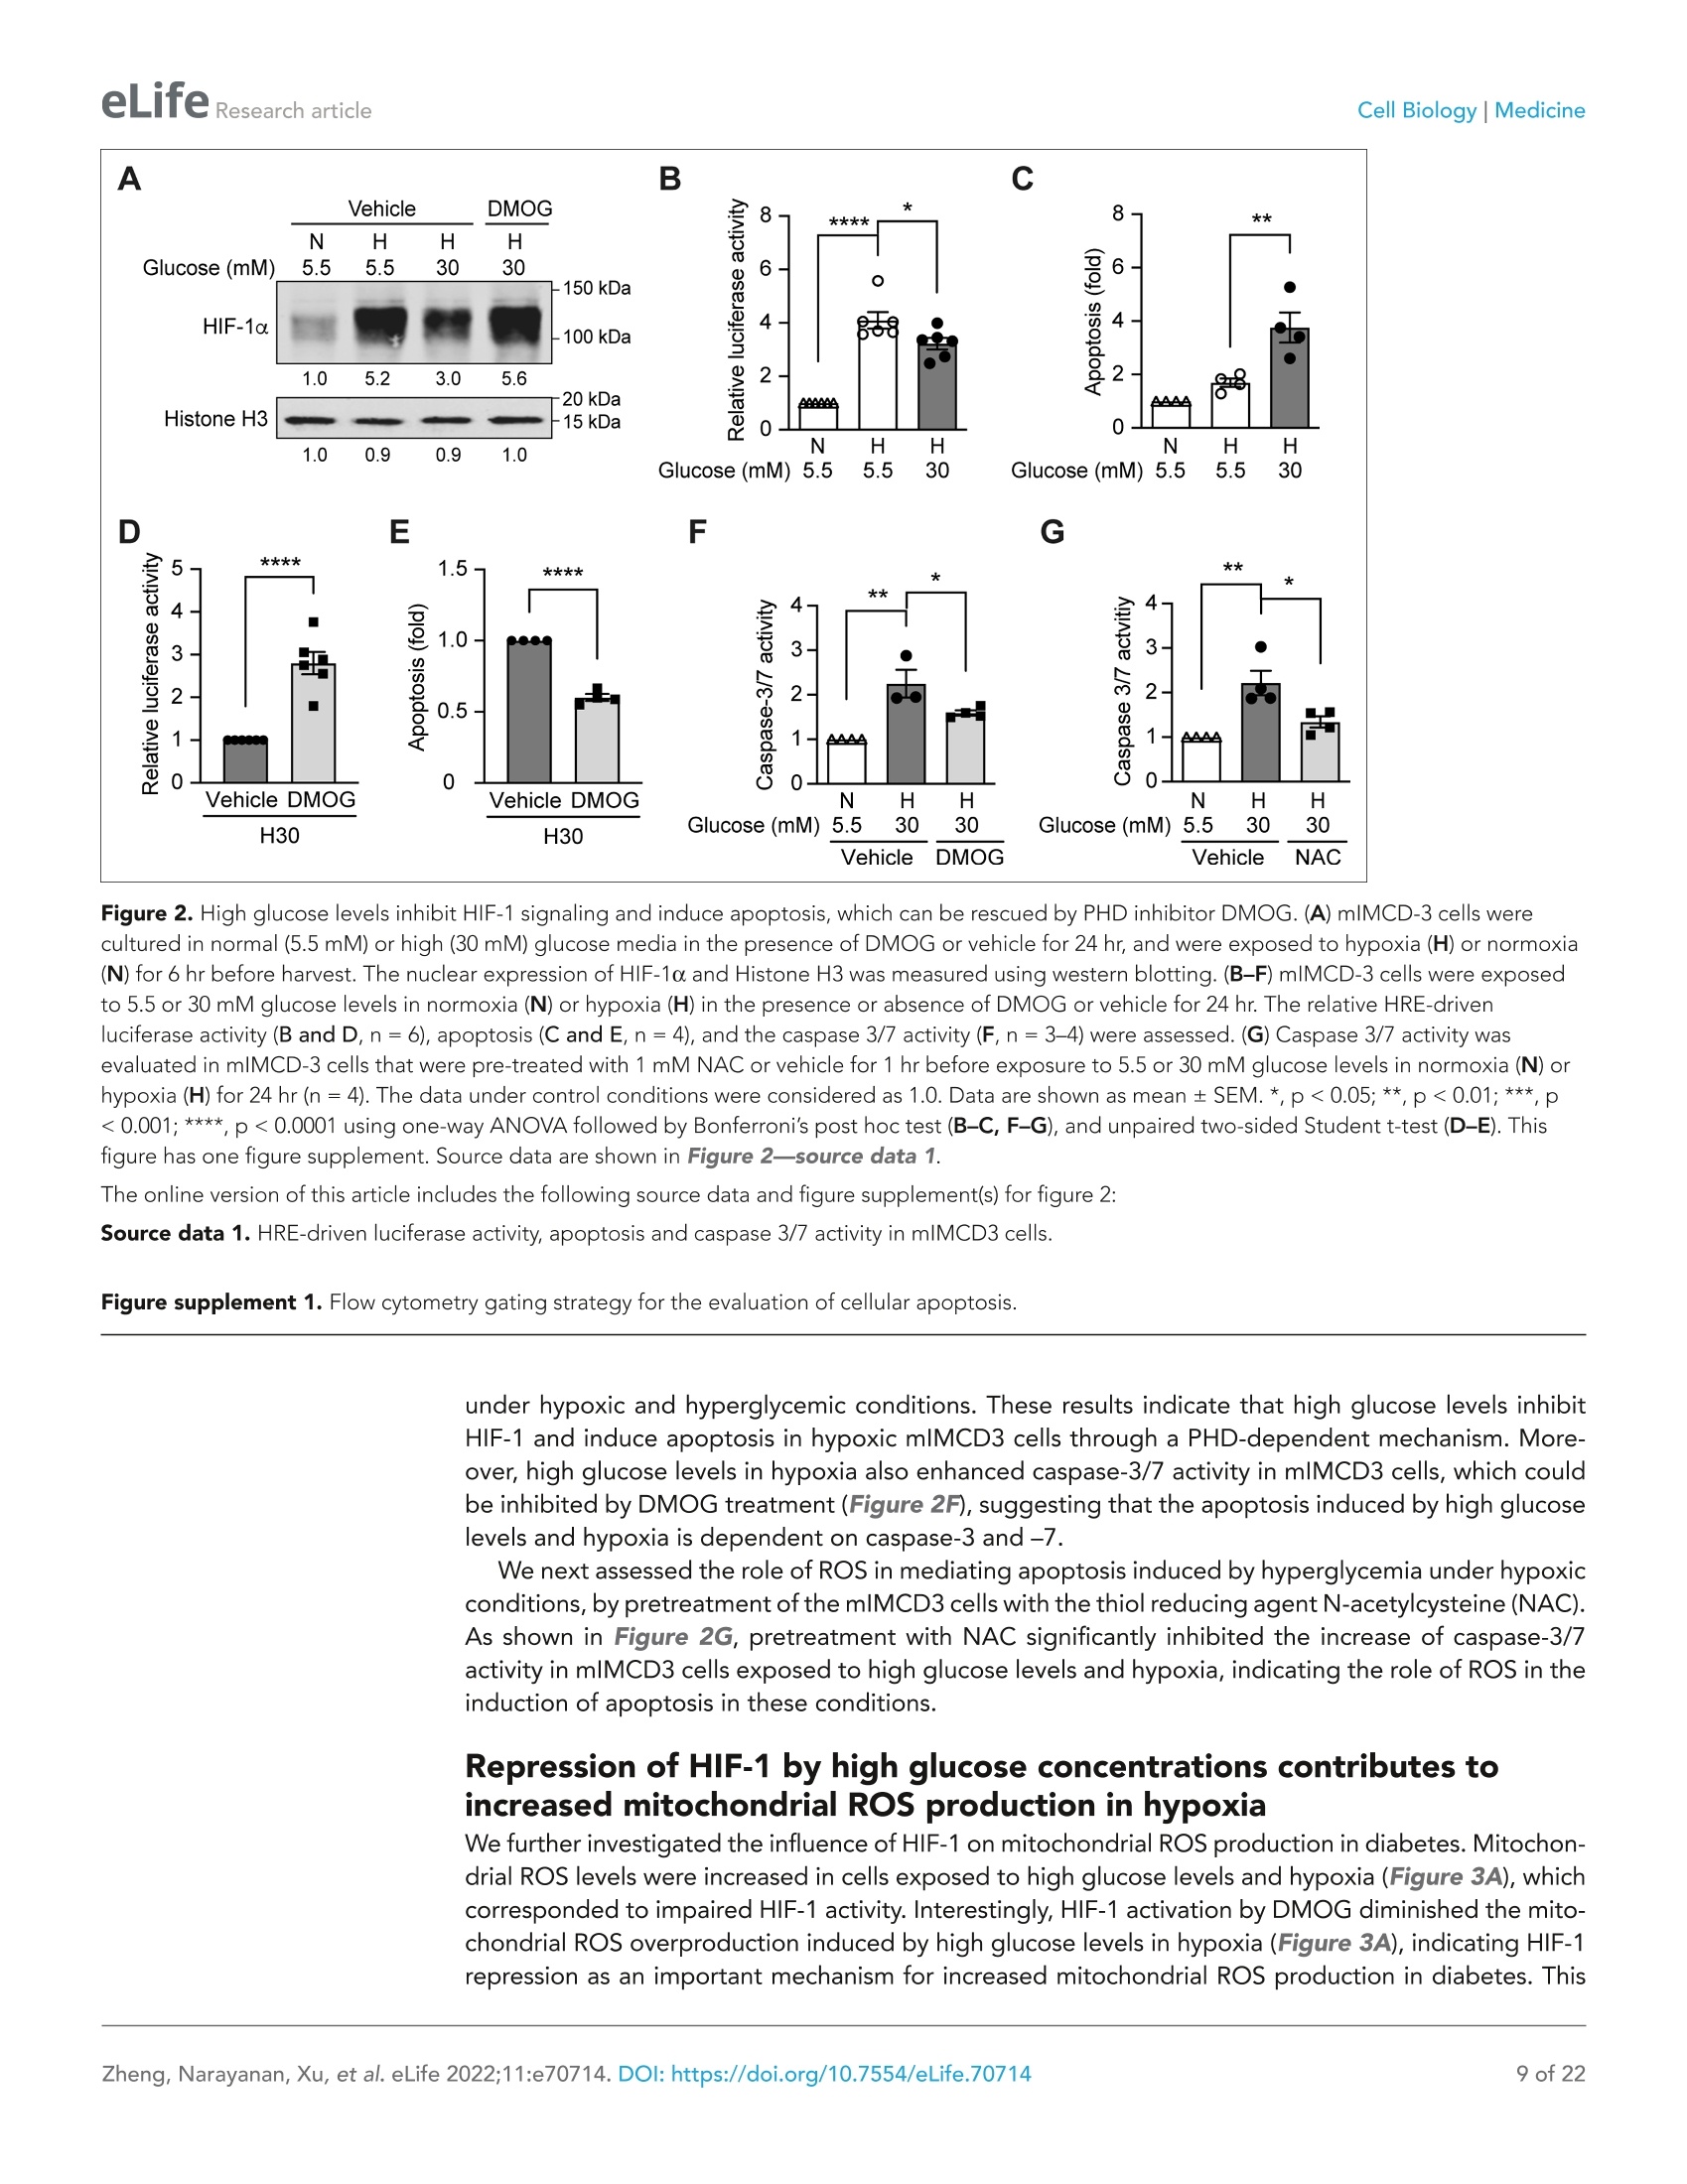
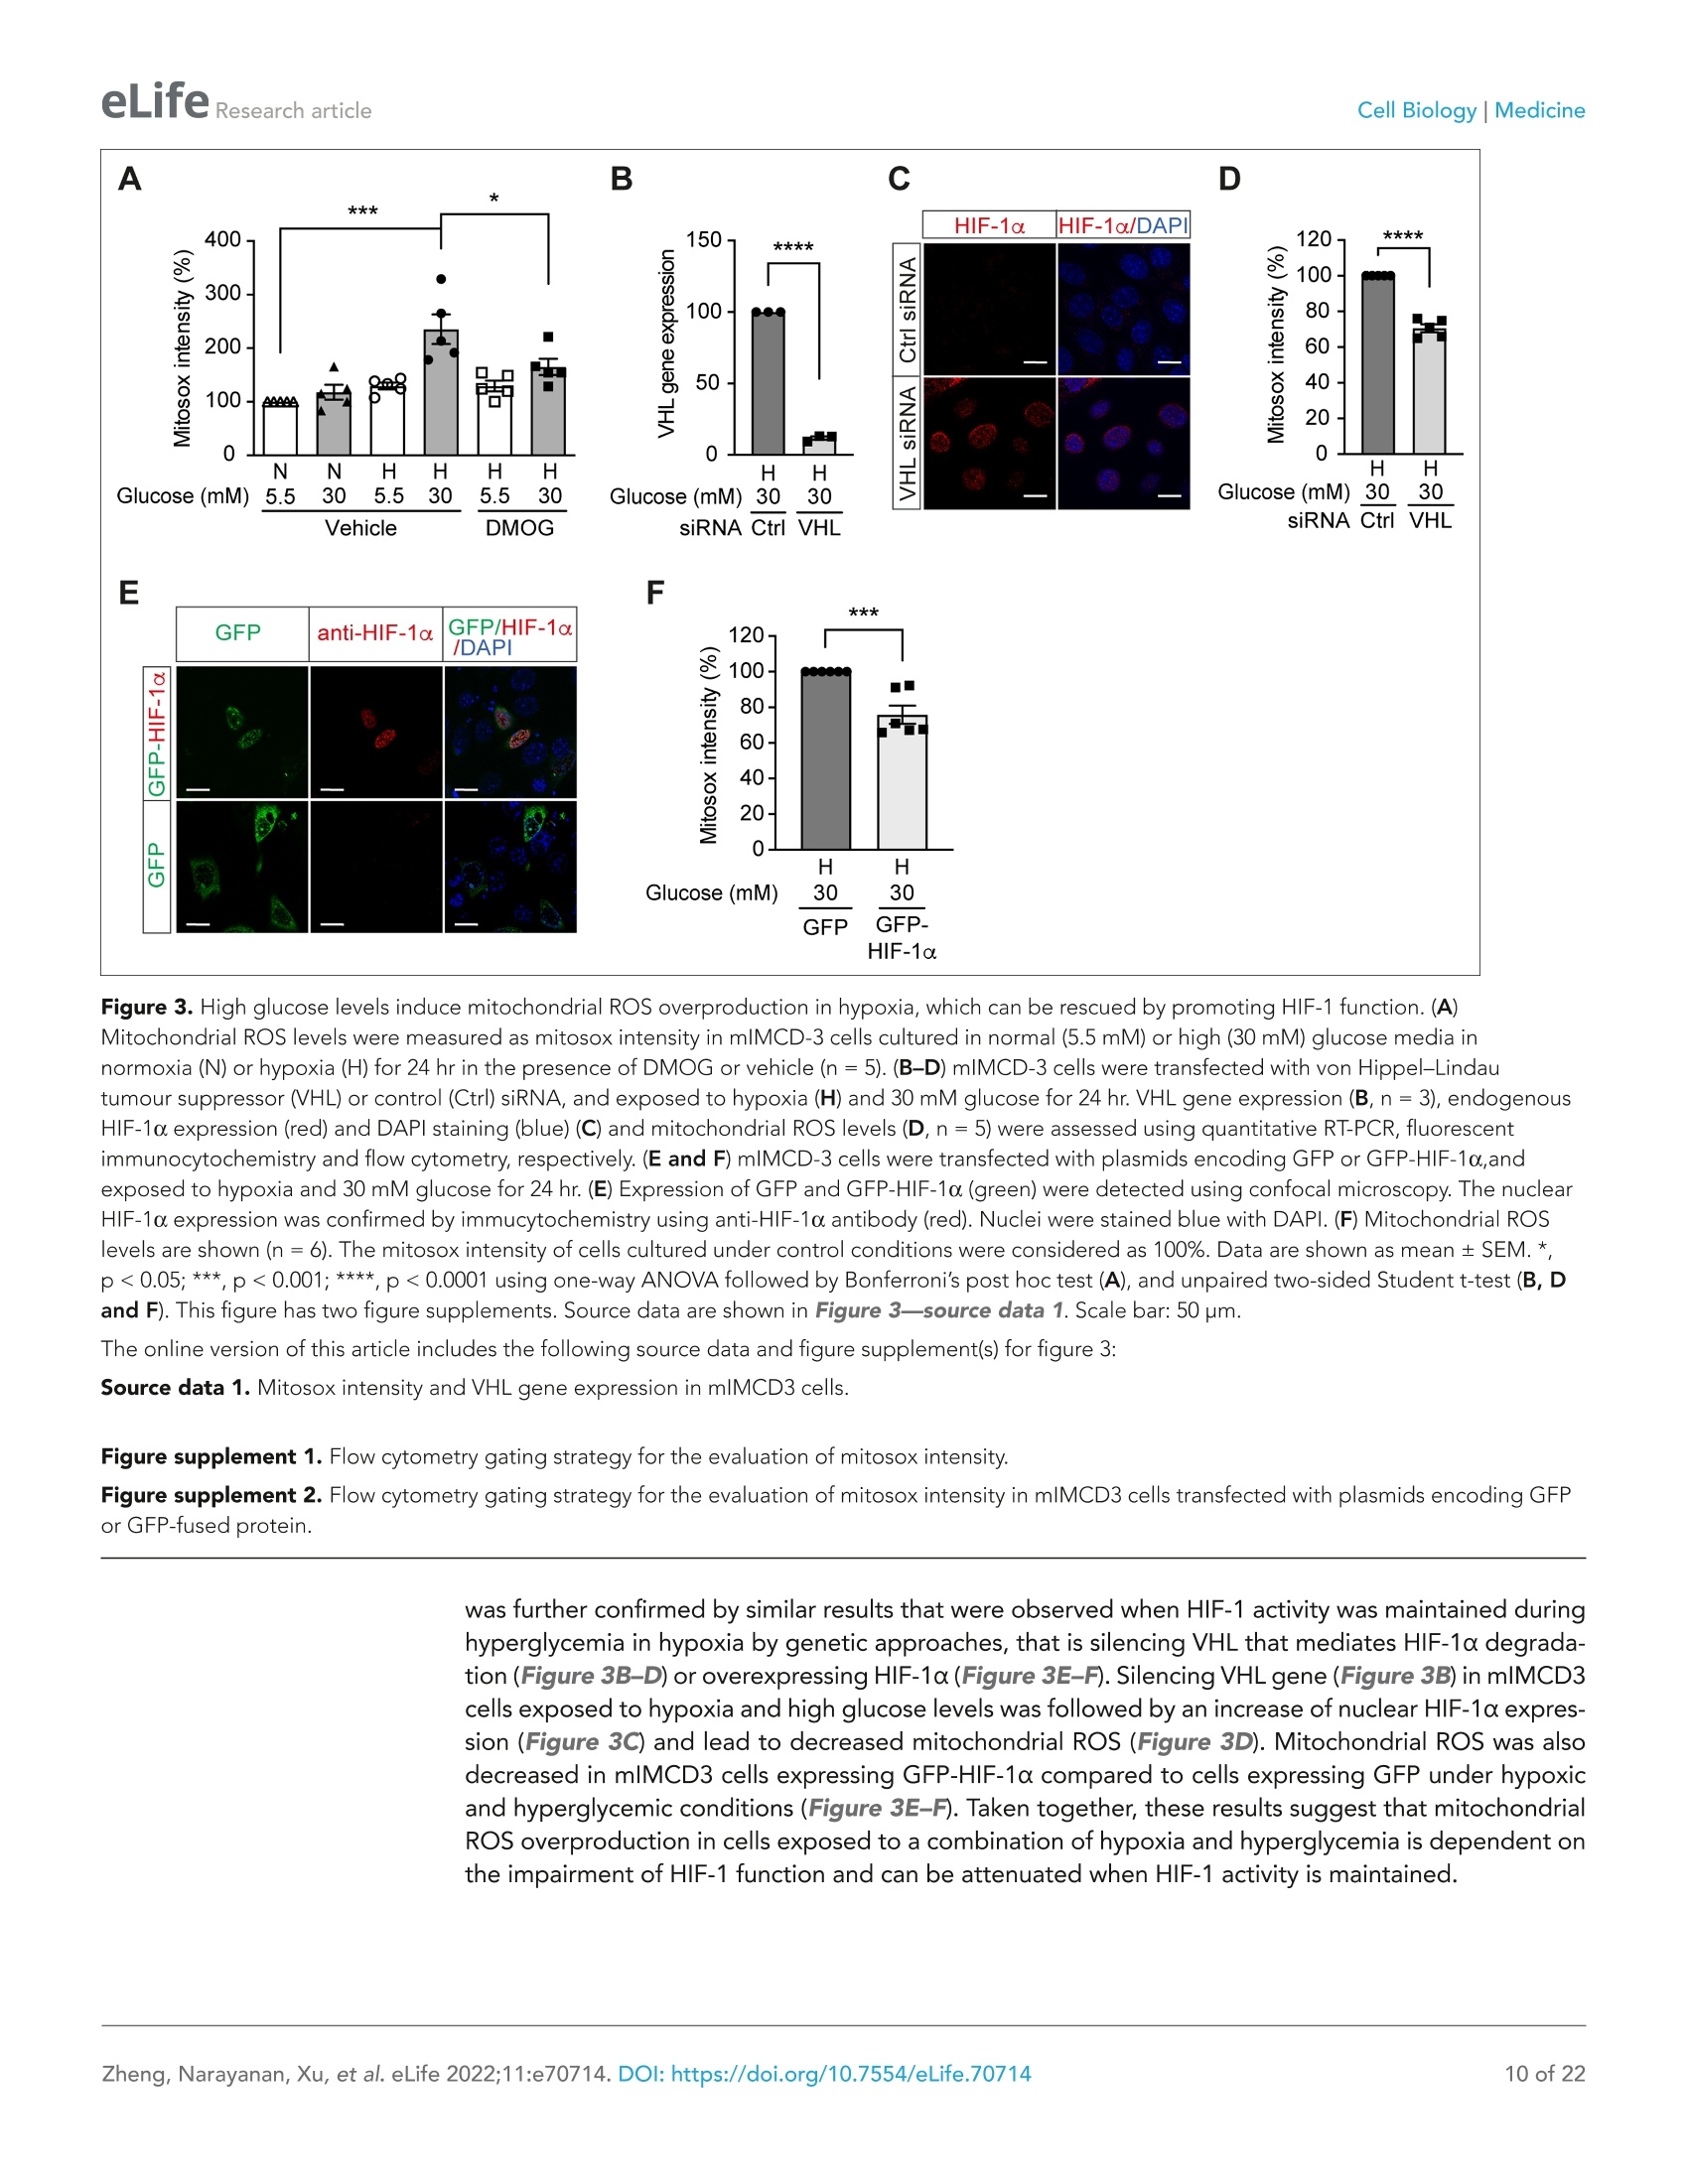
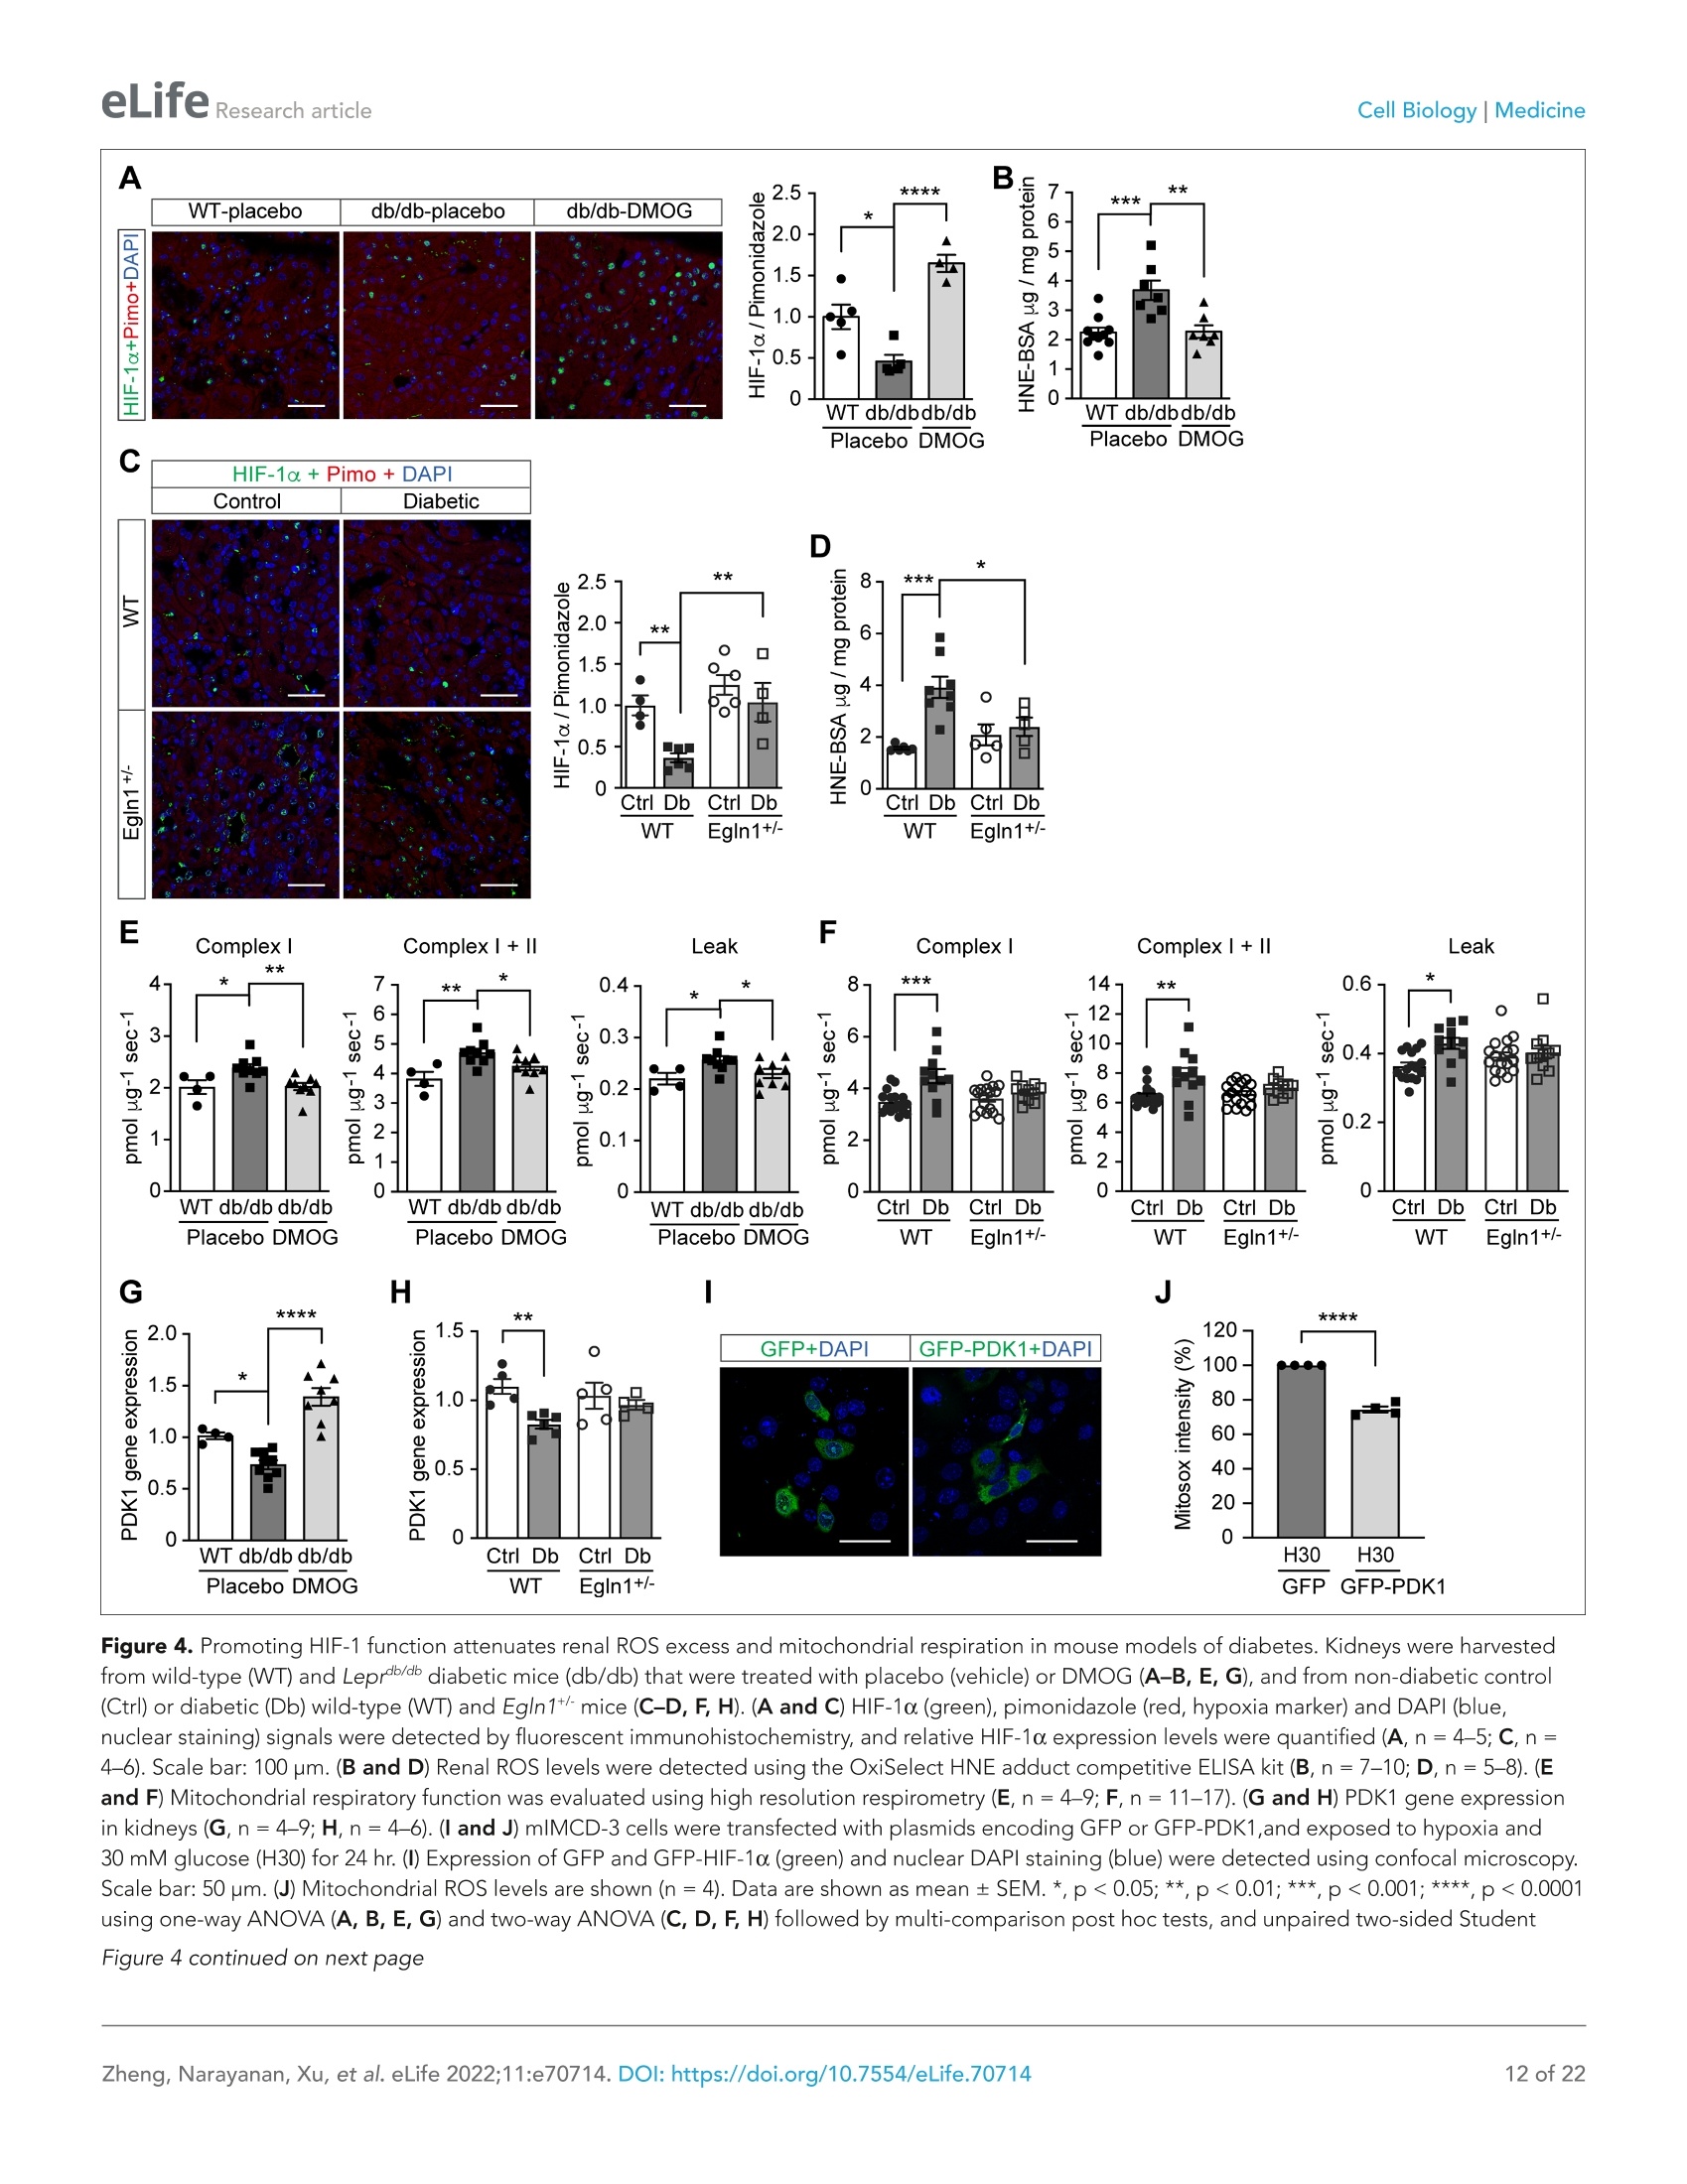
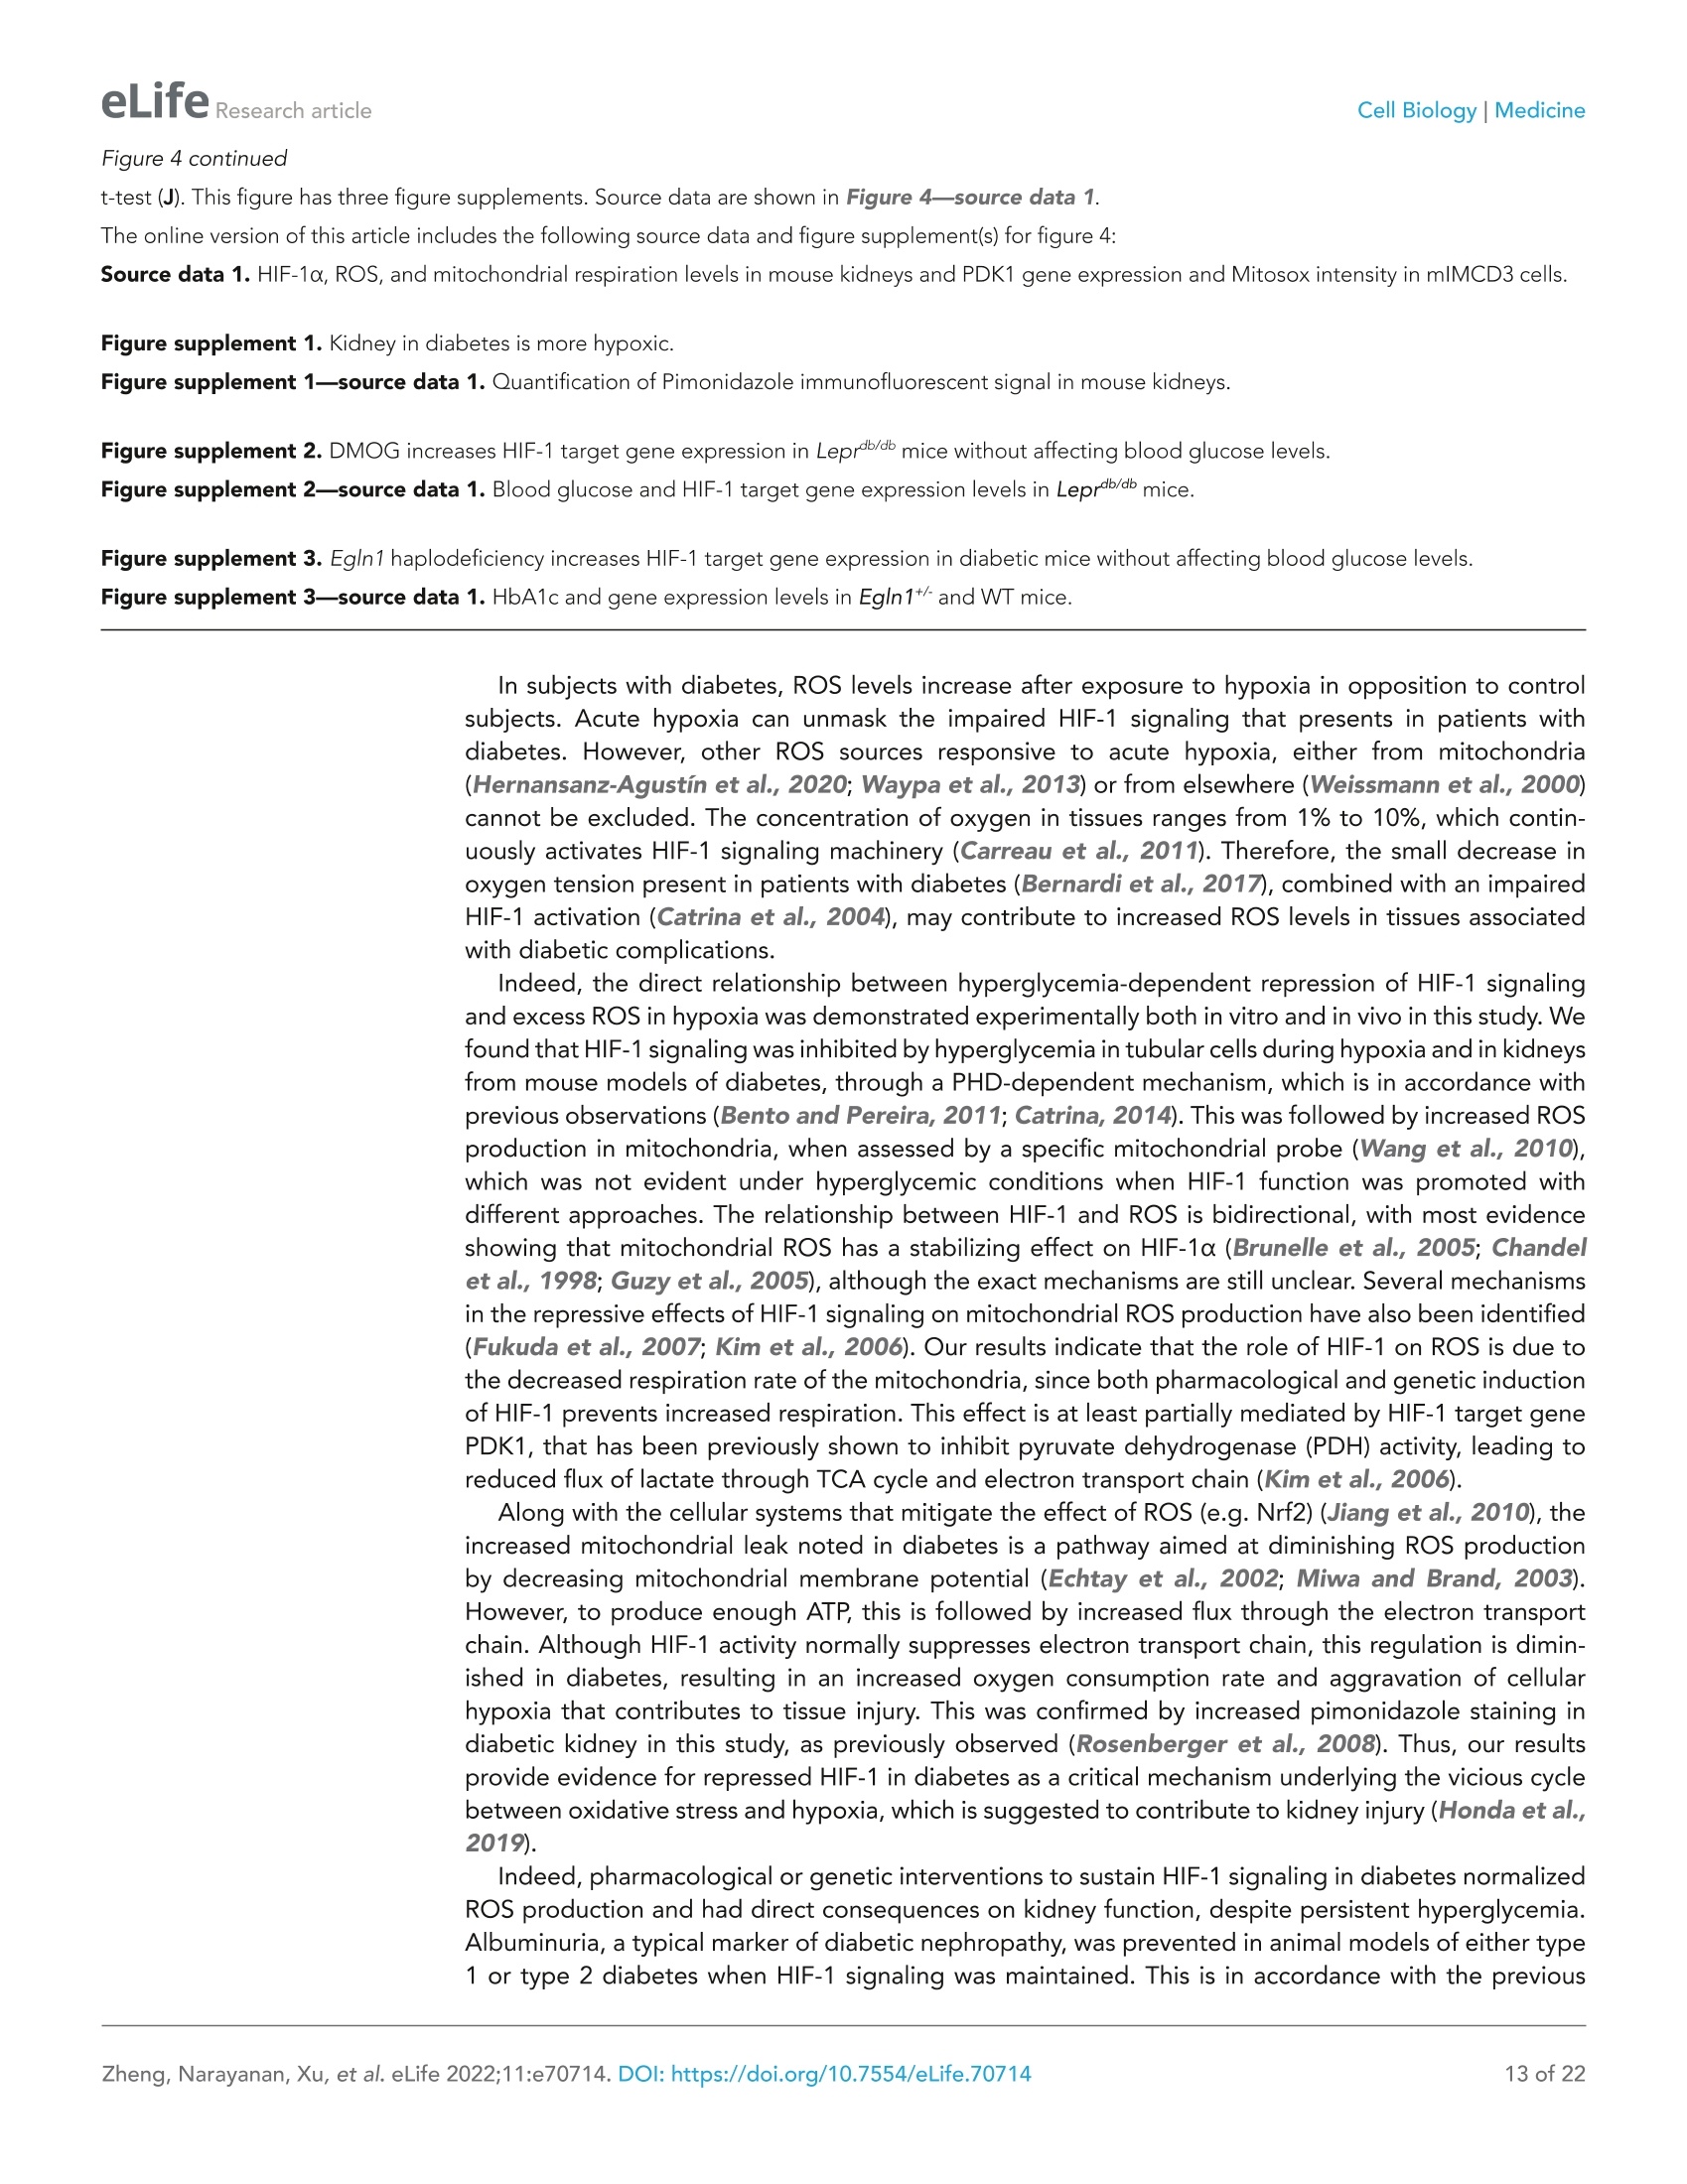
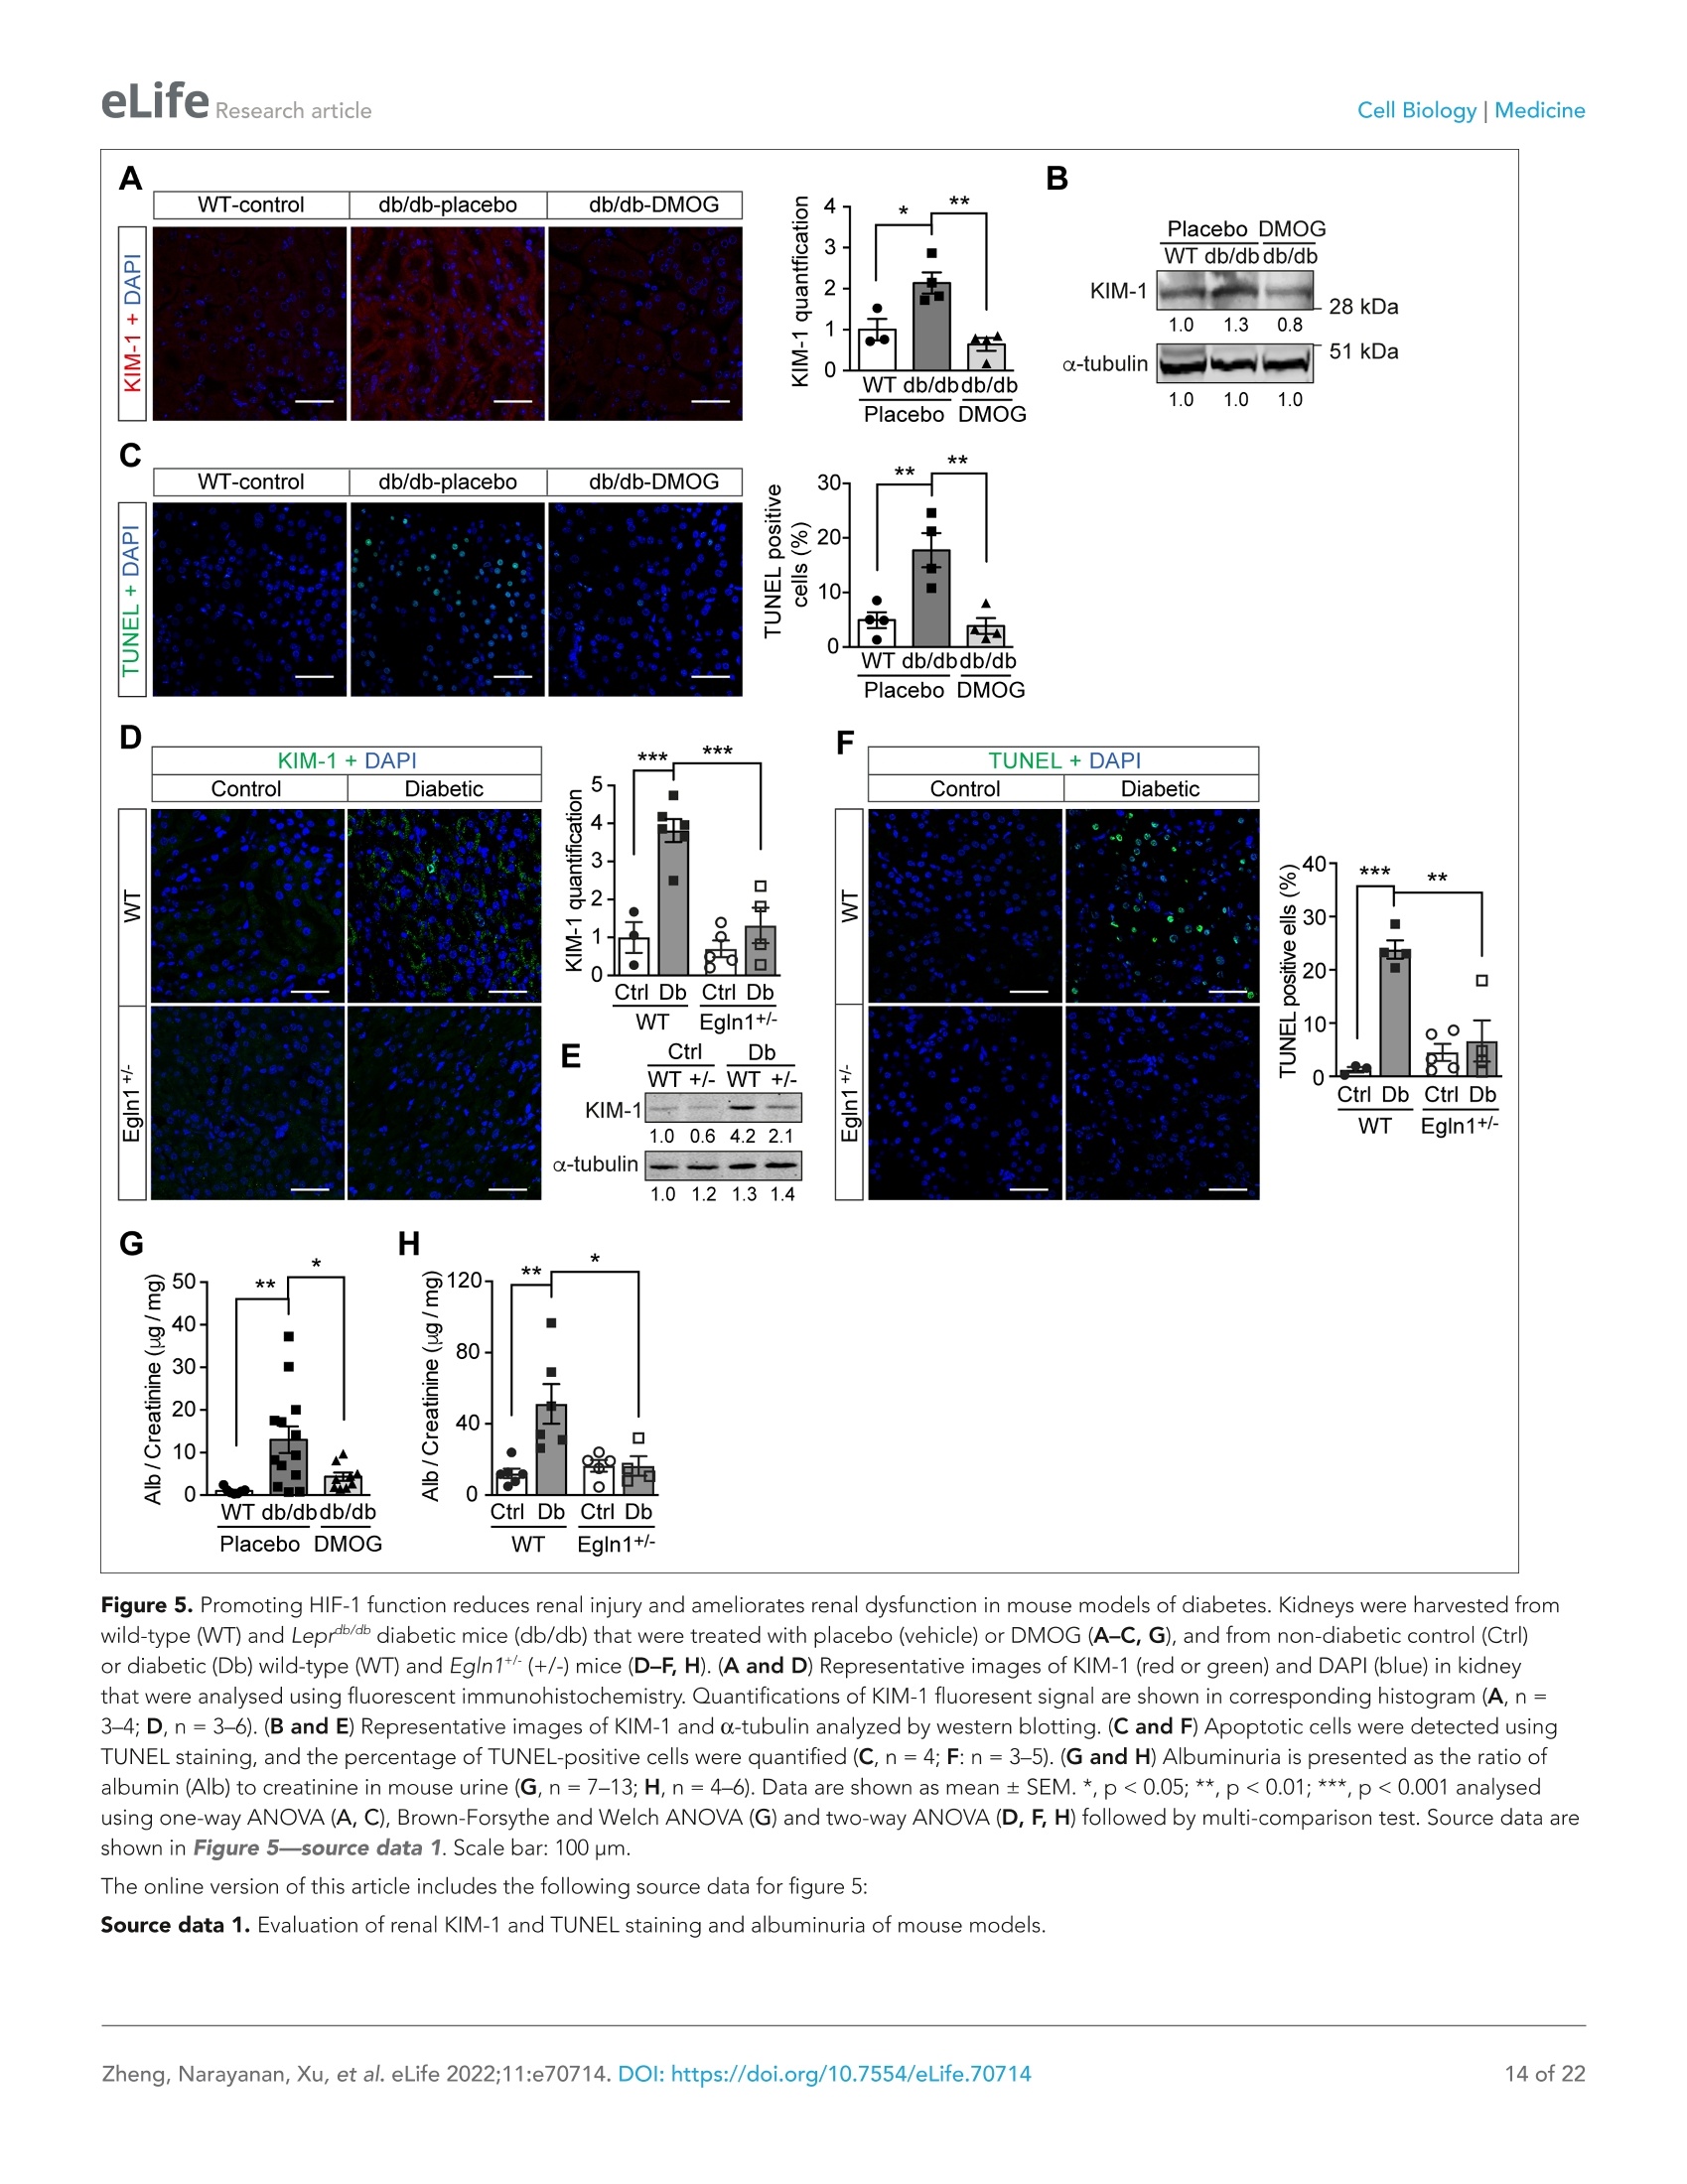
)eLifeRESEARCH ARTICLE eLife Research articleCell Biology|Medicine *For correspondence: sergiu-bogdan.catrina@ki.se tThese authors contributedequally to this work+These authors also contributedequally to this work Present address: Department ofNephrology, GuangDong SecondTraditional Chinese MedicineHospital, GuangZhou, China Competing interest: The authorsdeclare that no competinginterests exist. Reviewing Editor: ErnestinaSchipani, University ofPennsylvania, United States @ Copyright Zheng et al. Thisarticle is distributed under theterms of the Creative CommonsAttribution License, whichpermits unrestricted use andredistribution provided that theoriginal author and source arecredited. in diabetes Xiaowei Zheng1t, Sampath Narayanant, Cheng Xult, Sofie Eliasson Angelstig1,Jacob Grunler1, Allan Zhao1, Alessandro Di Toro2, Luciano Bernardi3,Massimiliano Mazzone, Peter Carmeliet, Marianna Del Sole1, Giancarlo Solaini,Elisabete A Forsberg1, Ao Zhang1s, Kerstin Brismar, Tomas A Schiffer',Neda Rajamand Ekberg1,8,9, lleana Ruxandra Botusan189, Fredrik Palm7, Sergiu-Bogdan Catrina1,8.9*# 'Department of Molecular Medicine and Surgery, Karolinska Institutet,Stockholm,Sweden; 2Centre for Inherited Cardiovascular Diseases, IRCCS Foundation UniversityHospital Policlinico San Matteo,Pavia, Italy; 3Folkalsan Research Center, FolkalsanInstitute of Genetics, University of Helsinki, Helsinki, Finland;4Laboratory of TumorInflammation and Angiogenesis, Center for Cancer Biology, Vlaams Instituut voorBiotechnologie (VIB); Laboratory of Tumor Inflammation and Angiogenesis, Centerfor Cancer Biology, Department of Oncology, Katholieke Universiteit (KU) Leuven,Leuven, Belgium; 5Laboratory of Angiogenesis and Vascular Metabolism, Departmentof Oncology, Katholieke Universiteit (KU) Leuven; Laboratory of Angiogenesis andVascular Metabolism, Vesalius Research Center, Vlaams Instituut voor Biotechnologie(VIB), Leuven, Belgium; Dipartimento di Biochimica, Universita di Bologna, Bologna,Italy; 'Department of Medical Cell Biology, Uppsala University,Uppsala, Sweden;&Department of Endocrinology and Diabetes, Karolinska University Hospital,Stockholm, Sweden; Center for Diabetes, Academic Specialist Centrum, Stockholm, Sweden Abstract Background: Excessive production of mitochondrial reactive oxygen species (ROS) is a centralmechanism for the development of diabetes complications. Recently, hypoxia has been identified toplay an additional pathogenic role in diabetes. In this study, we hypothesized that ROS overproduc-tion was secondary to the impaired responses to hypoxia due to the inhibition of hypoxia-induciblefactor-1 (HIF-1) by hyperglycemia. Methods: The ROS levels were analyzed in the blood of healthy subjects and individuals with type 1diabetes after exposure to hypoxia. The relation between HIF-1, glucose levels, ROS production andits functional consequences were analyzed in renal mlMCD-3 cells and in kidneys of mouse modelsof diabetes. Results: Exposure to hypoxia increased circulating ROS in subjects with diabetes, but not in subjectswithout diabetes. High glucose concentrations repressed HIF-1 both in hypoxic cells and in kidneysof animals with diabetes, through a HIF prolyl-hydroxylase (PHD)-dependent mechanism. Theimpaired HIF-1 signaling contributed to excess production of mitochondrial ROS through increasedmitochondrial respiration that was mediated by Pyruvate dehydrogenase kinase 1 (PDK1). The restoration of HIF-1 function attenuated ROS overproduction despite persistent hyperglycemia, andconferred protection against apoptosis and renal injury in diabetes. Conclusions: We conclude that the repression of HIF-1 plays a central role in mitochondrial ROSoverproduction in diabetes and is a potential therapeutic target for diabetic complications. Thesefindings are timely since the first PHD inhibitor that can activate HIF-1 has been newly approved forclinical use. Funding: This work was supported by grants from the Swedish Research Council, Stockholm CountyResearch Council, Stockholm Regional Research Foundation, Bert von Kantzows Foundation,Swedish Society of Medicine, Kung Gustaf V:s och Drottning Victorias Frimurarestifelse, KarolinskaInstitute's Research Foundations, Strategic Research Programme in Diabetes, and Erling-PerssonFamily Foundation for S-B.C.; grants from the Swedish Research Council and Swedish Heart andLung Foundation for T.A.S.; and ERC consolidator grant for M.M. The paper is novel, informative, and with interesting translational implications. This paper will be ofinterest to scientists interested in diabetes and its complications, as well as the wider field of hypoxiabiology. It provides evidence to understand why diabetes causes damage to multiple tissues whenoxygen supply becomes limited. Introduction Excessive production of mitochondrial ROS is a key contributor to oxidative stress, which is a majorcause of diabetic complications (Charlton et al., 2020; Giacco and Brownlee, 2010). In diabetes,excessive production of ROS in mitochondria is caused by an increased proton gradient across themitochondrial membrane. This occurs secondary to elevated electron transport chain flux, mainly atcomplex l and complex III (Nishikawa et al., 2000). Hypoxia also plays an important role in the development of diabetic complications and is presentin both patients with diabetes (Bernardi et al., 2011) and in animal models with diabetes, in all tissuesin which complications occur (Catrina, 2014; Catrina and Zheng, 2021). Hypoxia-inducible factor-1(HIF-1) is a transcription factor central in the cellular response to low oxygen tension (Prabhakar andSemenza, 2015). HIF-1 is a heterodimeric transcription factor composed of two subunits, HIF-1a andHIF-1B, both of which are ubiquitously expressed in mammalian cells. Regulation of HIF-1 functionis critically dependent on the degradation of the HIF-1a subunit in normoxia. The molecular basisof its degradation is oxygen-dependent hydroxylation of at least one of the two proline residues byspecific Fe2+-, and 2-oxoglutarate-dependent HIF prolyl hydroxylases (PHD 1-3), among which, PHD2(encoded by Egln1 gene) has the main role. Hydroxylated HIF-1a binds to the von Hippel-Lindau(VHL) tumour suppressor protein, which acts as an E3 ubiquitin ligase and targets HIF-1a for protea-somal degradation. Under hypoxic conditions, HIF-1α is stabilized against degradation, translocatesto the nucleus, binds to hypoxic responsive elements (HRE) and activates transcription of a series ofgenes involved in different processes (i.e. angiogenesis, cell proliferation, survival, and cell metabo-lism). These processes enable the cell to adapt to reduced oxygen availability (Schodel and Ratcliffe,2019). HIF-1, as the key mediator of adaptation to low oxygen tension, contributes to a balance in redoxhomeostasis by supressing the excessive mitochondrial production of ROS under chronic hypoxia,thereby minimizing potentially deleterious effects (Semenza, 2017). Since HIF-1 stability and func-tion is complexly repressed in diabetes (Catrina and Zheng, 2021), we hypothesized that its repres-sion might contribute to increased ROS. We therefore investigated the impact of glucose levels onROS production during hypoxia in cells, animal models of diabetes and patients with diabetes, andwhether the excessive mitochondrial ROS production in diabetes could be normalized by restoringHIF-1 function. We found that repressed HIF-1 function secondary to hyperglycemia contributes to an overproduc-tion of mitochondrial ROS with direct pathogenic effects. Consequently, pharmacological or geneticinterventions to prevent repression of HIF-1 function normalize mitochondrial production of ROS in diabetes and inhibit the development of nephropathy, in which hypoxia plays an important patho-genic role (Haase, 2017). Materials and methods Key Resources Table is in Appendix 1 - key resources table. Clinical study Thirteen non-smoking patients with type 1 diabetes (28.9±7.2 years old; 53.8% male and 46.2%female; HbA1c: 74.4±11.8 mmol/mol (9.0%±1.1%); BMI: 24.3 ±4.0 kg/m²) and 11 healthy, age-matched controls (30.5±8.5 years old; 54.5% male and 45.5% female; HbA1c: 35.6±2.6 mmol/mol(5.4%±0.2%); BMI: 24.3±4.0 kg/m²) were exposed to intermittent hypoxia for 1 hr, consistingof five hypoxic episodes (13% 02, 6 min) that alternated with normoxic episodes (20.9%O2,6 min)(Figure 1-figure supplement 1). The subject breathed through a disposable mouthpiece whichwas connected via an antibacterial filter (Carefusion, Yorba Linda, CA,USA) to a T-tube carrying one-way respiratory valves (Tyco Healthcare, Hamshire, UK). A nose clip assured that respiration occuredthrough the mouth. The air supplied to the subject came from a tube connected to a stopcock (HansRudolph, Shawnee, KS, USA) connected to a 60 L Douglas bag (Hans Rudolph) which was continuouslyfilled with hypoxic gas. By turning the stopcock, the air supplied to the subject could be switchedfrom hypoxic to ambient (normoxic) air. The Douglas bag was positioned behind the subject's bed, sothat he/she could not notice when the hypoxic gas or normoxic air was supplied. Blood samples weretaken before and immediately after hypoxia exposure. Patients had been diagnosed with diabetesfor 10-20 years, showed no signs of peripheral neuropathy and had intact peripheral sensibility whenchecked with monofilament and vibration tests. The study was approved by the Regional EthicalReview Board in Stockholm, Sweden, and carried out in accordance with the principles of the Declara-tion of Helsinki. The sample size has been decided according to the experience from previous studies(Duennwald et al., 2013). All participants in the study provided informed consent. EPR spectroscopy ROS levels in the blood were measured using Electron Paramagnetic Resonance (EPR) Spectroscopy(Dikalov et al., 2018). Blood samples were mixed with spin probe 1-hydroxy-3-carboxy-pyrrolidine(CPH, 200 pM) in EPR-grade Krebs HEPES buffer supplemented with 25 mM Deferoxamine (DFX)and 5 mM diethyldithiocarbamate (DETC), and incubated at 37°℃ for 30 min before being frozen inliquid nitrogen. EPR measurements were carried out using a table-top EPR spectrometer (NoxygenScience Transfer & Diagnostics GmbH, Elzach, Germany). The spectrometer settings were as follows:microwave frequency, 9.752 GHz; modulation frequency, 86 kHz; modulation amplitude, 8.29 G;sweep width, 100.00 G; microwave power, 1.02 mW;number of scans, 15. All data were convertedto absolute concentration levels of CP radical (mmol Oz/min/ug) using the standard curve method.All chemicals and reagents for EPR Spectroscopy were obtained from Noxygen Science Transfer &Diagnostics GmbH. Cell culture Mouse Inner Medullary Collecting Duct-3 (mlMCD-3) cells (ATCC CRL-2123; ATCC, USA) werecultured in Dulbecco's modified Eagle's medium (DMEM; 5.5 mM glucose) supplemented with 10%heat-inactivated FBS and 100 IU/ml penicillin and streptomycin (Thermo Fisher Scientific). The cellswere maintained in a humidified atmosphere with 5% CO, at 37℃ in a cell culture incubator, andwere tested negatively for microplasma using MycoAlert PLUS mycoplasma detection kit (LONZA).Cells were cultured under normoxic (21%O2) or hypoxic (1%O2) conditions in Hypoxia WorkstationINVIVO2 (Ruskinn). Nuclear extraction To detect HIF-1α, mlMCD-3 cells were cultured in medium containing 5.5 or 30 mM glucose for24 hours in the absence or presence of DMOG (200 uM), and were exposed to normoxia or hypoxiafor 6 hours prior to harvest. The cells were collected and incubated on ice for 10 min in hypotonicbuffer containing 10 mM KCl, 1.5 mM MgCl2, 0.2 mM PMSF, 0.5 mM dithiothreitol, and protease inhibitor mix (Complete-Mini; Roche Biochemicals). After the cells were swollen, nuclei were releasedusing a Dounce homogenizer Type B. The nuclei were pelleted and resuspended in a buffer containing20 mM Tris (pH 7.4), 25% glycerol, 1.5 mM MgCl2, 0.2 mM EDTA, and 0.02 M KCl. Soluble nuclearproteins were released from the nuclei by gentle, drop-wise addition of a buffer containing 20 mM Tris(pH 7.4), 25% glycerol, 1.5 mM MgCl2, 0.2 mM EDTA, and 0.6 M KCI, followed by 30 min of incubationin ice. The nuclear extracts were then centrifuged and dialyzed in dialysis buffer containing 20 mM Tris(pH 7.4), 20% glycerol, 100 mM KCl, 0.2 mM EDTA, 0.2 mM PMSF, 0.5 mM dithiothreitol, and proteaseinhibitor mix. Plasmid construction and transfection Plasmids encoding an HRE-driven luciferase reporter, Renilla luciferase, GFP, and GFP-HIF-1a weredescribed previously (Zheng et al., 2006). Plasmid pCMV3-FLAG-PDK1 encoding FLAG-taggedhuman PDK1 was obtained from Sino Biological Inc (Catalog number: HG12312-NF). pCMV3-GFP-FLAG-PDK1 encoding GFP-fused FLAG-tagged PDK1 was generated by subcloning a Hind III-GFP-Hind Ill fragment from pCMV2-FLAG-GFP into Hind Ⅲ- digested pCMV3-FLAG-PDK1. Plasmidtransfection was performed using Lipofectamine reagent (Thermo Fisher Scientific) according to themanufacturer’s protocol. HRE-driven luciferase reporter assay HIF-1 activity was determined by an HRE-driven luciferase reporter assay. mlMCD-3 cells were trans-fected with plasmids encoding HRE-driven firefly luciferase and Renilla luciferase using Lipofectaminereagent. Cells were then cultured in media containing normal (5.5 mM) or high (30 mM) glucoseconcentrations, and were exposed to normoxia or hypoxia for 40 hours. The cells were harvested, andluciferase activity was measured using the Dual Luciferase Assay System (Promega) on the GloMaxLuminometer (Promega) according to the manufacturer's instructions. HRE-driven firefly luciferaseactivity was normalized to Renilla luciferase activity and expressed as relative luciferase activity. Cellular apoptosis analysis mlMCD3 cells were cultured in media containing normal (5.5 mM) or high (30 mM) glucose concentra-tions and were exposed to normoxia or hypoxia for 24 hours before analysis. Apoptosis was analyzedusing Annexin V-FITC /7-AAD kit (Beckman Coulter) according to the manufacturer's protocol. Briefly,the cells were incubated with Annexcin V-FITC and 7-AAD for 15 min in the dark, and then analyzedwithin 30 min using flow cytometry on a Cyan ADP analyser (Beckman Coulter). The gating scheme isshown in Figure 2-figure supplement 1. Results were expressed as percentage of Annexin V- posi-tive and 7-AAD-negative apoptotic cells. Determination of caspase 3/7 activity mlMCD3 cells were seeded in 96-well plate with 1500 cells/well in duplicates, and were cultured inmedia containing normal (5.5 mM) or high (30 mM) glucose concentrations and were exposed tonormoxia or hypoxia for 24 hr before analysis. Caspase 3/7 activity was evaluated using Caspase-Glo3/7 assay kit (Promega) on the GloMax Luminometer (Promega) according to the manufacturer'sinstructions. The caspase 3/7 activity was finally normalized to the DNA concentration in each wellusing Quant-iT dsDNA High-Sensitivity Assay Kit (Thermo Fisher Scientific) measured using GloMaxDiscover Microplate Reader (Promega). RNA interference siRNA for mouse VHL (Flexitube Gene Solution GS22346) was obtained from Qiagen. AllStars nega-tive control siRNA, obtained from Ambion, was used as a control. siRNA was transfected using Lipo-fectamine RNAiMAX Transfection Reagent (Thermo Fisher Scientific), according to the manufacturer'sprotocol.Twenty-four hours after transfection, cells were exposed to 5.5 or 30 mM glucose in normoxiaor hypoxia for 24 hr before being harvested. Detection of mitochondrial ROs levels using flow cytometry After 24 hr’ exposure to 5.5 or 30 mM glucose levels in normoxia or hypoxia, mlMCD-3 cells werestained with MitoSOX Red Mitochondrial Superoxide Indicator (Thermo Fisher Scientific). A working Groups WT-Control Db/db-Control Db/db-DMOG Body weight (g) 27.44±0.41 48.66±1.00 50.04±1.08 Blood glucose(mM) 7.16±0.39 21.27±1.21 20.59±1.50 Age (weeks) 16±0 17.25±0.48 17.00±0.45 n 14 16 16 Data are presented as mean± SEM. Source data are shown in Table 1—source data 1. The online version of this article includes the following source data for table 1: Source data 1. Characteristics of Leprdb/db and control mice prior to experiments. concentration of 5 pM was used, and cells were incubated at 37℃ for 10 min protected from light.After washing off excess dye, cells were trypsinized and suspended in Krebs HEPES buffer and anal-ysed using flow cytometry on a Cyan ADP analyser (Beckman Coulter). Analysis was performed usingFlowJo software, and the gating scheme is shown in Figure 3-figure supplements 1 and 2. Mito-chondrial ROS levels were expressed as percentage of MitoSOX Red fluorescence intensity. Fluorescent immunocytochemistry and confocal microscopy mlMCD3 cells were seeded on coverslips and transfected with siRNA or plasmids as desired and wereexposed to hypoxia and high glucose levels for 24 hr. The cells were then fixed in 4% Formaldehyde(Sigma) at room temperature (RT) for 15 min. After three washes with Phosphate-buffered Saline(PBS, Sigma), the cells were premeabilized in PBS containing 0.1% Triton-X100 at RT for 10 min. Afterthree washes with PBS, the cells were blocked with PBS containing 5% Bovine Serum Albumin (BSA,Sigma), and incubated with Rabbit polyclonal anti-HIF-1a antibody (GeneTex, Cat No. GTX127309)1:200 diluted in PBS containing 1% BSA and 0.1% Tween-20 (Sigma) at 4℃ over night. After threewashes with PBS containing 0.1% Tween-20 (PBS-T) for 5 min each, the cells were incubated with afluorochrome-conjugated secondary antibody, Goat anti-Rabbit Alexa 594 (ThermoFisher Scientific,A-11037, 1:500 diluted) in PBS containing 1% BSA and 0.1% Tween-20 at RT for 1 hr. The cells werethen washed with PBS-T twice and with PBS twice before the cover slips were mounted on the slidesusing ProLong Gold Antifade Mountant with DAPI (ThermoFisher Scientific). The fluorescent imageswere captured using a Leica SP8 confocal microscope (Leica Microsystems). Animals Diabetic male BKS-Leprdb/db/JOrIRj(Leprdb/db) mice and healthy controls were from Janvier Labs. Char-acteristics of the mice prior to experiments are summarized in Table 1. Leprdb/db mice with HbA1clevels > 55 mmol/mol or blood glucose >15 mM when HbA1c levels were between 45 and 55 mmol/mol were included in the analysis. Mice were allocated into groups according to their age, HbA1cor blood glucose levels. Mice were injected intraperitoneally (i.p.) with DMOG (320 mg/kg bodyweight) 4 days and 1 day before sacrifice for the analysis of mitochondrial function. For other analyses,Leprdlb/db mice were injected (i.p.) with DMOG (50 mg/kg body weight) every second day for 1 month Table2. Characteristics of Egln1+ and WT mice prior to experiments. Groups WT-Control Egln1+-Control WT-diabetic Egln1*-diabetic Start body weight (g) 28.02±1.04 27.11±0.79 28.27±0.71 28.64±0.87 Age (weeks) 22.46±0.85 23.91±0.72 22.67±0.87 24.57±0.59 n 24 23 24 21 Data are presented as mean ± SEM. Source data are shown in Table 2-source data 1. The online version of this article includes the following source data for table 2: Source data 1. Characteristics of Egln1*and WT mice prior to experiments. Table 3. Blood glucose of Egln1*and WT micebefore and after STZ injection. EgIn1+’. Groups WT-diabetic diabetic Blood glucose (mM) before STZ 5.11±0.24 4.18±0.20 Blood glucose (mM) after STZ 19.39±1.04 17.7±0.81 24 21 Data are presented as mean ± SEM. Source data areshown in Table 3—source data 1. The online version of this article includes the followingsource data for table 3: Source data 1. Blood glucose of Egln1*and WT micebefore and after STZ injection. before sacrifice. Egln1*mice and their wild-type(WT) littermates were generated as previouslydescribed (Mazzone et al., 2009). Characteris-tics of the mice prior to experiments are shownin Table 2. Diabetes was induced in male Egln1+and WT mice with streptozotocin (STZ) i.p. injec-tions. STZ was administered at 50 mg/kg bodyweight daily for five consecutive days, and micewere diabetic for at least 6 weeks before sacrifice.Blood glucose before and after STZ injection areshown in Table 3. Mice were exposed to a 12 hrlight/dark cycle at 22℃,and were given standardlaboratory food and water ad libitum. The samplesize was calculated to achieve 30% difference inalbuminuria between DMOG or vehicle-treatedLeprdb/db mice or between diabetic Egln1*- andWT mice and was adjusted for each parameteraccording to preliminary results. The experi-mental animal procedure was approved by theNorth Stockholm Ethical Committee for the Care Fluorescent immunohistochemistry Formalin-fixed, paraffin-embedded kidney tissues were deparaffinized and rehydrated, and antigenretrieval was performed in citrate buffer using a pressure cooker. After washing the slides with PBS-Tthree times for 3 min each, sections were demarcated with a hydrophobic pen. Sections were blockedwith goat serum in PBS for 30 min at RT and then incubated overnight at 4℃ with primary antibodies(HIF-1a antibody, GeneTex, GTX127309, 1:100 diluted; KIM-1 antibody, Novus Biologicals, NBP1-76701, 1:50 diluted). Sections were then washed with PBS-T four times for 5 min each. Sections wereincubated for 1 hr at RT in the dark with a fluorochrome-conjugated secondary antibody, Goat anti-Rabbit Alexa fluor 488 or 594 (ThermoFisher Scientific, A-11008 or A-11037, 1:500 diluted).Sectionswere then washed with PBS-T four times for 5 min each and treated with 0.1% Sudan Black-B solution(Sigma) for 10 min to quench autofluorescence. Sections were counterstained with DAPl for 3 min,and were mounted and stored at 4 ℃. Fluorescent images were acquired using a Leica TCS SP5and SP8 confocal microscope (Leica Microsystems). Image analysis was blinded and performed usingImage-Pro Premier v9.2 (Media Cybernetics) software. To detect hypoxia in mouse kidneys, pimonidazole solution (Hypoxyprobe-1 Omni Kit, Hypoxy-probe, Inc) was i.p. administered to mice at a dosage of 60 mg/kg body weight 90 min prior to tissueharvest. Pimonidazole adducts were detected on kidney sections using a 1:100 diluted RED PE dye-conjugated mouse monoclonal anti-pimonidazole antibody (clone 4.3.11.3) according to the Hypoxy-probe RED PE Kit protocol. To detect HIF-1a, the above method was modified to incorporate the Tyramide Superboost kit(Thermo Fisher Scientific). Briefly, after antigen retrieval, the sections were blocked with 3% H202 toquench endogenous peroxidase activity before blocking with goat serum (both ingredients providedin the kit). Following the PBS-T washes after primary HIF-1a antibody incubation, the sections wereincubated with an HRP-conjugated rabbit antibody for 1 hr at RT. Sections were washed rigorouslyand incubated with tyramide reagent for 10 min at RT in the dark. The reaction was stopped by incu-bating with the stop solution for 5 min, and samples were washed with PBS-T three times for 3 minseach. The sections were subsequently treated with 0.1% Sudan Black-B solution, counterstained andmounted as mentioned above. Evaluation of ROS levels in kidnev ROS levels in kidney tissues were indirectly assessed by evaluating non-enzimatic lipid peroxidationby measuring 4-Hydroxynonenal (4-HNE) protein adduct levels using the OxiSelect HNE AdductCompetitive ELISA kit (STA838, Cell Biolabs) according to the manufacturer's instruction. Kidney mitochondrial function Mitochondria were isolated from mouse kidneys, and mitochondrial function was determined usinghigh-resolution respirometry (Oxygraph 2 k, Oroboros) as previously described (Schiffer et al., 2018).The analysis was blinded.Briefly, respirometry was performed in respiration medium containing EGTA(0.5mM),MgCl2(3 mM), K-lactobionate (60 mM), taurine (20 mM), KH2PO4(10 mM), HEPES (20 mM),sucrose (110 mM), and fatty-acid-free BSA (1 g/L). Pyruvate (5 mM) and malate (2 mM) were added tomeasure state two respiration, followed by the addition of ADP (2.5 mM) to measure complex l-medi-ated maximal respiratory capacity (state three respiration). Complex1 + Il-mediated maximal oxidativephosphorylation was evaluated after adding succinate (10 mM). LEAK respiration was measured in thepresence of pyruvate (5 mM), malate (2 mM), and oligomycin (2.5pM). Respiration was normalizedto mitochondrial protein content, determined spectrophotometrically using the DC Protein Assay kit(Bio-Rad). RNA purification and quantitative RT-PCR Total RNA was extracted from kidney using miRNeasy Mini kit (Qiagen). cDNA was produced usingHigh-Capacity cDNA Reverse Transcription Kit (Thermo Fisher Scientific). Quantitative RT-PCR wasperformed on a 7300 or 7900 Real-Time PCR System (Applied Biosystems) using SYBR Green MasterMix (ThermoFisher Scientific). The average gene expression of B-actin (ACTB) and Hydroxymethyl-bilane synthase (HMBS) was used as control. Primer sequences are listed in Key Resources Table inAppendix 1-key resources table. Protein extraction and western blotting Kidney biopsies were homogenized in a buffer containing 50 mM Tris-HCl (pH 7.4), 180 mM NaCl,0.2%NP-40, 20% glycerol, 0.5 mM phenylmethylsulfonyl fluoride, 5 mM B-mercaptoethanol, and aprotease inhibitor mix (Complete-Mini; Roche Biochemicals). Cell lysate was obtained by centrifu-gation for 30 min at 20,000 g and 4℃. Protein concentrations were determined using the BradfordProtein Assay (Bio-Rad) according to the manufacturer's protocol. Nuclear extracts and tissue lysatewere separated by SDS-PAGE and blotted onto nitrocellulose membranes. Blocking was performed inTBS buffer (50 mM Tris pH 7.4 and 150 mM NaCl) containing 5% nonfat milk, followed by incubationwith anti-HIF-1α (1:500, NB100-479; Novus Biologicals), anti-Histone H3 (1:5000, ab1791; Abcam),anti-KIM-1 (1:500, NBP1-76701; Novus Biologicals) or anti-a-tubulin (1:1000, MAB11106; Abnova)antibodies in TBS buffer containing 1% nonfat milk. After several washes, the membranes were incu-bated with IRDye 800 goat anti-rabbit or IRDye 680 goat anti-mouse secondary antibodies (LI-COR).The membranes were then scanned with Odyssey Clx Imaging System (LI-COR). Quantification ofwestern blots were performed using ImageJ (version 1.53). TUNEL staining Apoptosis in kidneys was detected using the In Situ Cell Death Detection Kit (Sigma Aldrich/Roche).Briefly, formalin-fixed paraffin-embedded sections were deparaffinized, rehydrated and blocked with3% H202 to quench endogenous peroxidase activity. The sections were permeabilized with 0.1%Triton X-100, 0.1% sodium citrate solution and blocked with 3% BSA in PBS; the sections were thenincubated with the TUNEL mixture for 1 hr at 37°C. Sections were thoroughly rinsed in PBS, treatedwith 0.1% Sudan Black-B solution to quench autofluorescence and counterstained with DAPI. Sectionswere mounted and stored at 4℃. Images were obtained using a Leica TCS SP8 confocal microscope(Leica Microsystems). The images were analyzed using Image-Pro Premier v9.2 software (Media Cyber-netics). TUNEL-positive nuclei were counted and expressed as a percentage of the total number ofnuclei. Albuminuria Urine was collected from mouse bladders after sacrifice and snap frozen in liquid nitrogen. Urinealbumin and creatinine concentrations were evaluated in thawed urine samples using a DCA Vantage Figure 1. Hypoxia increases circulating ROS in patients with diabetes but not in control subjects withoutdiabetes. Healthy controls (A) and subjects with type 1diabetes(B) were exposed to intermittent hypoxia for1 hr. Peripheral blood was taken before (0h) and after(1h) hypoxia exposure. ROS levels were analyzed usingElectron Paramagnetic Resonance(EPR) Spectroscopywith CPH spin probes (n =10-13). Data are representedas mean ± SEM. *, p <0.05 analysed using unpairedtwo-sided Student’s t-test. This figure has one figuresupplement. Source data are shown in Figure 1source data 1. The online version of this article includes the followingsource data and figure supplement(s) for figure 1: Source data 1. ROS levels in blood from patients withdiabetes and control subjects. Figure supplement 1. Schematic demonstration ofhypoxia exposure protocol in the clinical study. Analyzer (Siemens Healthcare GmbH) with thecorresponding testcartridgesDCA Microal-bumin/Creatinine ACR urine testst(((01443699,Siemens Healthcare GmbH). Statistical analysis All data used for statistical analysis are indepen-dent biological replicates. Technical replicateswere applied during luciferase reporter, ELISA,caspase 3/7 activity, DNA and protein concentra-tion, and QPCR analysis; and the average of theresults from technical replicates is regarded as onebiological data. Statistical analysis was performedusing GraphPad Prism software. Outliers identi-fied using Grubbs'test were excluded from anal-ysis. The differences between two groups wereanalysed using unpaired】 two-sided Student'st-test. Multiple comparisons of three or moregroups were performed using one-way or two-way ANOVA followed by Bonferroni's post hoctest or Holm-Sidak's test, or Brown-Forsytheand Welch ANOVA tests followed by DunnettT3 multiple comparison test for sample set withunequal standard deviations. p <0.05 was consid-ered statistically significant. Data are presented asmean ± standard error of the mean (SEM). Results Hypoxia increases circulatingROS in patients with diabetes butnot in control subjects withoutdiabetes The effect of hypoxia on ROS production was evaluated in patients with poorly controlled type 1diabetes (28.9±7.2 years old; HbA1c: 74.4±11.8 mmol/mol) and matched control subjects withoutdiabetes (30.5±8.5 years old; HbA1c: 35.5±2.6 mmol/mol). Participants were exposed to mild andintermittent hypoxia (13% O2) for 1 hr (Figure 1-figure supplement 1), which is known to elicit aclinical response (Duennwald et al., 2013). As shown in Figure 1, ROS levels in peripheral blood wereincreased by hypoxia in patients with diabetes. However, hypoxia did not change the ROS levels innormoglycemic control subjects. High glucose concentrations inhibit HIF-1 signaling through PHD-dependent mechanism and induce apoptosis in hypoxia Since hypoxia induces ROS in diabetes, and HIF-1 is the central regulator of cellular responses tohypoxia (Prabhakar and Semenza, 2015), we hypothesized that the dysregulated HIF-1 signalingcontributes to the ROS overproduction in diabetes. We tested this hypothesis using mouse innermedulla collecting tubular cells (mlMCD-3), given the important pathogenic role of hypoxia in diabetickidney disease (Palm, 2006). As shown in Figure 2A, the nuclear expression of HIF-1a increased afterexposure to hypoxia; however, this effect was attenuated under hyperglycemic conditions. More-over, HRE-driven luciferase reporter assay showed less HIF activity in hypoxia under hyperglycemicconditions compared with normoglycemic conditions (Figure 2B). High glucose concentrations alsoincreased apoptosis of mlMCD3 cells during hypoxia (Figure 2C). Interestingly, when the cells wereexposed to dimethyloxalylglycine (DMOG), a competitive inhibitor of PHD, both HIF-1a expression(Figure 2A) and HIF-1 function (Figure 2D) were increased and apoptosis was inhibited (Figure 2E) Figure 2. High glucose levels inhibit HIF-1 signaling and induce apoptosis, which can be rescued by PHD inhibitor DMOG. (A) mIMCD-3 cells werecultured in normal (5.5 mM) or high (30 mM) glucose media in the presence of DMOG or vehicle for 24 hr, and were exposed to hypoxia (H) or normoxia(N) for 6 hr before harvest. The nuclear expression of HIF-1a and Histone H3 was measured using western blotting. (B-F) mIMCD-3 cells were exposedto 5.5 or 30 mM glucose levels in normoxia (N) or hypoxia (H) in the presence or absence of DMOG or vehicle for 24 hr. The relative HRE-drivenluciferase activity (B and D, n=6), apoptosis (C and E, n=4),and the caspase 3/7 activity (F, n=3-4) were assessed. (G) Caspase 3/7 activity wasevaluated in mlMCD-3 cells that were pre-treated with 1 mM NAC or vehicle for 1 hr before exposure to 5.5 or 30 mM glucose levels in normoxia (N) orhypoxia (H) for 24 hr (n =4). The data under control conditions were considered as 1.0. Data are shown as mean ±SEM.*, p<0.05;**, p <0.01; ***, p<0.001; ****, p <0.0001 using one-way ANOVA followed by Bonferroni's post hoc test (B-C, F-G), and unpaired two-sided Student t-test (D-E). Thisfigure has one figure supplement. Source data are shown in Figure 2-source data 1. The online version of this article includes the following source data and figure supplement(s) for figure 2: Source data 1. HRE-driven luciferase activity, apoptosis and caspase 3/7 activity in mlMCD3 cells. Figure supplement 1. Flow cytometry gating strategy for the evaluation of cellular apoptosis. under hypoxic and hyperglycemic conditions. These results indicate that high glucose levels inhibitHIF-1 and induce apoptosis in hypoxic mlMCD3 cells through a PHD-dependent mechanism. More-over, high glucose levels in hypoxia also enhanced caspase-3/7 activity in mlMCD3 cells, which couldbe inhibited by DMOG treatment (Figure 2F), suggesting that the apoptosis induced by high glucoselevels and hypoxia is dependent on caspase-3 and -7. We next assessed the role of ROS in mediating apoptosis induced by hyperglycemia under hypoxicconditions,by pretreatment of the mlMCD3 cells with the thiol reducing agent N-acetylcysteine(NAC).As shown in Figure 2G, pretreatment with NAC significantly inhibited the increase of caspase-3/7activity in mlMCD3 cells exposed to high glucose levels and hypoxia, indicating the role of ROS in theinduction of apoptosis in these conditions. Repression of HIF-1 by high glucose concentrations contributes toincreased mitochondrial ROS production in hypoxia We further investigated the influence of HIF-1 on mitochondrial ROS production in diabetes. Mitochon-drial ROS levels were increased in cells exposed to high glucose levels and hypoxia (Figure 3A), whichcorresponded to impaired HIF-1 activity. Interestingly, HIF-1 activation by DMOG diminished the mito-chondrial ROS overproduction induced by high glucose levels in hypoxia (Figure 3A), indicating HIF-1repression as an important mechanism for increased mitochondrial ROS production in diabetes. This Figure 3. High glucose levels induce mitochondrial ROS overproduction in hypoxia, which can be rescued by promoting HIF-1 function. (A)Mitochondrial ROS levels were measured as mitosox intensity in mlMCD-3 cells cultured in normal (5.5 mM) or high (30 mM) glucose media innormoxia (N) or hypoxia (H) for 24 hr in the presence of DMOG or vehicle (n=5). (B-D) mlMCD-3 cells were transfected with von Hippel-Lindautumour suppressor (VHL) or control (Ctrl) siRNA, and exposed to hypoxia (H) and 30 mM glucose for 24 hr. VHL gene expression (B, n=3), endogenousHIF-1α expression (red) and DAPI staining (blue) (C) and mitochondrial ROS levels (D, n=5) were assessed using quantitative RT-PCR, fluorescentimmunocytochemistry and flow cytometry, respectively. (E and F) mlMCD-3 cells were transfected with plasmids encoding GFP or GFP-HIF-1o,andexposed to hypoxia and 30 mM glucose for 24 hr. (E) Expression of GFP and GFP-HIF-1o (green) were detected using confocal microscopy. The nuclearHIF-1a expression was confirmed by immucytochemistry using anti-HIF-1a antibody (red). Nuclei were stained blue with DAPI.(F) Mitochondrial ROSlevels are shown (n=6). The mitosox intensity of cells cultured under control conditions were considered as 100%. Data are shown as mean ± SEM. *,p < 0.05; ***, p <0.001; ****, p <0.0001 using one-way ANOVA followed by Bonferroni's post hoc test (A), and unpaired two-sided Student t-test (B, Dand F). This figure has two figure supplements. Source data are shown in Figure 3-source data 1.Scale bar: 50 um. The online version of this article includes the following source data and figure supplement(s) for figure 3: Source data 1. Mitosox intensity and VHL gene expression in mlMCD3 cells. Figure supplement 1.Flow cytometry gating strategy for the evaluation of mitosox intensity. Figure supplement 2. Flow cytometry gating strategy for the evaluation of mitosox intensity in mlMCD3 cells transfected with plasmids encoding GFPor GFP-fused protein. was further confirmed by similar results that were observed when HIF-1 activity was maintained duringhyperglycemia in hypoxia by genetic approaches, that is silencing VHL that mediates HIF-1a degrada-tion(Figure 3B-D) or overexpressing HIF-1α(Figure 3E-F). Silencing VHL gene (Figure 3B) in mlMCD3cells exposed to hypoxia and high glucose levels was followed by an increase of nuclear HIF-1a expres-sion (Figure 3C) and lead to decreased mitochondrial ROS (Figure3D). Mitochondrial ROS was alsodecreased in mlMCD3 cells expressing GFP-HIF-1a compared to cells expressing GFP under hypoxicand hyperglycemic conditions (Figure 3E-F). Taken together, these results suggest that mitochondrialROS overproduction in cells exposed to a combination of hypoxia and hyperglycemia is dependent onthe impairment of HIF-1 function and can be attenuated when HIF-1 activity is maintained. HIF-1 repression is responsible for excess ROS production in diabetickidney To investigate the relevance of HIF-1 modulation on ROS levels in diabetes, we further focused ourinvestigation on the kidney, where low oxygen levels play an important pathogenic role (Palm et al.,2003). ROS levels were higher in the kidney from mouse models of both type 2 diabetes (Leprdb/dbmice) and streptozotocin (STZ)-induced type 1 diabetes, as evaluated by 4-Hydroxynonenal (HNE)levels (Figure 4B and D). At the same time, HIF-1 signaling was repressed, as shown by insufficientactivation of HIF-1a (Figure 4A and C), despite a profound hypoxic environment indicated by pimo-nidazole staining (Figure 4—figure supplement 1). This reverse correlation between ROS and HIF-1activity further supports the hypothesis that the repression of HIF-1 signaling contributes to the ROSoverproduction in diabetes. We therefore sought to assess the influence of promoting HIF-1 function during hyperglycemia onROS production in these animals. To this end, we inhibited PHD activity, either through pharmaco-logical inhibition, by treatment of the Leprdb/db mice with DMOG or through genetic modification byemploying Egln1* mice in the STZ-induced model of diabetes. Both methods were able to increaseHIF-1α levels (Figure 4A and C) and HIF-1 activity, as assessed by HIF-1 target gene expression,despite persistence of hyperglycemia (Figure 4—figure supplements 2 and 3). Importantly, HIF-1activation in the kidney was followed by a decrease in renal ROS levels in both Leprdb/cb mice and STZ-induced diabetic mice (Figure 4B and D). Investigation of mitochondrial respiration in the kidneys of both animal models revealed anincrease of the complex l- and complex 1+ Il-mediated state three respiration and mitochondrialleak (Figure 4E and F). Promoting HIF-1 activity in the kidney of diabetic animals, by either DMOGtreatment or by haplodeficiency of Egln1, was followed by normalization of perturbed mitochondrialrespiration (Figure 4E and F). Pyruvate dehydrogenase kinase 1 (PDK1), a direct HIF-1 target genethat inhibits the flux of pyruvate through tricarboxylic acid cycle (TCA) and subsequent mitochon-drial respiration (Kim et al., 2006), was down-regulated in diabetic kidneys and could be rescued byHIF-1 activation (Figure 4G and H). These results indicate an important role of PDK1 in mediatingthe effects of HIF-1 on the regulation of ROS production in diabetic kidney. In order to verify thismechanism, we transfected plasmids encoding GFP or GFP-fused PDK1 (GFP-PDK1) in mlMCD3 cellsexposed to high glucose levels in hypoxia (Figure 4l), and assessed the mitochondrial ROS levelsusing flow cytometry analysis of mitosox intensity in GFP-or GFP-PDK1-positive cells. As shown inFigure 4J, PDK1 overexpression diminished the mitochondrial ROS overproduction in cells exposedto high glucose levels in hypoxia, suggesting that the increased mitochondrial ROS is at least partiallymediated by the inhibition of HIF-1 target gene PDK1 in these conditions. Promoting HIF-1 function reduces renal injury and ameliorates renaldysfunction in mouse models of diabetes Promoting HIF-1 function in diabetic animals, with its secondary suppression of ROS production,exerted protective effects on kidney function. In both Leprdb/db mice (Figure 5A-C , and G) and micewith STZ-induced diabetes (Figure 5D-F, and H), promoting HIF-1 function prevented typical diabetickidney lesions, as measured by reduced Kidney Injury Marker-1 (KIM-1) expression (Figure 5A-B, andD-E) and TUNEL staining-assessed apoptosis (Figure 5C and F). This resulted in improved renal func-tion, as demonstrated by decreased albuminuria in both mouse models of diabetes (Figure 5G-H). Discussion Excessive mitochondrial ROS production is a central pathogenic contributor to the development ofdiabetic complications. In addition, excessive ROS stimulate several other deleterious biochemicalpathways such as activation of protein kinase C, formation of advanced glycation end-products, polyolpathway flux and overactivity of the hexosamine pathway (Nishikawa et al., 2000). Here, we showthat in diabetic models, overproduction of ROS from mitochondria is not due to increased electrontransport chain flux secondary to hyperglycemia alone. Impairment of HIF-1 signaling is also a criticalmechanism, since promoting HIF-1 activity in diabetic models in vitro and in vivo attenuated ROSproduction, despite the persistence of hyperglycemia, which prevents the development of oxidativestress-induced kidney injury. Figure 4. Promoting HIF-1 function attenuates renal ROS excess and mitochondrial respiration in mouse models of diabetes. Kidneys were harvestedfrom wild-type (WT) and Leprdb/db diabetic mice (db/db) that were treated with placebo (vehicle) or DMOG (A-B, E, G), and from non-diabetic control(Ctrl) or diabetic (Db) wild-type (WT) and Egln1*mice (C-D, F, H). (Aand C) HIF-1α (green), pimonidazole (red, hypoxia marker) and DAPI (blue,nuclear staining) signals were detected by fluorescent immunohistochemistry, and relative HIF-1a expression levels were quantified (A, n=4-5;C,n=4-6). Scale bar: 100 um. (B and D) Renal ROS levels were detected using the OxiSelect HNE adduct competitive ELISA kit (B, n =7-10; D,n=5-8). (Eand F) Mitochondrial respiratory function was evaluated using high resolution respirometry (E, n=4-9; F, n=11-17). (G and H) PDK1 gene expressionin kidneys (G, n = 4-9; H, n=4-6). (I and J) mlMCD-3 cells were transfected with plasmids encoding GFP or GFP-PDK1,and exposed to hypoxia and30 mM glucose (H30) for 24 hr. (l) Expression of GFP and GFP-HIF-1o (green) and nuclear DAPI staining (blue) were detected using confocal microscopy.Scale bar: 50 um. (J) Mitochondrial ROS levels are shown (n=4). Data are shown as mean ± SEM. *, p<0.05;**, p < 0.01; ***, p <0.001; ****, p <0.0001using one-way ANOVA (A, B, E, G) and two-way ANOVA (C, D, F, H) followed by multi-comparison post hoc tests, and unpaired two-sided Student Figure 4 continued on next page Figure 4 continued t-test(J). This figure has three figure supplements. Source data are shown in Figure 4—source data 1. The online version of this article includes the following source data and figure supplement(s) for figure 4: Source data 1. HIF-1a, ROS, and mitochondrial respiration levels in mouse kidneys and PDK1 gene expression and Mitosox intensity in mlMCD3 cells. Figure supplement 1. Kidney in diabetes is more hypoxic. Figure supplement 1—source data 1. Quantification of Pimonidazole immunofluorescent signal in mouse kidneys. Figure supplement 2. DMOG increases HIF-1 target gene expression in Leprdb/db mice without affecting blood glucose levels. Figure supplement 2-source data 1. Blood glucose and HIF-1 target gene expression levels in Leprdb/db mice. Figure supplement 3. Egln1 haplodeficiency increases HIF-1 target gene expression in diabetic mice without affecting blood glucose levels. Figure supplement 3-source data 1. HbA1c and gene expression levels in Egln1and WT mice. In subjects with diabetes, ROS levels increase after exposure to hypoxia in opposition to controlsubjects. Acute hypoxia can unmask the impaired HIF-1 signaling that presents in patients withdiabetes. However, other ROS sources responsive to acute hypoxia, either from mitochondria(Hernansanz-Agustin et al.,2020;Waypa et al., 2013) or from elsewhere (Weissmann et al., 2000)cannot be excluded. The concentration of oxygen in tissues ranges from 1% to 10%, which contin-uously activates HIF-1 signaling machinery (Carreau et al.,2011). Therefore, the small decrease inoxygen tension present in patients with diabetes (Bernardi et al., 2017), combined with an impairedHIF-1 activation (Catrina et al., 2004), may contribute to increased ROS levels in tissues associatedwith diabetic complications. Indeed, the direct relationship between hyperglycemia-dependent repression of HIF-1 signalingand excess ROS in hypoxia was demonstrated experimentally both in vitro and in vivo in this study. Wefound that HIF-1 signaling was inhibited by hyperglycemia in tubular cells during hypoxia and in kidneysfrom mouse models of diabetes, through a PHD-dependent mechanism, which is in accordance withprevious observations (Bento and Pereira, 2011; Catrina, 2014). This was followed by increased ROSproduction in mitochondria, when assessed by a specific mitochondrial probe (Wang et al., 2010),which was not evident under hyperglycemic conditions when HIF-1 function was promoted withdifferent approaches. The relationship between HIF-1 and ROS is bidirectional, with most evidenceshowing that mitochondrial ROS has a stabilizing effect on HIF-1a (Brunelle et al., 2005; Chandelet al., 1998; Guzy et al., 2005), although the exact mechanisms are still unclear. Several mechanismsin the repressive effects of HIF-1 signaling on mitochondrial ROS production have also been identified(Fukuda et al., 2007; Kim et al., 2006). Our results indicate that the role of HIF-1 on ROS is due tothe decreased respiration rate of the mitochondria, since both pharmacological and genetic inductionof HIF-1 prevents increased respiration. This effect is at least partially mediated by HIF-1 target genePDK1, that has been previously shown to inhibit pyruvate dehydrogenase (PDH) activity, leading toreduced flux of lactate through TCA cycle and electron transport chain (Kim et al., 2006). Along with the cellular systems that mitigate the effect of ROS (e.g. Nrf2) (Jiang et al., 2010), theincreased mitochondrial leak noted in diabetes is a pathway aimed at diminishing ROS productionby decreasing mitochondrial membrane potential (Echtay et al., 2002; Miwa and Brand, 2003).However, to produce enough ATP, this is followed by increased flux through the electron transportchain. Although HIF-1 activity normally suppresses electron transport chain, this regulation is dimin-ished in diabetes, resulting in an increased oxygen consumption rate and aggravation of cellularhypoxia that contributes to tissue injury. This was confirmed by increased pimonidazole staining indiabetic kidney in this study, as previously observed (Rosenberger et al., 2008). Thus, our resultsprovide evidence for repressed HIF-1 in diabetes as a critical mechanism underlying the vicious cyclebetween oxidative stress and hypoxia, which is suggested to contribute to kidney injury (Honda et al.,2019). Indeed, pharmacological or genetic interventions to sustain HIF-1 signaling in diabetes normalizedROS production and had direct consequences on kidney function, despite persistent hyperglycemia.Albuminuria, a typical marker of diabetic nephropathy, was prevented in animal models of either type1 or type 2 diabetes when HIF-1 signaling was maintained. This is in accordance with the previous Figure 5. Promoting HIF-1 function reduces renal injury and ameliorates renal dysfunction in mouse models of diabetes. Kidneys were harvested fromwild-type (WT) and Leprdb/db diabetic mice (db/db)that were treated with placebo (vehicle) or DMOG (A-C, G), and from non-diabetic control (Ctrl)or diabetic (Db) wild-type (WT) and Egln1*(+/-) mice (D-F, H). (A and D) Representative images of KIM-1 (red or green) and DAPI (blue) in kidneythat were analysed using fluorescent immunohistochemistry. Quantifications of KIM-1 fluoresent signal are shown in corresponding histogram (A, n =3-4;D, n=3-6). (B and E) Representative images of KIM-1 and o-tubulin analyzed by western blotting. (C and F) Apoptotic cells were detected usingTUNEL staining, and the percentage of TUNEL-positive cells were quantified (C, n=4;F: n=3-5). (G and H) Albuminuria is presented as the ratio ofalbumin (Alb) to creatinine in mouse urine (G, n=7-13;H,n=4-6). Data are shown as mean ± SEM. *, p<0.05;**, p<0.01;***, p <0.001 analysedusing one-way ANOVA (A, C), Brown-Forsythe and Welch ANOVA (G) and two-way ANOVA (D, F, H) followed by multi-comparison test. Source data areshown in Figure 5—source data 1. Scale bar: 100 um. The online version of this article includes the following source data for figure 5: ( Source data 1. Evaluation of renal KIM-1 and T UNEL s t aining and albuminuria of mouse models. ) Figure 6. Repression of HIF-1 contributes to increased mitochondrial ROS production in diabetes. Under non-diabetic conditions (left panel), HIF-1 is induced by hypoxia and activates PDK1 expression which inhibits excessmitochondrial ROS production through inhibition of mitochondrial respiration. However, under diabetic conditions(right panel), HIF-1 is inhibited by high glucose levels through a PHD-dependent mechanism despite hypoxia.This results in decreased expression of PDK1,leading to increased mitochondrial respiration and excessivemitochondrial ROS production which causes tissue damage. reports after exposure to cobalt, which also stabilizes HIF-1a (Ohtomo et al., 2008). The expressionof the proximal tubular damage marker KIM-1, which in diabetic nephropathy becomes positive evenbefore detection of albuminuria (Nauta et al., 2011; Nordquist et al., 2015), was not evident whenROS levels were suppressed by promoting HIF signaling in both animal models. This is in agree-ment with the absence of an increase of KIM-1 in diabetic kidneys where the renal oxygen levelswere normalized (Friederich-Persson et al., 2018). Moreover, apoptosis, another classical marker ofROS damage in diabetic nephropathy (Allen et al., 2003), was reduced not only in DMOG-treatedmlMCD3 cells exposed to high glucose concentrations in hypoxia but also in DMOG-treated Leprdb/dbmice and diabetic Egln1*mice. Thus, promoting HIF-1 is a promising therapeutic strategy to preventor treat even other chronic diabetes complications since excessive production of mitochondrial ROS isa key common driver of diabetic complications (Charlton et al., 2020; Giacco and Brownlee, 2010). In conclusion, we demonstrate that the PHD-dependent HIF-1 repression induced by high glucoseconcentrations contributes to excessive production of mitochondrial ROS in diabetes, which is medi-ated by increased mitochondrial respiration secondary to the inhibition of HIF-1 target gene PDK1(Figure 6). Promoting HIF-1 function is sufficient to normalize ROS levels during hyperglycemia andprotects against diabetic nephropathy, making HIF-1 signaling an attractive therapeutic option for diabetes complications. This is a timely finding, given that the first PHD inhibitor that can activateHIF-1 has been recently approved for clinical use (Chen et al., 2019). Acknowledgements We thank to Valeria Alferova and Anette Landstrom from Karolinska Institutet, and Natasha Widen,Kajsa Sundqvist and Anette Harstrom from Karolinska University Hospital for excellent technicalassistance. Additional information Funding Vetenskapsradet Sergiu-Bogdan Catrina Stockholms Lans Landsting Sergiu-Bogdan Catrina Stockholm Regional Sergiu-Bogdan Catrina Research Foundation Bert von Kantzows Sergiu-Bogdan Catrina Foundation Swedish Society of Sergiu-Bogdan Catrina Medicine Kung GustafV:s och Sergiu-Bogdan Catrina Drottning Victorias Frimurarestifelse Karolinska Institute's Sergiu-Bogdan Catrina Research Foundations Strategic Research Sergiu-Bogdan Catrina Programme in Diabetes Erling-Persson Family Foundation Sergiu-Bogdan Catrina Vetenskapsradet 2020-01645 Tomas A Schiffer Swedish Heart and Lung 20210431 Tomas A Schiffer Foundation ERC consolidator grant 773208 Massimiliano Mazzone The funders had no role in study design, data collection and interpretation, or thedecision to submit the work for publication. Author contributions Xiaowei Zheng, Conceptualization, Data curation, Formal analysis, Funding acquisition, Investiga-tion, Methodology, Project administration, Supervision, Validation, Visualization, Writing - originaldraft, Writing- review and editing; Sampath Narayanan, Cheng Xu, Data curation, Formal analysis,Investigation, Methodology, Validation, Visualization, Writing - original draft, Writing - review andediting; Sofie Eliasson Angelstig, Allan Zhao, Data curation, Formal analysis, Investigation, Validation,Writing - review and editing; Jacob Grunler, Data curation, Investigation, Methodology, Validation,Writing- review and editing; Alessandro Di Toro, Methodology, Writing- review and editing; LucianoBernardi, Conceptualization, Methodology, Resources, Writing - review and editing; MassimilianoMazzone, Peter Carmeliet, Resources, Writing - review and editing; Marianna Del Sole, ElisabeteA Forsberg, Neda Rajamand Ekberg, Investigation, Writing- review and editing; Giancarlo Solaini,Writing - review and editing; Ao Zhang, Data curation, Investigation, Writing - review and editing;Kerstin Brismar, Conceptualization, Funding acquisition, Resources, Supervision, Writing-review andediting; Tomas A Schiffer, Data curation,Investigation, Methodology, Resources, Writing- review andediting; lleana Ruxandra Botusan, Investigation, Writing- original draft, Writing- review and editing; Fredrik Palm, Conceptualization, Funding acquisition,Resources, Supervision, Visualization, Writing-original draft, Writing-review and editing; Sergiu-Bogdan Catrina, Conceptualization, Funding acqui-sition, Project administration, Resources, Supervision, Visualization, Writing- original draft, Writing- review and editina Author ORCIDs Xiaowei Zheng @D hHttp://orcid.org/0000-0002-2648-1119 Allan Zhao D) http://orcid.org/0000-0002-2492-0923 Alessandro Di Toro D http://orcid.org/0000-0001-7625-1103Peter Carmmeelliieett DD http://orcid.org/0000-0001-7961-1821 Neda Rajamand Ekberg D http://orcid.org/0000-0001-5597-2593 Sergiu-Bogdan Catrina @http://orcid.org/0000-0002-6914-3902 Ethics The clinical study was approved by the Regional Ethical Review Board in Stockholm, Sweden, andcarried out in accordance with the principles of the Declaration of Helsinki. All participants in the studyprovided informed consent. The experimental animal procedure was approved by the North Stockholm Ethical Committee for theCare and Use of Laboratory Animals (ethical permission N250/15, N60/15,and N179/16). Decision letter and Author response Decision letter https://doi.org/10.7554/eLife.70714.sa1 Author response https://doi.org/10.7554/eLife.70714.sa2 Additional files Supplementary files Transparent reporting form · Source data 1. Unedited blots. Data availability All data generated or analysed during this study are included in the manuscript and supporting files.Source data files have been provided for all the figures and tables. References Allen DA, Harwood S, Varagunam M, Raftery MJ, Yaqoob MM. 2003. High glucose-induced oxidative stresscauses apoptosis in proximal tubular epithelial cells and is mediated by multiple caspases. FASEB Journal17:908-910. DOl: https://doi.org/10.1096/fj.02-0130fje, PMID: 12670885 Bento CF, Pereira P. 2011. Regulation of hypoxia-inducible factor 1 and the loss of the cellular response tohypoxia in diabetes. Diabetologia 54:1946-1956. DOI: https://doi.org/10.1007/s00125-011-2191-8, PMID:21614571 Bernardi L, Rosengard-Barlund M, Sandelin A, Makinen VP, Forsblom C, Groop P-H, FinnDiane Study Group.2011. Short-term oxygen administration restores blunted baroreflex sensitivity in patients with type 1 diabetes.Diabetologia 54:2164-2173. DOI: https://doi.org/10.1007/s00125-011-2195-4, PMID: 21647699 Bernardi L, Gordin D, Bordino M, Rosengard-Barlund M, Sandelin A, Forsblom C, Groop PH. 2017. Oxygen-induced impairment in arterial function is corrected by slow breathing in patients with type 1 diabetes.Scientific Reports 7:6001. DOl: https://doi.org/10.1038/s41598-017-04947-4, PMID: 28729675 Brunelle JK, Bell EL, Quesada NM, Vercauteren K, Tiranti V, Zeviani M, Scarpulla RC, Chandel NS. 2005. Oxygensensing requires mitochondrial ROS but not oxidative phosphorylation. Cell Metabolism 1:409-414. DOI:https://doi.org/10.1016/j.cmet.2005.05.002, PMID: 16054090 ( Carreau A, E l Hafny-Rahbi B, Matejuk A, Grillon C, Kieda C. 2011. Wh y is t h e partial oxygen pre s sure of human tissues a crucial parameter? Small molecules and hypoxia. Journal of Cellular and Molecular Medicine 15:1239- 1253. DOI : h tt ps://doi. or g / 1 0 .111 1 /j.1582-4934.20 1 1 .01258. x , PMID : 2 1 2 512 1 1 ) Catrina SB, Okamoto K, Pereira T, Brismar K, Poellinger L. 2004. Hyperglycemia regulates hypoxia-induciblefactor-1alpha protein stability and function. Diabetes 53:3226-3232. DOI: https://doi.org/10.2337/diabetes.53.12.3226, PMID: 15561954 Catrina SB. 2014. Impaired hypoxia-inducible factor (HIF) regulation by hyperglycemia. Journal of MolecularMedicine (Berlin, Germany) 92:1025-1034. DOI: https://doi.org/10.1007/s00109-014-1166-x, PMID: 25027070Catrina SB, Zheng X. 2021. Hypoxia and hypoxia-inducible factors in diabetes and its complications. Diabetologia 64:709-716. DOI: https://doi.org/10.1007/s00125-021-05380-z, PMID: 33496820 Chandel NS, Maltepe E, Goldwasser E, Mathieu CE, Simon MC, Schumacker PT. 1998. Mitochondrial reactive oxygen species trigger hypoxia-induced transcription. PNAS 95:11715-11720. DOI: https://doi.org/10.1073/ pnas.95.20.11715, PMID: 9751731 Charlton A, Garzarella J, Jandeleit-Dahm KAM, Jha JC. 2020.Oxidative Stress and Inflammation in Renal andCardiovascular Complications of Diabetes. Biology 10:18. DOI: https://doi.org/10.3390/biology10010018,PMID:33396868 Chen N, Hao C, PengX, Lin H, Yin A, Hao L, Tao Y, Liang X, Liu Z, Xing C, Chen J, Luo L, Zuo L, Liao Y, Liu B-C,Leong R, Wang C, Liu C, Neff T, Szczech L, et al. 2019. Roxadustat for Anemia in Patients with Kidney DiseaseNot Receiving Dialysis. The New England Journal of Medicine 381:1001-1010. DOI: https://doi.org/10.1056/NEJMoa1813599, PMID: 31340089 ( Dikalov SI, Polienko YF, Kirilyuk l. 2018 . Electro n Paramagnetic Resonance Measurements of Reac t ive Oxyg e nSpecies by Cyclic Hydroxylamine Spin Probes. Antioxidants & Redox Signaling 28:1433-1443. DOl : htt p s:/ /d oi. or g /10. 1 089/ars.2017.7396, PMI D: 290 3 7084 ) Duennwald T, Bernardi L, Gordin D, Sandelin A, Syreeni A, Fogarty C, Kyto JP, Gatterer H, Lehto M, Horkko S,Forsblom C, Burtscher M, Groop P-H, FinnDiane Study Group. 2013. Effects of a single bout of interval hypoxiaon cardiorespiratory control in patients with type 1 diabetes. Diabetes 62:4220-4227. DOI: https://doi.org/10.2337/db13-0167, PMID: 23733200 ( E c htay K S , Roussel D, St-Pierre J, Jekabsons M B, Cadenas S, Stuart JA, Harper JA, R o ebuck SJ, Morrison A, Pickering S, Clapham J C , B r and MD. 2002. Sup e roxide activates mitochondrial uncoupling proteins. Nature 415:96-99.D OI: h t tp s: / /do i . or g/1 0 .1038/415096 a , PMID : 1 1780125 ) ( Friederich-Persson M, P ersson P, Hansell P, Palm F . 2018. Deletion of Uncoupling Protein-2 reduces r enalmitochondrial leak respiration, intrarenal hypoxia and proteinuria in a mouse model of type 1 diabetes. Acta Physiologica (Oxford, England) 223:e13058.DO I: ht t ps :/ / d oi . org / 1 0 . 1 1 1 1/apha. 1 30 5 8, P MI D : 29 48 0 974 ) ( Fukuda R, Zhang H , Kim J, Shimoda L , Dang C V , Semenza GL. 2007. HIF-1 regulates cytochrome oxidasesubunits to optimize efficiency of respiration i n hypoxic ce l ls. Cell 129:111-122. DOI : https : // d oi.org /1 0.10 1 6 /j. c el l .200 7 .01. 0 47 , PMID : 17418790 ) ( Giacco F , Brownlee M . 2010. Oxidative stress and diabetic complications. C i rculation Research 1 0 7:1058-1070. D OI: ht tp s://doi.org/1 0 . 1161/CIRCRESAHA. 11 0.2 2 3545 ,P M ID : 2 103 0 723 ) ( Guzy RD, Hoyos B, R o bin E , Chen H, Liu L, Mansfield KD, Simon MC, Hammerling U, Schumacker PT. 2005.Mitochondrial c omplex III is required for hypoxia-induced ROS production and cellular oxygen s ensing. Cell Metabolism 1:401-4 0 8. D O I: h t tp s :// doi . o r g/10. 10 1 6 /j . cmet. 2 0 05. 0 5 . 00 1 , P M I D : 1 6 0540 8 9 ) ( Haase VH. 2017. Oxygen sensors as therapeutic targets in k i dney disease. Nephrologie & T herapeutique 13 Suppl 1 :S29-S34. D OI: h t t p s://d o i . o rg/ 1 0 . 1016/j.n ep hro.2017.0 1 .0 1 5, PMID: 28577740 ) ( H e rnansanz-Agust i n P, C hoya-Foces C, Car r egal-Rom e ro S, Ramo s E, Oliva T, Villa- P ina T, Moreno L, Izquierdo-Alvarez A, Cabrera-Garcia JD,Cortes A, Lechuga-Vieco AV, Jadiya P, Navarro E, Parada E,Palomino-Antolin A, Tello D, Acin-Perez R, R o driguez-Aguilera JC, Navas P, Cogolludo A, et al. 202 0 . Na* controls hypoxic signalling by the mitochondrial respiratory chain. Nature 586:287-291. DO I : ht t ps: // doi . or g / 1 0 .1038/s4 1 586-020-2551- y, PM ID : 32728214 ) ( H o nda T, Hirakawa Y, Nangaku M. 2019. The role of oxidative stress and hypoxia in renal disease. Kidney Research and Clinical Practice 38:414-426. D OI : h t t ps : // do i . org / 10.23876/j. k rc p. 19.063, PMID: 31558011 ) Jiang T, Huang Z, Lin Y, Zhang Z, Fang D, Zhang DD. 2010. The protective role of Nrf2 in streptozotocin-induced diabetic nephropathy. Diabetes 59:850-860. DOI: https://doi.org/10.2337/db09-1342, PMID: 20103708 Kim J, Tchernyshyov l, Semenza GL, Dang CV. 2006. HIF-1-mediated expression of pyruvate dehydrogenasekinase: a metabolic switch required for cellular adaptation to hypoxia. Cell Metabolism 3:177-185. DOI:https://doi.org/10.1016/j.cmet.2006.02.002, PMID: 16517405 ( Mazzone M, Det tori D, de Oliveira RL, Lo g es S, S chmidt T, Jonckx B, Tian Y-M , L anahan AA, Polla r d P,de Almodovar CR , De Smet F, Vinckier S, Aragones J, Deb a ckere K, Luttun A, Wyns S, Jordan B, Pisacane A, Gallez B, Lampugnani M G , et al. 2009. Heterozygous deficiency of PHD2 restores tumor oxygenation and i nhibits metastasis via endothelial normalization. Cell 136:839-851. D O I: h t t p s: / / doi.org/ 10 . 1 0 16/j.cell.2009 . 0 1 . 0 2 0 , PMID: 1 9217150 ) Miwa S, Brand MD. 2003. Mitochondrial matrix reactive oxygen species production is very sensitive to milduncoupling. Biochemical Society Transactions 31:1300-1301. DOl: https://doi.org/10.1042/bst0311300, PMID:14641047 ( Na u ta F L , Boertien WE, Bakker SJ L , van Goor H, van Oeveren W, de J o ng PE, Bilo H, G a nsevoort RT. 2011.Glomerular and tubular damage ma r kers are elevated in patients with diabetes. Diabetes Care 34:975-981. DO I: h tt p s: // doi . o rg /10 . 2337/dc 1 0- 1 545, PM I D : 2 1307379 ) ( Nishikawa T , Edelstein D , Du XL, Yamagishi S, Matsumura T , Kaneda Y, Yorek MA, Beebe D, Oates PJ, Hammes HP, Giardino l, Brownlee M. 2000. Normalizing mitochondrial superoxide production blocks three pathways of hyperglycaemic damage. Nature 404:787-790. DO l : h t t ps: / /do i .o r g / 10. 1 03 8 /3 5 0 08121, P M ID : 10 783895 ) ( Nordquist L, F r iederich-Persson M, Fasching A, Liss P, Shoji K, Nangaku M, Hansell P, Palm F. 2015. Activation ofhypoxia-inducible f actors prevents diabetic nephropathy. Journal of the American S ociety of Nephrology 26:328-338.D OI: ht t ps://doi . o rg /1 0 .1681/ AS N. 2 01 30 90990, P M ID: 251 8 3809 ) ( Ohtomo S, Na n gaku M, I z uhara Y, Takizawa S, Strihou C, Miyata T. 2008. Cobalt ameliorates renal injury in an o bese, hypertensive type 2 diabetes rat model . Nephrology, Dialysis, Transplantation23:1166-1172 . DO I: h tt ps://do i .o r g/10.1093 / ndt /gf m715 , PMID: 1 7967803 ) Palm F, Cederberg J, Hansell P, Liss P, Carlsson PO. 2003. Reactive oxygen species cause diabetes-induced decrease in renal oxygen tension. Diabetologia 46:1153-1160.DOI: https://doi.org/10.1007/s00125-003-1155- z, PMID: 12879251 Palm F. 2006. Intrarenal oxygen in diabetes and a possible link to diabetic nephropathy. Clinical andExperimental Pharmacology &Physiology 33:997-1001. DOI: https://doi.org/10.1111/j.1440-1681.2006.04473.x, PMID: 17002679 Prabhakar NR, Semenza GL. 2015. Oxygen Sensing and Homeostasis. Physiology (Bethesda, Md.) 30:340-348.DOI: https://doi.org/10.1152/physiol.00022.2015, PMID: 26328879 Rosenberger C, Khamaisi M, Abassi Z, Shilo V, Weksler-Zangen S, Goldfarb M, Shina A, Zibertrest F, Eckardt K-U,Rosen S, Heyman SN. 2008. Adaptation to hypoxia in the diabetic rat kidney. Kidney International73:34-42.DOI: https://doi.org/10.1038/sj.ki.5002567, PMID: 17914354 Schiffer TA, Gustafsson H, Palm F. 2018. Kidney outer medulla mitochondria are more efficient compared with cortex mitochondria as a strategy to sustain ATP production in a suboptimal environment. American Journal of Physiology. Renal Physiology 315:F677-F681. DOI: https://doi.org/10.1152/ajprenal.00207.2018, PMID: 29846107 Schodel J, Ratcliffe PJ. 2019. Mechanisms of hypoxia signalling: new implications for nephrology. NatureReviews. Nephrology 15:641-659. DOI: https://doi.org/10.1038/s41581-019-0182-z, PMID: 31488900 Semenza GL. 2017. Hypoxia-inducible factors: coupling glucose metabolism and redox regulation with induction of the breast cancer stem cell phenotype. The EMBO Journal 36:252-259. DOI: https://doi.org/10.15252/ embj.201695204, PMID: 28007895 Wang D, Malo D, Hekimi S. 2010. Elevated mitochondrial reactive oxygen species generation affects the immuneresponse via hypoxia-inducible factor-1alpha in long-lived Mclk1+/- mouse mutants. Journal of Immunology(Baltimore, Md 184:582-590. DOI: https://doi.org/10.4049/jimmunol.0902352, PMID: 20007531 Waypa GB, Marks JD, Guzy RD, Mungai PT, Schriewer JM, Dokic D, Ball MK, Schumacker PT. 2013. Superoxidegenerated at mitochondrial complex III triggers acute responses to hypoxia in the pulmonary circulation.American Journal of Respiratory and Critical Care Medicine 187:424-432. DOI: https://doi.org/10.1164/rccm.201207-1294OC, PMID: 23328522 Weissmann N, Tadic A, Hanze J, Rose F, Winterhalder S, Nollen M, Schermuly RT, Ghofrani HA, Seeger W,Grimminger F.2000. Hypoxic vasoconstriction in intact lungs: a role for NADPH oxidase-derived H(2)O(2)?American Journal of Physiology. Lung Cellular and Molecular Physiology 279:L683-L690. DOI: https://doi.org/10.1152/ajplung.2000.279.4.L683, PMID: 11000128 Zheng X, Ruas JL, Cao R, Salomons FA, Cao Y, Poellinger L, Pereira T. 2006. Cell-type-specific regulation ofdegradation of hypoxia-inducible factor 1 alpha: role of subcellular compartmentalization. Molecular andCellular Biology 26:4628-4641. DOI: https://doi.org/10.1128/MCB.02236-05, PMID: 16738327 Appendix 1 Appendix 1-key resources table Appendix 1 Continued on next page Appendix 1 Continued on next page Appendix 1 Continued of heng, Narayanan,Xu, et al. eLife eDOI: https://doi.org/eLife. 文章题目:Repression of hypoxia-inducible factor-1 contributes to increased mitochondrial reactive oxygen species production in diabetes低氧诱导因子-1 的抑制可增加糖尿病患者线粒体活性氧的产生文章出处:Elife, 2022, 11: undefined.瑞典斯德哥尔摩卡罗林斯卡医学院分子医学与外科学系工作站使用情况:Ruskinn INVIVO2使用气体浓度:低氧(1% O2)摘要:线粒体活性氧(ROS)的过度产生是糖尿病并发症发生的中心机制。最近,缺氧已被证实在糖尿病中发挥额外的致病作用。在这项研究中,我们假设ROS 过量产生是继发于高血糖抑制缺氧诱导因子-1 (HIF-1)导致的缺氧反应受损。研究人员分析了暴露于低氧环境下的健康人和1 型糖尿病患者血液中的ROS 水平。在糖尿病小鼠模型中,研究了肾mIMCD-3 细胞和肾脏中HIF-1、葡萄糖水平、ROS 产生及其功能后果的关系。研究发现在糖尿病患者中,低氧暴露会增加循环ROS,但在非糖尿病患者中则不会;高糖通过HIF 脯氨酸羟化酶(PHD)依赖机制抑制了糖尿病动物的缺氧细胞和肾脏中的HIF-1 的表达;HIF-1 信号通路受损,通过丙酮酸脱氢酶激酶1 (PDK1)介导的线粒体呼吸增加,促进线粒体ROS 的过量产生;在糖尿病患者中,HIF-1 功能的恢复降低了持续高血糖情况下ROS 的过度产生,并对细胞凋亡和肾损伤具有保护作用。表明HIF-1 的抑制在糖尿病线粒体ROS 过剩产生中起着核心作用,并且是糖尿病并发症的潜在治疗靶点。Figure 1. Hypoxia increases circulating ROS in patients with diabetes but not in control subjects without diabetes. Healthy controls (A) and subjects with type 1 diabetes (B) were exposed to intermittent hypoxia for 1 hr. Peripheral blood was taken before (0h) and after (1h) hypoxia exposure. ROS levels were analyzed using Electron Paramagnetic Resonance (EPR) Spectroscopy with CPH spin probes (n = 10–13). Data are represented as mean ± SEM. *, p < 0.05 analysed using unpaired two-sided Student’s t-test. This figure has one figure supplement.Figure 3. High glucose levels induce mitochondrial ROS overproduction in hypoxia, which can be rescued by promoting HIF-1 function. (A) Mitochondrial ROS levels were measured as mitosox intensity in mIMCD-3 cells cultured in normal (5.5 mM) or high (30 mM) glucose media in normoxia (N) or hypoxia (H) for 24 hr in the presence of DMOG or vehicle (n = 5). (B–D) mIMCD-3 cells were transfected with von Hippel–Lindau tumour suppressor (VHL) or control (Ctrl) siRNA, and exposed to hypoxia (H) and 30 mM glucose for 24 hr. VHL gene expression (B, n = 3), endogenous HIF-1α expression (red) and DAPI staining (blue) (C) and mitochondrial ROS levels (D, n = 5) were assessed using quantitative RT-PCR, fluorescent immunocytochemistry and flow cytometry, respectively. (E and F) mIMCD-3 cells were transfected with plasmids encoding GFP or GFP-HIF-1α,and exposed to hypoxia and 30 mM glucose for 24 hr. (E) Expression of GFP and GFP-HIF-1α (green) were detected using confocal microscopy. The nuclear HIF-1α expression was confirmed by immucytochemistry using anti-HIF-1α antibody (red). Nuclei were stained blue with DAPI. (F) Mitochondrial ROS levels are shown (n = 6). The mitosox intensity of cells cultured under control conditions were considered as 100%. 参与者间歇性低氧(13% O2) 1 小时,研究发现糖尿病患者缺氧时外周血ROS 水平升高。然而,在血糖正常的对照组中,缺氧并没有改变ROS 水平(图1AB); 我们进一步研究了HIF-1 对糖尿病患者线粒体ROS 产生的影响。肾髓质上皮细胞mIMCD-3 细胞低氧(1% O2)培养24 h;研究发现暴露于高糖水平和缺氧的细胞线粒体ROS 水平升高,HIF-1 激活剂DMOG 通过激活HIF,减少缺氧时高糖水平引起的线粒体ROS 过度产生(图3A);在暴露于缺氧和高糖水平的mIMCD3 细胞中,沉默VHL 基因(图3B)后,核HIF-1α表达增加(图3C),导致线粒体ROS下降(图3D);在低氧和高血糖条件下,过表达HIF-1α的mIMCD3 细胞线粒体ROS 减少(图3E-F);表明缺氧和高血糖联合暴露的细胞中ROS 的过度产生依赖于HIF-1 功能的损害,当HIF-1 活性保持时,ROS 可以被减弱。
确定

还剩20页未读,是否继续阅读?

产品配置单

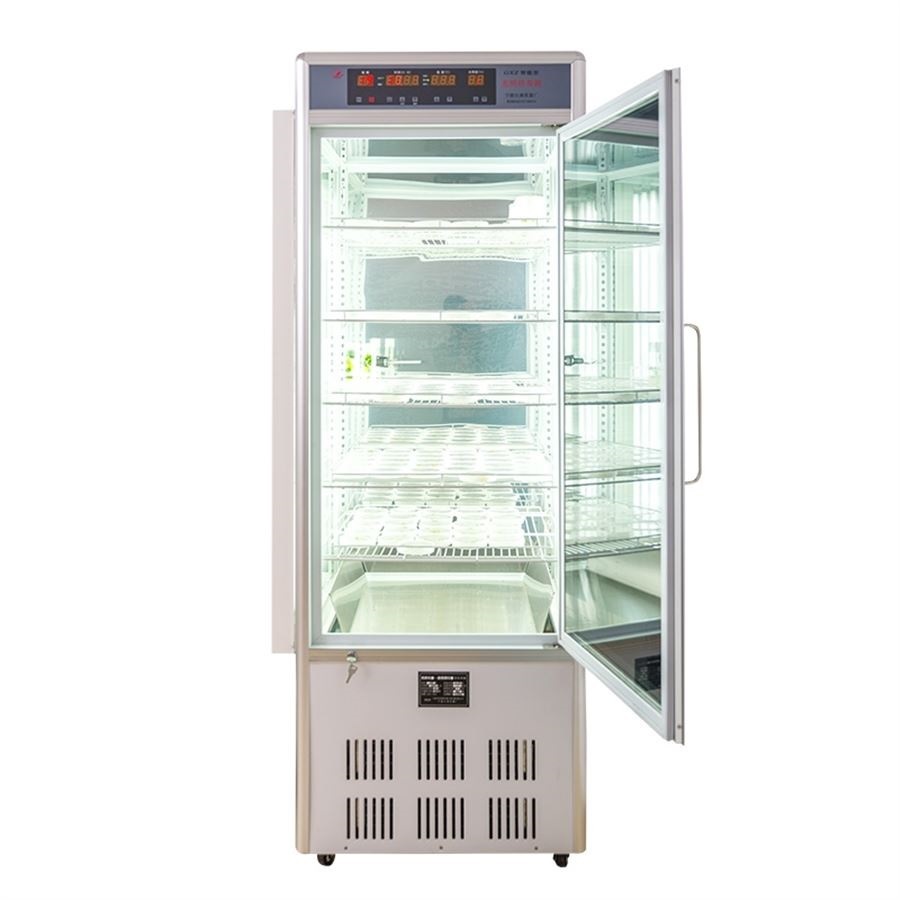
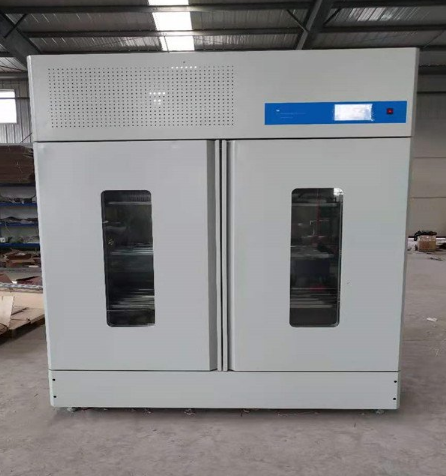
北京隆福佳生物科技有限公司为您提供《糖尿病患者血液中线粒体活性氧(ROS)检测方案(其它培养箱)》,该方案主要用于全血/血清/血浆中生化检验检测,参考标准--,《糖尿病患者血液中线粒体活性氧(ROS)检测方案(其它培养箱)》用到的仪器有Invivo2 400低氧工作站(低氧培养箱)
相关方案
更多
该厂商其他方案
更多