


方案详情
文
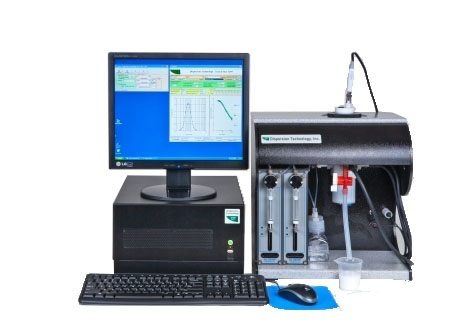
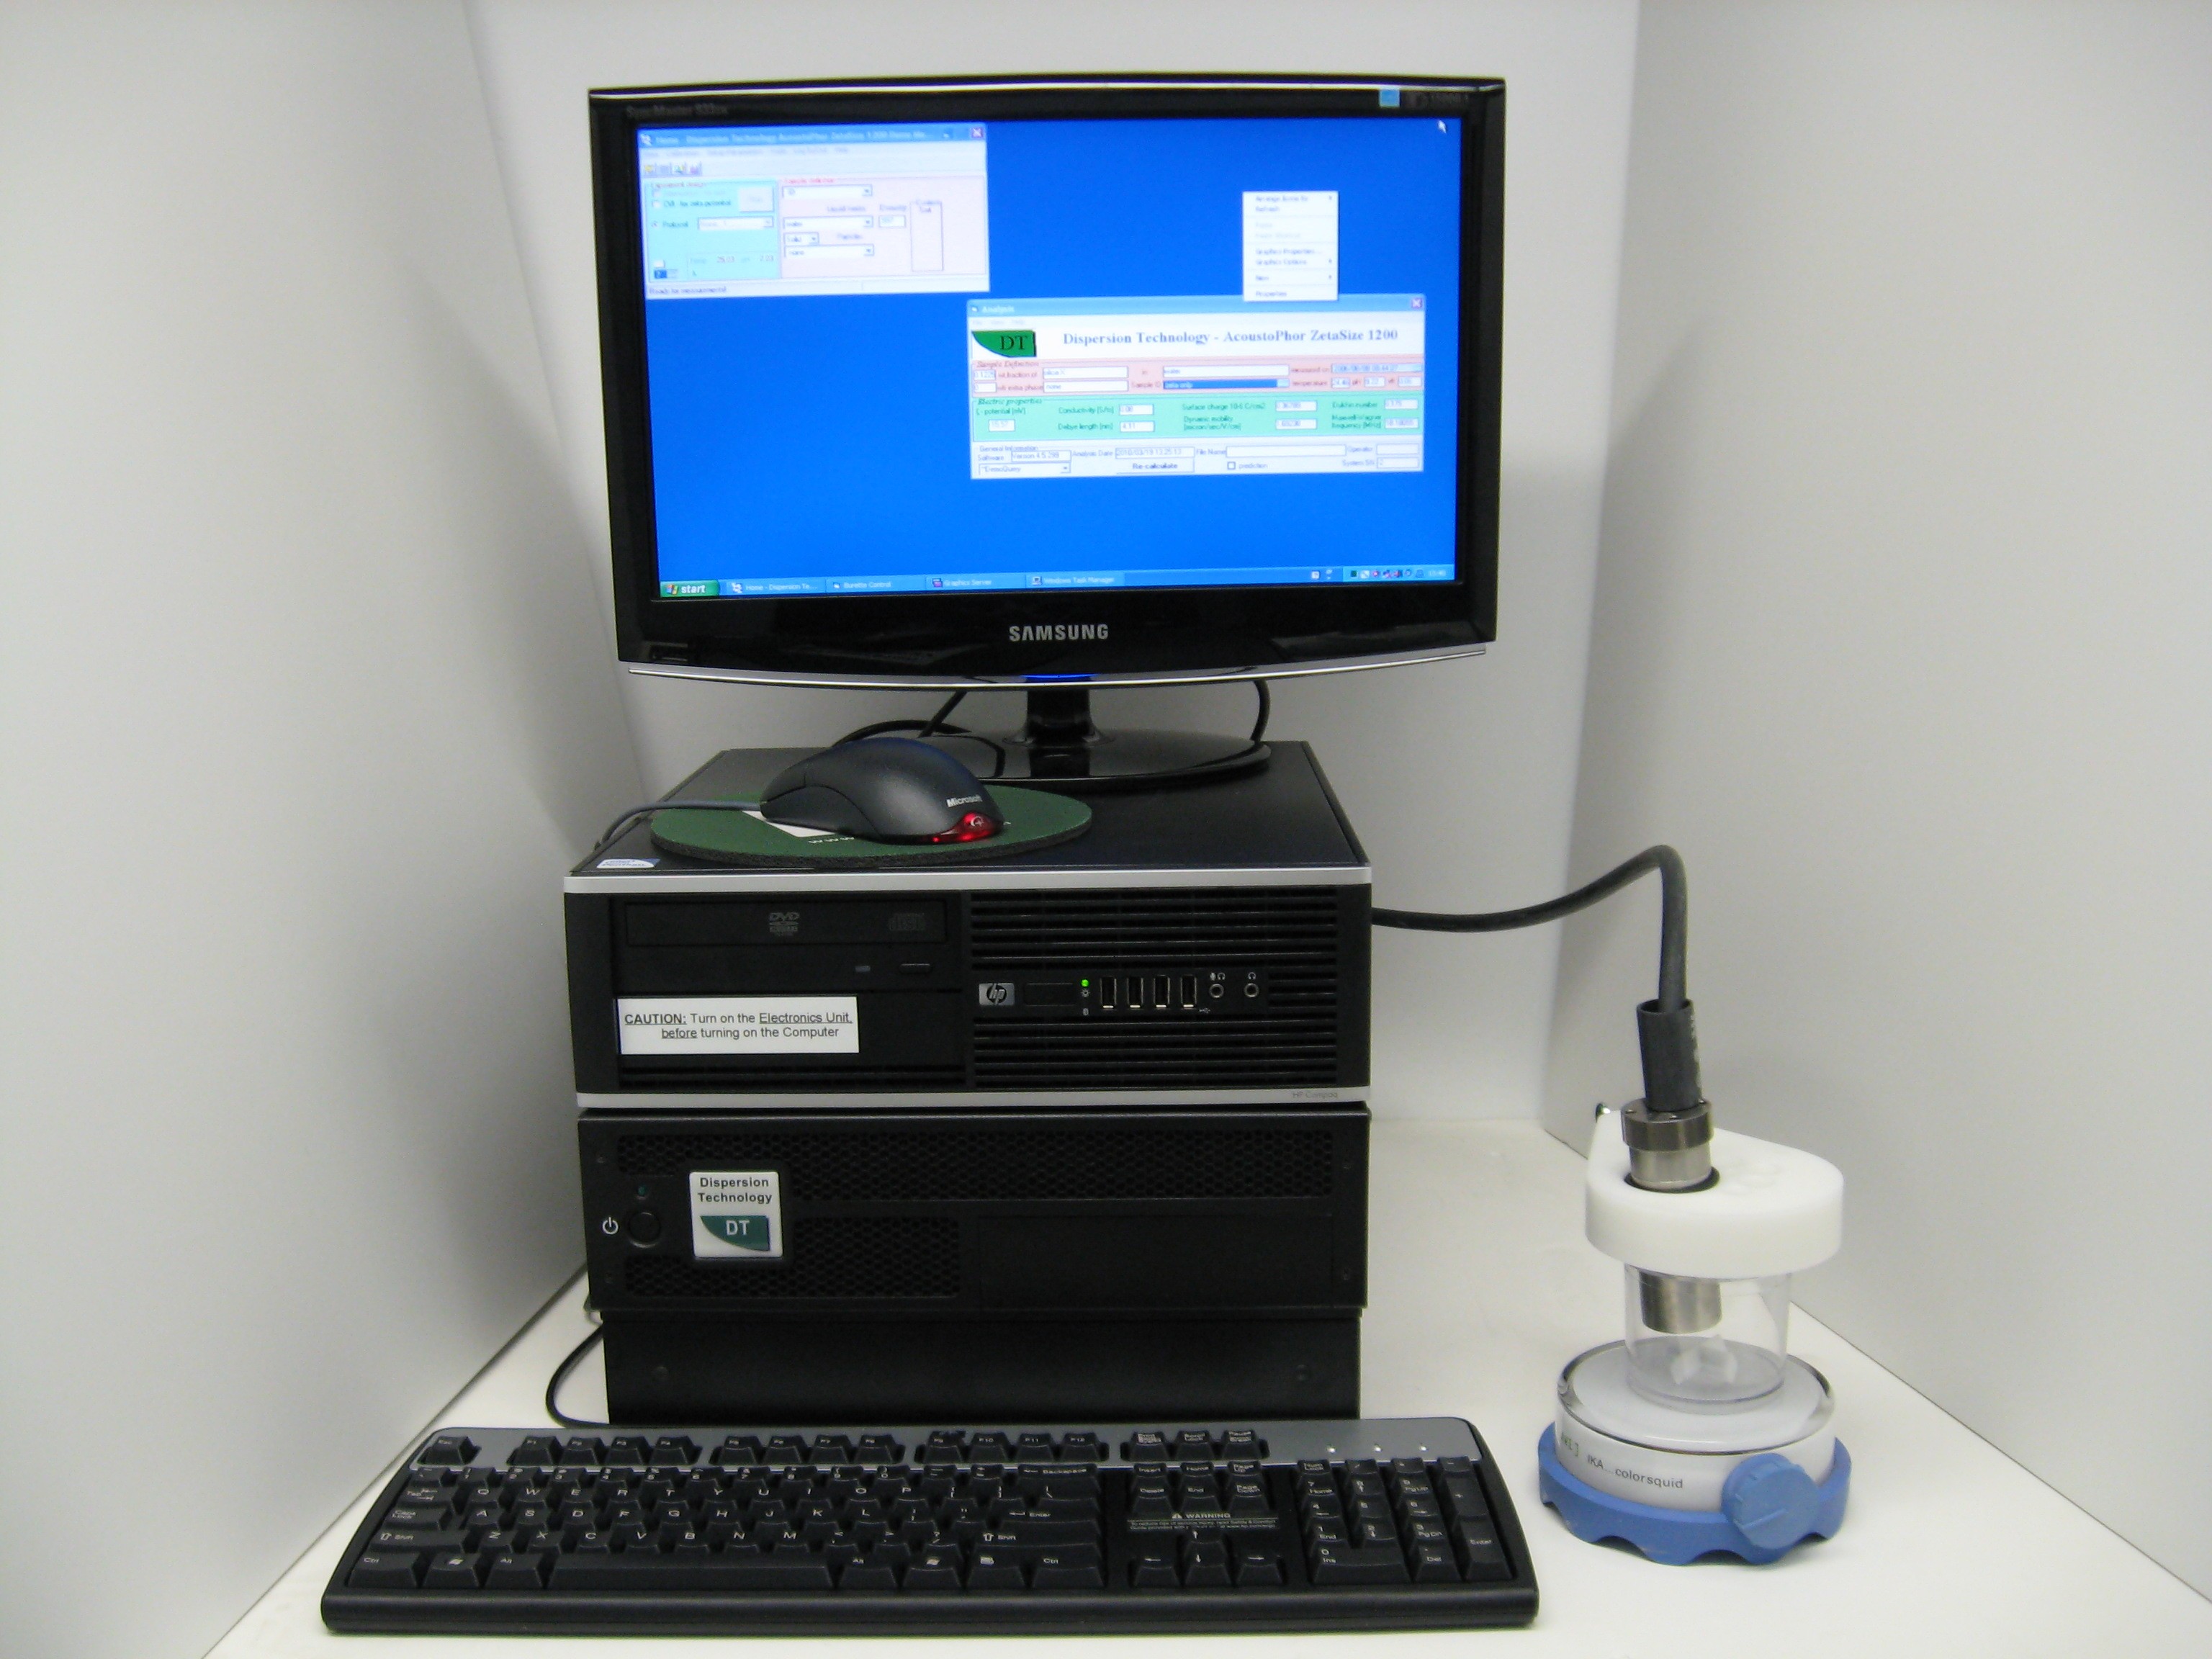
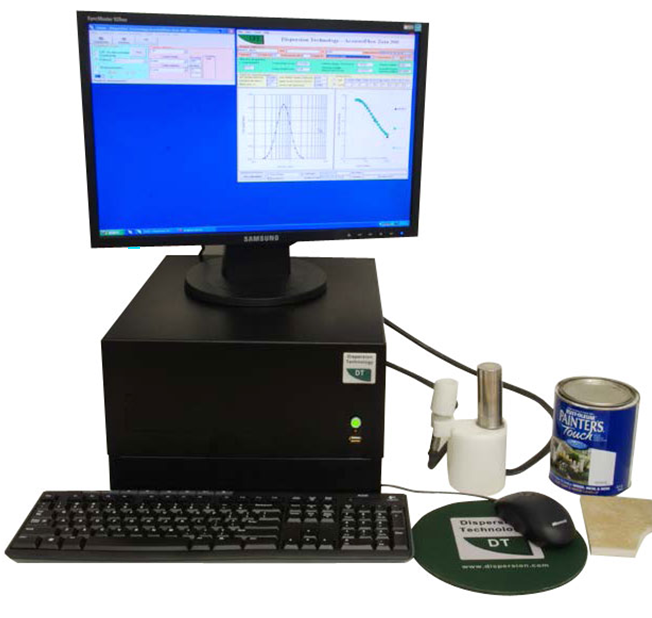
采用了激光光源照射纳米颗粒悬浮液,利用全黑背景可以观察到单个纳米颗粒的布朗运动和电泳现象,能够实现单个纳米颗粒的跟踪,粒度测量,Zeta电位测量,浓度测量等
方案详情

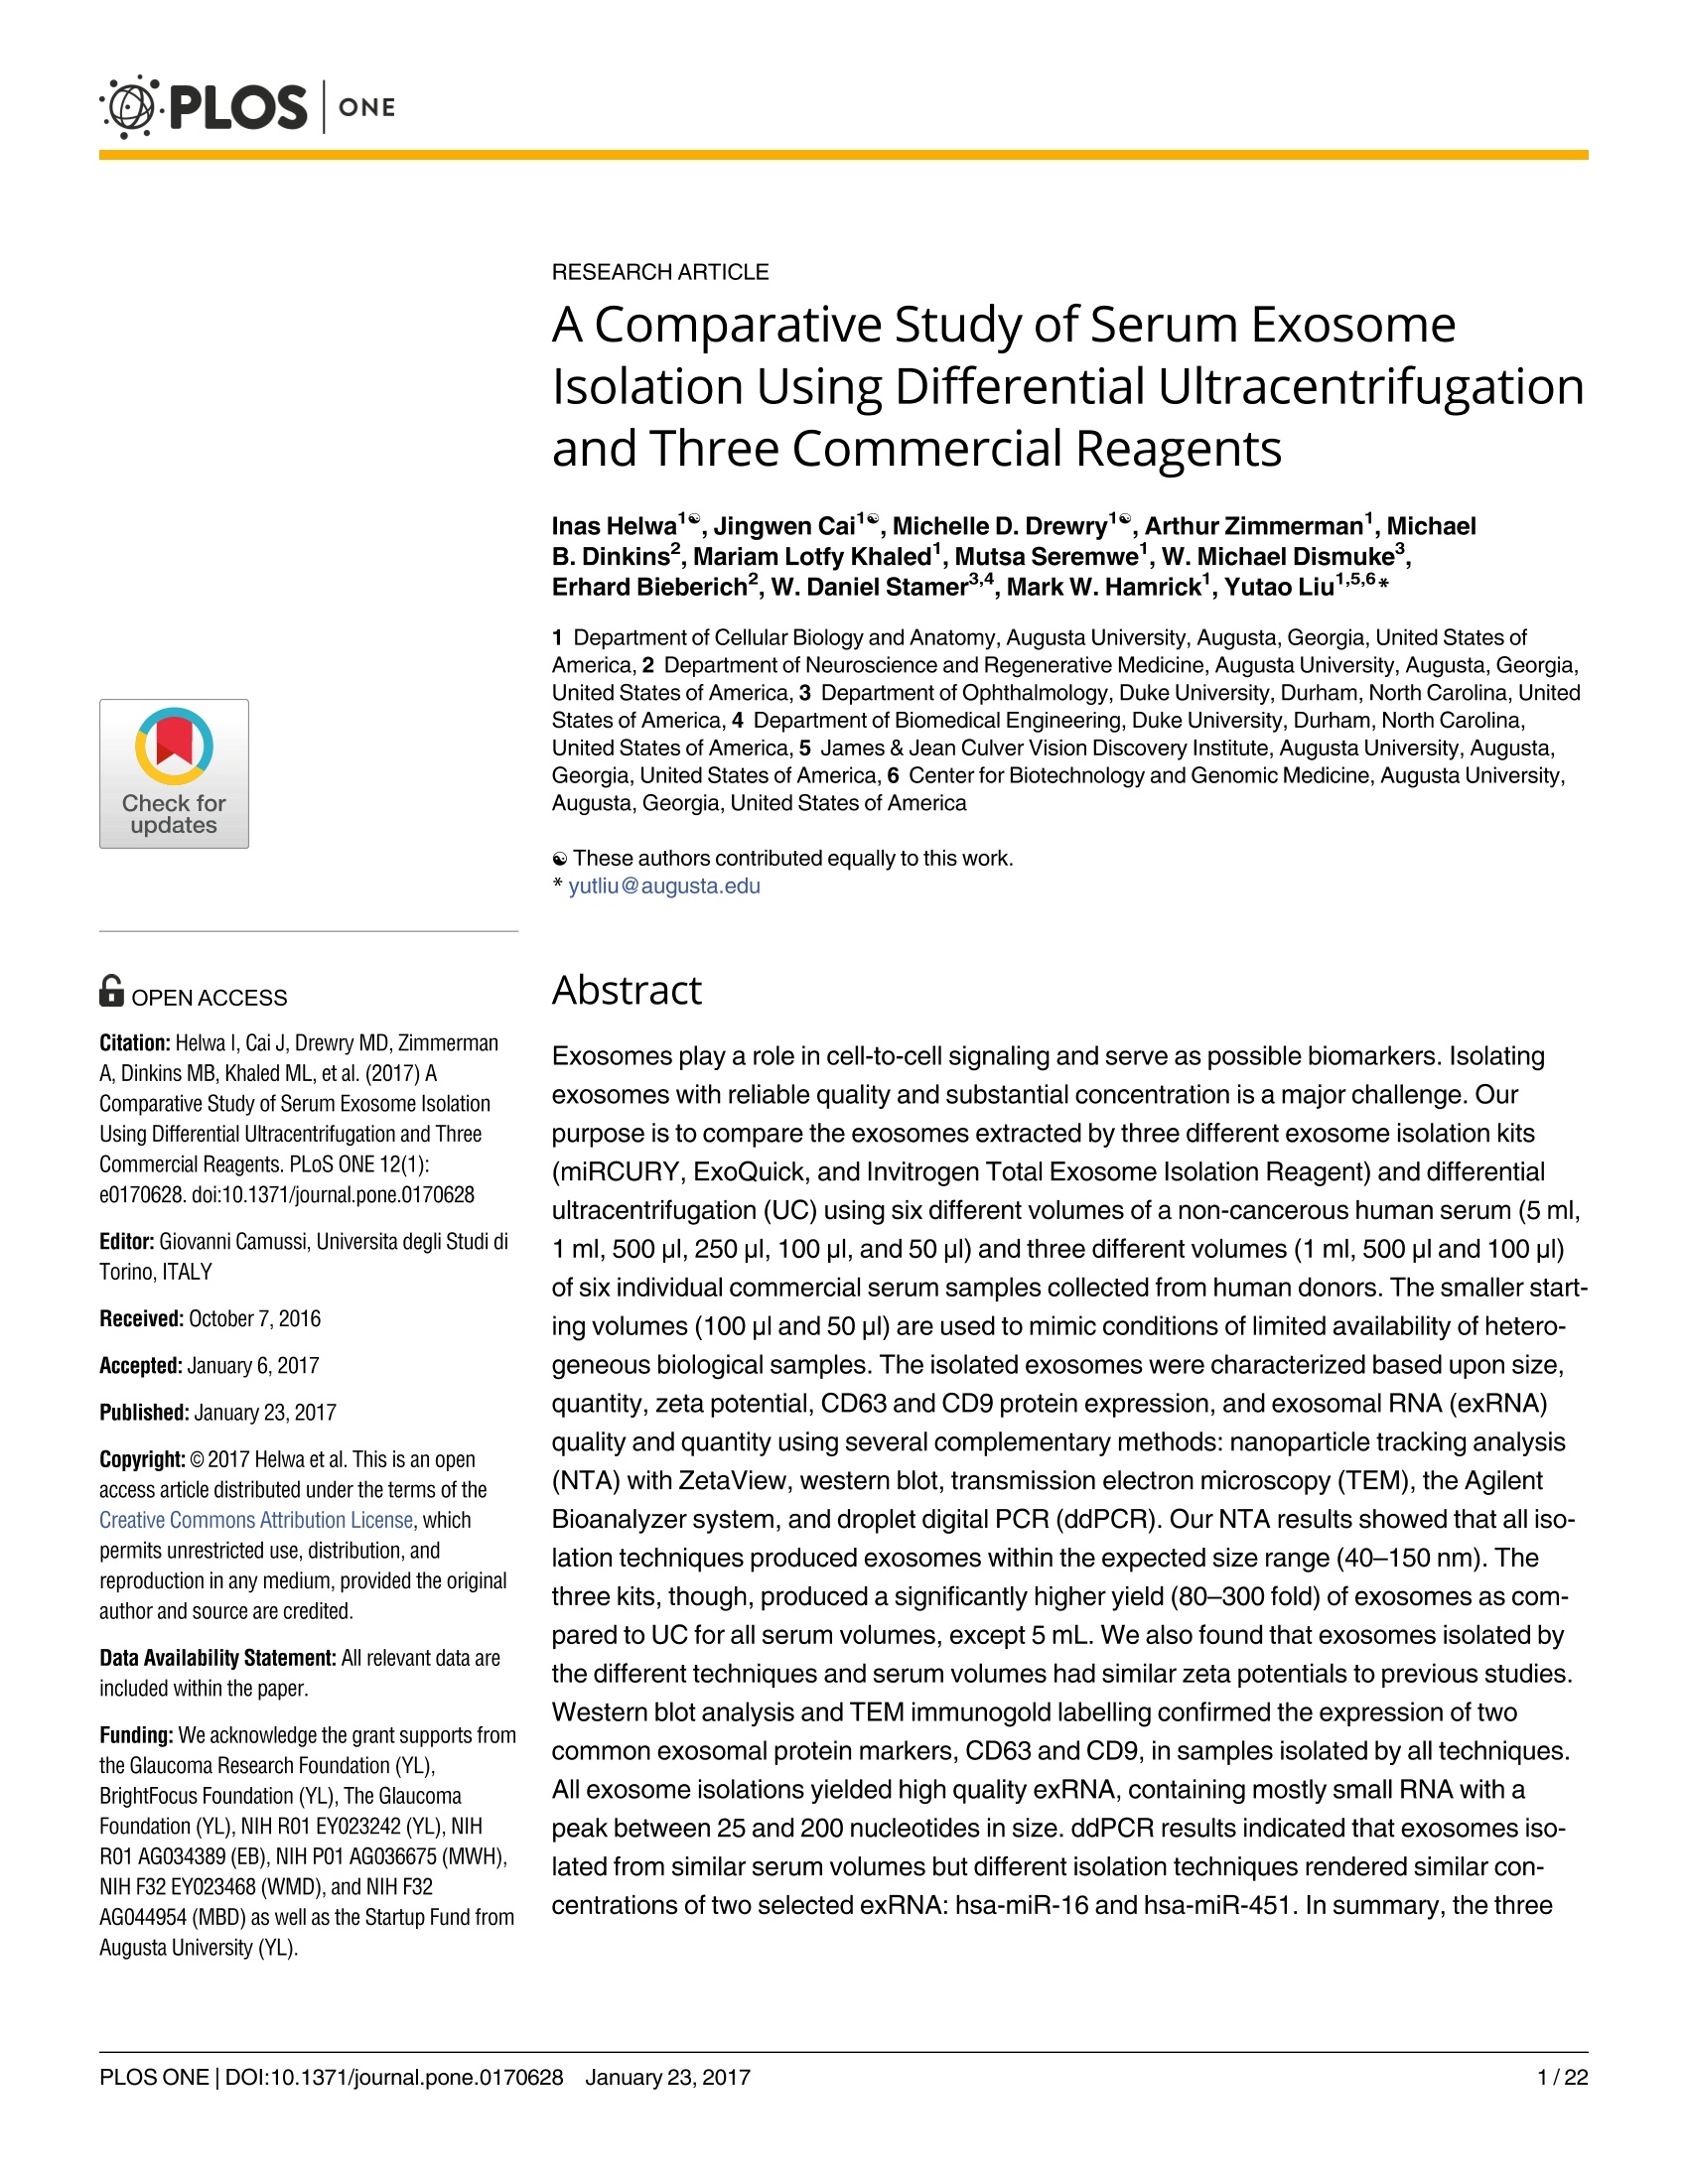
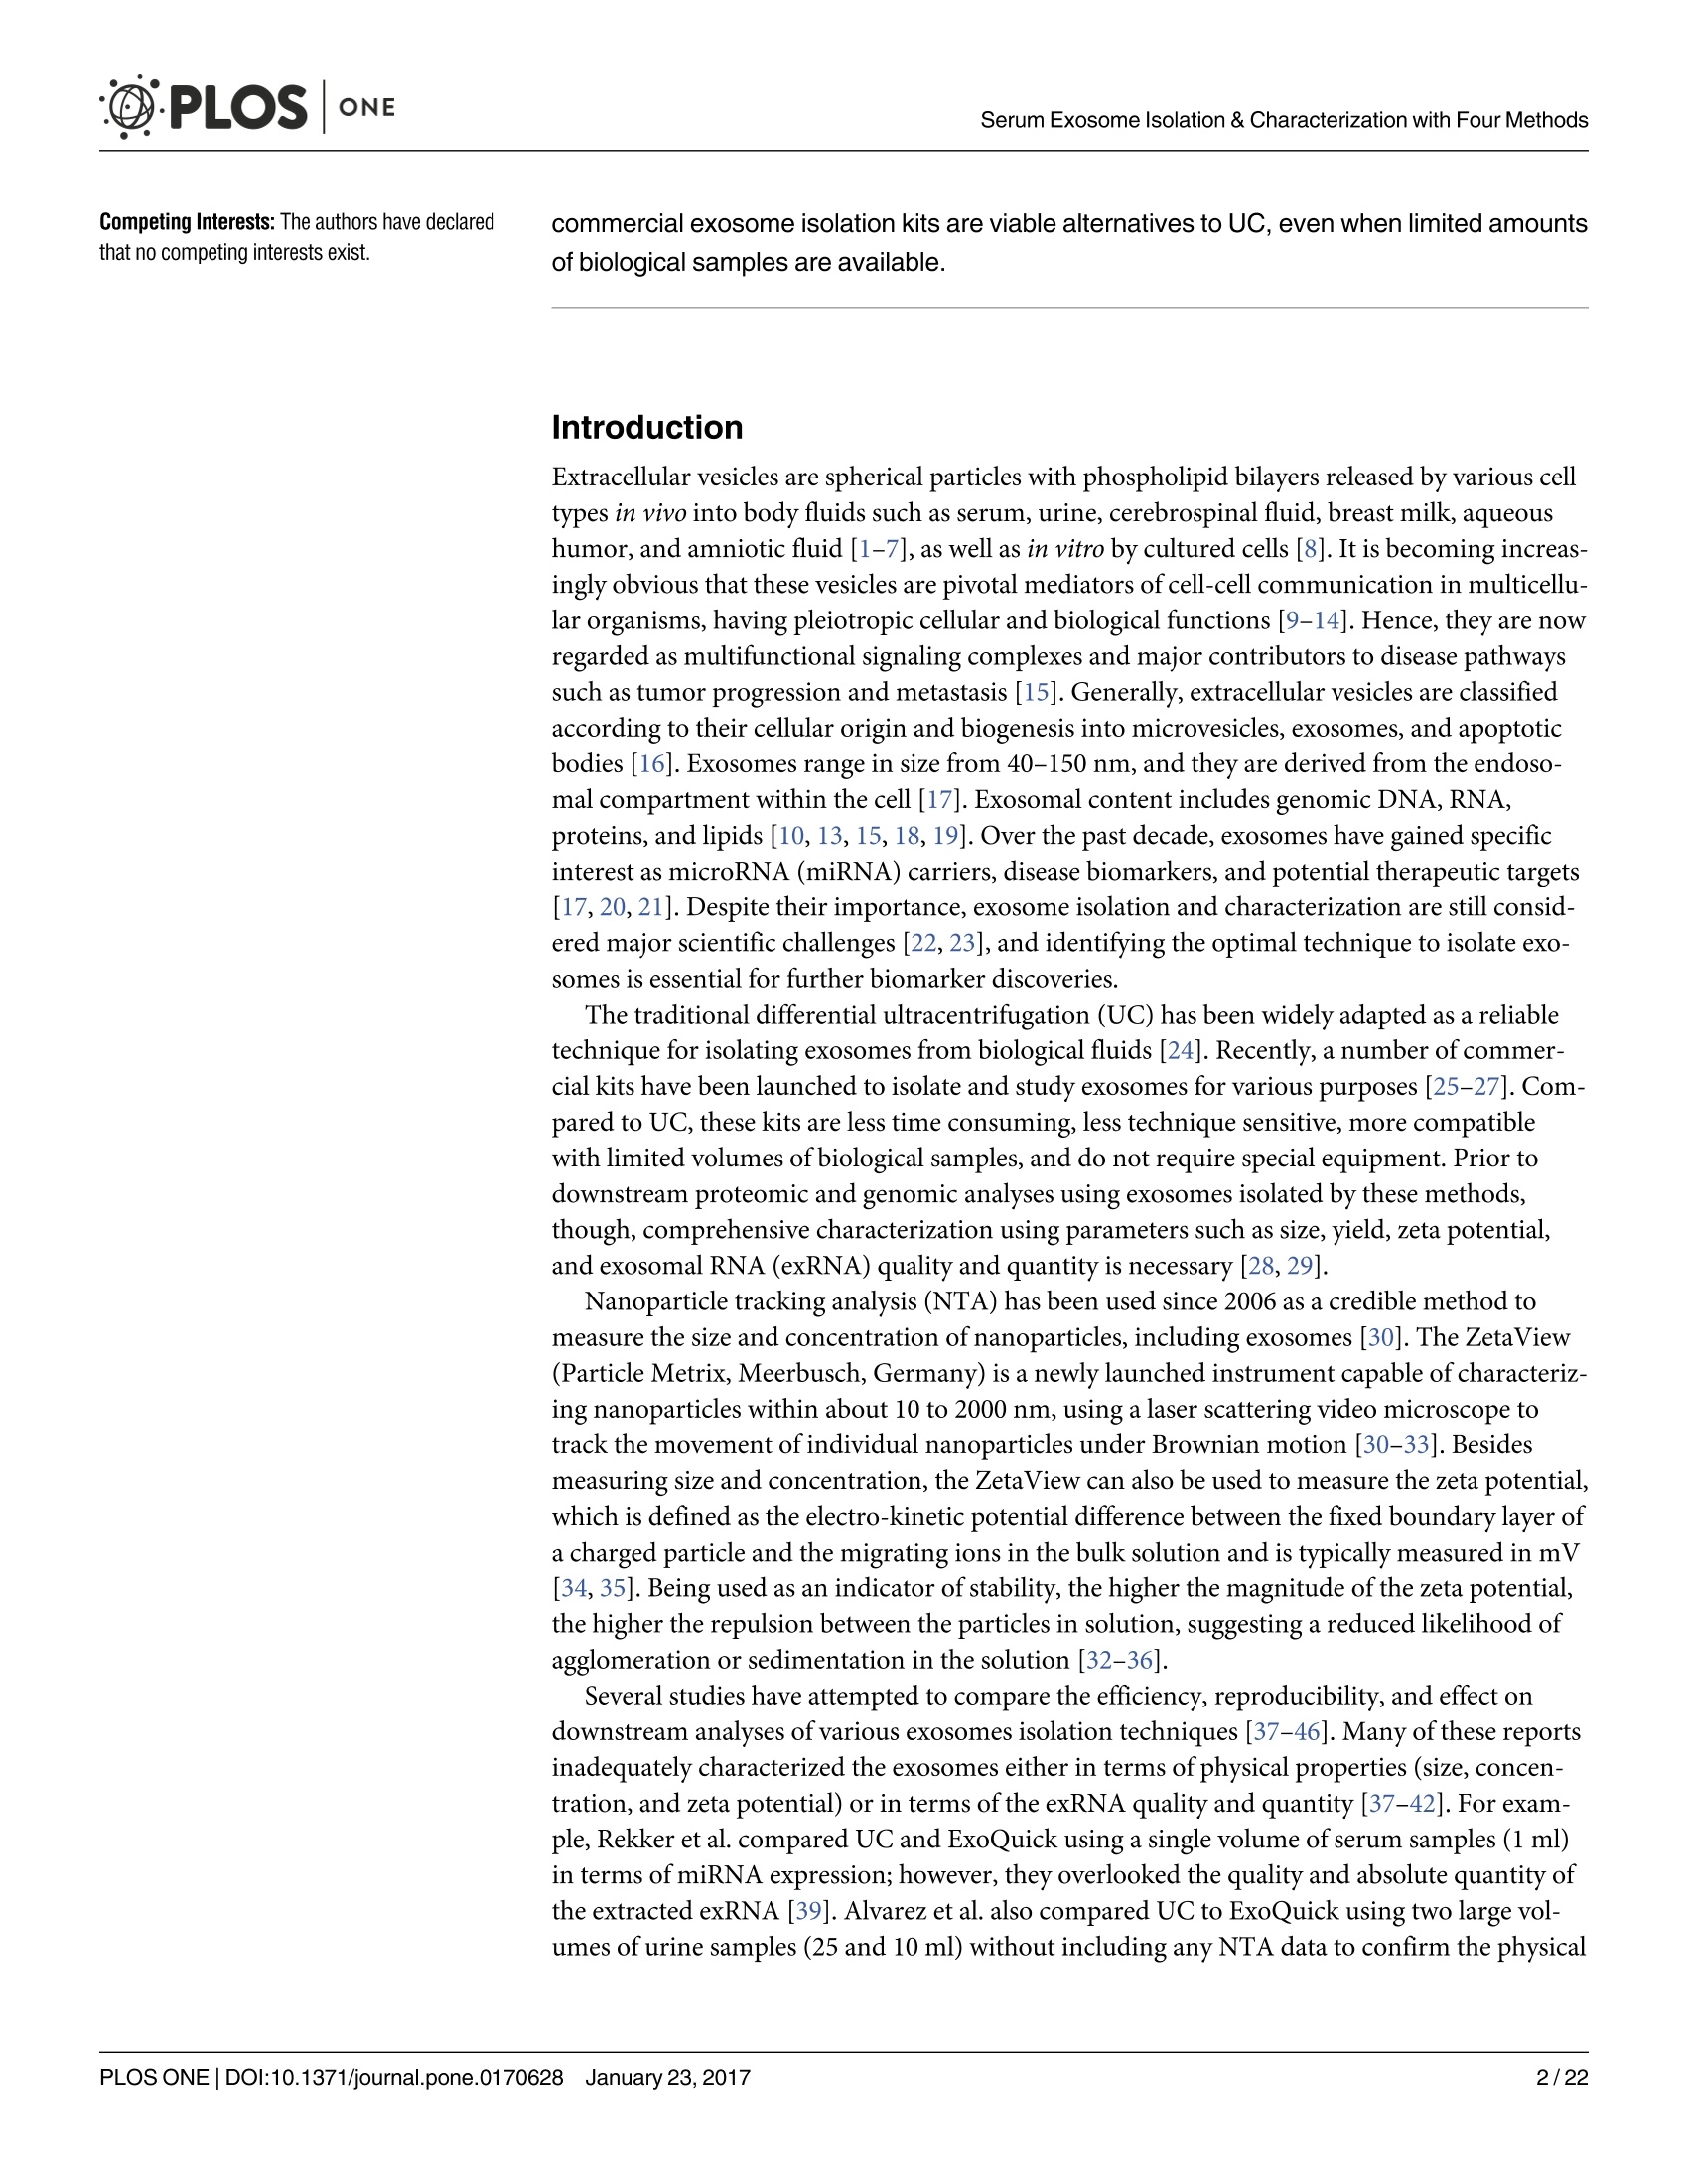
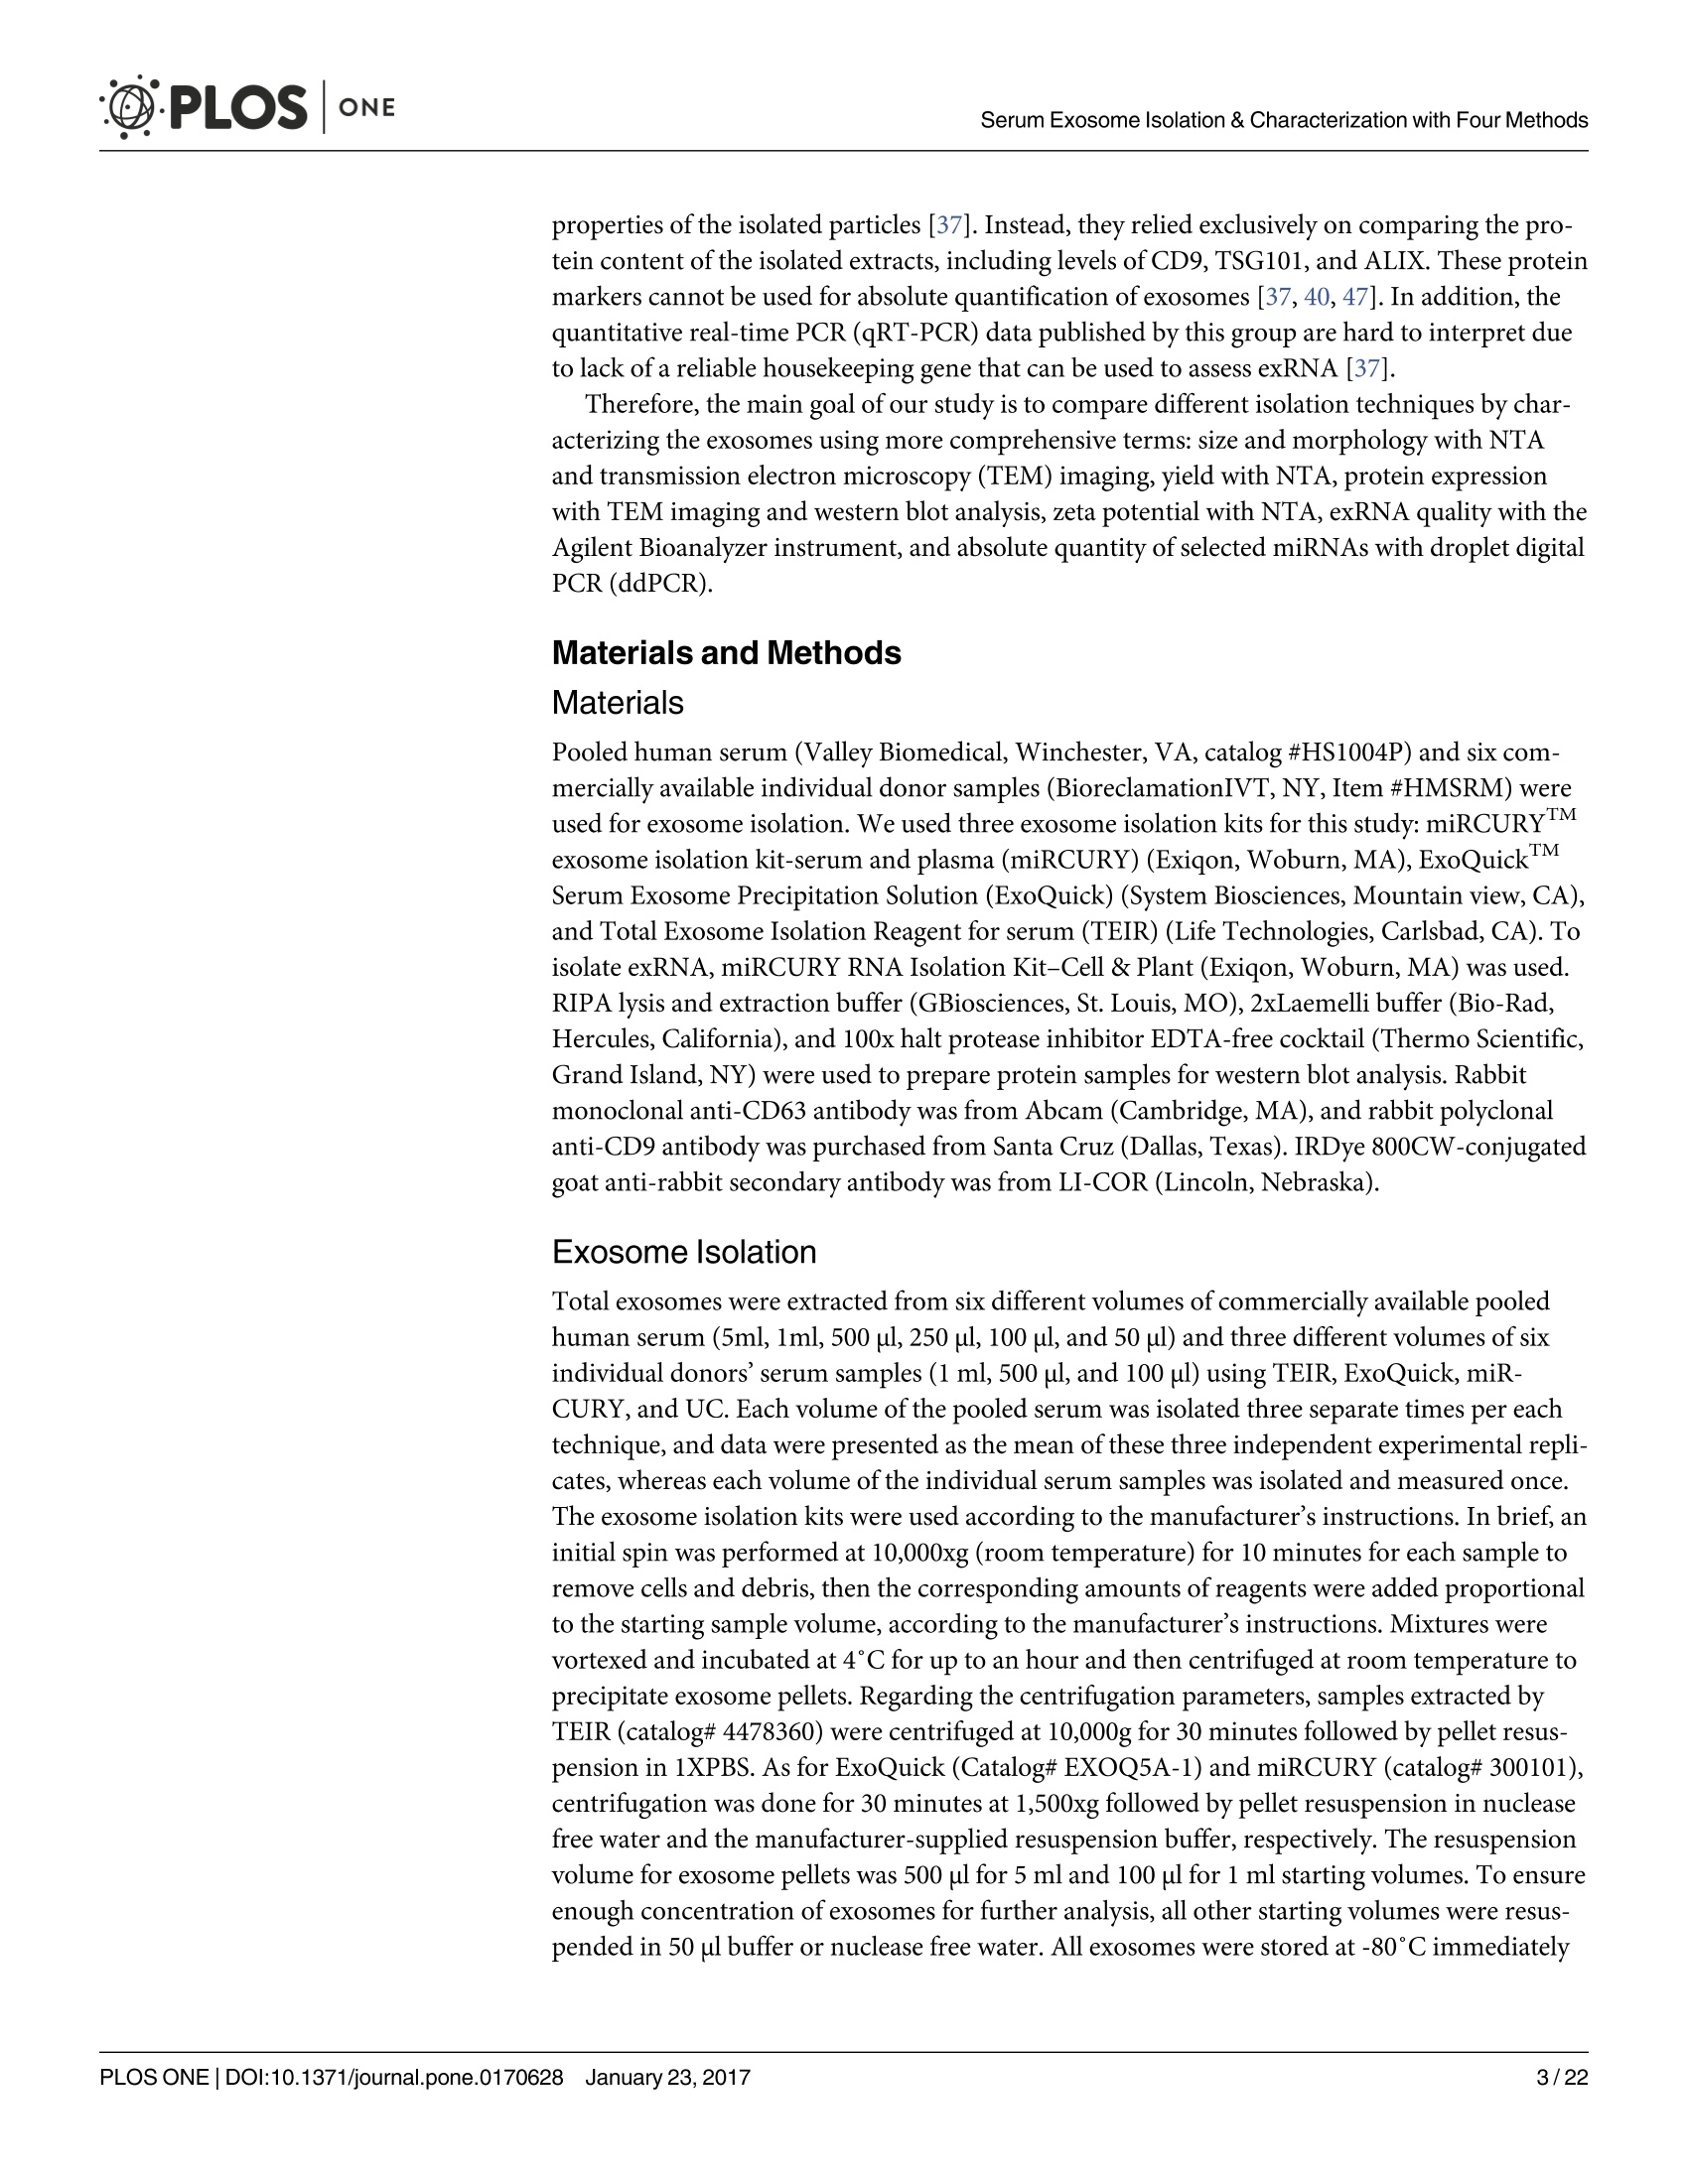
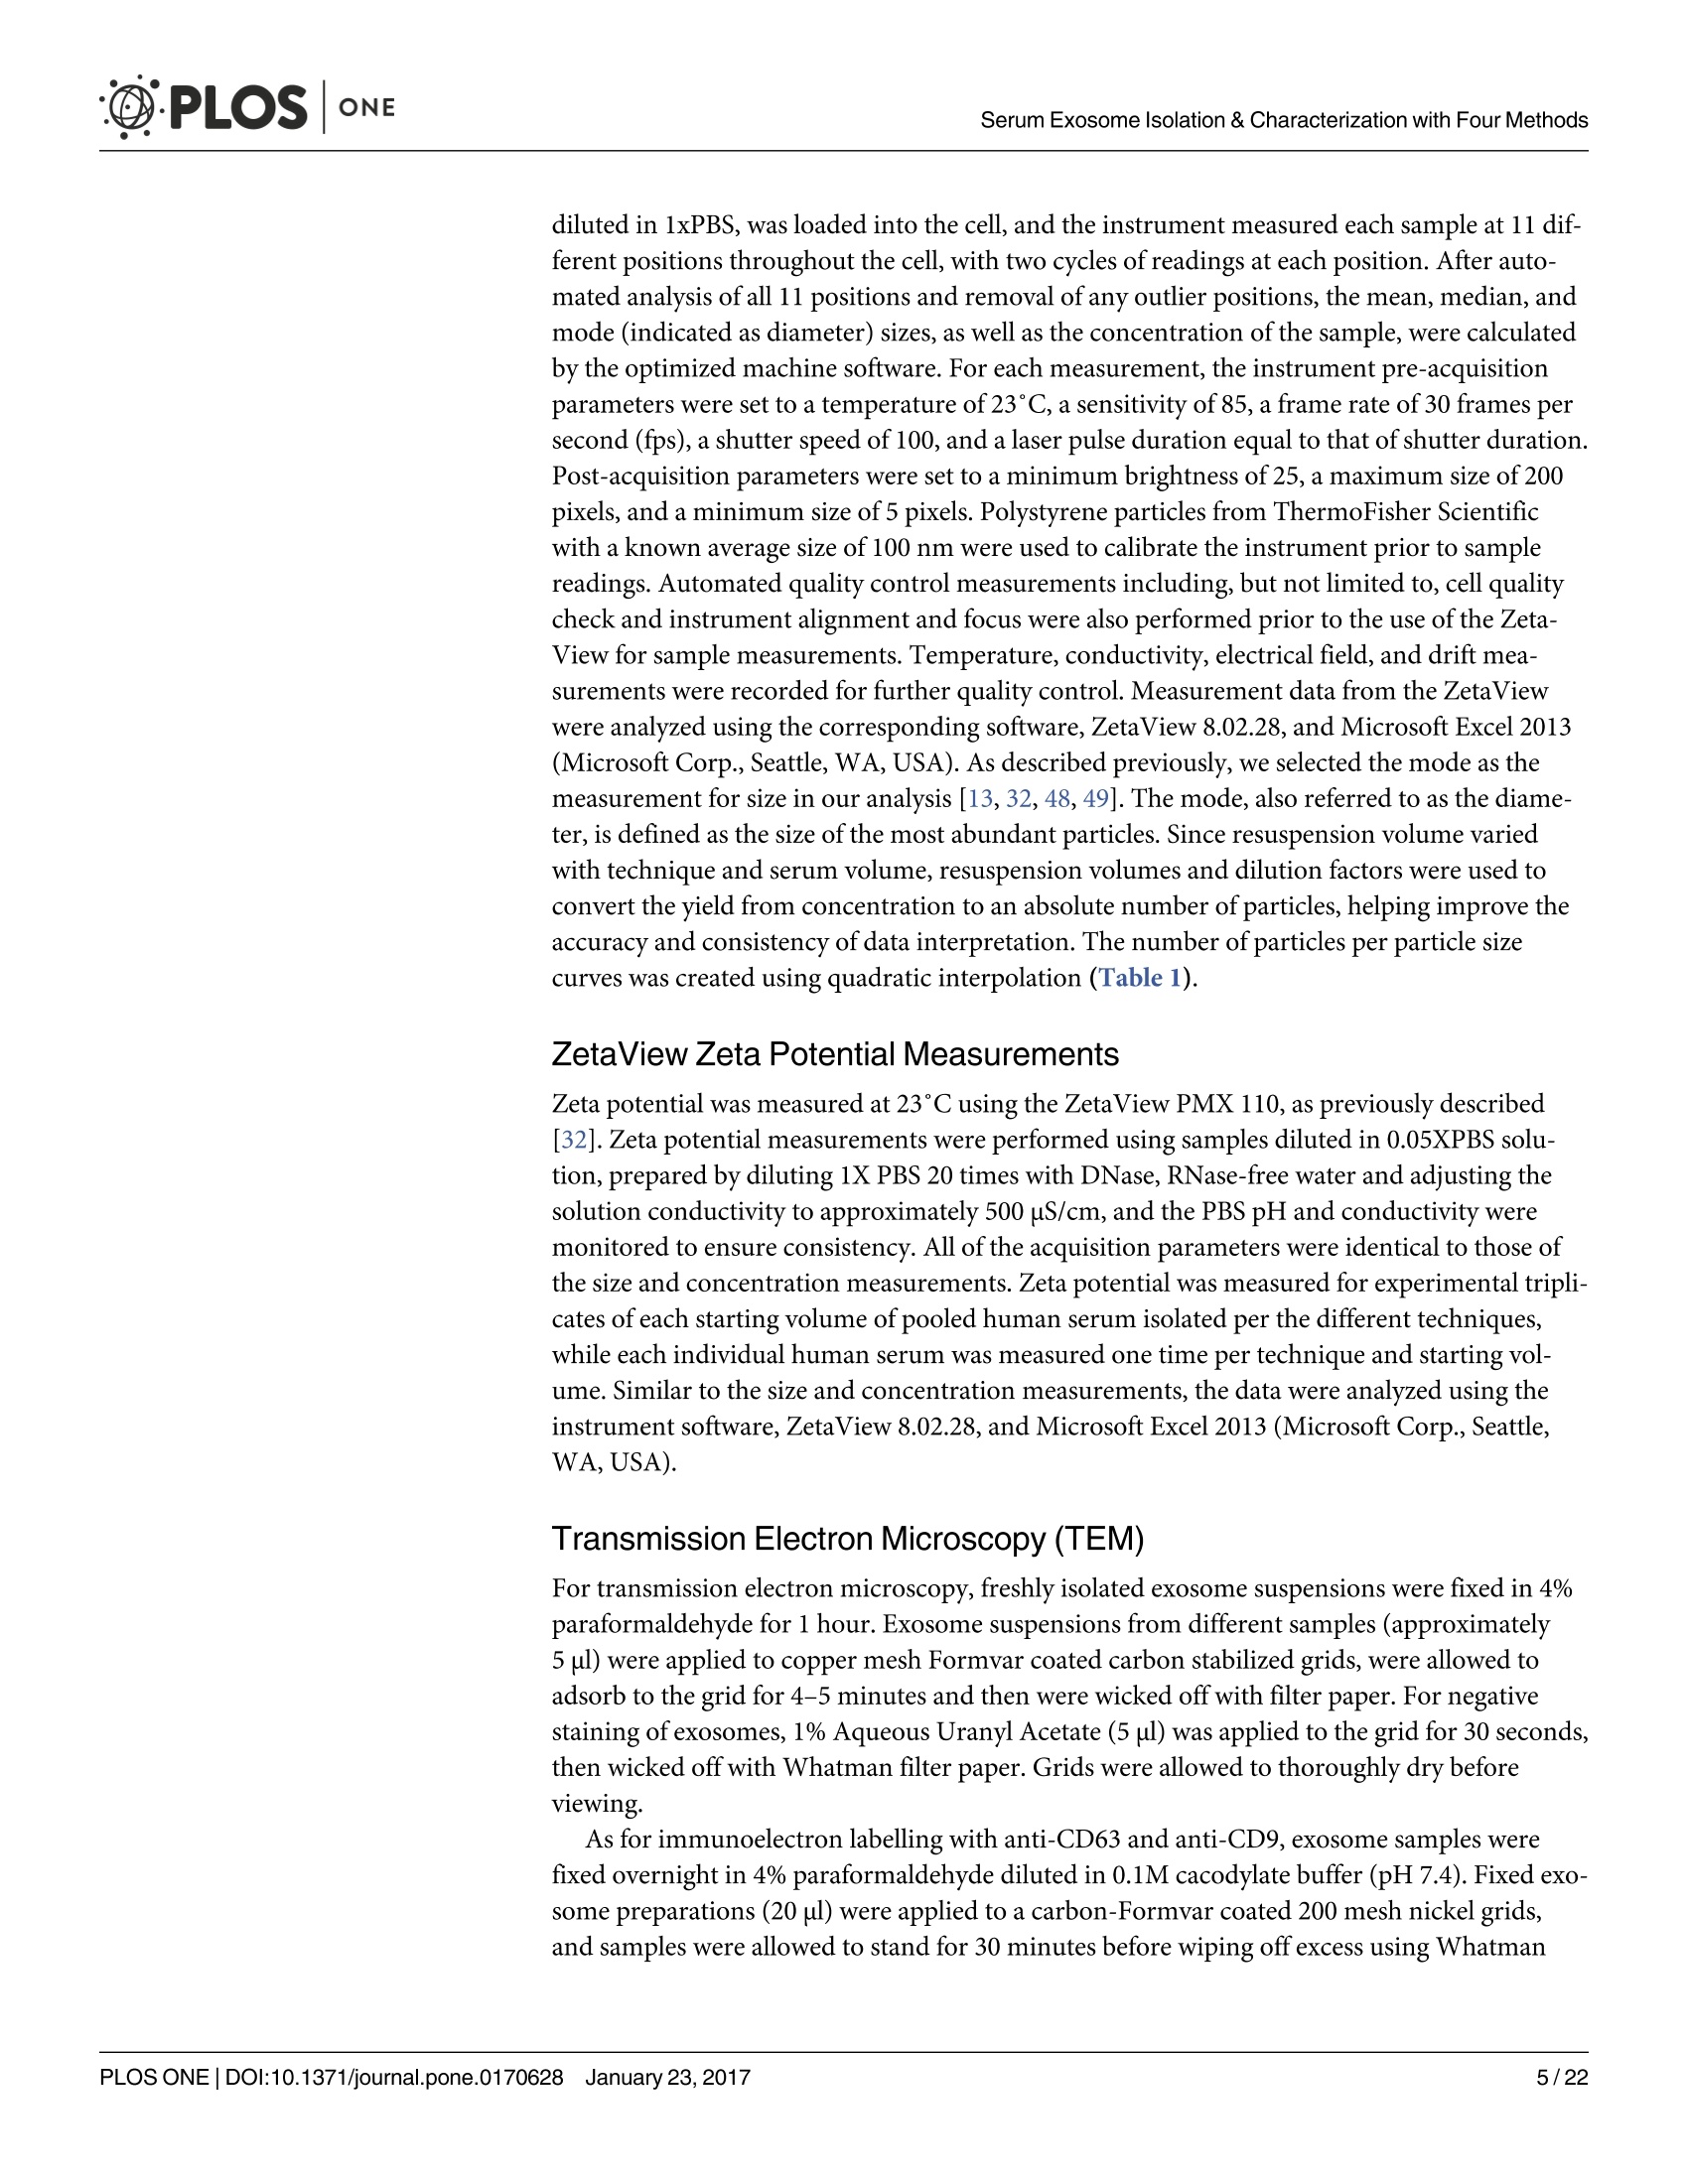
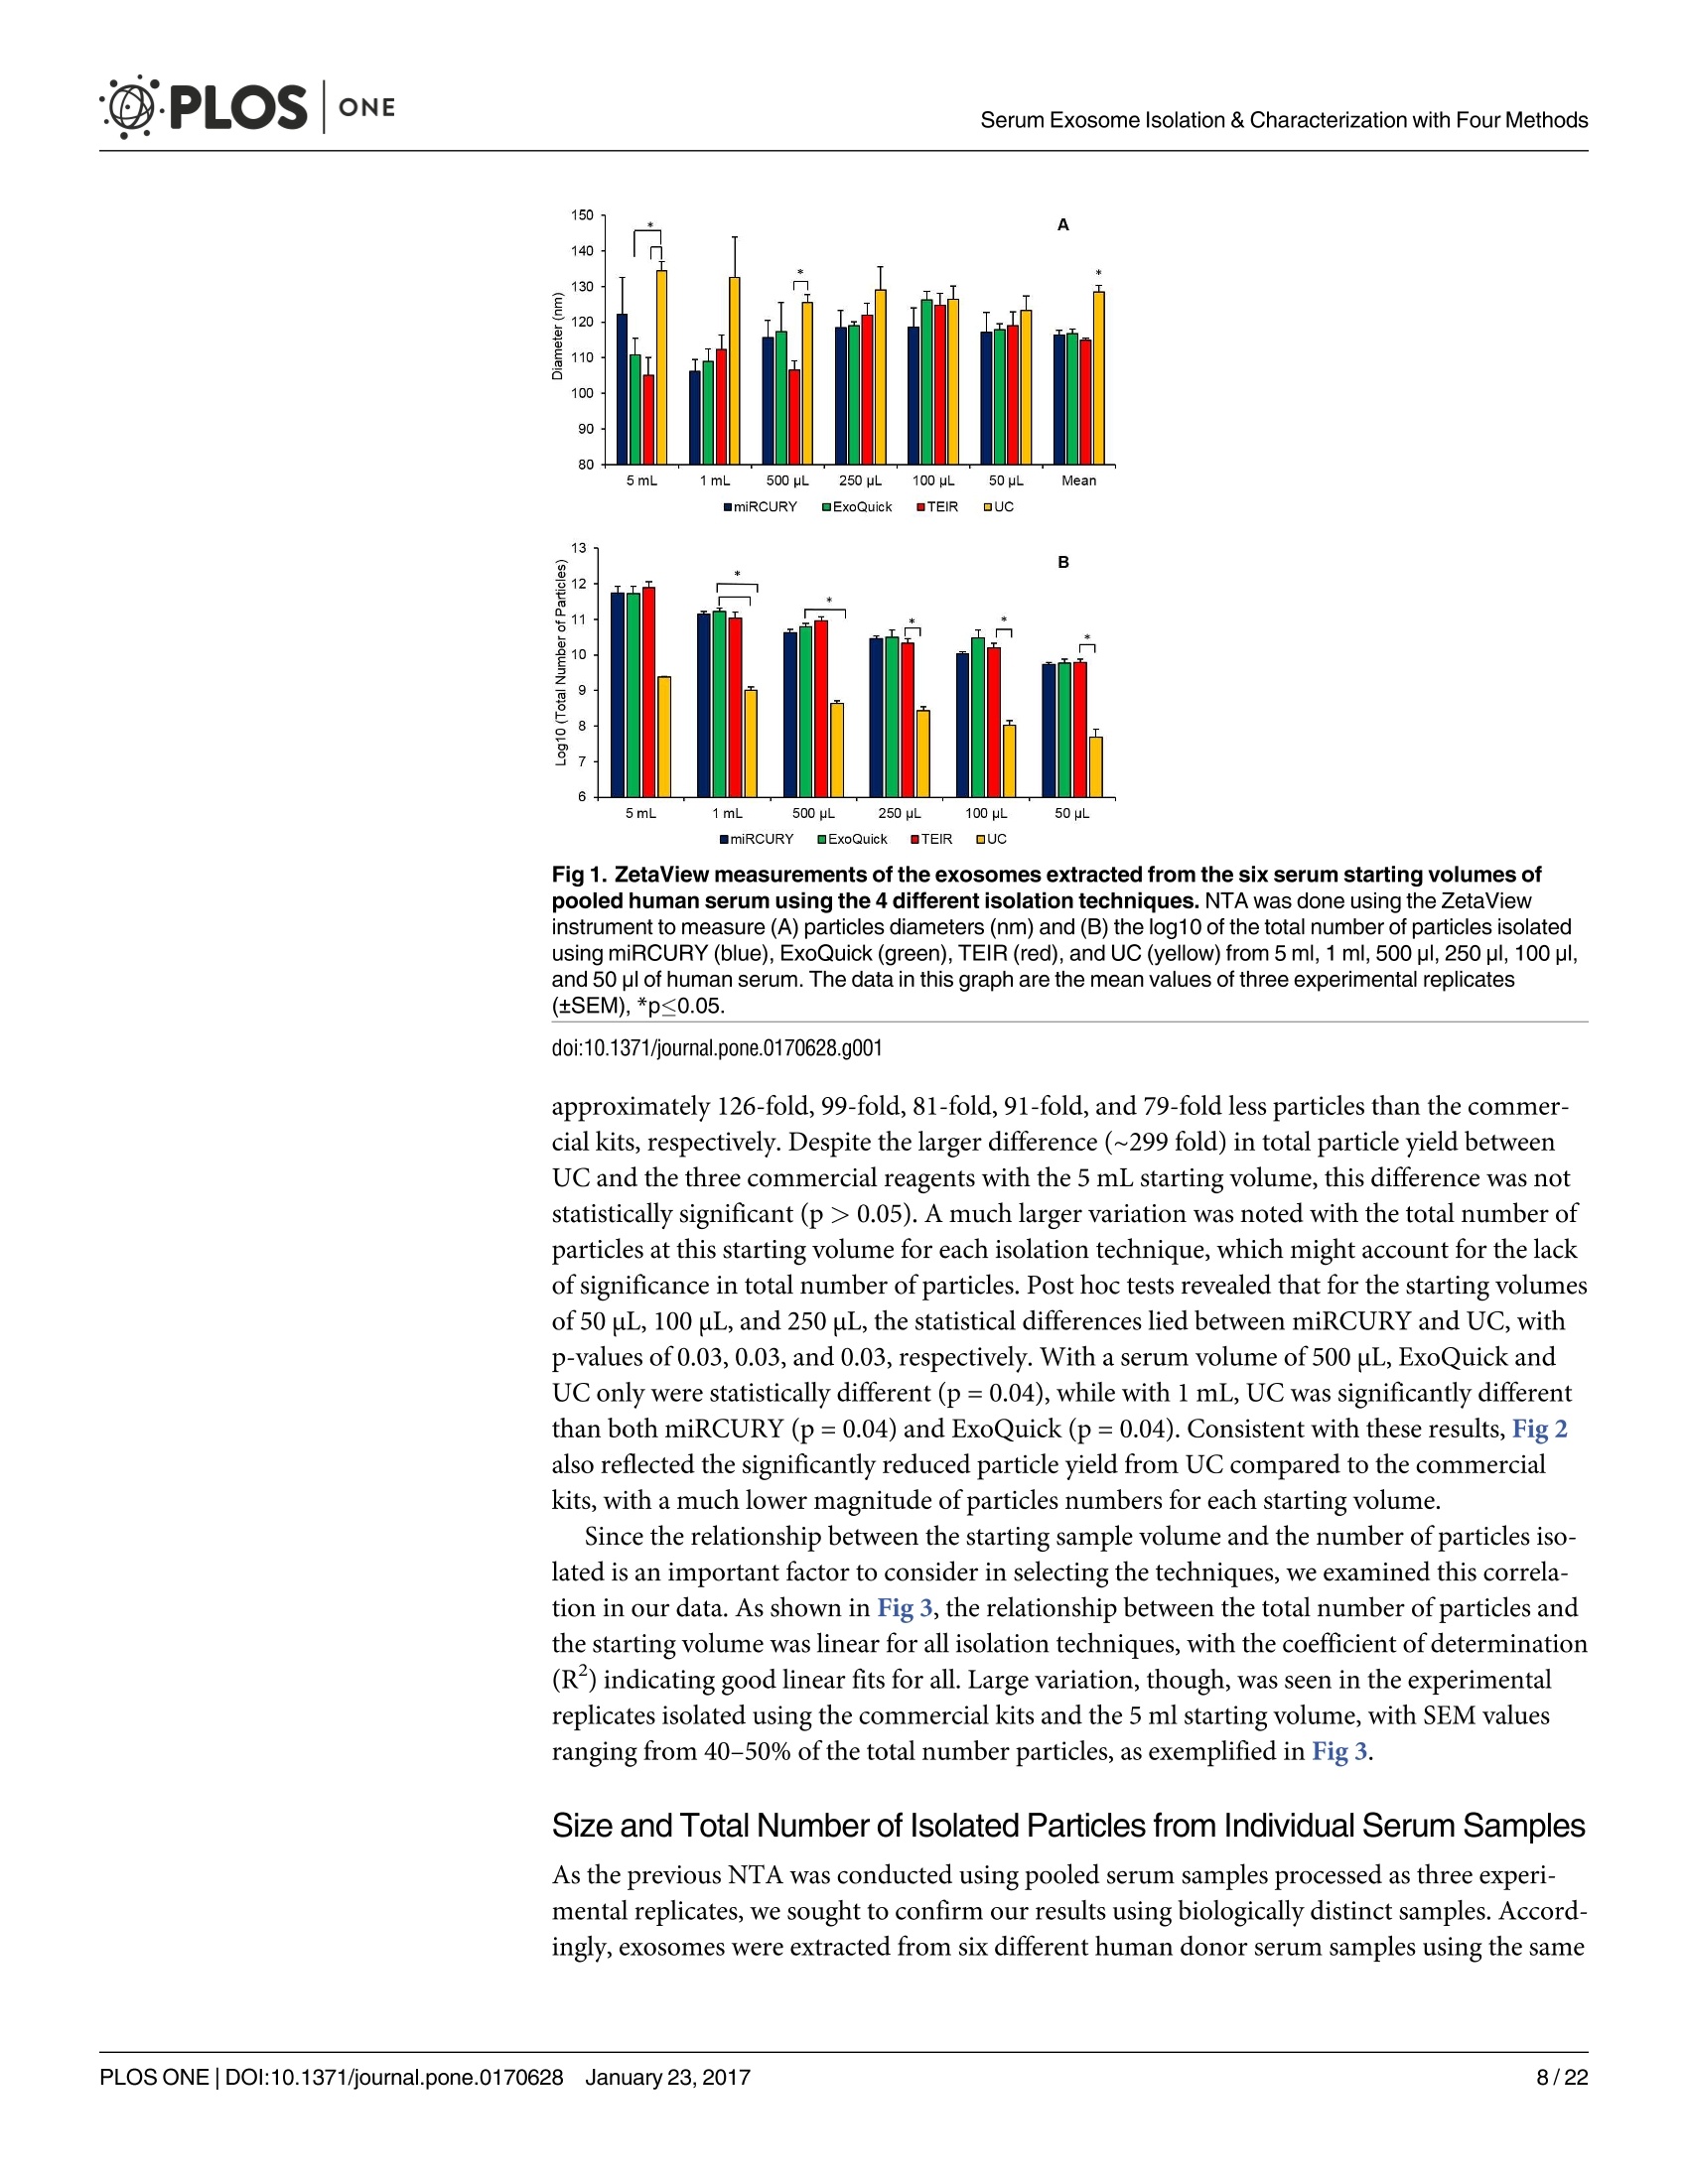
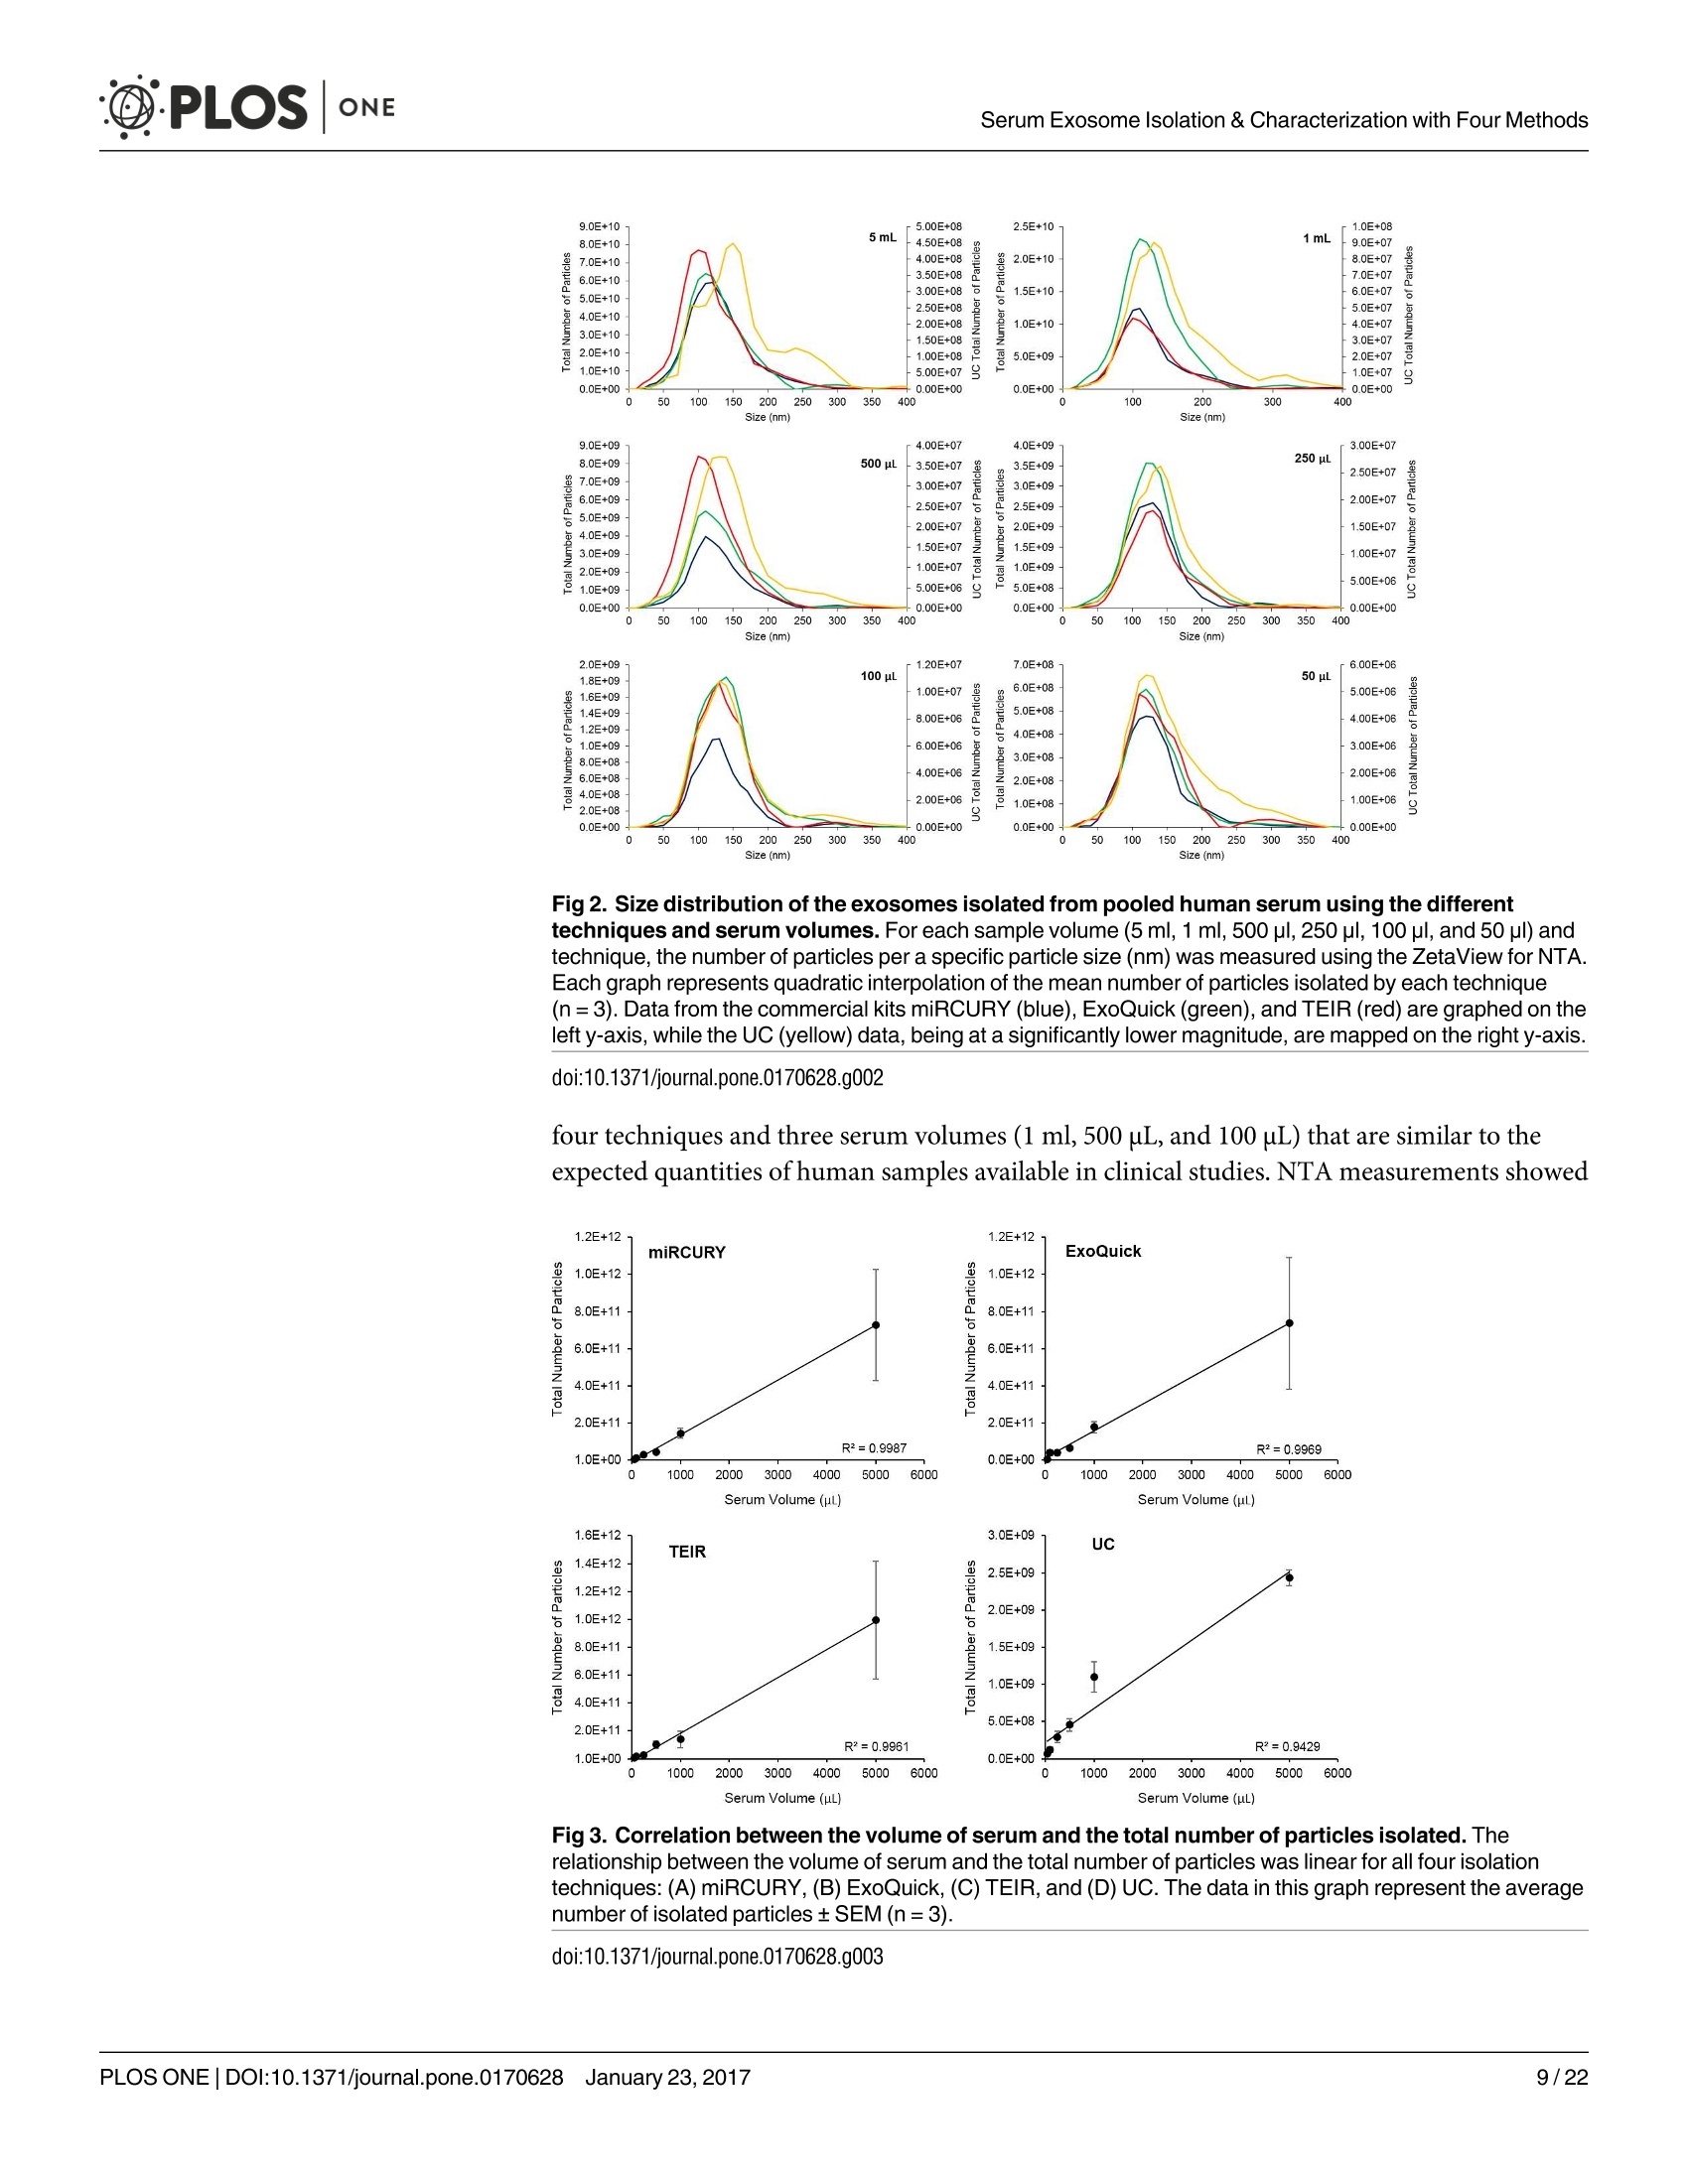
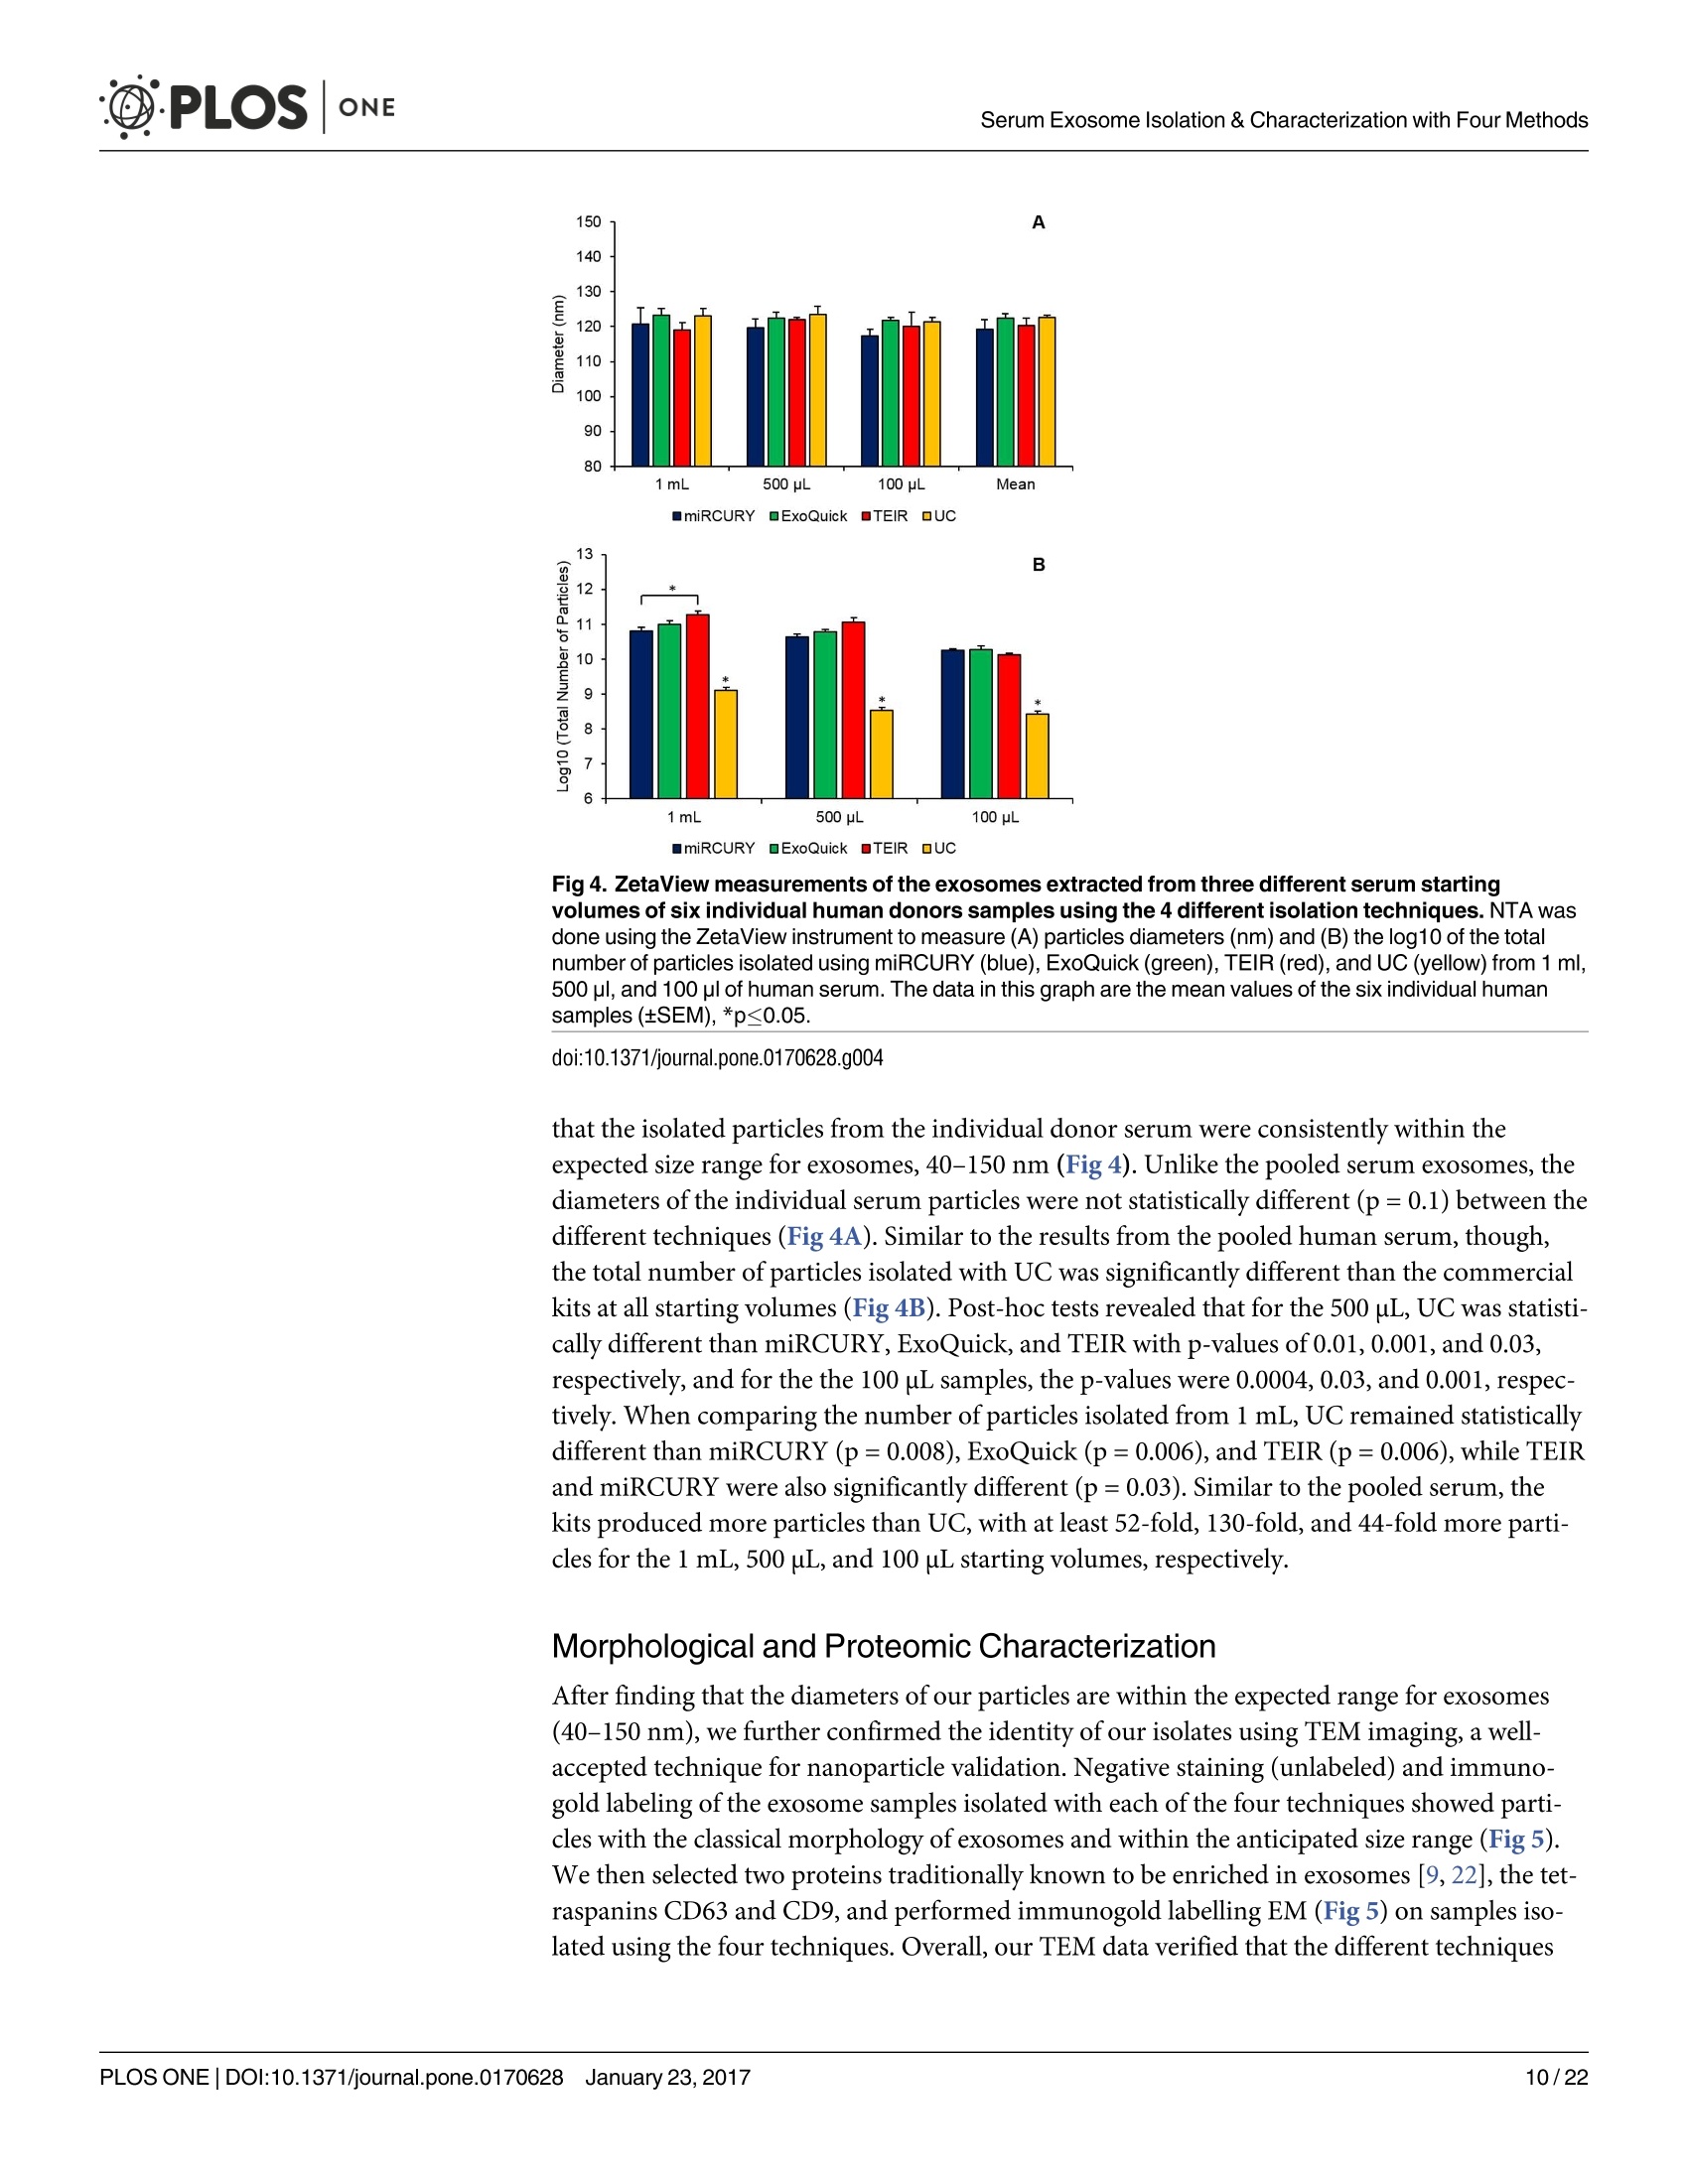
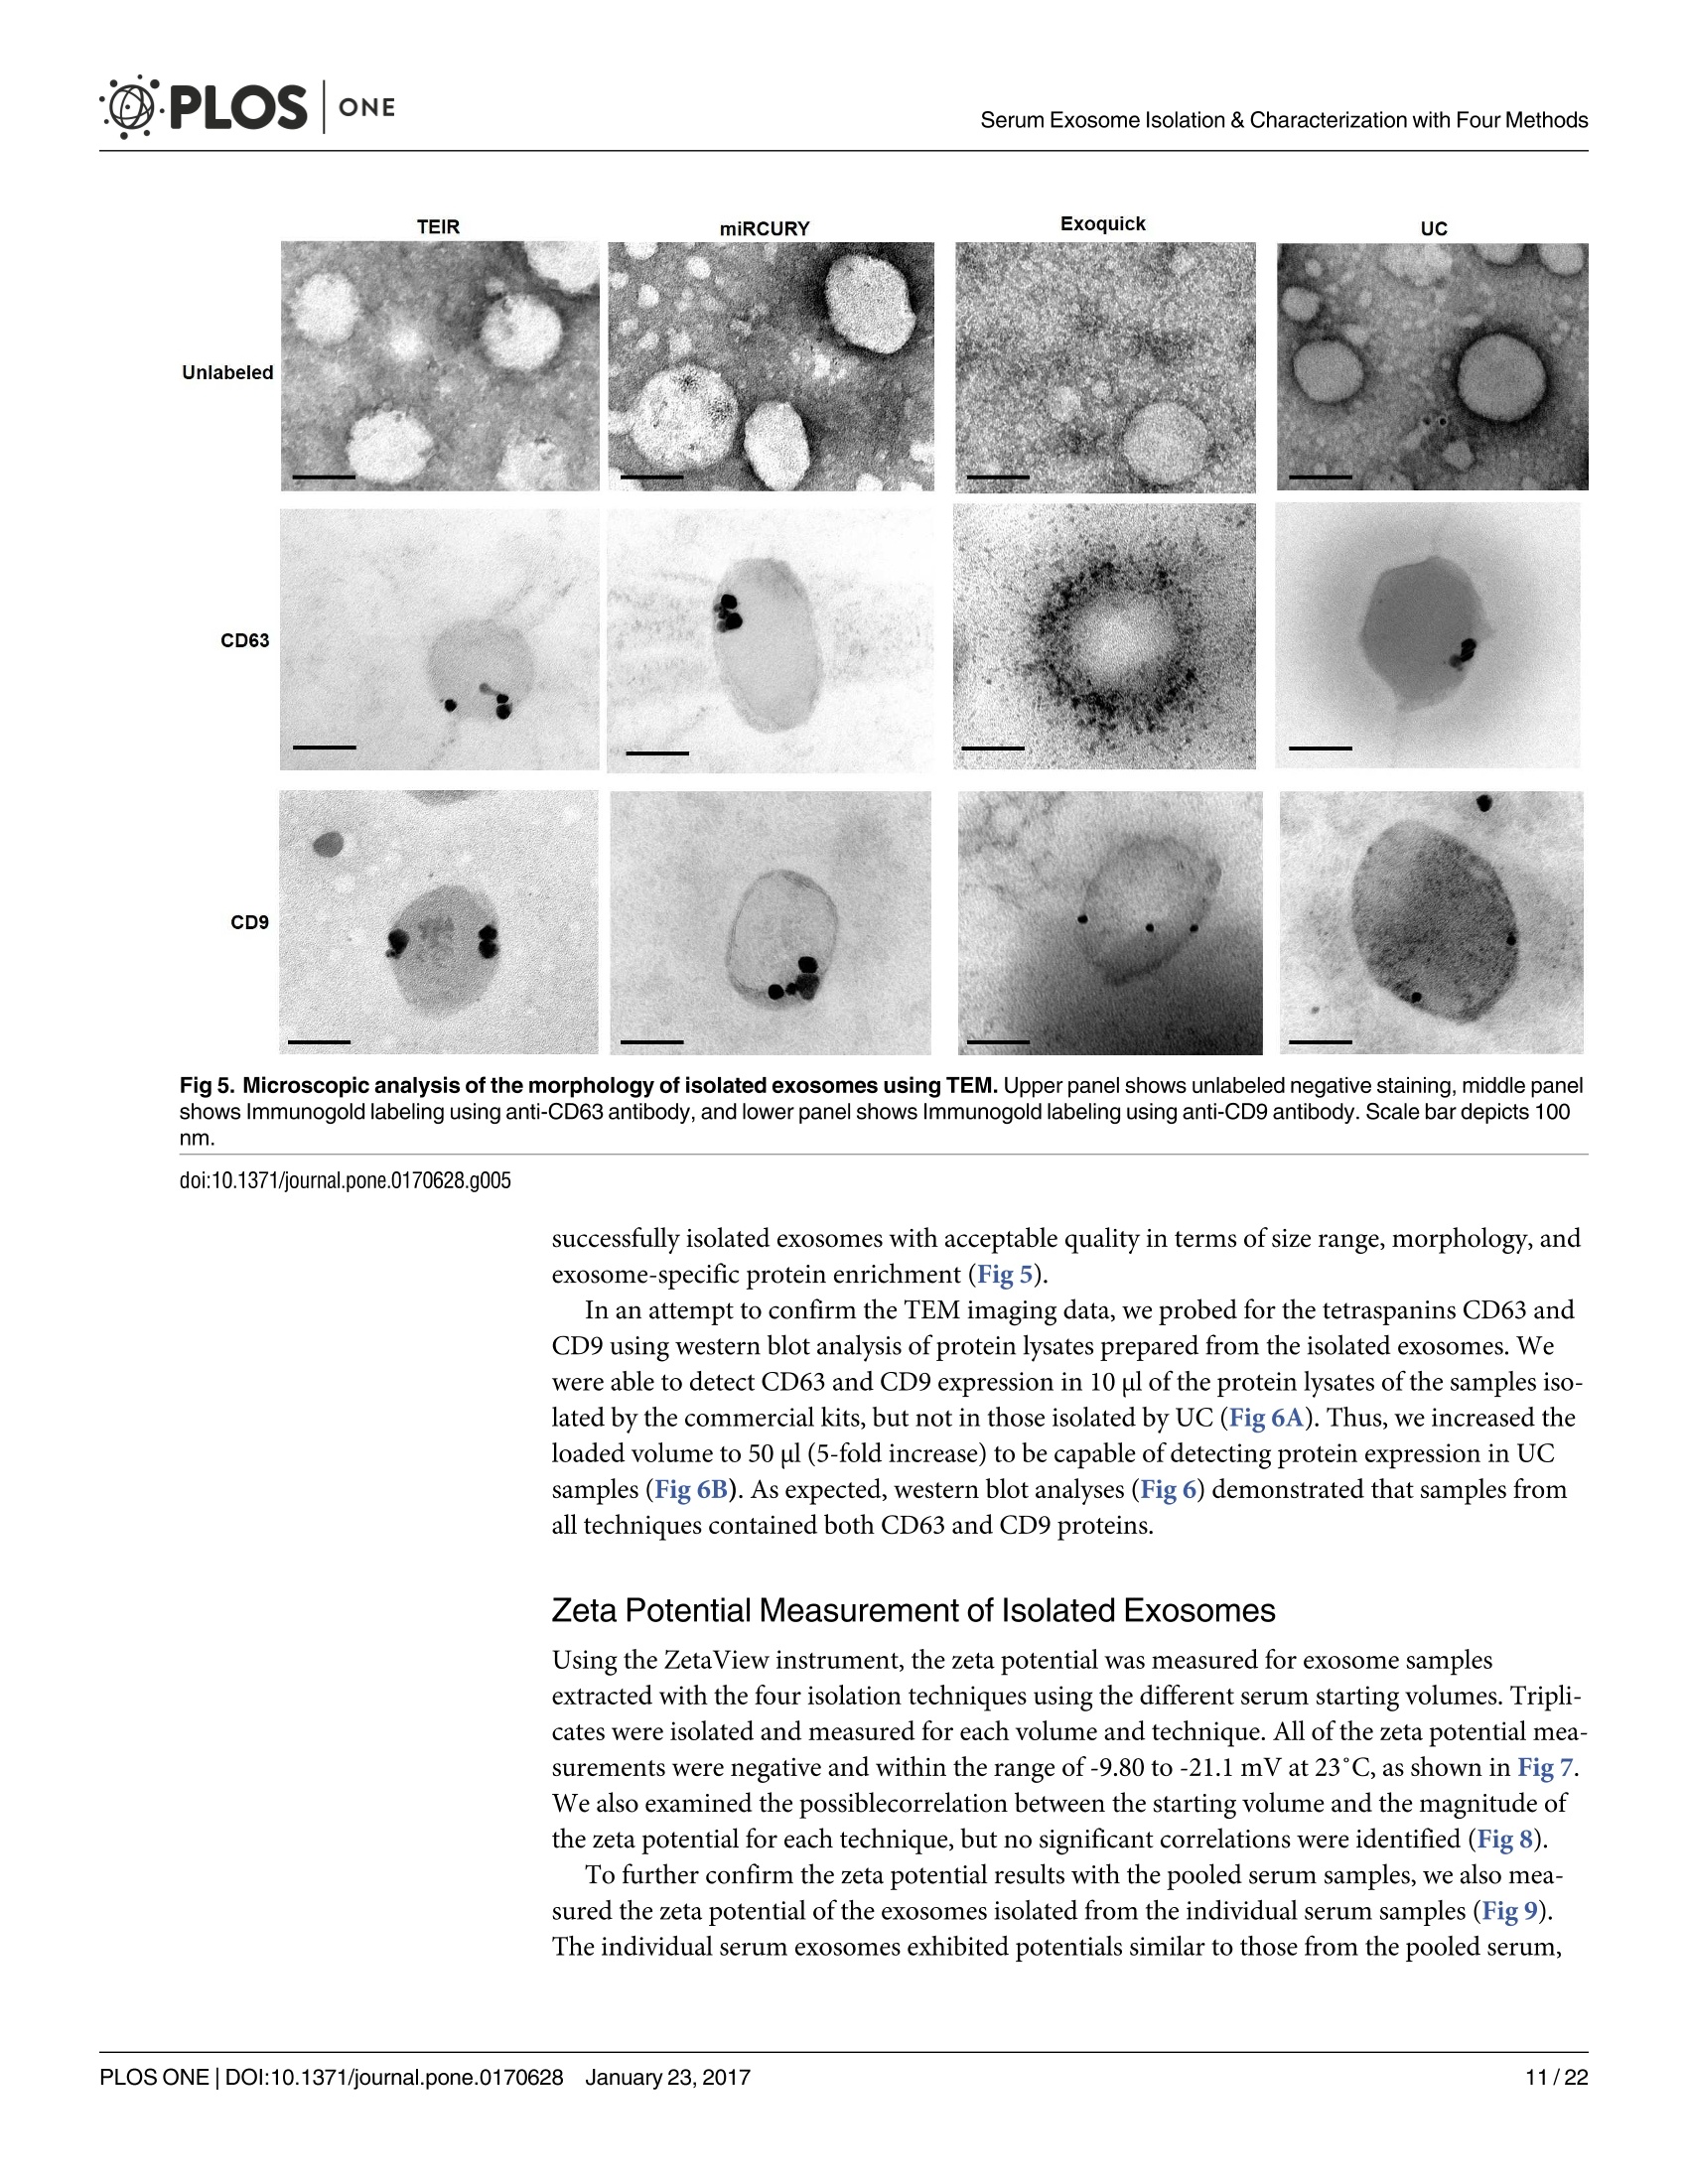
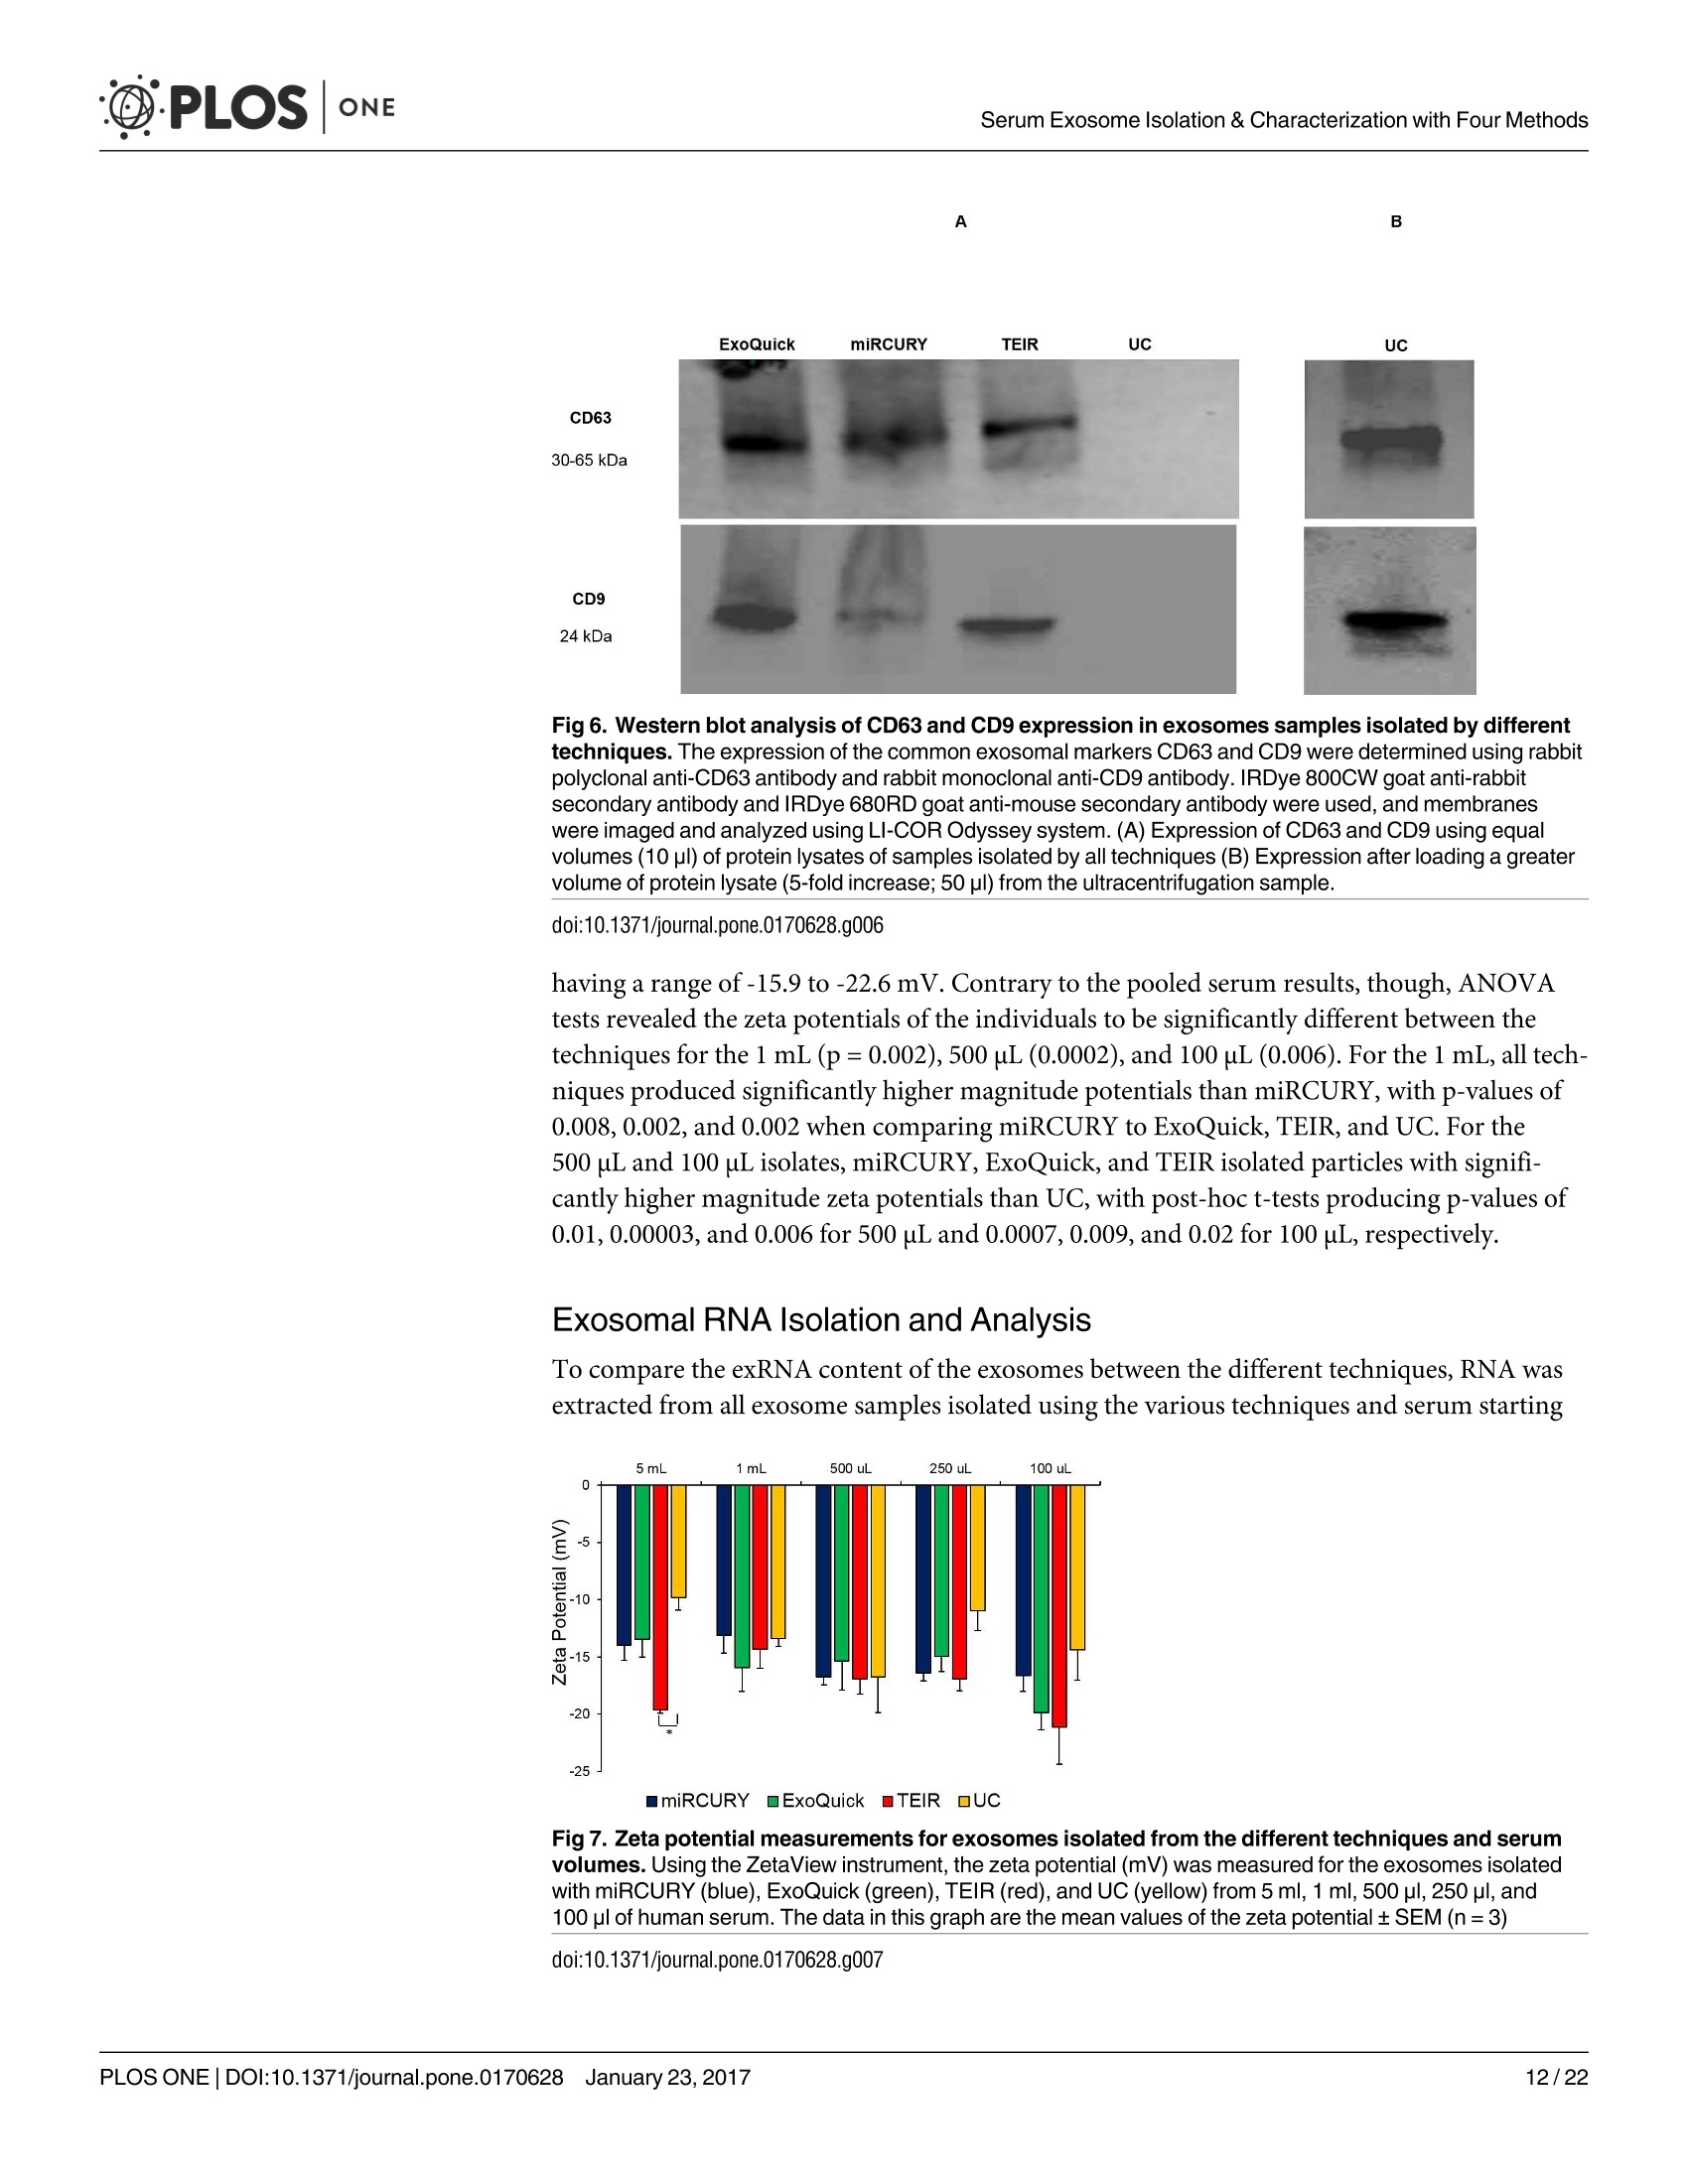
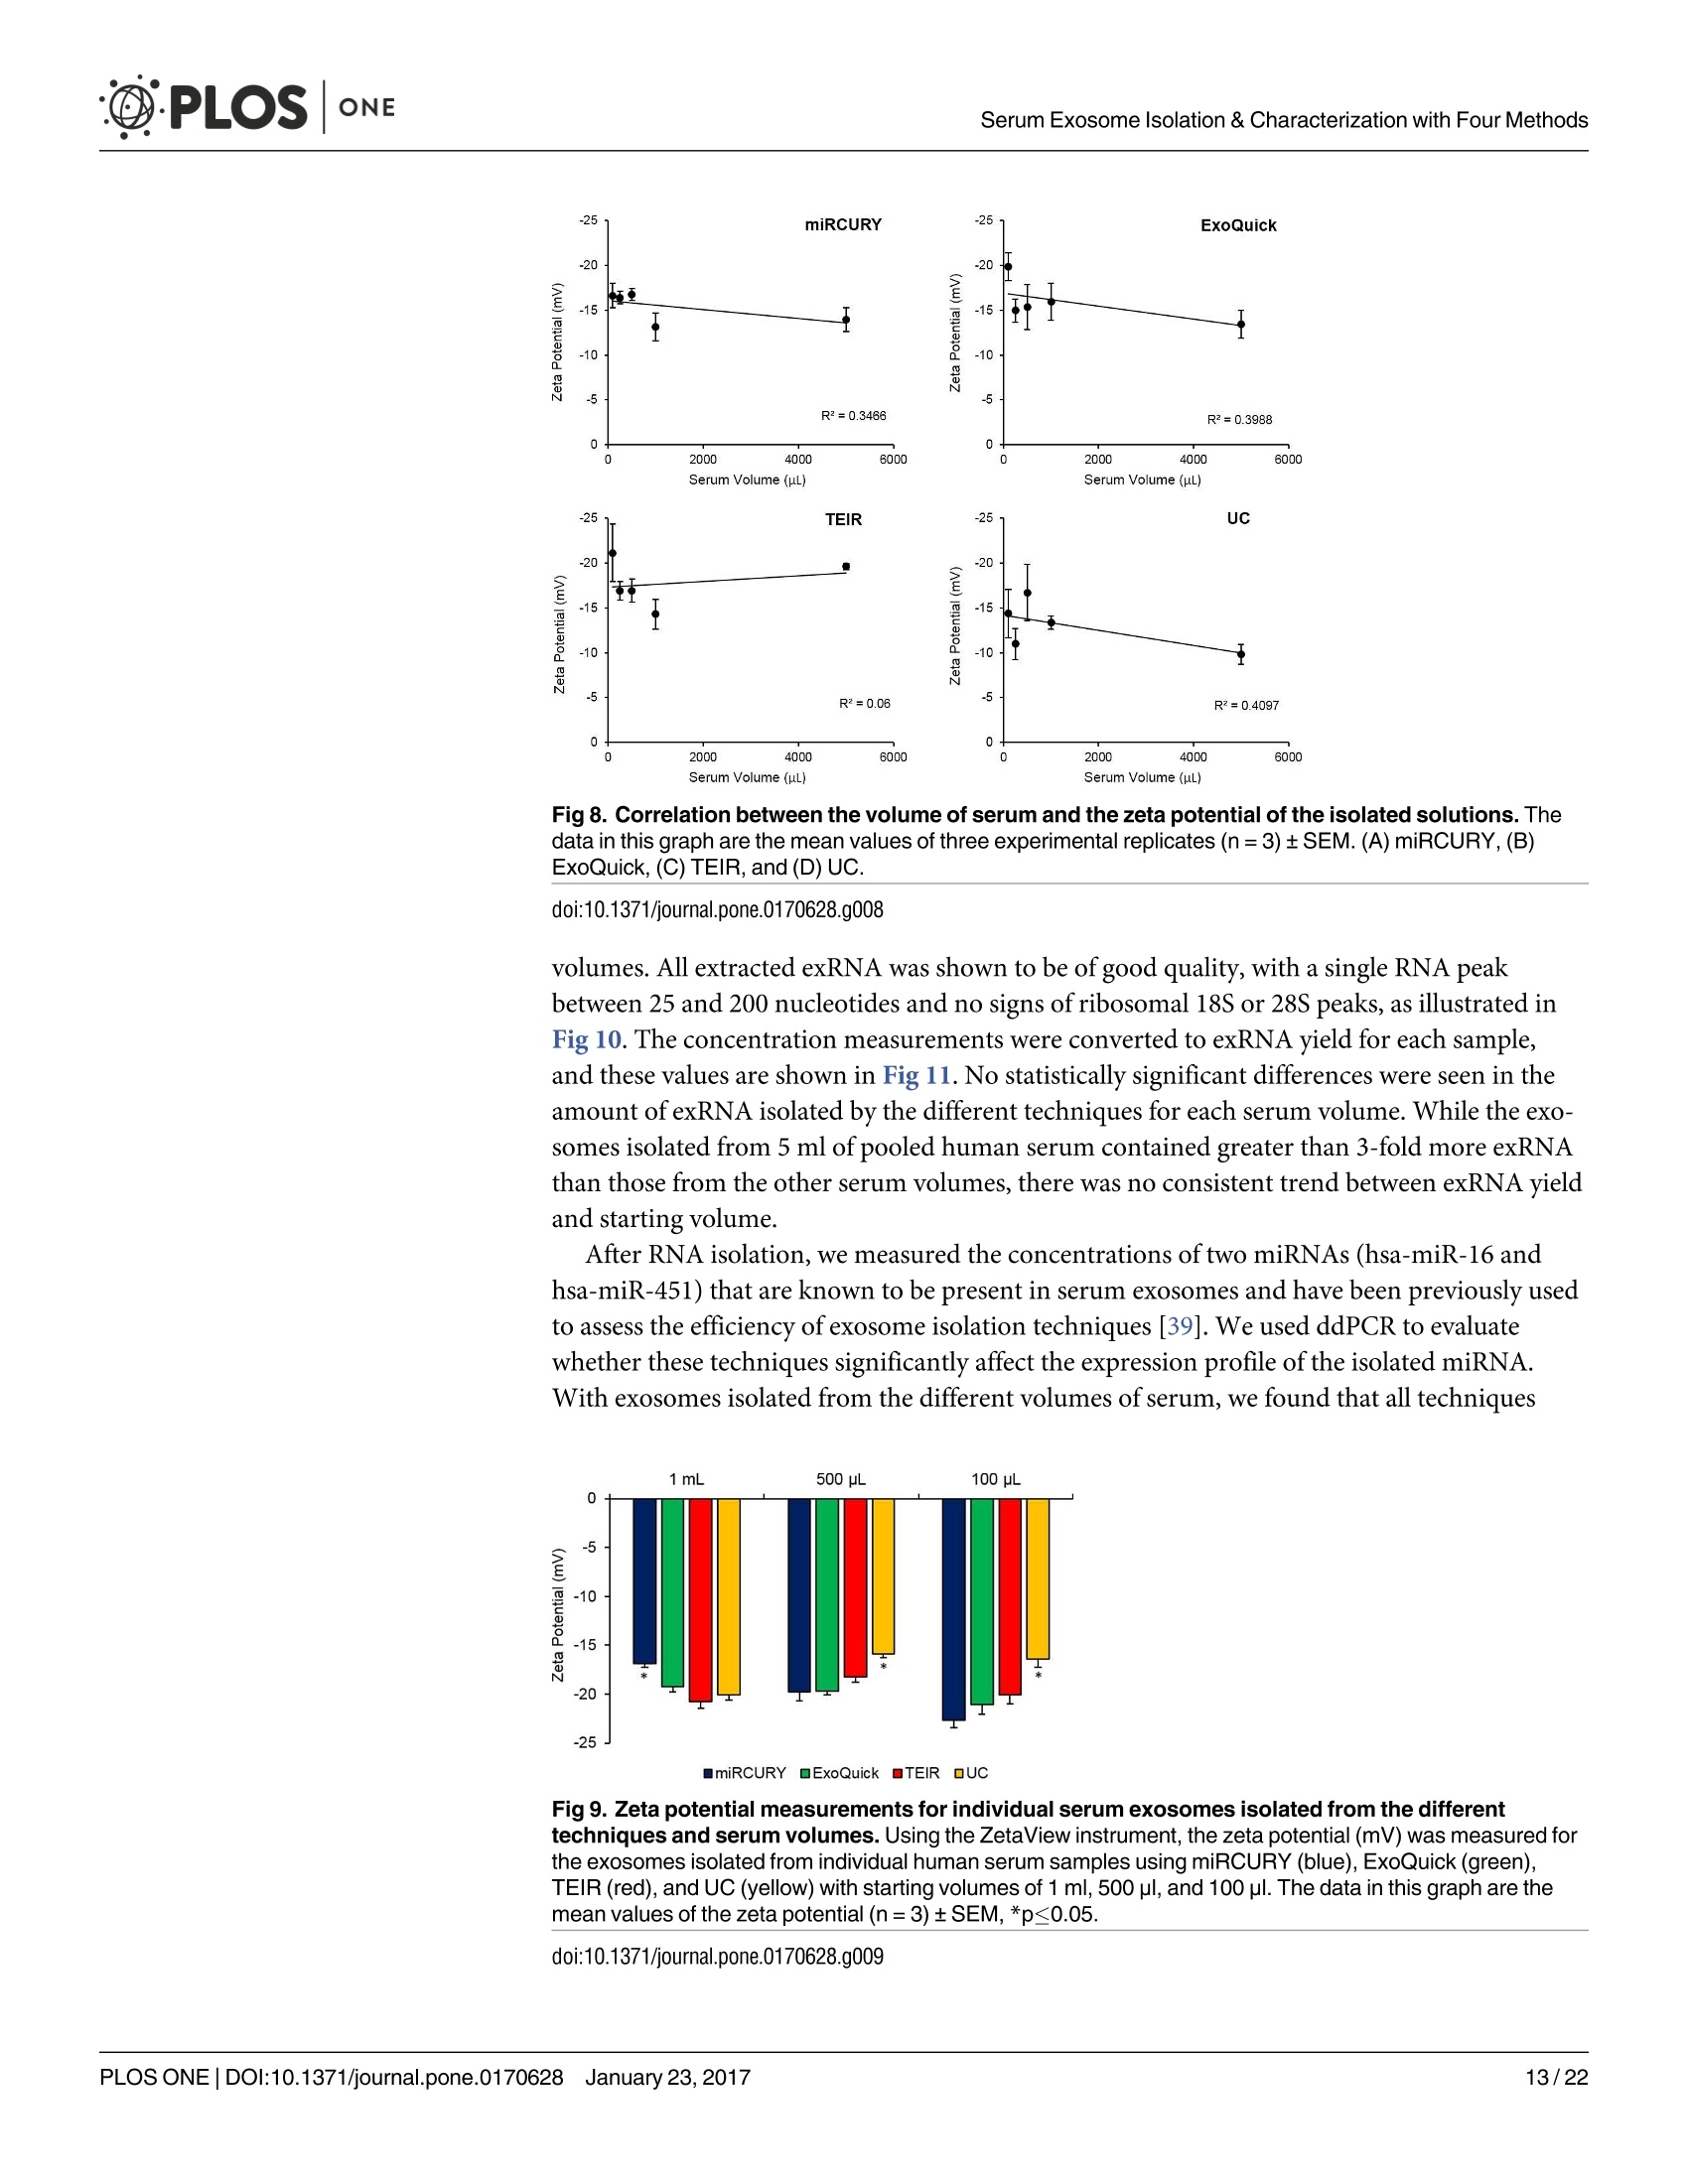
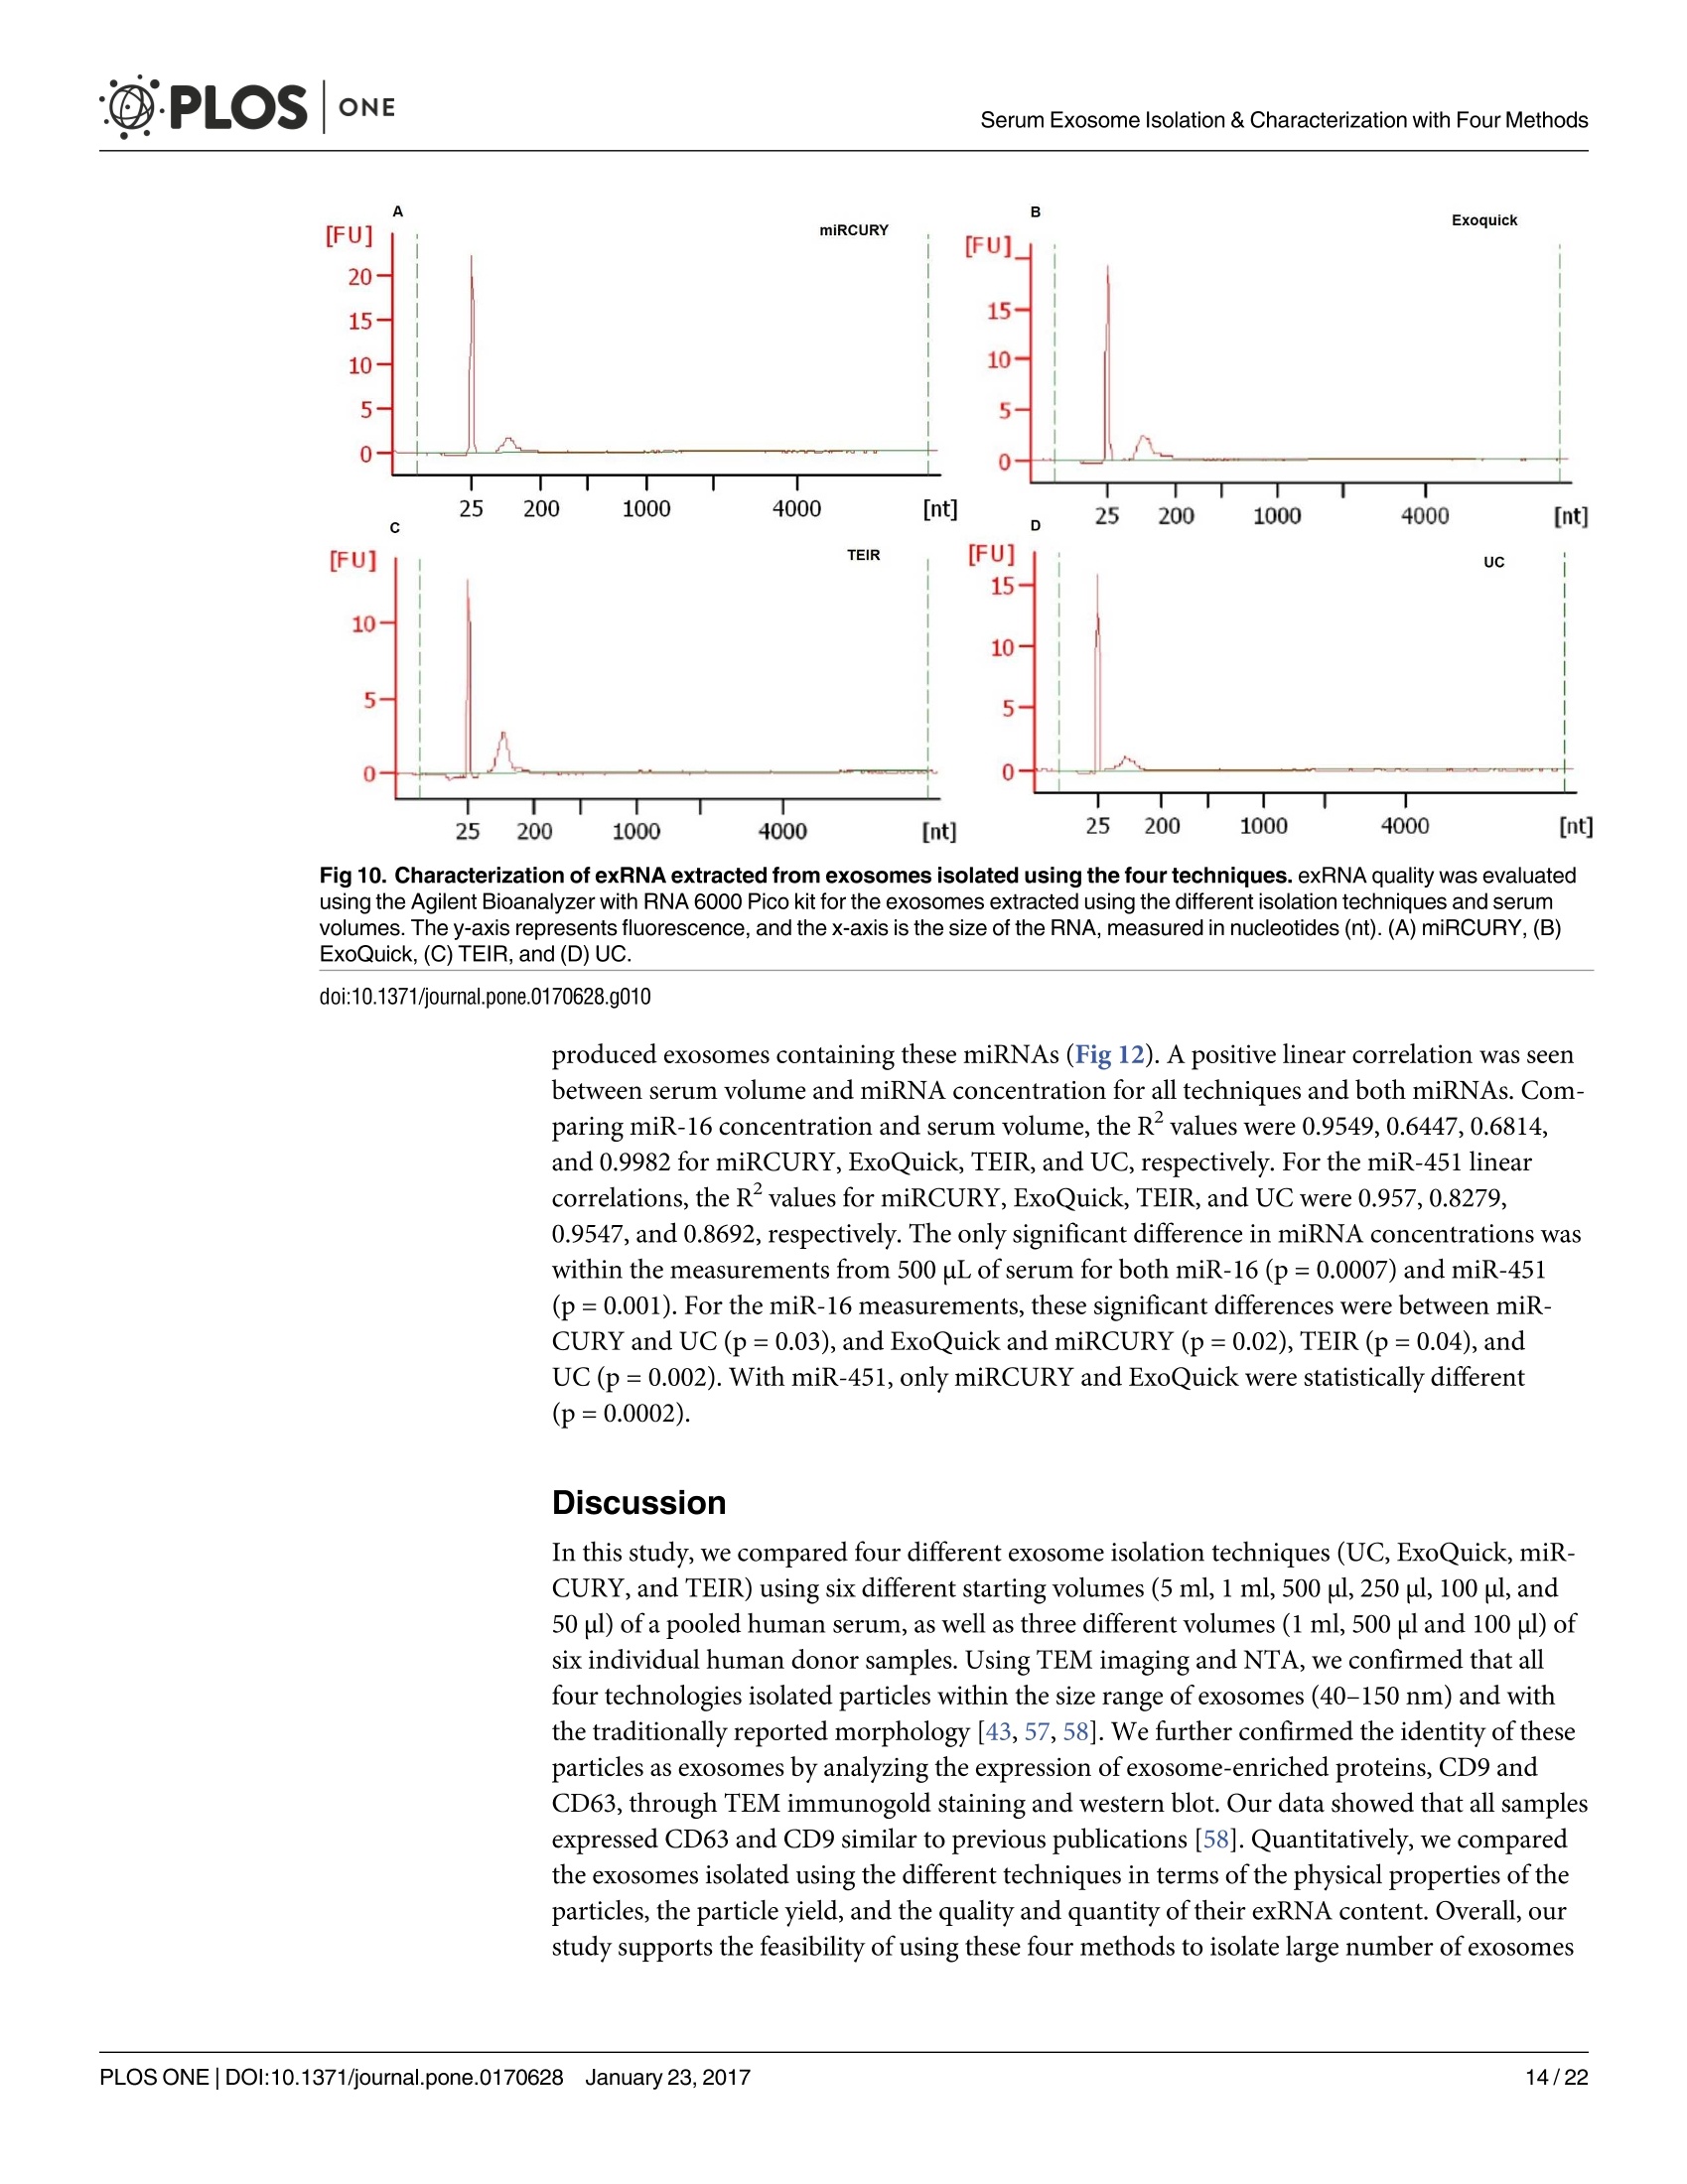
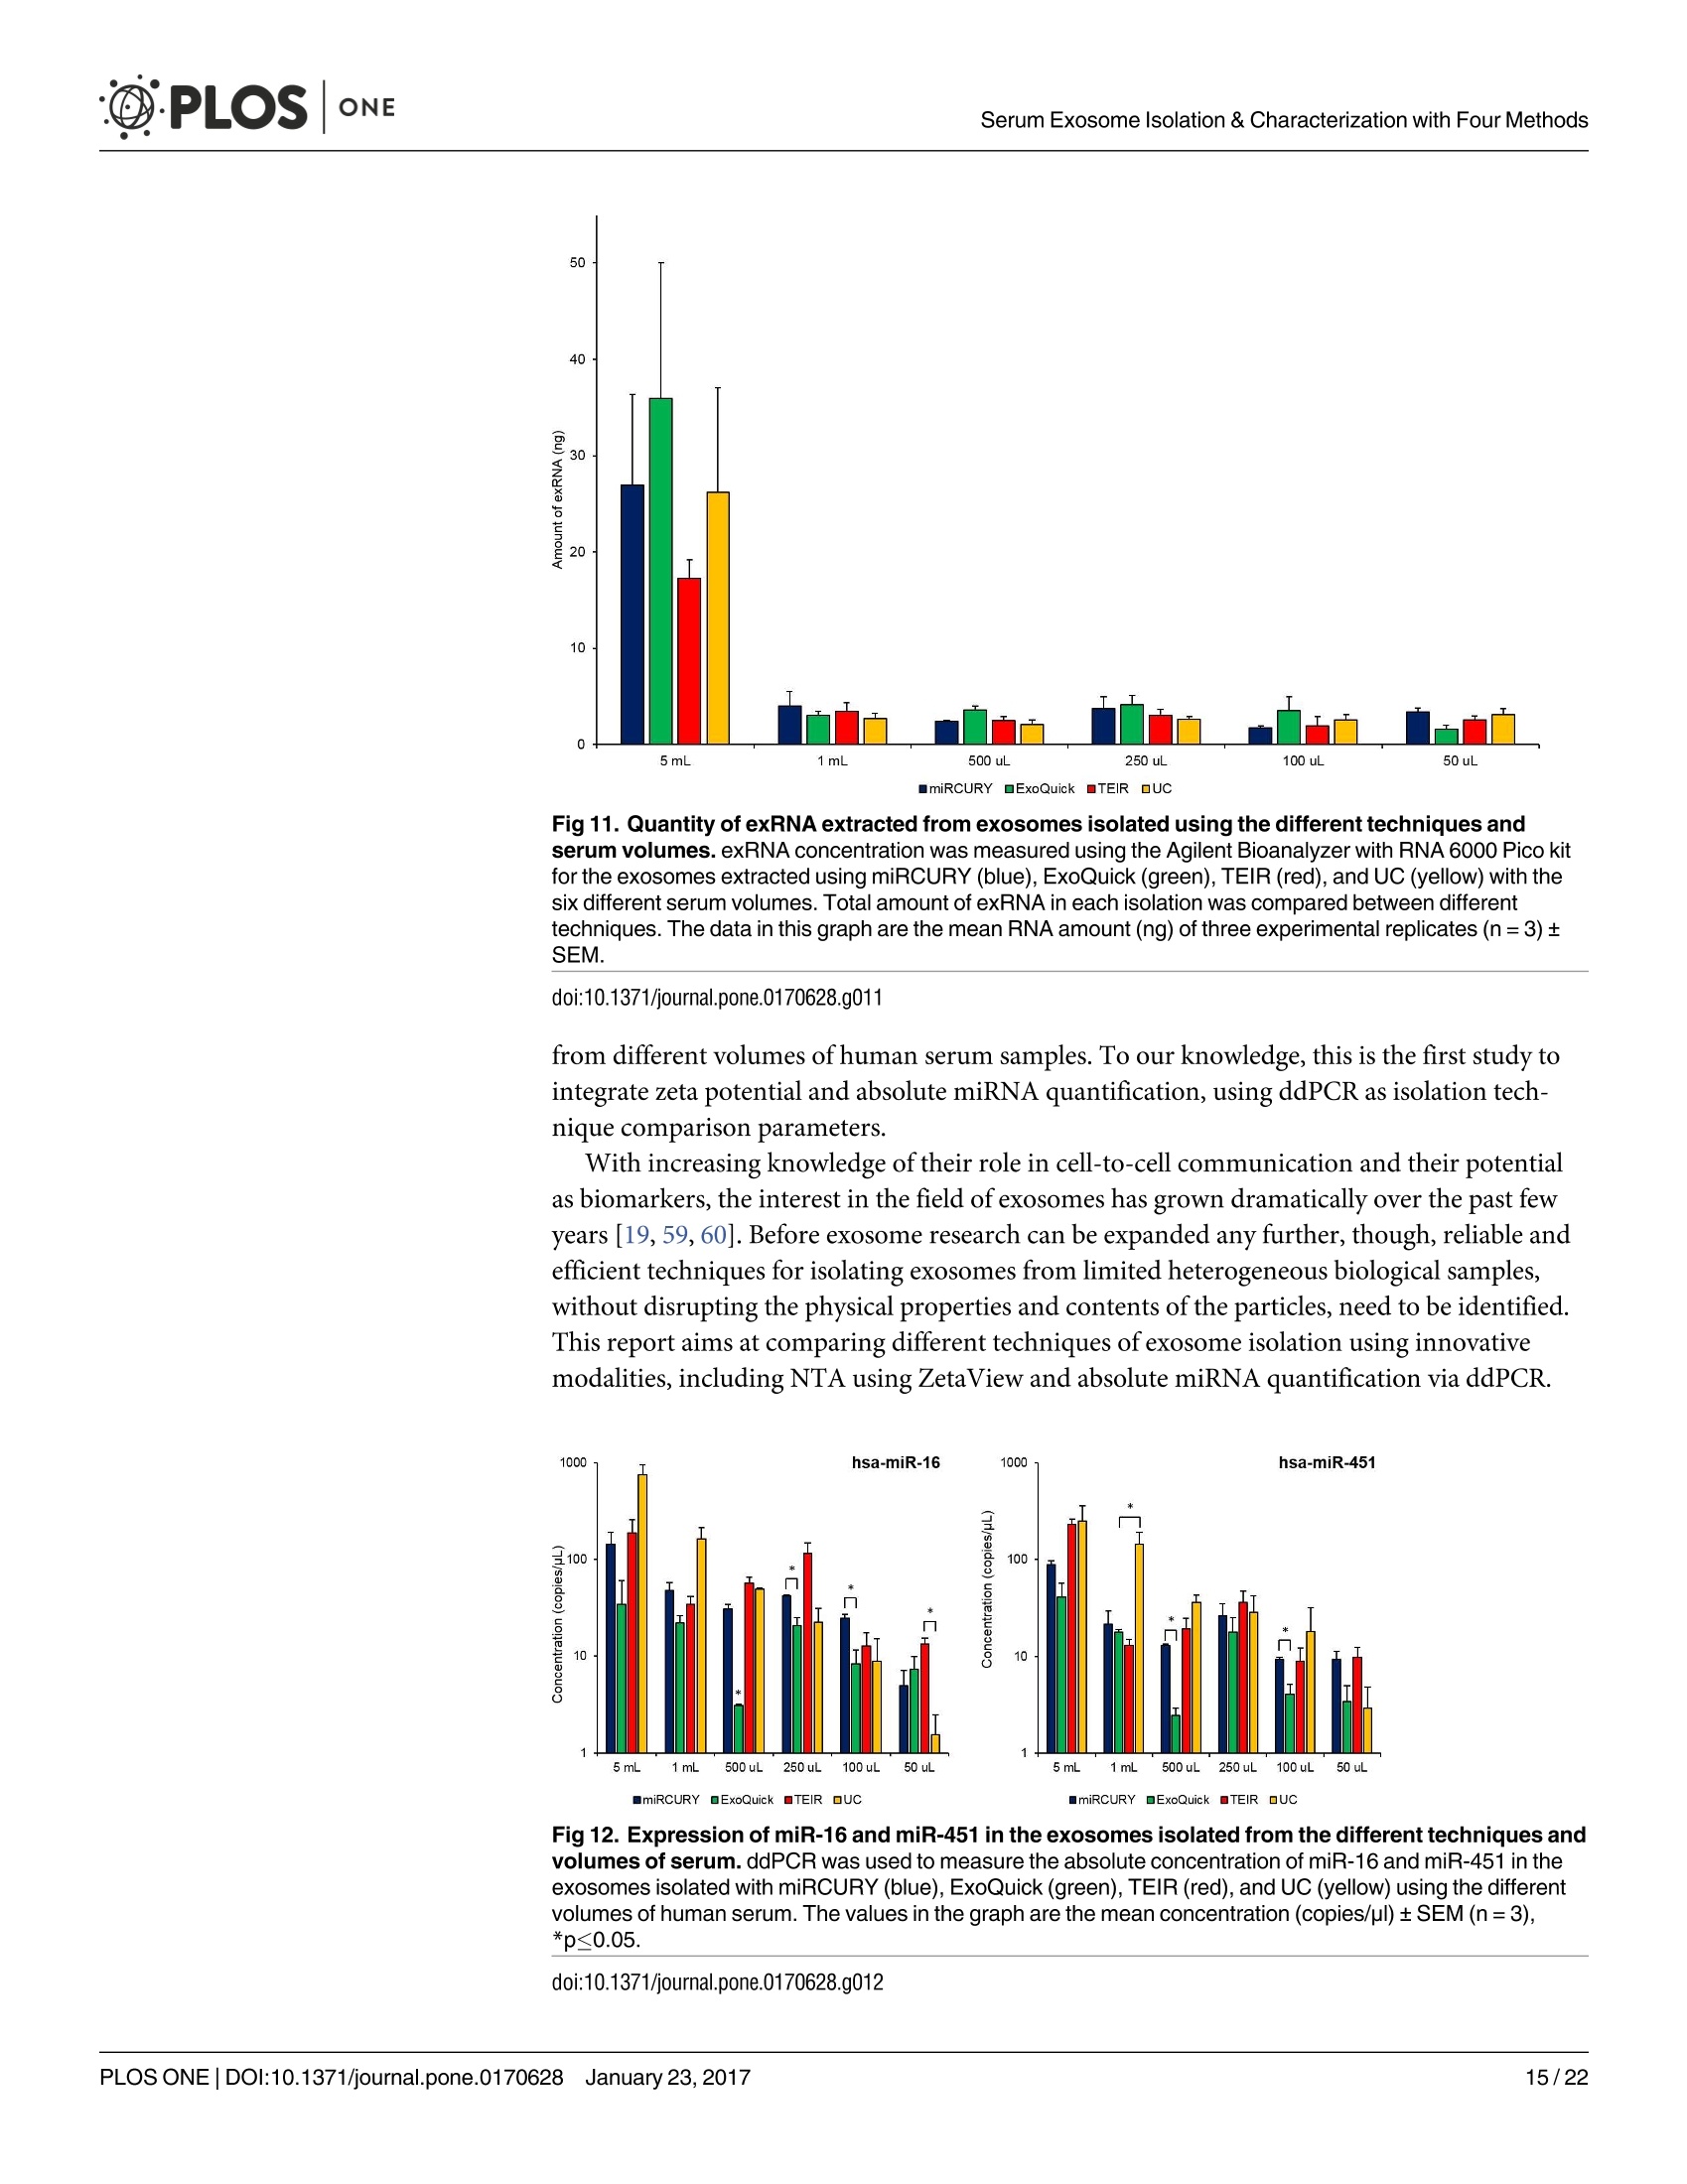
D·PLOSONE ·PLOSONESerum Exosome Isolation & Characterization with Four Methods OPEN ACCESS Citation: Helwa l, Cai J, Drewry MD, ZimmermanA, Dinkins MB, Khaled ML, et al. (2017) AComparative Study of Serum Exosome IsolationUsing Differential Ultracentrifugation and ThreeCommercial Reagents. PLoS ONE 12(1):e0170628.doi:10.1371/journal.pone.0170628 Editor: Giovanni Camussi, Universita degli Studi diTorino, ITALY Received: October 7, 2016 Accepted: January 6, 2017 Published: January 23, 2017 Copyright: C 2017 Helwa et al. This is an openaccess article distributed under the terms of theCreative Commons Attribution License, whichpermits unrestricted use, distribution, andreproduction in any medium, provided the originalauthor and source are credited. Data Availability Statement: All relevant data areincluded within the paper. Funding: We acknowledge the grant supports fromthe Glaucoma Research Foundation (YL),BrightFocus Foundation (YL), The GlaucomaFoundation (YL), NIH R01 EY023242 (YL), NIHR01 AG034389 (EB), NIH P01 AG036675 (MWH),NIH F32 EY023468 (WMD), and NIH F32AG044954 (MBD) as well as the Startup Fund fromAugusta University(YL). A Comparative Study of Serum ExosomeIsolation Using DifferentialUltracentrifugationand Three Commercial Reagents Inas Helwa1, Jingwen Cail, Michelle D. Drewry1, Arthur Zimmerman1, MichaelB. Dinkins?,Mariam Lotfy Khaled, Mutsa Seremwe, W. Michael Dismuke,Erhard Bieberich², W. Daniel Stamer34, Mark W. Hamrickl, Yutao Liu1,5,6* 1 Department of Cellular Biology and Anatomy, Augusta University, Augusta, Georgia, United States ofAmerica,2 Department of Neuroscience and Regenerative Medicine, Augusta University, Augusta, Georgia,United States of America, 3 Department of Ophthalmology,Duke University, Durham, North Carolina, UnitedStates of America, 4 Department of Biomedical Engineering, Duke University, Durham, North Carolina,United States of America,5 James & Jean Culver Vision Discovery Institute, Augusta University, Augusta,Georgia, United States of America, 6 Center for Biotechnology and Genomic Medicine, Augusta University,Augusta, Georgia, United States of America Abstract Exosomes play a role in cell-to-cell signaling and serve as possible biomarkers. Isolatingexosomes with reliable quality and substantial concentration is a major challenge. Ourpurpose is to compare the exosomes extracted by three different exosome isolation kits(miRCURY, ExoQuick,and Invitrogen Total Exosome Isolation Reagent) and differentialultracentrifugation (UC) using six different volumes of a non-cancerous human serum (5 ml,1 ml, 500 pl, 250 pl, 100 pl, and 50 pl) and three different volumes (1 ml, 500 pl and 100 pl)of six individual commercial serum samples collected from human donors. The smaller start-ing volumes (100 pl and 50 pl) are used to mimic conditions of limited availability ofhetero-geneous biological samples. The isolated exosomes were characterized based upon size,quantity, zeta potential, CD63 and CD9 protein expression, and exosomal RNA (exRNA)quality and quantity using several complementary methods: nanoparticle tracking analysis(NTA) with ZetaView, western blot, transmission electron microscopy(TEM), the AgilentBioanalyzer system, and droplet digital PCR (ddPCR). Our NTA results showed that all iso-lation techniques produced exosomes within the expected size range (40-150 nm). Thethree kits, though, produced a significantly higher yield (80-300 fold) of exosomes as com-pared to UC for all serum volumes, except 5 mL. We also found that exosomes isolated bythe different techniques and serum volumes had similar zeta potentials to previous studies.Western blot analysis and TEM immunogold labelling confirmed the expression of twocommon exosomal protein markers, CD63 and CD9, in samples isolated by all techniques.All exosome isolations yielded high quality exRNA, containing mostly small RNA with apeak between 25 and 200 nucleotides in size. ddPCR results indicated that exosomes iso-lated from similar serum volumes but different isolation techniques rendered similar con-centrations of two selected exRNA: hsa-miR-16 and hsa-miR-451. In summary, the three Competing Interests: The authors have declaredthat no competing interests exist. commercial exosome isolation kits are viable alternatives to UC, even when limited amountsof biological samples are available. Introduction Extracellular vesicles are spherical particles with phospholipid bilayers released by various celltypes in vivo into body fluids such as serum, urine, cerebrospinal fluid, breast milk, aqueoushumor, and amniotic fluid [1-7], as well as in vitro by cultured cells [8]. It is becoming increas-ingly obvious that these vesicles are pivotal mediators of cell-cell communication in multicellu-lar organisms, having pleiotropic cellular and biological functions [9-14]. Hence, they are nowregarded as multifunctional signaling complexes and major contributors to disease pathwayssuch as tumor progression and metastasis [15]. Generally, extracellular vesicles are classifiedaccording to their cellular origin and biogenesis into microvesicles, exosomes, and apoptoticbodies [16]. Exosomes range in size from 40-150 nm, and they are derived from the endoso-mal compartment within the cell [17]. Exosomal content includes genomic DNA, RNA,proteins, and lipids [10, 13, 15,18, 19].Over the past decade, exosomes have gained specificinterest as microRNA (miRNA) carriers, disease biomarkers, and potential therapeutic targets[17, 20, 21]. Despite their importance, exosome isolation and characterization are still consid-ered major scientific challenges [22, 23], and identifying the optimal technique to isolate exo-somes is essential for further biomarker discoveries. The traditional differential ultracentrifugation (UC) has been widely adapted as a reliabletechnique for isolating exosomes from biological fluids [24]. Recently, a number of commer-cial kits have been launched to isolate and study exosomes for various purposes [25-27]. Com-pared to UC, these kits are less time consuming, less technique sensitive, more compatiblewith limited volumes of biological samples, and do not require special equipment. Prior todownstream proteomic and genomic analyses using exosomes isolated by these methods,though, comprehensive characterization using parameters such as size, yield, zeta potential,and exosomal RNA (exRNA) quality and quantity is necessary [28, 29]. Nanoparticle tracking analysis (NTA) has been used since 2006 as a credible method tomeasure the size and concentration of nanoparticles, including exosomes [30]. The ZetaView(Particle Metrix, Meerbusch, Germany) is a newly launched instrument capable of characteriz-ing nanoparticles within about 10 to 2000 nm, using a laser scattering video microscope totrack the movement of individual nanoparticles under Brownian motion [30-33]. Besidesmeasuring size and concentration, the ZetaView can also be used to measure the zeta potential,which is defined as the electro-kinetic potential difference between the fixed boundary layer ofa charged particle and the migrating ions in the bulk solution and is typically measured in mV[34, 35]. Being used as an indicator of stability, the higher the magnitude of the zeta potential,the higher the repulsion between the particles in solution, suggesting a reduced likelihood ofagglomeration or sedimentation in the solution [32-36]. Several studies have attempted to compare the efficiency, reproducibility, and effect ondownstream analyses of various exosomes isolation techniques [37-46]. Many of these reportsinadequately characterized the exosomes either in terms of physical properties (size, concen-tration, and zeta potential) or in terms of the exRNA quality and quantity [37-42]. For exam-ple, Rekker et al. compared UC and ExoQuick using a single volume of serum samples (1 ml)in terms of miRNA expression; however, they overlooked the quality and absolute quantity ofthe extracted exRNA [39]. Alvarez et al. also compared UC to ExoQuick using two large vol-umes ofurine samples (25 and 10 ml) without including any NTA data to confirm the physical properties of the isolated particles [37]. Instead, they relied exclusively on comparing the pro-tein content of the isolated extracts, including levels of CD9, TSG101, and ALIX. These proteinmarkers cannot be used for absolute quantification of exosomes [37, 40, 47]. In addition, thequantitative real-time PCR(qRT-PCR) data published by this group are hard to interpret dueto lack of a reliable housekeeping gene that can be used to assess exRNA [37]. Therefore, the main goal of our study is to compare different isolation techniques by char-acterizing the exosomes using more comprehensive terms: size and morphology with NTAand transmission electron microscopy (TEM) imaging, yield with NTA, protein expressionwith TEM imaging and western blot analysis, zeta potential with NTA, exRNA quality with theAgilent Bioanalyzer instrument, and absolute quantity of selected miRNAs with droplet digitalPCR (ddPCR). Materials and Methods Materials Pooled human serum (Valley Biomedical, Winchester, VA, catalog #HS1004P) and six com-mercially available individual donor samples (BioreclamationIVT,NY, Item #HMSRM) wereused for exosome isolation. We used three exosome isolation kits for this study: miRCURY TMexosome isolation kit-serum and plasma (miRCURY) (Exiqon, Woburn,MA), ExoQuickMSerum Exosome Precipitation Solution (ExoQuick) (System Biosciences, Mountain view, CA),and Total Exosome Isolation Reagent for serum (TEIR) (Life Technologies, Carlsbad, CA). Toisolate exRNA, miRCURY RNA Isolation Kit-Cell & Plant (Exiqon, Woburn,MA) was used.RIPA lysis and extraction buffer (GBiosciences, St. Louis, MO), 2xLaemelli buffer (Bio-Rad,Hercules, California), and 100x halt protease inhibitor EDTA-free cocktail (Thermo Scientific,Grand Island, NY) were used to prepare protein samples for western blot analysis. Rabbitmonoclonal anti-CD63 antibody was from Abcam (Cambridge, MA), and rabbit polyclonalanti-CD9 antibody was purchased from Santa Cruz (Dallas, Texas). IRDye 800CW-conjugatedgoat anti-rabbit secondary antibody was from LI-COR (Lincoln,Nebraska). Exosome Isolation Total exosomes were extracted from six different volumes of commercially available pooledhuman serum (5ml, 1ml, 500 ul, 250 ul, 100 ul, and 50 ul) and three different volumes of sixindividual donors’ serum samples (1 ml, 500 ul, and 100 ul) using TEIR, ExoQuick, miR-CURY, and UC. Each volume of the pooled serum was isolated three separate times per eachtechnique, and data were presented as the mean of these three independent experimental repli-cates, whereas each volume of the individual serum samples was isolated and measured once.The exosome isolation kits were used according to the manufacturer’s instructions. In brief, aninitial spin was performed at 10,000xg (room temperature) for 10 minutes for each sample toremove cells and debris, then the corresponding amounts of reagents were added proportionalto the starting sample volume, according to the manufacturer's instructions. Mixtures werevortexed and incubated at 4℃ for up to an hour and then centrifuged at room temperature toprecipitate exosome pellets. Regarding the centrifugation parameters, samples extracted byTEIR (catalog# 4478360) were centrifuged at 10,000g for 30 minutes followed by pellet resus-pension in 1XPBS. As for ExoQuick (Catalog# EXOQ5A-1) and miRCURY (catalog# 300101),centrifugation was done for 30 minutes at 1,500xg followed by pellet resuspension in nucleasefree water and the manufacturer-supplied resuspension buffer, respectively. The resuspensionvolume for exosome pellets was 500 ul for 5 ml and 100 ul for 1 ml starting volumes. To ensureenough concentration of exosomes for further analysis, all other starting volumes were resus-pended in 50 ul buffer or nuclease free water. All exosomes were stored at-80°℃ immediately after isolation until further analysis. For NTA, all samples were diluted using 1XPBS, andresuspension volumes and dilution factors were used to calculate the total number of isolatedexosomes, shown in Table 1. For TEM, all samples were freshly isolated and diluted in nucle-ase-free water for better image quality. For differential ultracentrifugation, the serum samples from each starting volume were cen-trifuged at 20,000xg (4°C) for 30 min to remove contaminating debris. Samples were then cen-trifuged at 110,000xg (4°℃) for 70 min using Sw55Ti rotor, and pellets were resuspended in1XPBS. Samples were then centrifuged again at 110,000xg, after which the pellets were resus-pended in 1XPBS and stored at -80℃ for further analysis. ZetaView Nanoparticle Tracking Analysis NTA was performed using the ZetaView PMX 110 (Particle Metrix, Meerbusch, Germany)and its corresponding software (ZetaView 8.02.28) [31]. For each sample, 2 ml of the sample, Table 1. Nanoparticle tracking analysis of exosomes isolated from the commercial pooled,non-cancerous human serum using various tech-niques and serum volumes. Serum Volume Isolation Technique Mode/Diameter* (nm)(mean±SEM) Total Number of particles* (mean±SEM) 5mL miRCURY 122±10 7.3x10¹¹±3.0x10¹¹ ExoQuick 111±5 7.4x10¹¹±3.5x10¹¹ TEIR 105±5 9.9x10¹¹±4.2x10¹¹ UC 134±3 2.4x10°±1.1x10° 1mL miRCURY 106±3 1.5x10¹¹±2.6x10¹⁰ ExoQuick 109±4 1.8x10¹¹±3.1x101° TEIR 112±4 1.4x10¹¹±5.9x10¹⁰ UC 133±11 1.1x10°±2.0x10° 500pL miRCURY 116±5 4.5x10¹⁰±8.9x10° ExoQuick 117±8 6.6x10¹⁰±1.2x101° TEIR 107±3 1.0x10¹¹±2.6x101° UC 126±2 4.6x10±8.5x10 250 pL miRCURY 118±5 3.0x10¹⁰±4.6x10° ExoQuick 119±1 4.2x101±1.5x10¹⁰ TEIR 122±3 2.4x10¹⁰±5.8x10° UC 129±7 2.9x10±7.5x10 100 pL miRCURY 119±5 1.1x101°±1.6x10° ExoQuick 126±2 4.1x101°±1.5x101° TEIR 125±3 1.8x101°±5.6x10° UC 126±4 1.2x10°±3.5x10 50 pL miRCURY 117±6 5.5x10°±8.5x10° ExoQuick 118±2 6.5x10°±1.8x10° TEIR 119±4 6.6x10°±1.5x10° UC 123±4 7.0x10°±3.2x10' Average miRCURY 116±3 ExoQuick 117±3 TEIR 115±4 UC 129±2 *Data included in this table represent the mean readings of three experimental replicates that were extracted, diluted, and measured separately. Dataintervals represent the SEM. ( Refers to the average diameter of the isolated particles by each technique from all starting volumes collectively. TEIR: Total Exosome Isolation Reagentfrom serum (Life Technologies, Carlsbad, CA); UC, ultracentrifugation; miRCURY: miRCURY Exosome Isolati o n Kit-Serum and Plasma ( Exiqon, Woburn,MA),ExoQuick: E x oquick Serum Exosome Precipitation Solution (System Biosciences, Mountain view, CA). ) doi:10.1371/journal.pone.0170628.t001 diluted in 1xPBS, was loaded into the cell, and the instrument measured each sample at 11 dif-ferent positions throughout the cell,with two cycles of readings at each position. After auto-mated analysis of all 11 positions and removal of any outlier positions, the mean, median, andmode (indicated as diameter) sizes, as well as the concentration of the sample, were calculatedby the optimized machine software. For each measurement, the instrument pre-acquisitionparameters were set to a temperature of 23°C, a sensitivity of 85, a frame rate of 30 frames persecond (fps), a shutter speed of 100, and a laser pulse duration equal to that of shutter duration.Post-acquisition parameters were set to a minimum brightness of 25, a maximum size of 200pixels, and a minimum size of 5 pixels. Polystyrene particles from ThermoFisher Scientificwith a known average size of 100 nm were used to calibrate the instrument prior to samplereadings. Automated quality control measurements including, but not limited to, cell qualitycheck and instrument alignment and focus were also performed prior to the use of the Zeta-View for sample measurements. Temperature, conductivity, electrical field, and drift mea-surements were recorded for further quality control. Measurement data from the ZetaViewwere analyzed using the corresponding software, ZetaView 8.02.28, and Microsoft Excel 2013(Microsoft Corp., Seattle, WA, USA). As described previously, we selected the mode as themeasurement for size in our analysis [13, 32, 48, 49]. The mode, also referred to as the diame-ter, is defined as the size of the most abundant particles. Since resuspension volume variedwith technique and serum volume, resuspension volumes and dilution factors were used toconvert the yield from concentration to an absolute number of particles, helping improve theaccuracy and consistency of data interpretation. The number of particles per particle sizecurves was created using quadratic interpolation (Table 1). ZetaView Zeta Potential Measurements Zeta potential was measured at 23°C using the ZetaView PMX 110, as previously described[32]. Zeta potential measurements were performed using samples diluted in 0.05XPBS solu-tion, prepared by diluting 1X PBS 20 times with DNase, RNase-free water and adjusting thesolution conductivity to approximately 500 uS/cm, and the PBS pH and conductivity weremonitored to ensure consistency. All of the acquisition parameters were identical to those ofthe size and concentration measurements. Zeta potential was measured for experimental tripli-cates of each starting volume of pooled human serum isolated per the different techniques,while each individual human serum was measured one time per technique and starting vol-ume. Similar to the size and concentration measurements, the data were analyzed using theinstrument software, ZetaView 8.02.28, and Microsoft Excel 2013 (Microsoft Corp., Seattle,WA,USA). Transmission Electron Microscopy (TEM) For transmission electron microscopy, freshly isolated exosome suspensions were fixed in 4%paraformaldehyde for 1 hour. Exosome suspensions from different samples (approximately5 pl) were applied to copper mesh Formvar coated carbon stabilized grids, were allowed toadsorb to the grid for 4-5 minutes and then were wicked off with filter paper. For negativestaining ofexosomes, 1% Aqueous Uranyl Acetate (5 ul) was applied to the grid for 30 seconds,then wicked off with Whatman filter paper. Grids were allowed to thoroughly dry beforeviewing. As for immunoelectron labelling with anti-CD63 and anti-CD9, exosome samples werefixed overnight in 4% paraformaldehyde diluted in 0.1M cacodylate buffer (pH 7.4). Fixed exo-some preparations (20 pl) were applied to a carbon-Formvar coated 200 mesh nickel grids,and samples were allowed to stand for 30 minutes before wiping off excess using Whatman filter paper. Grids were then floated (sample side down) onto a 20 ul drop of 1M AmmoniumChloride for 30 minutes to quench aldehyde groups from the fixation step, followed by floatingon drops of blocking buffer (0.4% BSA in PBS) for 2 hours. Grids were rinsed 3 times (5 min-utes each) using 1xPBS and then were allowed to incubate with either blocking buffer only(negative control) or primary antibody (CD63) diluted with blocking buffer (1:100) for 1 hour.Rinsing of the grids using deionized water (3 times for 5 minutes each) and 1xPBS followedthe incubation step. Grids were then floated on drops of 1.4 nm anti-rabbit nanogold (Nanop-robes, Inc.) diluted 1:1000 in blocking buffer for l hour. Enhancing of grids using HQ Silver(gold enhancement reagent, Nanoprobes, Inc.) was then performed for 1 minute, followed byrinsing in deionized ice-cold water. As a final step, negative staining in 2% aqueous UranylAcetate was performed, and samples were wicked dry and then allowed to air dry. TEM exami-nation was performed using JEM 1230 transmission electron microscope (JEOL USA Inc.,Peabody, MA) at 110 kV and imaged with an UltraScan 4000 CCD camera & First Light Digi-tal Camera Controller (Gatan Inc., Pleasanton,CA). TEM sample preparation and imagingwas performed at the Electron Microscopy and Histology Core Laboratory at Augusta Univer-sity (www.augusta.edu/mcg/cba/emhisto/). Western Blot Analysis Protein samples were prepared by adding 100 ul ice-cold RIPA buffer with protease inhibitorto 100 ul extracted exosome samples suspended in the appropriate buffer. Samples were mixedby pipetting and then incubated on ice for 15 minutes; protein concentration was measuredusing Synergy H1 Multi-Mode Reader (BioTek, Winooski, VT, USA). 2x Laemmli buffer(100 ul) was then added, and samples were vortexed and stored at-20°C until analysis. Proteinsamples of 150 ug were loaded, separated on 8-10% SDS gels, and blotted on Immuno-blotPVDF membranes, followed by blocking for 1 hour and an overnight-incubation with primaryantibodies at 4°C. Since the measured UC samples had such low protein content, a higher sam-ple volume was loaded to achieve a similar protein concentration to the kit samples. This lowprotein content of the UC samples may be a reflection of their lower exosome yield. Mem-branes were then washed using Tris-buffered saline with 0.1% Tween and incubated with sec-ondary antibody for 1 hour at room temperature. Then, membranes were washed again andvisualized using infrared Odyssey machine (LI-COR Biosciences). RNAIsolation and Measurement RNA isolation was performed using the miRCURY RNA Isolation Kit-Cell & Plant (catalog #300110) (Exiqon, Woburn, MA) following the manufacturer’s instructions, as previouslydescribed [49,50]. The selection of this kit was based on the recommendation of several publi-cations and our own experience with different kits [51,52]. Briefly, up to 100ul resuspendedexosomes were processed with RNA isolation columns and buffers provided by the manufac-turer. A final volume of 50pl RNA solution was collected from each sample using the suppliedelution buffer. RNA concentration and quality were measured using Agilent 2100 Bioanalyzer(Santa Clara, CA) with the RNA 6000 Pico kit at the Integrated Genomics Core of AugustaUniversity Cancer Center (www.augusta.edu/cancer/research/shared/genomics). Droplet Digital PCR (DDPCR) The ddPCR experiments were performed using our previously published protocol [50, 53]. Weselected two miRNAs, hsa-miR-16 and hsa-miR-451, which have been previously reported asbeing abundantly expressed in isolated serum exosomes [39, 54, 55]. Applied Biosystems(Grand Island,NY) TaqMan miRNA assays for hsa-miR-16 (catalog # 4427975, Assay ID: 000391) and hsa-miR-451 (catalog# 4427975, Assay ID: 001141) were used to examine theexpression of these miRNAs in exosomes isolated from 5 ml, 1 ml, 500 ul, 250 ul, 100 ul, and50 ul serum with the four techniques [39]. Triplicates were isolated and measured for each vol-ume and technique. Briefly, approximately 200 pg of total RNA was reverse transcribed tocDNA using Taqman microRNA Reverse Transcriptase kit from Applied Biosystems (GrandIsland, NY,USA), according to the manufacturer’s instructions. 2 ul of undiluted cDNA wasused per ddPCR reaction. The reaction mix was prepared using QX200 ddPCR Supermix forprobes (No dUTP) from Bio-Rad (Hercules,CA, USA), and a Bio-Rad QX200 droplet genera-tor was used to partition each PCR reaction into up to 20,000 nano-sized droplets. The ampli-fied PCR products were quantified using Bio-Rad QX200 droplet reader and analyzed using itsassociated QuantaSoft software. For quality control, ddPCR reactions with less than 10,000droplets were excluded, and "no template controls”(ntc) were included to exclude any possibleContamination. Statistical Analysis Statistical analyses for particle diameter and total number of isolated particles were done usingJMP Pro (SAS, Cary, NC, USA) and Microsoft Excel 2013 (Microsoft Corp., Seattle, WA,USA). Because the assumption of equal variance could not be made with our data sets, analysisof variance was done using Welch’s ANOVA [56]. Post hoc tests were conducted using two-sample unequal variance t-tests. P-values less than or equal to 0.05 were considered significant,and confidence intervals were calculated using an alpha value of 0.05. Error bars in all figuresrepresent the standard error of the mean (SEM). Results Size and Total Number of Isolated Particles from Pooled Serum Six different volumes of serum samples (5 ml, 1 ml, 500 ul, 250 ul, 100 ul, and 50 ul) were usedfor isolation, and three experimental replicates were separately isolated per each examined vol-ume and isolation technique. The size and the total number of exosomes were comparativelyanalyzed using the ZetaView from Particle Matrix(Table 1). According to the NTA measurements of the exosomes extracted from the pooled humanserum, the isolated particles were within the expected size range for exosomes, 40-150 nm(Fig 1A and Table 1). Since no correlation was seen between starting volume and particle size,the average sizes of the most abundant particles (i.e., mode or diameter) isolated from allserum starting volumes were used to compare the different techniques. No significant differ-ences were found between the average diameters of exosomes prepared using the differentcommercial kits (p > 0.05). Exosomes isolated from UC, however, had a significantly greaterdiameter than the three commercial kits (p=0.003), with post hoc tests indicating a significantdifference between UC and miRCURY (p=0.003), UC and ExoQuick (p=0.004), and UCand TEIR (p=0.001). The increased diameter of UC isolated particles was also observed in thecurves of Fig 2, which depict the distribution of particles across the various sizes. For most ofthe serum volumes, the exosome distribution curve from UC appeared shifted to the rightcompared to the commercial kits, suggesting larger particles sizes. Since the number of particles isolated depended on the amount of starting material used,statistical analyses were conducted based on each starting serum volume. As shown in Fig 1B,while all the commercial kits generated similar yield of particles at each starting volume, UCconsistently produced significantly less particles than the commercial kits for the starting vol-umes of 50 uL (p=0.03), 100 pL(p=0.04), 250 pL (p=0.04), 500pL(p=0.03), and 1 mL(p=0.03). For the 1 ml, 500 pl, 250 pl, 100 pl, and 50 ul serum starting volumes, UC isolated Fig 1. ZetaView measurements of the exosomes extracted from the six serum starting volumes ofpooled human serum using the 4 different isolation techniques. NTA was done using the ZetaViewinstrument to measure (A) particles diameters (nm) and (B) the log10 of the total number of particles isolatedusing miRCURY (blue), ExoQuick (green), TEIR (red), and UC (yellow) from 5 ml, 1 ml, 500 pl, 250 pl, 100 pl,and 50 pl of human serum. The data in this graph are the mean values of three experimental replicates(+SEM),*p≤0.05. doi:10.1371/journal.pone.0170628.g001 approximately 126-fold,99-fold, 81-fold, 91-fold, and 79-fold less particles than the commer-cial kits, respectively. Despite the larger difference (~299 fold) in total particle yield betweenUC and the three commercial reagents with the 5 mL starting volume, this difference was notstatistically significant (p >0.05). A much larger variation was noted with the total number ofparticles at this starting volume for each isolation technique, which might account for the lackof significance in total number of particles. Post hoc tests revealed that for the starting volumesof 50 uL,100 uL, and 250 uL, the statistical differences lied between miRCURY and UC, withp-values of 0.03, 0.03, and 0.03, respectively. With a serum volume of 500 uL,ExoQuick andUC only were statistically different (p=0.04), while with 1 mL, UC was significantly differentthan both miRCURY (p=0.04) and ExoQuick (p=0.04). Consistent with these results, Fig 2also reflected the significantly reduced particle yield from UC compared to the commercialkits, with a much lower magnitude of particles numbers for each starting volume. Since the relationship between the starting sample volume and the number of particles iso-lated is an important factor to consider in selecting the techniques, we examined this correla-tion in our data. As shown in Fig 3, the relationship between the total number of particles andthe starting volume was linear for all isolation techniques, with the coefficient of determination(R) indicating good linear fits for all. Large variation, though, was seen in the experimentalreplicates isolated using the commercial kits and the 5 ml starting volume, with SEM valuesranging from 40-50% of the total number particles, as exemplified in Fig 3. Size and Total Number of Isolated Particles from Individual Serum Samples As the previous NTA was conducted using pooled serum samples processed as three experi-mental replicates, we sought to confirm our results using biologically distinct samples. Accord-ingly, exosomes were extracted from six different human donor serum samples using the same Fig 2. Size distribution of the exosomes isolated from pooled human serum using the differenttechniques and serum volumes. Foreach sample volume (5 ml, 1 ml, 500 pl, 250 pl, 100 pl, and50 pl) andtechnique, the number of particles per a specific particle size (nm) was measured using the ZetaView for NTA.Each graph represents quadratic interpolation of the mean number of particles isolated by each technique(n=3). Data from the commercial kits miRCURY (blue), ExoQuick (green), and TEIR (red) are graphed on theleft y-axis, while the UC (yellow) data, being at a significantly lower magnitude, are mapped on the right y-axis. doi:10.1371/journal.pone.0170628.g002 four techniques and three serum volumes (1 ml,500 pL,and 100 uL) that are similar to theexpected quantities of human samples available in clinical studies.NTA measurements showed Fig 3. Correlation between the volume of serum and the total number of particles isolated. Therelationship between the volume of serum and the total number of particles was linear for all four isolationtechniques: (A) miRCURY, (B)ExoQuick, (C) TEIR, and (D) UC. The data in this graph represent the averagenumber of isolated particles±SEM (n=3). doi:10.1371/journal.pone.0170628.g003 0 A 140 Fig 4. ZetaView measurements of the exosomes extracted from three different serum startingvolumes of six individual human donors samples using the 4 different isolation techniques. NTA wasdone using the ZetaView instrument to measure (A) particles diameters (nm) and(B) the log10 of the totalnumber of particles isolated using miRCURY (blue), ExoQuick (green),TEIR (red), and UC (yellow) from 1 ml,500 pl, and 100 pl of human serum. The data in this graph are the mean values of the six individual humansamples (±SEM),*p≤0.05. doi:10.1371/journal.pone.0170628.g004 that the isolated particles from the individual donor serum were consistently within theexpected size range for exosomes, 40-150 nm (Fig 4). Unlike the pooled serum exosomes, thediameters of the individual serum particles were not statistically different (p=0.1) between thedifferent techniques (Fig 4A). Similar to the results from the pooled human serum, though,the total number of particles isolated with UC was significantly different than the commercialkits at all starting volumes (Fig 4B). Post-hoc tests revealed that for the 500 uL, UC was statisti-cally different than miRCURY, ExoQuick, and TEIR with p-values of 0.01, 0.001, and 0.03,respectively, and for the the 100 uL samples, the p-values were 0.0004, 0.03, and 0.001, respec-tively. When comparing the number of particles isolated from 1 mL, UC remained statisticallydifferent than miRCURY (p=0.008), ExoQuick (p=0.006), and TEIR (p=0.006), while TEIRand miRCURY were also significantly different (p=0.03). Similar to the pooled serum, thekits produced more particles than UC, with at least 52-fold, 130-fold, and 44-fold more parti-cles for the 1 mL, 500 uL, and 100 uL starting volumes, respectively. Morphological and Proteomic Characterization After finding that the diameters of our particles are within the expected range for exosomes(40-150 nm), we further confirmed the identity of our isolates using TEM imaging, a well-accepted technique for nanoparticle validation. Negative staining (unlabeled) and immuno-gold labeling of the exosome samples isolated with each of the four techniques showed parti-cles with the classical morphology of exosomes and within the anticipated size range (Fig 5).We then selected two proteins traditionally known to be enriched in exosomes [9, 22], the tet-raspanins CD63 and CD9, and performed immunogold labelling EM (Fig 5) on samples iso-lated using the four techniques. Overall, our TEM data verified that the different techniques Fig 5. Microscopic analysis of the morphology of isolated exosomes using TEM. Upper panel shows unlabeled negative staining, middle panelshows Immunogold labeling using anti-CD63 antibody, and lower panel shows Immunogold labeling using anti-CD9 antibody.Scale bar depicts 100nm. doi:10.1371/journal.pone.0170628.g005 successfully isolated exosomes with acceptable quality in terms of size range, morphology, andexosome-specific protein enrichment (Fig 5). In an attempt to confirm the TEM imaging data, we probed for the tetraspanins CD63 andCD9 using western blot analysis of protein lysates prepared from the isolated exosomes. Wewere able to detect CD63 and CD9 expression in 10 ul of the protein lysates of the samples iso-lated by the commercial kits, but not in those isolated by UC (Fig 6A). Thus, we increased theloaded volume to 50 pl (5-fold increase) to be capable of detecting protein expression in UCsamples (Fig 6B). As expected, western blot analyses (Fig 6) demonstrated that samples fromall techniques contained both CD63 and CD9 proteins. Zeta Potential Measurement of Isolated Exosomes Using the ZetaView instrument, the zeta potential was measured for exosome samplesextracted with the four isolation techniques using the different serum starting volumes. Tripli-cates were isolated and measured for each volume and technique. All of the zeta potential mea-surements were negative and within the range of-9.80 to -21.1 mV at 23℃, as shown in Fig 7.We also examined the possiblecorrelation between the starting volume and the magnitude ofthe zeta potential for each technique, but no significant correlations were identified (Fig 8). To further confirm the zeta potential results with the pooled serum samples, we also mea-sured the zeta potential of the exosomes isolated from the individual serum samples (Fig 9).The individual serum exosomes exhibited potentials similar to those from the pooled serum, A Fig 6. Western blot analysis of CD63 and CD9 expression in exosomes samples isolated by differenttechniques. The expression of the common exosomal markers CD63 and CD9 were determined using rabbitpolyclonal anti-CD63 antibody and rabbit monoclonal anti-CD9 antibody. IRDye 800CW goat anti-rabbitsecondary antibody and IRDye 680RD goat anti-mouse secondary antibody wereused, and membraneswere imaged and analyzed using LI-COR Odyssey system. (A) Expression of CD63 and CD9 using equalvolumes (10 pl) of protein lysates of samples isolated by all techniques (B) Expression after loading a greatervolume of protein lysate (5-fold increase; 50 pl) from the ultracentrifugation sample. doi:10.1371/journal.pone.0170628.g006 having a range of -15.9 to -22.6 mV. Contrary to the pooled serum results, though, ANOVAtests revealed the zeta potentials of the individuals to be significantly different between thetechniques for the 1 mL (p=0.002), 500uL (0.0002), and 100 uL (0.006). For the 1 mL, all tech-niques produced significantly higher magnitude potentials than miRCURY, with p-values of0.008,0.002, and 0.002 when comparing miRCURY to ExoQuick, TEIR, and UC. For the500 uL and 100 uL isolates, miRCURY, ExoQuick, and TEIR isolated particles with signifi-cantly higher magnitude zeta potentials than UC, with post-hoc t-tests producing p-values of0.01, 0.00003, and 0.006 for 500 uL and 0.0007,0.009, and 0.02 for 100 uL, respectively. Exosomal RNA Isolation and Analysis To compare the exRNA content of the exosomes between the different techniques, RNA wasextracted from all exosome samples isolated using the various techniques and serum starting Fig 7. Zeta potential measurements for exosomes isolated from the different techniques and serumvolumes. Using the ZetaView instrument, the zetapotential (mV) was measured for the exosomes isolatedwith miRCURY (blue), ExoQuick (green),TEIR (red), and UC (yellow) from 5 ml, 1 ml, 500 pl, 250 pl, and100 pl of human serum. The data in this graph are the mean values of the zeta potential±SEM (n=3) doi:10.1371/journal.pone.0170628.g007 Fig 8. Correlation between the volume of serum and the zeta potential of the isolated solutions. Thedata in this graph are the mean values of three experimental replicates (n=3)±SEM. (A) miRCURY, (B)ExoQuick, (C) TEIR, and (D) UC. doi:10.1371/journal.pone.0170628.g008 volumes. All extracted exRNA was shown to be of good quality, with a single RNA peakbetween 25 and 200 nucleotides and no signs of ribosomal 18S or 28S peaks, as illustrated inFig 10. The concentration measurements were converted to exRNA yield for each sample,and these values are shown in Fig 11. No statistically significant differences were seen in theamount of exRNA isolated by the different techniques for each serum volume. While the exo-somes isolated from 5 ml of pooled human serum contained greater than 3-fold more exRNAthan those from the other serum volumes, there was no consistent trend between exRNA yieldand starting volume. After RNA isolation, we measured the concentrations of two miRNAs (hsa-miR-16 andhsa-miR-451) that are known to be present in serum exosomes and have been previously usedto assess the efficiency of exosome isolation techniques [39]. We used ddPCR to evaluatewhether these techniques significantly affect the expression profile of the isolated miRNA.With exosomes isolated from the different volumes of serum, we found that all techniques ■miRCURY口ExoQuick 口TEIR OUC Fig 9. Zeta potential measurements for individual serum exosomes isolated from the differenttechniques and serum volumes. Using the ZetaView instrument, the zeta potential (mV) was measured forthe exosomes isolated from individual human serum samples using miRCURY (blue), ExoQuick (green),TEIR (red), and UC (yellow) with starting volumes of 1 ml, 500 pl, and 100 pl. The data in this graph are themean values of the zeta potential (n=3)±SEM,*p≤0.05. doi:10.1371/journal.pone.0170628.g009 Fig 10. Characterization of exRNA extracted from exosomes isolated using the four techniques. exRNA quality was evaluatedusing the Agilent Bioanalyzer with RNA 6000 Pico kit for the exosomes extracted using the different isolation techniques and serumvolumes. The y-axis represents fluorescence, and the x-axis is the size of the RNA, measured in nucleotides (nt). (A) miRCURY,(B)ExoQuick, (C) TEIR, and (D) UC. doi:10.1371/journal.pone.0170628.g010 produced exosomes containing these miRNAs (Fig 12). A positive linear correlation was seenbetween serum volume and miRNA concentration for all techniques and both miRNAs. Com-paring miR-16 concentration and serum volume, the R’ values were 0.9549, 0.6447, 0.6814,and 0.9982 for miRCURY,ExoQuick, TEIR, and UC, respectively. For the miR-451linearcorrelations, the R2values for miRCURY, ExoQuick,TEIR, and UC were 0.957, 0.8279,0.9547, and 0.8692, respectively. The only significant difference in miRNA concentrations waswithin the measurements from 500 uL of serum for both miR-16 (p=0.0007) and miR-451(p=0.001). For the miR-16 measurements, these significant differences were between miR-CURY and UC (p=0.03), and ExoQuick and miRCURY (p=0.02),TEIR (p=0.04), andUC (p=0.002). With miR-451, only miRCURY and ExoQuick were statistically different(p=0.0002). Discussion In this study, we compared four different exosome isolation techniques (UC, ExoQuick, miR-CURY, and TEIR) using six different starting volumes (5 ml, 1 ml, 500 pl, 250 ul,100 pl, and50 ul) of a pooled human serum, as well as three different volumes (1 ml, 500 ul and100 ul) ofsix individual human donor samples. Using TEM imaging and NTA, we confirmed that allfour technologies isolated particles within the size range of exosomes (40-150 nm) and withthe traditionally reported morphology [43, 57, 58]. We further confirmed the identity of theseparticles as exosomes by analyzing the expression of exosome-enriched proteins, CD9 andCD63, through TEM immunogold staining and western blot. Our data showed that all samplesexpressed CD63 and CD9 similar to previous publications [58].Quantitatively, we comparedthe exosomes isolated using the different techniques in terms of the physical properties of theparticles, the particle yield, and the quality and quantity of their exRNA content. Overall, ourstudy supports the feasibility of using these four methods to isolate large number of exosomes Fig 11. Quantity ofexRNA extracted from exosomes isolated using the different techniques andserum volumes. exRNA concentration was measured using the Agilent Bioanalyzer with RNA 6000 Pico kitfor the exosomes extracted using miRCURY (blue), ExoQuick (green), TEIR (red), and UC (yellow) with thesix different serum volumes. Total amount of exRNA in each isolation was compared between differenttechniques. The data in this graph are the mean RNA amount (ng) of three experimental replicates (n=3)±SEM. doi:10.1371/journal.pone.0170628.g01 from different volumes of human serum samples. To our knowledge, this is the first study tointegrate zeta potential and absolute miRNA quantification, using ddPCR as isolation tech-nique comparison parameters. With increasing knowledge of their role in cell-to-cell communication and their potentialas biomarkers, the interest in the field of exosomes has grown dramatically over the past fewyears [19,59, 60]. Before exosome research can be expanded any further, though, reliable andefficient techniques for isolating exosomes from limited heterogeneous biological samples,without disrupting the physical properties and contents of the particles, need to be identified.This report aims at comparing different techniques of exosome isolation using innovativemodalities, including NTA using ZetaView and absolute miRNA quantification via ddPCR. Fig 12. Expression of miR-16 and miR-451 in the exosomes isolated from the different techniques andvolumes of serum.ddPCR was used to measure the absolute concentration of miR-16 and miR-451 in theexosomes isolated with miRCURY (blue), ExoQuick (green), TEIR (red), and UC (yellow) using the differentvolumes of human serum. The values in the graph are the mean concentration (copies/pl)±SEM (n=3),*p≤0.05. doi:10.1371/journal.pone.0170628.g012 Using western blot and immunogold staining with TEM, we have confirmed the expressionof two exosome proteins, CD63 and CD9. The protein expression data in this report contrasts thereport by Zarvoni and colleagues [61], in which they reported lack of expression of exosomemarkers in the exosome samples isolated from serum by ExoQuick. The western blot in the afore-mentioned report showed intense, non-specific bands in the ExoQuick samples as compared tothe samples isolated by UC. The authors explained this discrepancy by the presence of"spuriousprotein complexes”in the ExoQuick-derived samples. However, other reports have repeatedlyshown protein expression from samples derived from ExoQuick and TEIR, as well as other PEG-related methods [58, 62].Though levels of CD63 and CD9 expression from ExoQuick-derivedsamples varies among studies, none of them reported difficulty in the separation of the proteinbands. We suggest that the non-specific protein expression in the report by Zarvoni et al. may berelated to the protein samples preparation in terms of the type of lysis buffer used and the proteinlysate preparation technique used, which may dramatically affect the degree of dissociation of thepelleted exosomes. Nonetheless, the authors did not state clearly in the methods section themeans by which they prepared their western blot samples in terms of serum starting volume orthe type of lysis buffer used. Lack of such crucial methodology information hampers proper com-parison of data. However, protein expression levels alone cannot be used as the sole indicator ofexosome yield [40,46]. Our comprehensive analysis using protein expression data in combina-tion with the size and morphology of the isolated particles adequately indicates that all techniquesare able to isolate particles containing exosomes viable for down-stream research. UC has been long adopted as the traditional technique for exosome isolation; however,this method is relatively tedious, time consuming, and technique sensitive, requiring priortraining and the availability of an ultracentrifuge. Comparedto the commercial kits, exosomesextracted by UC from the pooled human serum sample produces significantly larger particles,as indicated by the diameter of the particles. This fusion event is seen in Fig 2, with the size dis-tribution curves of UC being shifted slightly to the right as compared to the commercial kits.As previously suggested, centrifuging at such high speeds possibly leads to fusion of the parti-cles with contaminants and other proteins, affecting the physical properties of the exosomesand the sensitivity of proteomic analysis [10, 63, 64]. However, the phenomenon of isolatingsignificantly larger diameter particles with UC was not observed in the individual serum sam-ples. Nonetheless, the commercial kits showed consistency in the diameter and concentrationof the extracted particles with both the single pooled serum sample and the individual serumsamples, suggesting that these kits are a viable alternative for exosome isolation, even amongvariable human samples. Beside causing fusion of particles, applying different centrifugationforces over multiple cycles, though helpful in removing cell debris and other contaminants,can also cause loss of exosomes from the sample, leading to lower and more variable exosomeyield [37]. This impact on exosome recovery in UC is congruent with the lower total numberof particles seen in our UC samples compared to the kits, a trend which has also been previ-ously observed by another group [38].The more particles from the commercial reagents mightbe because PEG (polyethylene glycol)-based volume exclusion is used to precipitate non-exo-some nanoparticles, such as serum protein aggregates, as supported by the lower exosomepurity reported in a recent method-development study of ExtraPEG [41,62]. We observed a linear correlation between the volume ofthe serum used for isolation andthe total number of particles isolated. While the total number of particles isolated by ExoQuickin our study was comparable to that reported by Caradec et al., they showed that the yieldof exosomes by UC remains constant regardless of the starting volume of serum [65]. Thisdirectly contrasts our results, with a 35-fold decrease in the total number of particles isolatedfrom 5 ml to 50 ul of serum, though Caradec et al. used a much smaller starting sample volumerange than we did in our study [65]. Although variations in zeta potential existed between different isolation techniques andstarting sample volumes, our zeta potential measurements show that the extracted exosomesby the different techniques are negatively charged and within the range previously reported byother groups [32, 66]. The biological significance of the variations between techniques andstarting volumes, though, remain to be determined. The small magnitude of the nanoparticles’zeta potentials indicate their instability in solution, suggesting the necessity ofusing cautionwhen handling and storing exosomes at temperatures othen than -80℃ [67-70]. Different exRNAs identified in exosomes have been suggested to play roles in exocytosis,angiogenesis, and tumorigenesis, so determining the exRNA quantity and quality between dif-ferent isolation techniques is necessary [71-73]. Surprisingly, even though the kits isolated asignificantly greater total number of particles than UC, this did not appear to affect the amountof extracted exRNA. The commercial kits yielded similar amount of exRNA for the majority ofthe serum starting volumes with UC. The expression levels of miR-16 and miR-451, measuredusing ddPCR, indicate that each isolation technique may produce a slightly different profile ofexosome RNA. Generally, the miRNA concentrations, varied greatly within and among thedifferent techniques and serum volumes. This miRNA yield variability has been previouslyreported by other groups [51, 55]. This emphasizes the necessity of using a consistent exosomeisolation technique across different samples within the same study. While Rvalues supportthe existence of an overall linear correlation between miRNA concentration and serum start-ing volume, a lower serum starting volume did not guarentee a lower miRNA concentration inour data. This disproportionate relationship that we observed between the concentration ofparticles and the concentration of miRNAs is probably due to the heterogeneity ofexRNA dis-tributions across the exosome populations and the potential contamination of non-exosomeparticles including high-density lipoproteins and RNA binding proteins (argonautes l and 2)aggregates [54,74-76]. Despite all the positive factors of our study, weare aware of some limitations in our design.First, this study does not intend to cover all available exosome isolation reagents from the dif-ferent providers; nonetheless, we selected three of the most commonly used kits in the field[77]. Second, this comparison used only human serum samples, thus it is necessary to performsimilar studies using other body fluids, such as urine, aqueous humor, cerebrospinal fluid, andamniotic fluid. Third, we acknowledge that though the biological activity ofextracted exo-somes is of prime importance in verifying its clinical relevance, examining this activity inour extracted particles was beyond the scope of this study. Such an analysis, though, may befurther explored in future studies. Fourth, we cannot exclude the possibility of lipoproteincontamination of our isolated particles as previously shown by Deregibus et al. [66] and Sodarand colleagues [78]. In this aspect, we strongly agree with the recent publication by Deregibuset al. that this contamination though represent a limitation for almost all precipitation-basedexosome isolation techniques, should not be an obstacle against using these techniques for bio-marker purposes. The intent of our study as well as others is not to discriminate RNA associ-ated with lipoproteins from those associated with vesicles, but to identify the population ofsmall RNA that can be used as a reliable biomarker. However, to counteract this limitation,which is inevitable with most isolation techniques, we recommend using consistent and re-peated exosome isolation techniques within a given group of investigated biological samples inorder to guarantee valid comparability. On the other hand, if obtaining a highly pure exosomepopulation on the expense of the yield of exosomes is acceptable, restoring to methods basedon pull-down techniques such as Exocarp is recommended [79-81]. Nonetheless, this optionis not always attainable especially with limited biological samples. In summary, our comprehensive study has supported the use of the commercial kits miR-CURY, ExoQuick, and TEIR as an adequate alternative to UC, even with limited amounts of heterogeneous biological starting material. Having multiple, less tedious alternatives to isolateexosomes will promote more exosome-related studies, helping better understanding of thefunctions of exosomes and possibly identifying new biomarkers and drug delivery systems.Our study will help researchers in selecting the best isolation technique for their purposesbased on the amount of biological sample available and the necessary downstream analyses. Acknowledgments The authors would like to thank the Integrated Genomics Core at the Cancer Center ofAugusta University for RNA evaluation. We acknowledge the support from Dr. Wendy Bollagand her laboratory at Augusta University for the use of the Infrared Odyssey imaging system.The authors would also acknowledge the great support for the ZetaView instrument from theOffice of the Senior Vice President for Research, Augusta University Cancer Center, Depart-ment of Neuroscience and Regenerative Medicine, and the Vascular Biology Center (VBC) atAugusta University. Author Contributions Conceptualization:YL MWH. Formal analysis: IH JC MDD MS AZ. Investigation: IH JC MDD AZ MBD MLK WMD. Methodology:YL MWH. Project administration: YL MWH WDS. Resources: YLWDS EB MWH. Supervision: YL MWH WDS. Validation: IH JC MDD AZ MBD MLK WMD. Visualization: IH MDD JC AZ. Writing- original draft: IH MDD. Writing-review & editing: IH MDD JC MS MLK AZ MBD WMD EB WDS MWH YL. References 1. Admyre C, Johansson SM, Qazi KR, Filen JJ, Lahesmaa R, Norman M, et al. Exosomes with immunemodulatory features are present in human breast milk. Journal of immunology.2007;179(3):1969-78. 2. Alegre E, Sanmamed MF,Rodriguez C, Carranza O,Martin-Algarra S, Gonzalez A. Study of circulatingmicroRNA-125b levels in serum exosomes in advanced melanoma. Archives of pathology & laboratorymedicine. 2014; 138(6):828-32. 3. Conde-Vancells J, Rodriguez-Suarez E, EmbadeN, Gil D, Matthiesen R, Valle M, et al. Characteriza-tion and Comprehensive Proteome Profiling of Exosomes Secreted by Hepatocytes.J Proteome Res.2008;7(12):5157-66.PMID: 19367702 4. Hegmans JPJJ, Bard MPL, Hemmes A, Luider TM, Kleijmeer MJ, Prins J-B, et al. Proteomic Analysis ofExosomes Secreted by Human Mesothelioma Cells. Am J Pathol. 2004;164(5):1807-15.doi: 10.1016/S0002-9440(10)63739-XPMID: 15111327 5. Nilsson J, Skog J, Nordstrand A, BaranovV, Mincheva-Nilsson L, Breakefield XO, et al. Prostate can-cer-derived urine exosomes: a novel approach to biomarkers for prostate cancer. British journal of can-cer.2009; 100(10):1603-7. PubMed Central PMCID: PMC2696767.doi: 10.1038/sj.bjc.6605058PMID: 19401683 ( 6. Rabinowits G,Gercel-Taylor C, Day JM, Taylor DD, K loecker GH. E xosomal microRNA: a diagnosticmarker for lung cancer. Clinical lung cancer. 2009; 10(1):42-6. doi: 10 . 381 6 / C LC.2 0 09 . n . 0 0 6 PM I D : 192893 71 ) ( 7. Zhang W, Zhou X, Zhang H, Yao Q, Liu Y, Dong Z. Extracellular Vesicles in Diagnosis and Therapy ofKidney Diseases. Am J Physiol Renal Physiol. 2016:ajprenal 00429 2016. ) ( 8. Thery C, Amigorena S, Raposo G, Clayton A. Isolation and characterization of exosomes from cell cul-ture supernatants and biological fluids. Current protocols in cell biology / editorial board, Juan S Bonifa-cino [et al]. 2006;Chapter 3:Unit 3 22. ) ( 9. Mathivanan S, Ji H, Simpson RJ. Exosomes: extracellular organelles important in intercellular commu-nication . Journal o f proteomics. 2010;73(10):1907-20. doi: 10 . 101 6 / j . j prot.20 1 0.06.006 PMID: 2060 1 276 ) ( 10. van der Pol E, B oing AN, Harrison P, Sturk A, Ni e uwland R. Classification, functions, and clinical rele-vance of extracellular vesicles.Pharmacological reviews. 2012;64(3):676-705. doi: 10.1 1 2 4 / p r .1 1 2 . 005983 PMID: 22722893 ) 11..Camussi G, Deregibus MC, Bruno S, Grange C, Fonsato V, Tetta C. Exosome/microvesicle-mediatedepigenetic reprogramming of cells.American journal of cancer research. 2011;1(1):98-110. PubMedCentral PMCID: PMC3180104.PMID:21969178 ( 12. Rak J, Guha A. Extracellular vesicles-vehicles that spread cancer genes. BioEssays: news andreviews in molecular, cellular and developmental biology.2012;34(6):489-97. ) 13. Dinkins MB, Enasko J, Hernandez C, Wang G, Kong J, Helwa l, et al. Neutral Sphingomyelinase-2 Defi-ciency Ameliorates Alzheimer’s Disease Pathology and Improves Cognition in the 5XFAD Mouse. JNeurosci. 2016;36(33):8653-67. doi: 10.1523/JNEUROSCI.1429-16.2016 PMID: 27535912 14. Ibrahim A, Marban E. Exosomes: Fundamental Biology and Roles in Cardiovascular Physiology. AnnuRev Physiol. 2015. 15. Vader P, Breakefield XO, Wood MJ. Extracellular vesicles: emerging targets for cancer therapy. Trendsin molecular medicine. 2014;20(7):385-93. PubMed Central PMCID: PMC4082760. doi: 10.1016/j.molmed.2014.03.002 PMID: 24703619 16. Lawson C, Vicencio JM, Yellon DM, Davidson SM. Microvesicles and exosomes: new players in meta-bolic and cardiovascular disease. The Journal of endocrinology.2016;228(2):R57-71.doi: 10.1530/JOE-15-0201 PMID:26743452 17. Yanez-MoM, Siljander PR, Andreu Z, Zavec AB, Borras FE, Buzas El, et al. Biological properties ofextracellular vesicles and their physiological functions.J Extracell Vesicles. 2015;4:27066.PubMedCentral PMCID: PMCPMC4433489.doi: 10.3402/jev.v4.27066 PMID: 25979354 18. Emanueli C, Shearn Al, Angelini GD, Sahoo S. Exosomes and exosomal miRNAs in cardiovascular pro-tection and repair. Vascular pharmacology.2015; 71:24-30. PubMed Central PMCID: PMC4838026.doi: 10.1016/j.vph.2015.02.008 PMID: 25869502 19. An T, Qin S, Xu Y, Tang Y, Huang Y, Situ B, et al. Exosomes serve as tumour markers for personalizeddiagnostics owing to their important role in cancer metastasis. J Extracell Vesicles.2015;4:27522.PubMed Central PMCID: PMC4475684. doi: 10.3402/jev.v4.27522 PMID: 26095380 20. Ailawadi S,Wang X, Gu H, Fan GC. Pathologic function and therapeutic potential of exosomes in car-diovascular disease. Biochimica et biophysica acta. 2015; 1852(1):1-11.PubMed Central PMCID:PMC4268281. doi: 10.1016/j.bbadis.2014.10.008 PMID:25463630 21. Zhao L, Liu W,Xiao J, Cao B. The role of exosomes and "exosomal shuttle microRNA" in tumorigenesisand drug resistance. Cancer letters. 2015;356(2 PtB):339-46. 22. Lotvall J, Hill AF, Hochberg F, Buzas El, Di Vizio D, Gardiner C, et al. Minimal experimental require-ments for definition of extracellular vesicles and their functions: a position statement from the Interna-tional Society for Extracellular Vesicles.J Extracell Vesicles. 2014;3:26913.PubMed Central PMCID:PMC4275645. doi: 10.3402/jev.v3.26913 PMID: 25536934 23. Szatanek R, Baran J, Siedlar M, Baj-Krzyworzeka M. Isolation of extracellular vesicles: Determining thecorrect approach (Review). International journal of molecular medicine. 2015;36(1):11-7.PubMedCentral PMCID: PMC4494580. doi: 10.3892/ijmm.2015.2194 PMID: 25902369 24. Jeppesen DK, Hvam ML, Primdahl-Bengtson B, Boysen AT, Whitehead B, Dyrskjot L, et al. Compara-tive analysis of discrete exosome fractions obtained by differential centrifugation. J Extracell Vesicles.2014; 3:25011. PubMed Central PMCID: PMC4224706. doi: 10.3402/jev.v3.25011 PMID: 25396408 25. Sohel MMH, Hoelker M, Noferesti SS, Salilew-Wondim D, Tholen E,Looft C, et al. Exosomal and Non-Exosomal Transport of Extra-Cellular microRNAs in Follicular Fluid: Implications for Bovine OocyteDevelopmental Competence. Plos One. 2013;8(11). 26. Hartman ZC, Wei J, Glass OK, Guo H, Lei G, Yang XY, et al. Increasing vaccine potency through exo-some antigen targeting. Vaccine.2011;29(50):9361-7.PubMed Central PMCID: PMC3350974.doi:10.1016/j.vaccine.2011.09.133 PMID: 22001882 ( 27. da Silveira JC,Veeramachaneni DN , Winger QA, Carnevale EM, Bouma GJ. Cell-secreted vesicles in equine ovarian follicular fluid contain miRNAs and proteins : a possiblenew form of cell communication within the ovarian follicle. Biology of reproduction. 2012;86(3):71. doi: 1 0.1 09 5/bi o lrepro d . 11 1. 0 9 325 2 PMID: 22 1 16803 ) ( 28. Franzen CA, Blackwell RH, Foreman KE, Kuo PC, Flanigan RC, Gupta GN. Urinary Exosomes: T hePotential for Biomarker Utility, Intercellular Signaling and Therapeutics in Urological M alignancy. Th e Journal of urology.2016;195(5):1331-9. doi: 1 0 .1 016 / j . j uro . 20 15.0 8 . 11 5 PMID: 2671 4 199 ) ( 29. Hoshino A, Costa-Silva B, Shen TL, Rodrigues G, Hashimoto A, Tesic Mark M, et al. Tumour exosomeintegrins determine organotropic metastasis. Nature. 201 5 ;527(7578):329-35. P ubMed Central PMCID:PMC4788391. doi: 1 0 .103 8 /natu r e 1 5 7 56 PMID: 26524530 ) ( 30. Filipe V, Hawe A, Jiskoot W. Critical evaluation of Nanoparticle Tracking Analysis (NTA) by NanoSightfor the measurement of nanoparticles and protein aggregates.Pharmaceutical research. 2010;27(5):796-810.PubMed Central PMCID:PMC2852530.doi: 10. 1 0 0 7 / s 1 1 09 5 -01 0 -00 7 3-2 P M ID: 2020447 1 ) ( 31. Mehdiani A, Maier A, Pinto A, Barth M, Akhyari P, Lichtenberg A. An innovative method for exosomequantification and size measurement. Journal of visualized experiments: JoVE. 2015;(95):50974. PubMed Central PMCID: PMC4354536.doi: 1 0 . 3 7 9 1 /5097 4 PMID :25650897 ) 32. Wang Y, ZhangL, Li Y, Chen L,Wang X, Guo W, et al. Exosomes/microvesicles from induced pluripo-tent stem cells deliver cardioprotective miRNAs and prevent cardiomyocyte apoptosis in the ischemicmyocardium. International journal of cardiology. 2015;192:61-9.PubMed Central PMCID:PMC4469495. doi: 10.1016/j.jjcard.2015.05.020 PMID: 26000464 33. Gallego-Urrea JA, Tuoriniemi J, Hassellov M. Applications of particle-tracking analysis to the determina-tion of size distributions and concentrations of nanoparticles in environmental,biological and food sam-ples. Trends Analyt Chem. 2011;30(3):473-83. 34. Seader JD, Henley E. J. & Roper D. K. Separation process principles (Chemical and biochemical opera-tions). 3ed: John Wiley and Sons; 2011. 35. Sokolova V, Ludwig AK, Hornung S, Rotan O, Horn PA, Epple M, et al. Characterisation of exosomesderived from human cells by nanoparticle tracking analysis and scanning electron microscopy. Colloidsand surfaces B, Biointerfaces.2011;87(1):146-50. doi: 10.1016/j.colsurfb.2011.05.013 PMID:21640565 36. Hanaor D, Michelazzi M, Leonelli C, Sorrell CC. The effects of carboxylic acids on the aqueous disper-sion and electrophoretic deposition of ZrO2. J Eur Ceram Soc. 2012;32(1):235-44. 37. Alvarez ML, Khosroheidari M, Kanchi Ravi R, DiStefano JK. Comparison of protein, microRNA,andmRNA yields using different methods of urinary exosome isolation for the discovery of kidney diseasebiomarkers.Kidney international. 2012;82(9):1024-32. doi: 10.1038/ki.2012.256 PMID: 22785172 38. Lane RE, Korbie D, Anderson W, Vaidyanathan R, Trau M. Analysis of exosome purification methodsusing a model liposome system and tunable-resistive pulse sensing. Scientific reports. 2015;5:7639.PubMed Central PMCID: PMC4648344.doi: 10.1038/srep07639 PMID: 25559219 39. Rekker K, Saare M, Roost AM, Kubo AL, Zarovni N, Chiesi A, et al. Comparison of serum exosome iso-lation methods for microRNA profiling. Clinical biochemistry. 2014; 47(1-2):135-8. doi: 10.1016/j.clinbiochem.2013.10.020 PMID:24183884 ( 40. Webber J, C l ayton A. H o w pure are your vesicles? J Extracell Vesicles. 2013;2. PubMed Central PMCID: PMC3760653. ) 41. Andreu Z, Rivas E, Sanguino-Pascual A, Lamana A, Marazuela M, Gonzalez-Alvaro l, et al. Compara-tive analysis of EV isolation procedures for miRNAs detection in serum samples. J Extracell Vesicles.2016;5:31655. PubMed Central PMCID:PMC4916259.doi: 10.3402/jev.v5.31655 PMID: 27330048 ( 42. Crossland R E , Norden J, Bibby LA, Davis J, Di c kinson AM. Evaluation of optimal extracellular vesiclesmall RNA isolation and qRT-PCR normalisation for serum and urine. Journal of immunological meth- ods. 2016;429:39-49.doi: 1 0. 10 1 6 / j . j im.2 01 5. 1 2 .01 1 PMID: 26723490 ) ( 43. Kalra H, Adda CG, Liem M, Ang CS, Mechler A, Simpson RJ, et al. Comparative proteomics evaluationof plasma exosome isolation techniques and assessment of the stability of exosomes in normal humanblood plasma. Proteomics. 2013; 13(22):3354-64. doi: 10.1002/pm ic . 2 01 30 0282 PM ID: 24 1 154 4 7 ) ( 44. T auro BJ, Greening DW, Mathias RA, Ji H, Mathivanan S, Scot t AM, et al. Comparison of ultracentrifu-gation, density gradient separation, and immunoaffinity capture methods for isolating human colon can-cer cell line LIM1863-derived exosomes. M ethods.2012;56(2):293-304.doi: 10.1 016 / j . y me t h .2 012 .01 . 00 2 PMID: 22285593 ) ( 45. Baranyai T, Herczeg K, Onodi Z, Voszka l, Modos K, Marton N, et al. Isolation of Exosomes from BloodPlasma: Qualitative and Quantitative Comparison of Ultracentrifugation and Size Exclusion Chromatog-raphy Methods. P los One. 2015;10(12). ) ( 46. Lobb RJ, Becker M, Wen SW, Wong CS, Wiegmans AP, Leimgruber A, et al. Optimized exosome isola- tion protocol for cel l culture supernatant and human plasma.J Extracell Vesicles. 2015; 4:27031. PubMed Central PMCID: PMC4507751. doi: 10 .3402/jev.v4.270 3 1 PMID : 261 9 4179 ) ( 47. Kowal J, Arras G, Colombo M, Jouve M, Morath JP, Primdal-Bengtson B, et al. Proteomic comparisondefines novel markers to characterize heterogeneous populations of extracellular vesicle subtypes. Pro-ceedings of the National Academy of Sciences of the United States of America. 2016;113(8):E968-77.PubMed Central PMCID: PMC4776515. doi: 1 0 . 1 07 3/ pna s. 15 2 12 30 1 13 PMID: 26858453 ) ( 48. Shalaby SM, K h ater M K , Perucho AM, Mohamed SA, Helwa l,Laknaur A, et al. Magnetic nanoparticlesas a new approach to improve the efficacy of gene therapy against differentiated human uterine fibroidcells and tumor-initiating stem cells. Fertility and sterility.2016;105(6):1638-48 e8.PubMed Central PMCID:PMC4971775.doi: 10.1 0 1 6 / j. f e rtn st e r t.201 6 .03.001 PMID:27 020169 ) 49. Dismuke WM, Challa P, Navarro l, Stamer WD, Liu Y. Human aqueous humor exosomes.Experimentaleye research.2015;132:73-7. PubMed Central PMCID:PMC4352394. doi: 10.1016/j.exer.2015.01.019 PMID: 25619138 50. Liu Y, Bailey JC, Helwa l,Dismuke WM, Cai J, Drewry M, et al. A Common Variant in MIR182 Is Associ-ated With Primary Open-Angle Glaucoma in the NEIGHBORHOOD Consortium. Invest Ophthalmol VisSci.2016;57(10):3974-81. 51. El-Khoury V, Pierson S, Kaoma T, Bernardin F, Berchem G. Assessing cellular and circulating miRNArecovery: the impact of the RNA isolation method and the quantity of input material. Scientific reports.2016;6:19529. PubMed Central PMCID: PMC4726450.doi: 10.1038/srep19529 PMID: 26787294 52. Lasser C, Eldh M, Lotvall J. Isolation and characterization of RNA-containing exosomes. Journal ofvisualized experiments: JoVE. 2012;(59):e3037.Epub 2012/01/20. PubMed Central PMCID:PMC3369768.doi: 10.3791/3037 PMID:22257828 53. Cai J, Perkumas KM, Qin X, Hauser MA, Stamer WD, Liu Y. Expression Profiling of Human Schlemm’sCanal Endothelial Cells From Eyes With and Without Glaucoma. Invest Ophthalmol Vis Sci. 2015;56(11):6747-53. PubMed Central PMCID: PMC4614909. doi: 10.1167/iovs.15-17720 PMID: 26567786 54. Chevillet JR,Kang Q,Ruf IK, Briggs HA, Vojtech LN, Hughes SM, et al. Quantitative and stoichiometricanalysis of the microRNA content of exosomes. Proc Natl Acad Sci USA. 2014;111(41):14888-93. doi:10.1073/pnas.1408301111 PMID:25267620 55. Li M, RaiAJ, DeCastro GJ, Zeringer E, Barta T, Magdaleno S, et al. An optimized procedure for exo-some isolation and analysis using serum samples: Application to cancer biomarker discovery. Methods.2015;87:26-30. doi:10.1016/j.ymeth.2015.03.009 PMID: 25814440 ( 56. Ruxton GD. The unequal variance t-test is an underused alternative to Student’s t-test and the Mann- Whitney U test. Behavioral Ecology. 2006; 17(4):688-90. ) ( 57. Akers JC, Ramakrishnan V, Nolan JP, Duggan E, Fu CC, Hoc h berg FH, et al. Comparative Analysis of T echnologies for Quantifying Extracellular Vesicles (EVs) in Clinical Cerebrospinal Fluids (CSF). P LoSOne. 2016;11(2):e0149866. PubMed Central PMCID: PMC4763994. doi: 10.1 37 1 /jour n a l .p o n e. 01 4 9866 PMID: 2690 1 428 ) ( 58. Van Deun J, Mestdagh P, Sormunen R, Cocquyt V, Vermaelen K, Vandesompele J, et al. The impact of disparate isolation methods for extracellular vesicles on downstream RNA profiling. J Extracell Vesicles. 2014;3.PubMed Central PMCID: PMC4169610. ) ( 59. EL Andaloussi S, M ager l, Breakefield XO, Wood MJ. Extracellular vesicles: biology and emerging ther-apeutic opportunities. Nature reviews Drug discovery. 2013; 12(5):347-57. doi: 1 0 .1 038 / nr d 3978 PMID: 2 3 584393 ) ( 60. Properzi F,Logozzi M, Fais S. Exosomes: the future of biomarkers in medicine. Biomarkers in medicine.2013;7(5):769-78. doi: 1 0.2217/b m m. 1 3. 6 3 PMID: 2 4044 5 69 ) ( 61. Zarovni N, C orrado A, Guazzi P, Z occo D, Lari E, Radano G, et al. Integrated isolation and quantitative analysis of exosome shuttled proteins and nucleic acids using immunocapture approaches. Methods.2015;87:46-58. doi: 1 0.10 1 6/ j.y me t h.2015.05 . 028 PMID: 260 4 4649 ) 62. Rider MA, Hurwitz SN, Meckes DG Jr. ExtraPEG: A Polyethylene Glycol-Based Method for Enrichmentof Extracellular Vesicles. Scientific reports. 2016;6:23978. PubMed Central PMCID: PMC4828635. doi:10.1038/srep23978 PMID: 27068479 ( 63. Rood IM, D eegens JK, Merchant ML, Tamboer WP, Wilkey DW, Wetzels JF, et al. Comparison of threemethods for isolation of urinary microvesicles to identify biomarkers of nephrotic syndrome. Kidney i nternational. 2010 ; 78(8):810 - 6. doi : 10 . 103 8 /k i. 2 0 10.262 PMID: 20 68 6 450 ) ( 64. Linares R, Tan S, Gounou C, Arraud N, Br i sson AR. High-speed centrifugation induces aggregation of extracellular vesicles. J Extracell Vesicles. 2015;4:29509.PubMed Central PMCID:PMCPMC4689953. doi: 1 0 . 3402/ j ev.v4.29 5 09 PMID: 26 7 00615 ) ( 65. Caradec J, Kharmate G, Hosseini-Beheshti E, Adomat H, Gleave M, Guns E. R e producibility and effi-ciency of serum-derived exosome extraction methods. Clinical biochemistry.2014;47(13-14):1286- 92. doi: 10.1016/ j .clinb i oche m .20 1 4 .0 6 .01 1 PMID: 2 4 956264 ) ( 66. Deregibus MC, Figliolini F , D'Antico S , Manzini PM, Pasquino C, De Lena M, et al. Charge-based pre-cipitation of extracellular vesicles. International journal of molecular medicine. 2016;38(5):1359-66.doi: 10.3892 / ijm m .20 1 6.27 5 9 PMID: 28025 9 88 ) ( 67. Lorincz AM, Timar CI, Marosvari KA, Veres DS, Otrokocsi L, Kittel A, et al. Effect of storage on physicaland functional properties of extracellular vesicles derived from neutrophilic granulocytes. J Extracell Vesicles. 2014;3:25465. PubMed Central PMCID: PMC4275651.doi: 10. 3402/j ev .v3. 2 5 465 P M ID: 25536933 ) 68. Schageman J, Zeringer E, Li M, Barta T, Lea K, Gu J, et al. The complete exosome workflow solution:from isolation to characterization of RNA cargo. BioMed research international. 2013;2013:253957.PubMed Central PMCID: PMC3800616. doi: 10.1155/2013/253957 PMID: 24205503 69. Lee M, Ban J-J, Im W, Kim M. Influence of storage condition on exosome recovery. Biotechnology andBioprocess Engineering.2016;21(2):299-304. 70..ZZhou H, Yuen PS, Pisitkun T, Gonzales PA, Yasuda H, Dear JW, et al. Collection, storage,preserva-tion, and normalization of human urinary exosomes for biomarker discovery. Kidney international. 2006;69(8):1471-6. PubMed Central PMCID: PMC2276656. doi: 10.1038/sj.ki.5000273 PMID: 16501490 71. Valadi H, Ekstrom K, Bossios A, Sjostrand M, Lee JJ, Lotvall JO. Exosome-mediated transfer ofmRNAs and microRNAs is a novel mechanism of genetic exchange between cells. Nature cell biology.2007;9(6):654-9. doi: 10.1038/ncb1596 PMID:17486113 72. Zhang J, Li S, Li L, Li M, Guo C, Yao J, et al. Exosome and exosomal microRNA: trafficking, sorting,and function. Genomics, proteomics & bioinformatics. 2015;13(1):17-24. PubMed Central PMCID:PMC4411500. 73. Alvarez-Garcia l, Miska EA. MicroRNA functions in animal development and human disease. Develop-ment. 2005;132(21):4653-62. doi: 10.1242/dev.02073 PMID: 16224045 74. Mikaelianl, Scicchitano M, Mendes O, Thomas RA, Leroy BE. Frontiers in preclinical safety biomark-ers: microRNAs and messenger RNAs.Toxicologic pathology. 2013;41(1):18-31.Epub2012/06/05.doi: 10.1177/0192623312448939 PMID:22659243 75. Vickers KC, Palmisano BT, Shoucri BM, Shamburek RD, Remaley AT. MicroRNAs are transported inplasma and delivered to recipient cells by high-density lipoproteins. Nature cell biology. 2011;13(4):423-33. Epub 2011/03/23.PubMed Central PMCID: PMCPmc3074610.doi: 10.1038/ncb2210PMID:21423178 76. Tabet F, Vickers KC, Cuesta Torres LF, Wiese CB, Shoucri BM, Lambert G, et al. HDL-transferredmicroRNA-223 regulates ICAM-1 expression in endothelial cells. Nature communications.2014;5:3292. Epub 2014/03/01. PubMed Central PMCID: PMCPmc4189962. doi: 10.1038/ncomms4292PMID:24576947 77. Peterson MF, Otoc N, Sethi JK, Gupta A, Antes TJ. Integrated systems for exosome investigation.Methods. 2015;87:31-45. doi: 10.1016/j.ymeth.2015.04.015 PMID: 25916618 78. Sodar BW,Kittel A, Paloczi K, Vukman KV, Osteikoetxea X, Szabo-Taylor K, et al. Low-density lipopro-tein mimics blood plasma-derived exosomes and microvesicles during isolation and detection. Scientificreports.2016;6:24306-16.Epub 2016/04/19. PubMed Central PMCID: PMCPmc4834552. 79. Patel RS, Carter G, El Bassit G, Patel AA, Cooper DR, Murr M, et al. Adipose-derived stem cells fromlean and obese humans show depot specific differences in their stem cell markers, exosome contentsand senescence: role of protein kinase C delta (PKCdelta) in adipose stem cell niche. Stem cell investi-gation. 2016;3:2. Epub 2016/07/01. PubMed Central PMCID: PMCPmc4923648. doi: 10.3978/j.issn.2306-9759.2016.01.02 PMID: 27358894 ( 80. Laurent LC, Abdel-Mageed AB, Adelson PD, Arango J, Balaj L, Br e akefield X, et al. Mee t ing report: dis-cussions and preliminary findings on extracellular RNA measurement methods from laboratories in the NIH Extracellula r RNA Communication Consortium. J Extracell Vesicles. 2015;4:26533. Epub 2015/09/01.PubMed Central PMCID: PMCPmc4553263.doi: 10 . 3 4 0 2/ j e v. v4 .26533 PMID:2 6320937 ) 81. Ueda K, Ishikawa N, Tatsuguchi A, Saichi N, Fujii R, Nakagawa H. Antibody-coupled monolithic silicamicrotips for highthroughput molecular profiling of circulating exosomes. Scientific reports. 2014;4:6232. Epub2014/08/30. PubMed Central PMCID:PMCPmc4148700.doi: 10.1038/srep06232 PMID:25167841 PLOS ONE|DOI:journal.pone. January 近期,我们看到很多论坛和研究者在讨论外泌体的提取问题,大昌华嘉公司为大家推荐这篇关于几种分离血清外泌体的方法比较文章,希望能帮助大家提取更好质量的外泌体,同时也能在大昌华嘉公司提供的ZetaView纳米颗粒跟踪分析仪(NTA)上更好的分析外泌体。
确定
还剩20页未读,是否继续阅读?

产品配置单

大昌华嘉科学仪器为您提供《血清中外泌体检测方案(Zeta电位仪)》,该方案主要用于全血/血清/血浆中生化检验检测,参考标准--,《血清中外泌体检测方案(Zeta电位仪)》用到的仪器有Microtrac纳米粒度及Zeta电位分析仪
推荐专场
相关方案
更多
该厂商其他方案
更多