


方案详情
文
全氟及多氟类化合物PFASs从上世纪50 年代开始使用,是一类人为制造的化学品,常作为表面活性剂被用于润滑剂、涂料、洗护用品、纺织品、农药、防火材料等方面。在全球范围内,PFASs 污染非常普遍,据研究报道,在环境介质( 水、土和气)、人体样本、食物和水生生物中均有检出。毒理学研究表明,PFASs 可能导致肝毒性、致癌性、免疫毒性、生殖毒性以及内分泌干扰毒性等,故对全氟化合物的检测显得尤为重要。本方法采用了在线固相萃取-液相色谱/串联质谱(SPE-LC/MS-MS)联用系统对人血清的全氟化合物进行分析。采用在线SPE方法,离心后的400微升血清样品中的目标化合物被浓缩在C18 HD小柱上。然后用流动相(20mM醋酸铵 / 乙腈)在0.6 mL/min的流速下用梯度方式将目标化合物洗脱下来。采用C8反相分析柱在12分钟内实现色谱分离。为了准确定性并进行确证,配合使用MS/MS技术对每个组分采集两种多反应监测(MRM)跃迁数据。对于人血清中的大多数全氟化合物,方法检测限 (LOD)为0.1 ng / mL。这种新开发的方法具有较高的灵敏度和准确性,只需进行最少的样品预处理,并且运用了全自动在线SPE技术,分析通量较高,适用于检测人血清中的全氟化合物。
方案详情

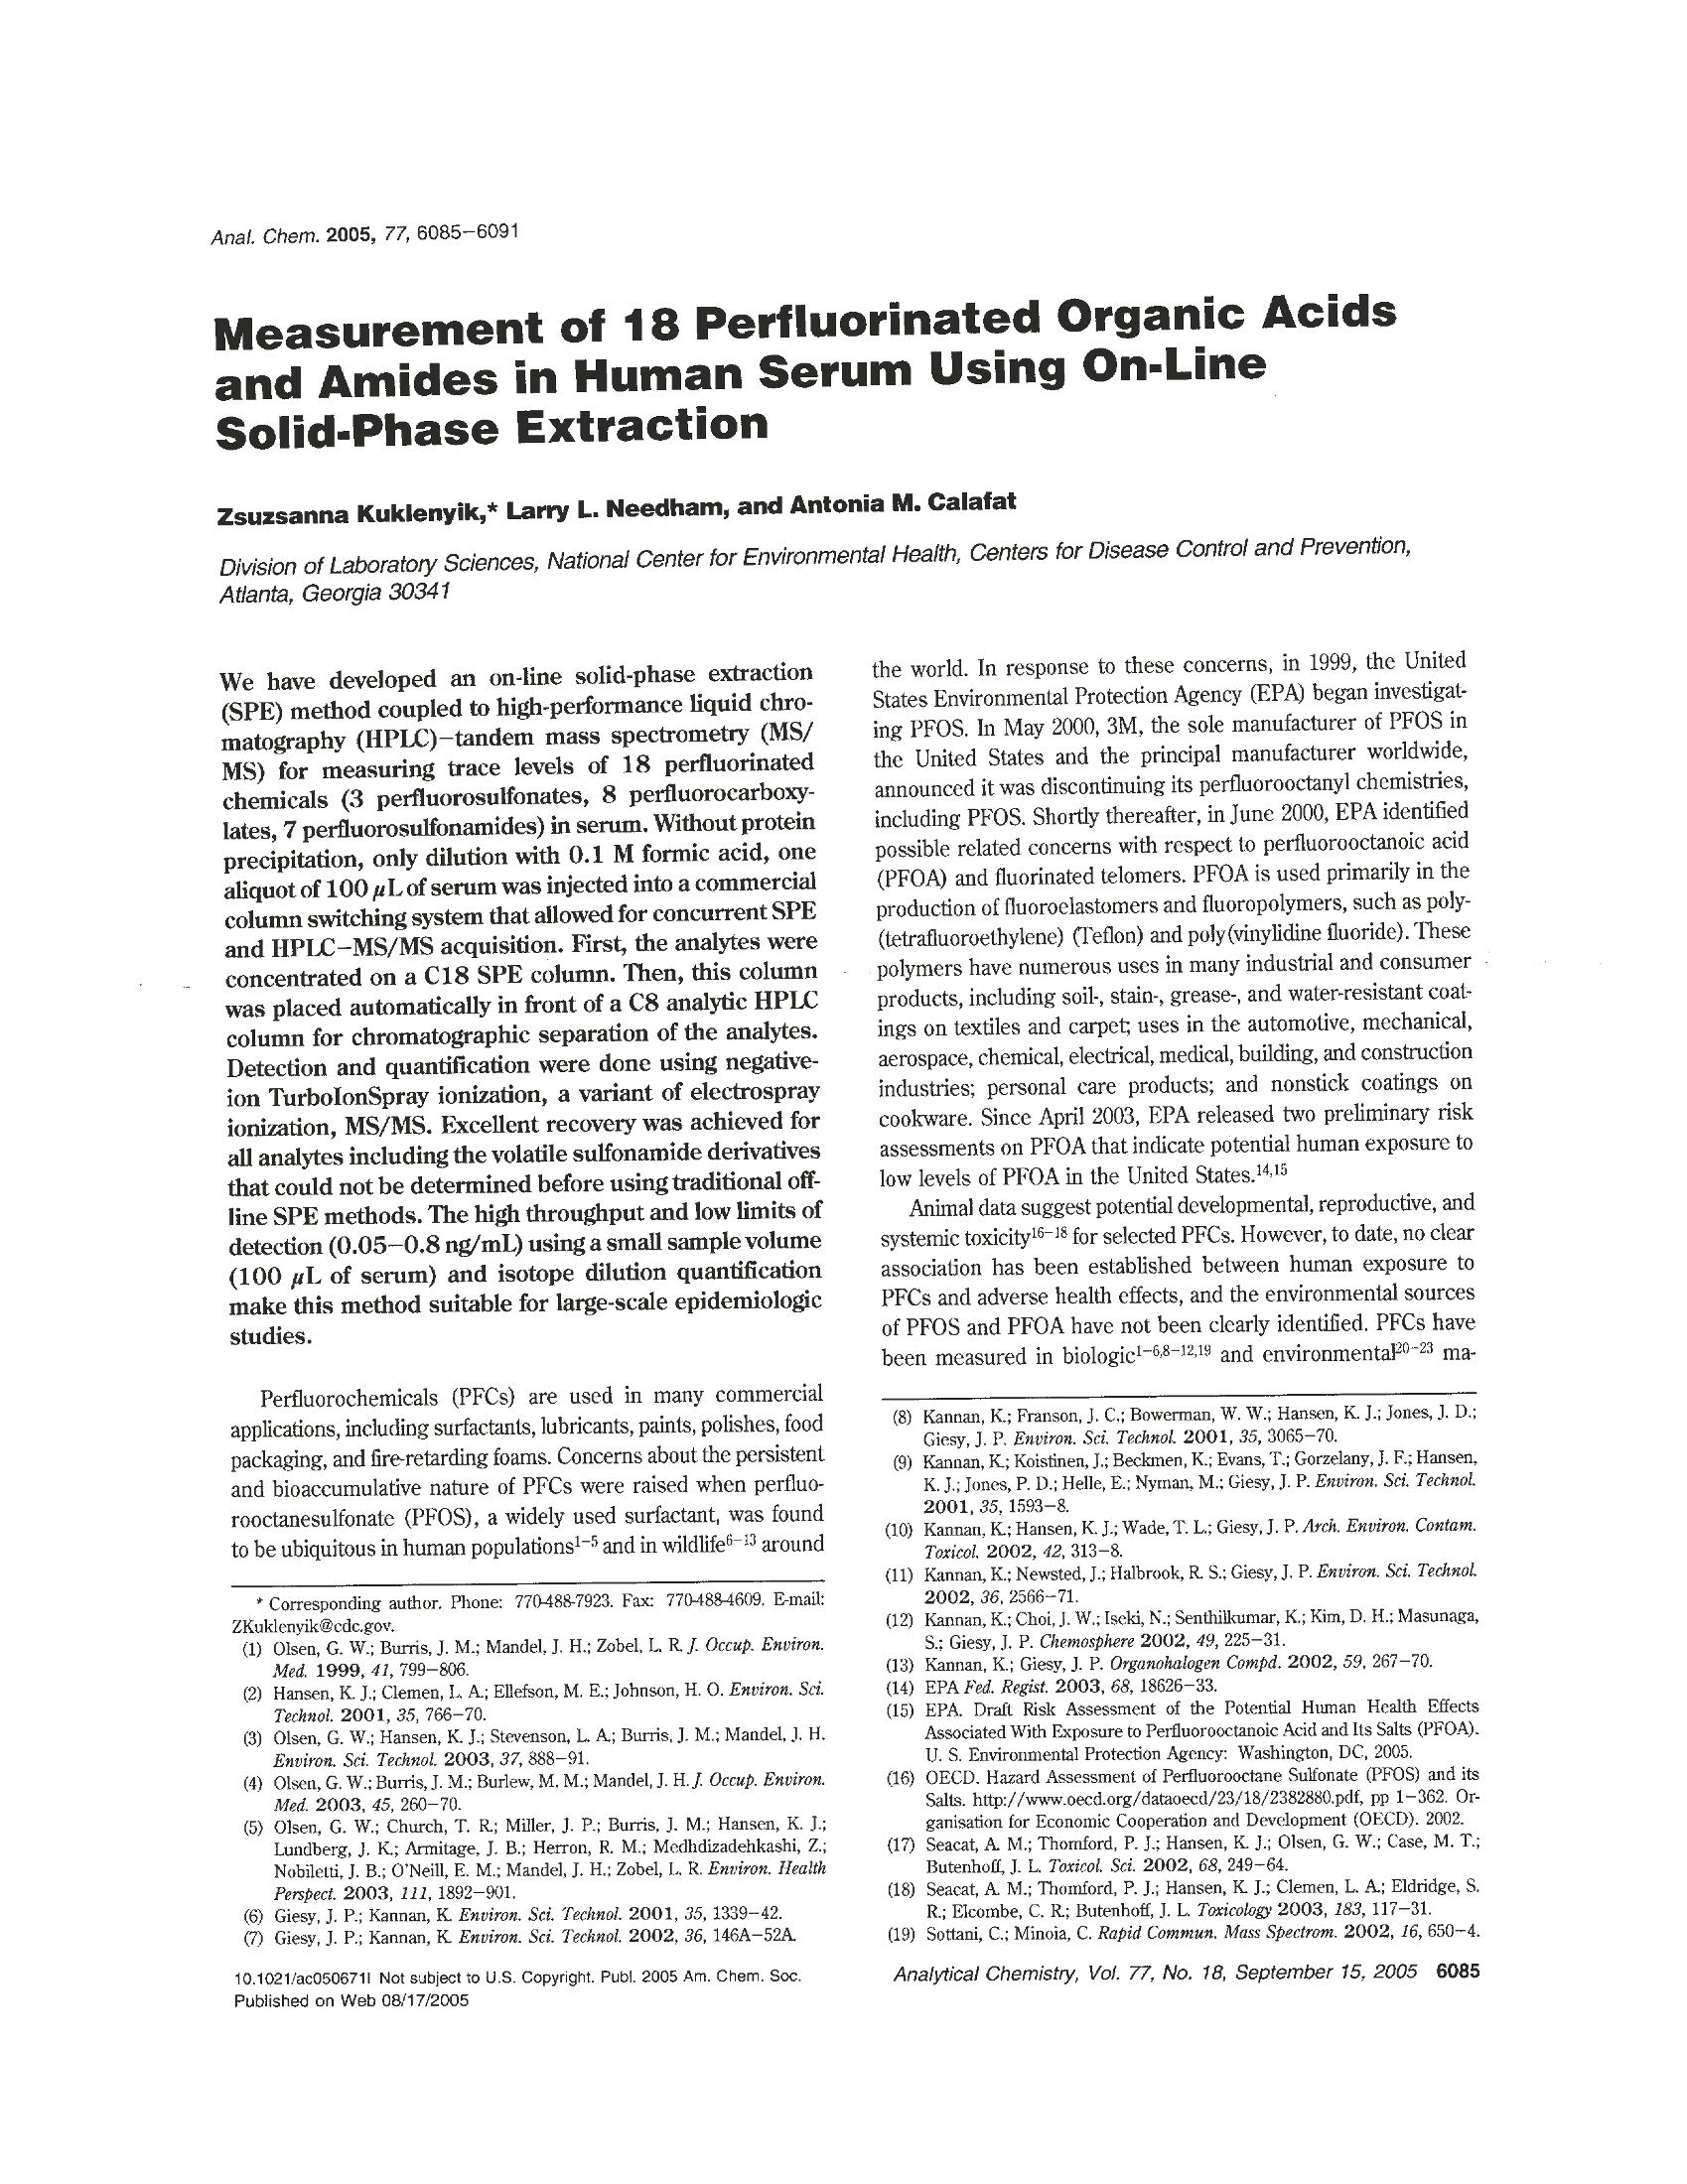
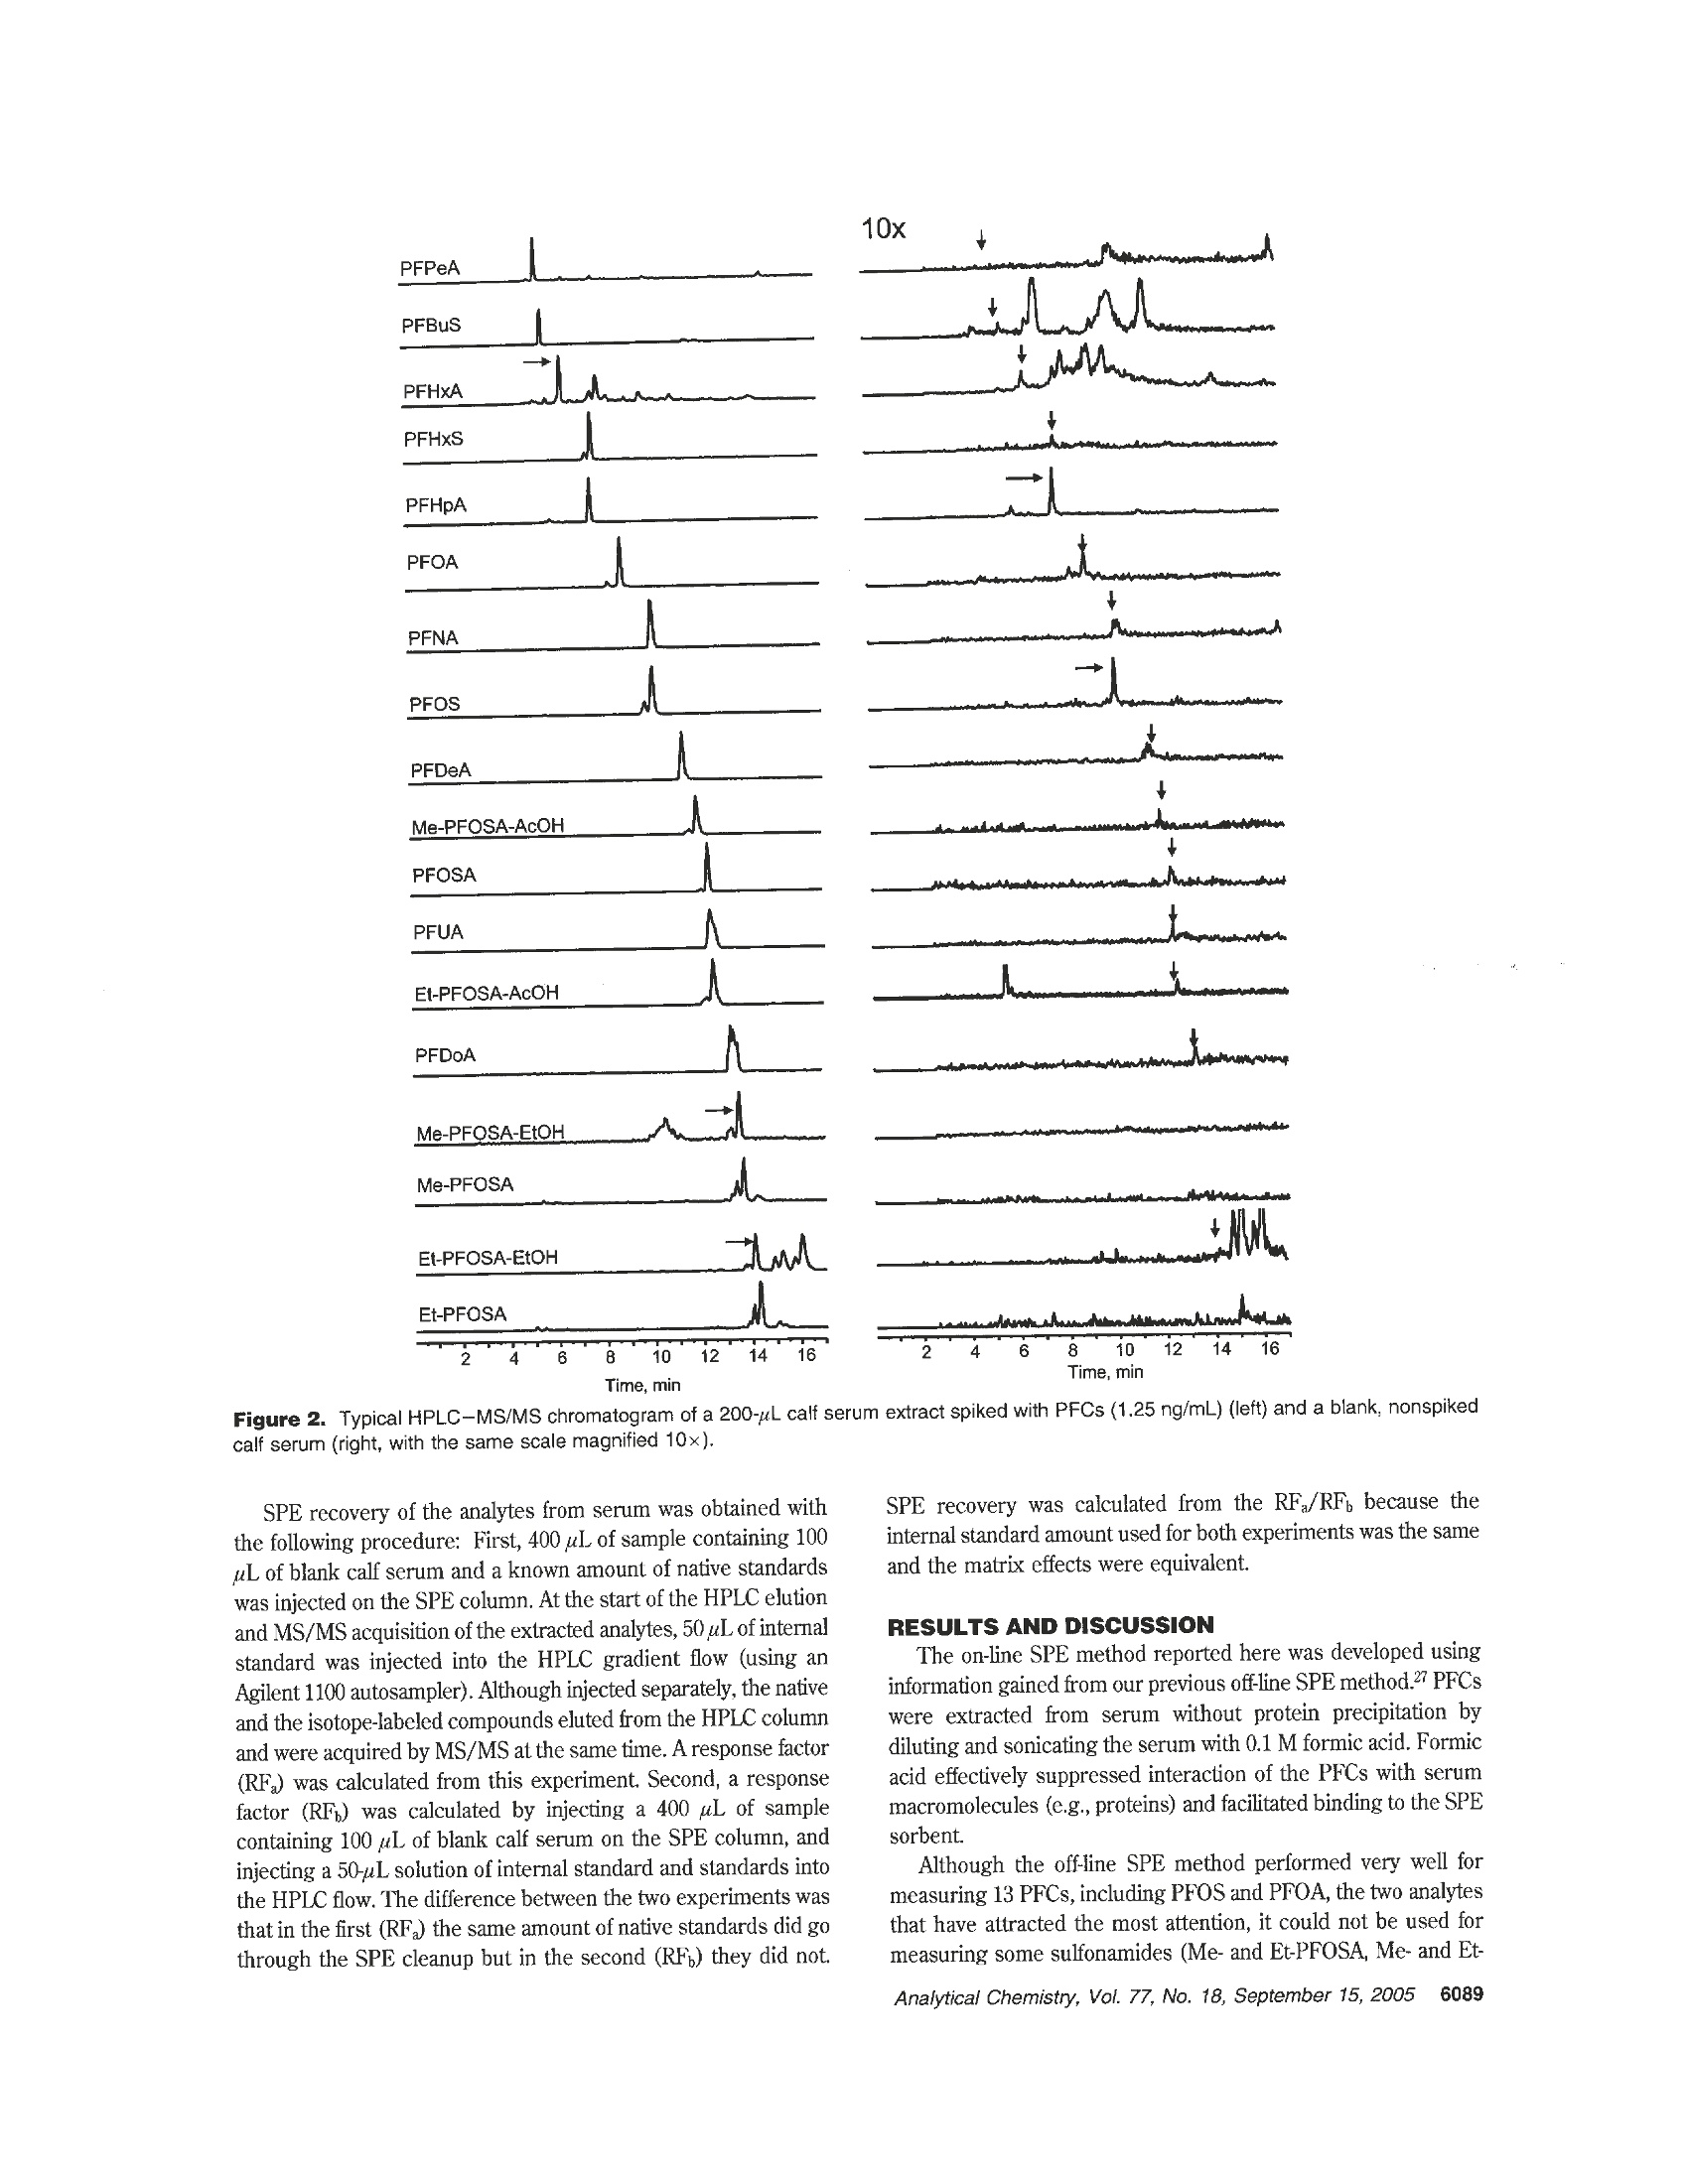
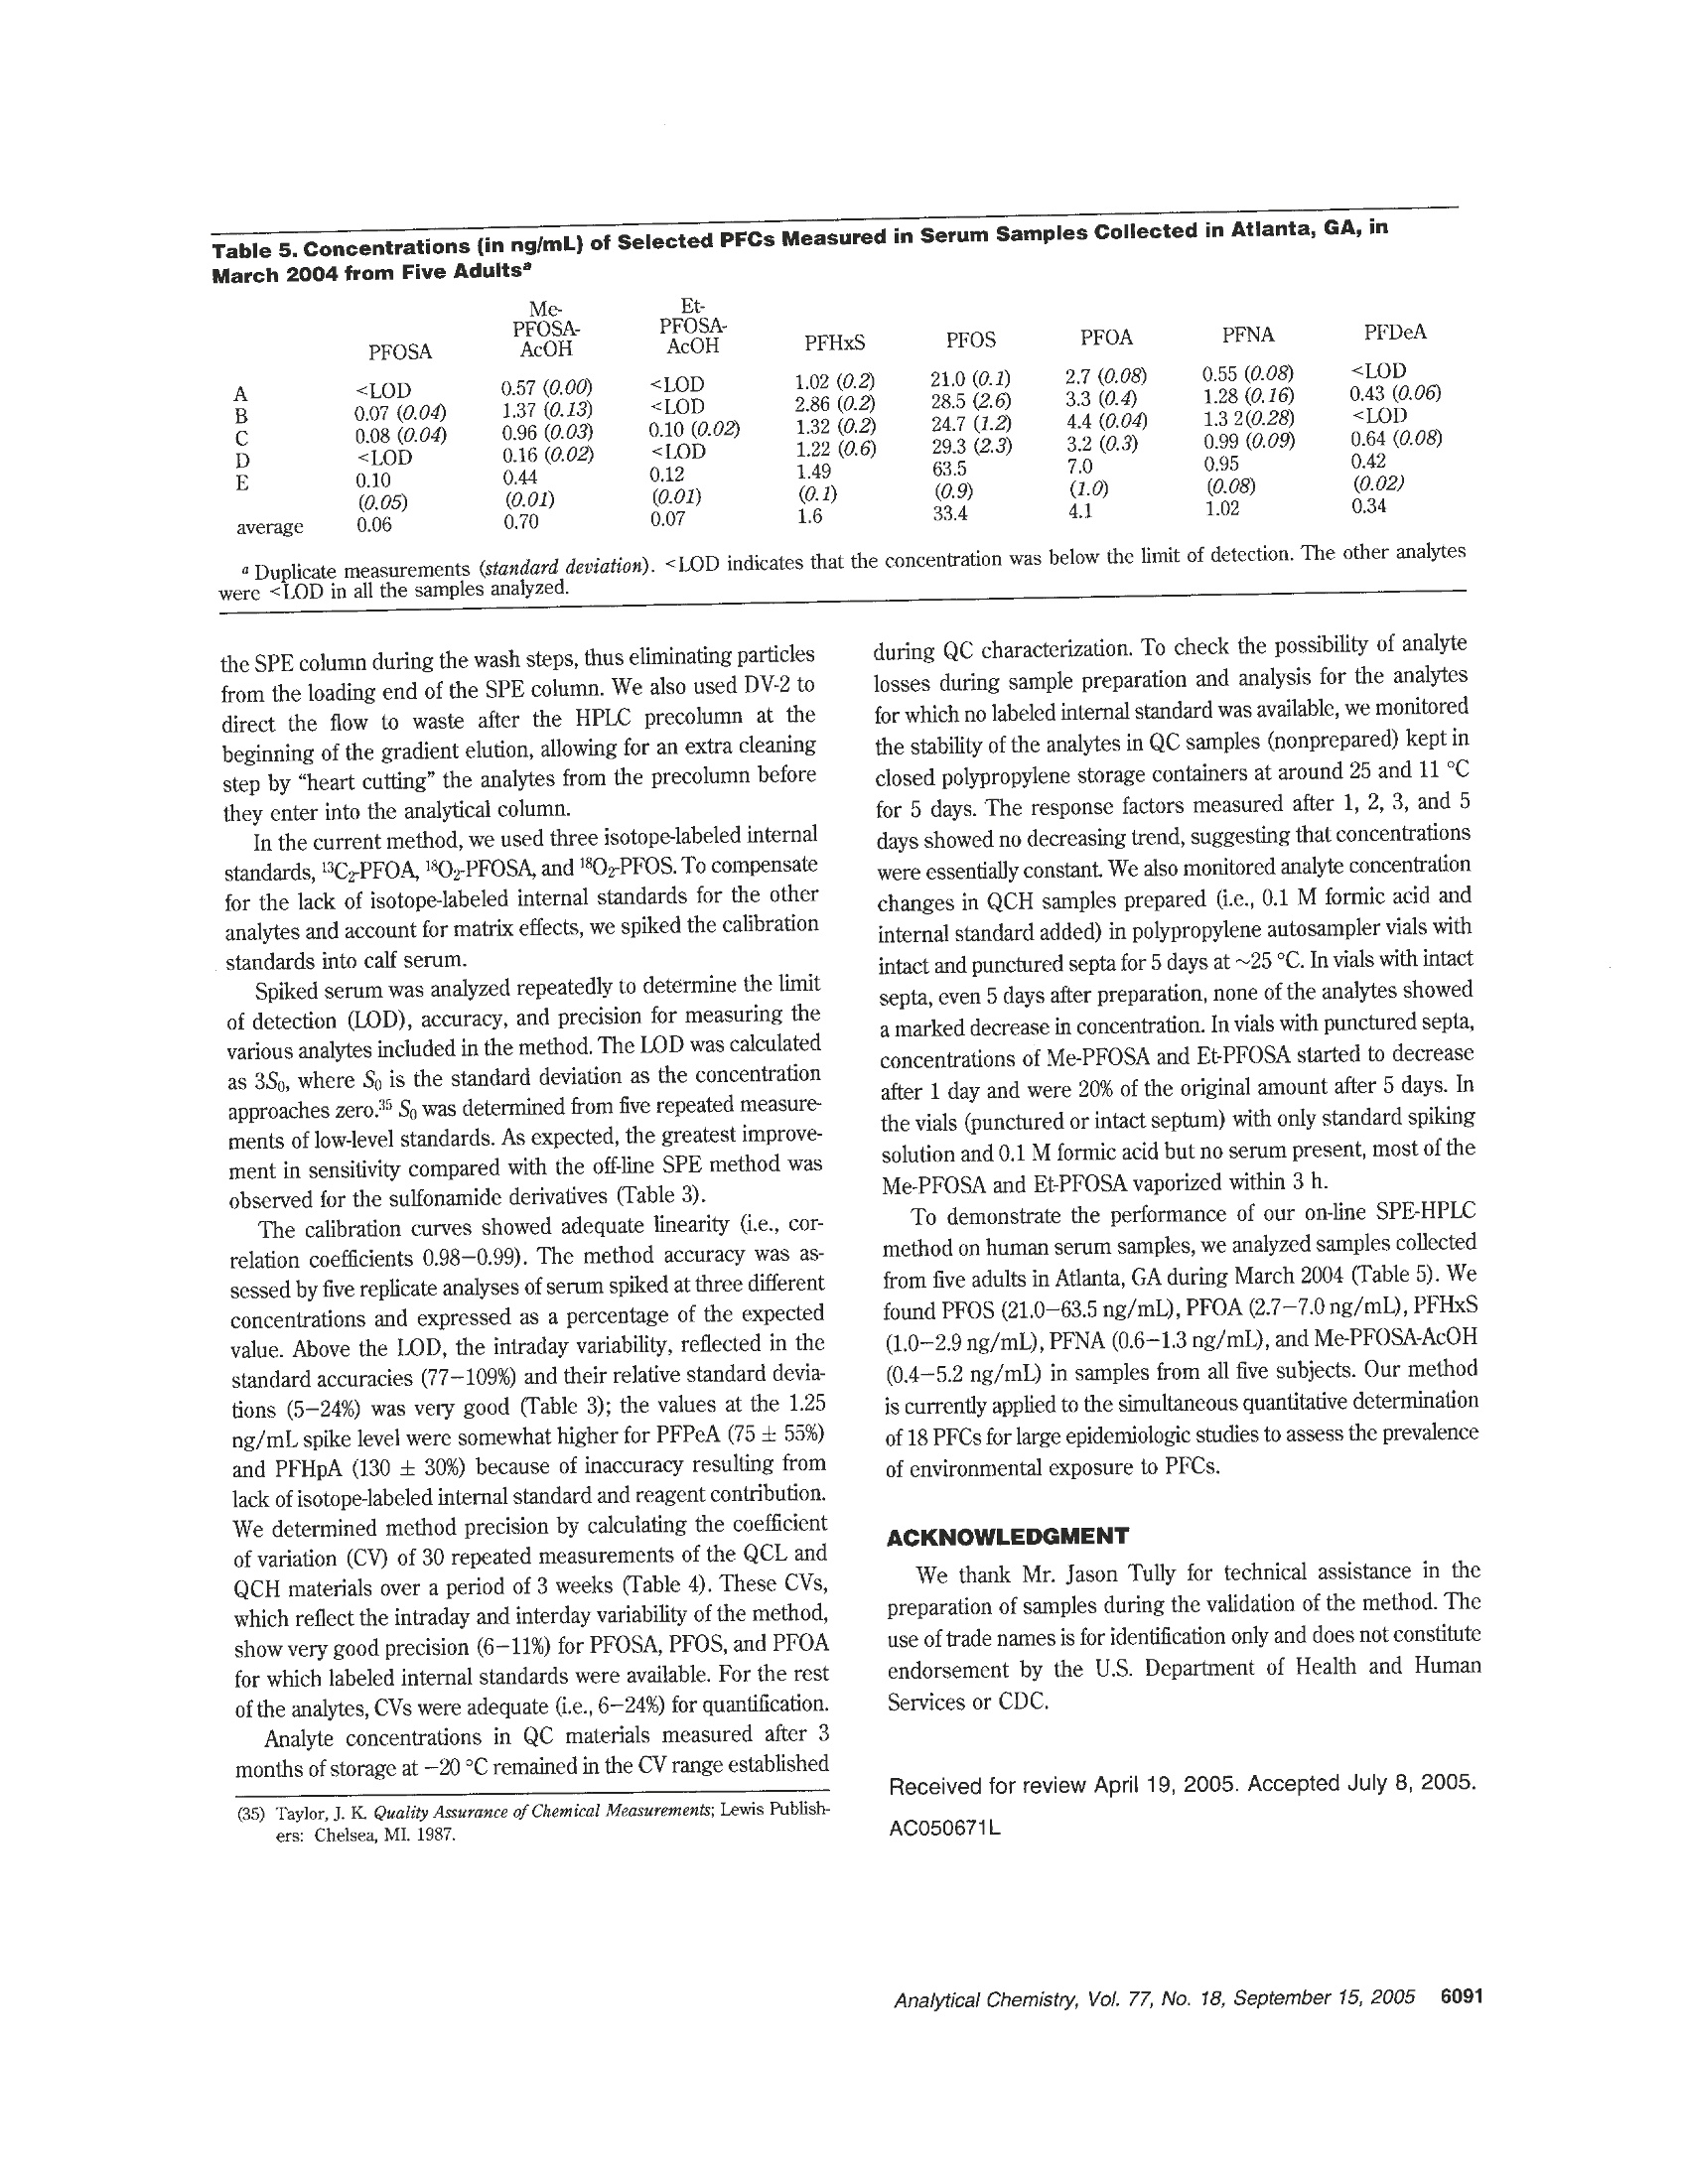
Anal.Chem. 2005,77,6085-6091 Measurement of 18 Perfluorinated Organic Acidsand Amides in Human Serum Using On-LineSolid-Phase Extraction Zsuzsanna Kuklenyik,* Larry L. Needham, and Antonia M. Calafat Division of Laboratory Sciences, National Center for Environmental Health, Centers for Disease Control and Prevention,Atlanta, Georgia 30341 We have developed an on-line solid-phase extraction(SPE) method coupled to high-performance liquid chro-matography (HPLC)-tandem mass spectrometry (MS/MS) for measuring trace levels of 18 perfluorinatedchemicals (3 perfluorosulfonates, 8 perfluorocarboxy-lates, 7 perfluorosulfonamides) in serum. Without proteinprecipitation, only dilution with 0.1 M formic acid, onealiquot of 100 uLof serum was injected into a commercialcolumn switching system that allowed for concurrent SPEand HPLC-MS/MS acquisition. First, the analytes wereconcentrated on a C18 SPE column. Then, this columnwas placed automatically in front of a C8 analytic HPLCcolumn for chromatographic separation of the analytes.Detection and quantification were done using negative-ion TurboIonSpray ionization, a variant of electrosprayionization, MS/MS. Excellent recovery was achieved forall analytes including the volatile sulfonamide derivativesthat could not be determined before using traditional off-line SPE methods. The high throughput and low limits ofdetection (0.05-0.8 ng/mL) using a small sample volume(100 pL of serum) and isotope dilution quantificationmake this method suitable for large-scale epidemiologicstudies. Perfluorochemicals (PFCs) are used in many commercialapplications, including surfactants, lubricants, paints, polishes, foodpackaging, and fire-retarding foams. Concerns about the persistentand bioaccumulative nature of PFCs were raised when perfluo-rooctanesulfonate (PFOS), a widely used surfactant, was foundto be ubiquitous in human populations1-5 and in wildlife6-13 around ( * Corres p onding author. P h one: 77 0 -488-7923. Fax: 770 - 488-4609. E-m a il: Z Kukl e nyik@c d c. g o v . ) ( (1) Ol s en, G . W . ; B urris, J . M.; M a ndel, J. H.; Zobel, L . R . J . Occ u p. Environ. M ed.1999, 41 ,79 9 - 8 06. ) ( ( 2) H an sen, K. J; Cl e men, L . A . ; E ll e fso n , M. E.; J ohn s on, H. O. En v ir o n. Sci. Technol. 2001, 35 , 766-70. ) ( ) O lsen, G. W.; Hanse n , K . J . ; S tevenson, L . A; B urri s , J . M.; M andel, J. H . ) ( E nuiron. Sci. Techn o l . 2003, 3 7, 8 88-9 1 . ) ( ( 4 ) O lsen, G. W.; Bu rris, J .M.; B u rle w, M. M .; Mande l , J . H . J.O c c u p.E n viron. Med. 2003, 45.260-70. ) ( ( 5) O ( lsen , G. W.; C hu rc h, T . R ; Mi l le r, J . P . ; Burri s , J . M. ; Hanse n , K . J ; L undb e rg, J. K; A r mitage, J. B . ; H e rron, R. M.; Medhd i zadehkashi, z.; N o bilet t i, J. B . ;ONeil l , E . M .; M a n del, J . H . ; Zobel, L . R . E n v i r on. He alth P erspect . 2003, 1 11 , 1 892- 90 1, ) Giesy, J. P.; Kannan, K. Environ. Sci. Technol. 2001, 35,1339-42. ( ) G iesy, J . P.; Kannan, K. E n viron. Sci. Technol . 2002, 3 6 ,1 4 6A-52A. ) ( 10.1021/ a c0506711 N o t sub j ect to U . S. C o pyright. Publ . 2 005 Am. Ch e m . Soc. Published on Web 08/17/2005 ) the world. In response to these concerns, in 1999, the UnitedStates Environmental Protection Agency (EPA) began investigat-ing PFOS. In May 2000, 3M, the sole manufacturer of PFOS inthe United States and the principal manufacturer worldwide,announced it was discontinuing its perfluorooctanyl chemistries,including PFOS. Shortly thereafter, in June 2000, EPA identifiedpossible related concerns with respect to perfluorooctanoic acid(PFOA) and fluorinated telomers. PFOA is used primarily in theproduction of fluoroelastomers and fluoropolymers,such as poly-(tetrafluoroethylene) (Teflon) and poly (vinylidine fluoride). Thesepolymers have numerous uses in many industrial and consumererproducts, including soil-, stain-, grease-, and water-resistant coat-ings on textiles and carpet; uses in the automotive, mechanical,aerospace, chemical, electrical, medical, building, and constructionindustries; personal care products; and nonstick coatings oncookware. Since April 2003, EPA released two preliminary riskassessments on PFOA that indicate potential human exposure tolow levels of PFOA in the United States.14,15 Animal data suggest potential developmental, reproductive, andsystemic toxicityl6-18 for selected PFCs. However, to date,no clearassociation has been established between human exposure toPFCs and adverse health effects, and the environmental sourcesof PFOS and PFOA have not been clearly identified. PFCs havebeen measured in biologic1-6,8-12,19 and environmental20-23 ma- ( ( 8 ) K annan, K . ; Fra n son, J . C . ; B ower ma n, W. W. ; Ha nsen , K . J; J ones,J. D . ; G iesy, J. P. Environ. Sci. Technol. 2 001, 35, 3065-70. ) ( ( 9) K annan,K ; Ko i s t inen, J ; B e c k men , K.; E v a n s, T .;Go rz ia r e lany, J . F;Hans e n, K . J; J o n es, P. D.; He l le, E . ; Nyman, M.; Giesy,J. P . Environ. Sci. T echnol,2001,35, 1 593-8. ) (10) Kannan,K; Hansen, K. J.; Wade, T. L.;Giesy,J. P. Arch. Environ. Contam.Toxicol. 2002, 42,313-8. (11) Kannan, K.;Newsted, J; Halbrook, R. S.; Giesy, J. P. Environ. Sci. Technol.2002, 36,2566-71. (12) Kannan,K.; Choi,J. W.; Iseki, N.; Senthilkumar, K.; Kim, D.H.; Masunaga,S.; Giesy,J. P. Chemosphere2002,49,225-31. (13) KFannan, K.; Giesy, J. P. Organohalogen Compd. 2002, 59, 267-70. (14) EPA Fed. Regist. 2003,68,18626-33. ( (15) E E PA. D ra ft R isk A ssessment o f the P o tential Human H e alth Effects A ssociated With Expo s ure to Pe r fluorooctan o ic Aci d and I ts S a l ts (PFOA). U . S . E nvironmental P r otection Agency: W a shington, DC, 2005 . ) ( ( 16) O E CD. H a zard Assess m ent o f P erfl u orooct a ne Sulfonat e (P F O S) an d i ts Salts. http://www.oecd.org/dataoecd/23/18/2382880.pdf, pp 1-36 2 . O r . g anisa t ion fo r Econom i c C o ope r a t i o n and Deve l opme n t ( OEC D) . 20 0 2. ) ( (17) Seacat, A. M.; Thomford, P . J; Hansen, K. J ; O l sen, G. W.; Case, M. T. B utenhoff, J . L . To xi c ol . S ci. 2002,6 8 ,249 - 64 . ) ( (18) S e acat, A. M.; Thomford, P. J. ; Hansen, K . J.; Cl e men, L . A.; Eldridg e ,s. R.; Elcombe, C . R ; B utenhoff, J . L . Toxicology 2003, 183, 117-31 . ) ( ( 19) Sottani, C . ; Minoia , C. Rapid Commun. M a s s Sp e ctrom. 20 0 2, 16, 650 - 4. ) ( Analytical Chemistry, Vol . 77, N o . 18, September 15, 2005 6 085 ) trices mostly by high-performance liquid chromatography-tandem mass spectrometry (HPLC-MS/MS). Gas chromatography-mass spectrometry was used for measuring N-alkylperfluorooctane sulfonamides and 2-(perfluorooctane sulfonamido) ethanolderivatives,24.25 Early methods used liquid-liquid extraction (LLE)to extract the PFCs from the biologic matrix.1-4.6&-12.19 Methodsusing solid-phase extraction (SPE) instead of LLE have beenreported for environmental212226 and biologic samples.27-30 Modernapproaches such as using protein precipitation columns formeasuring PFOA in seruml and on-line SPE methods formeasuring PFOS in river water2 or PFOS, PFOA, and periluorooctane sulfonamide (PFOSA) in human plasma3? had also beenreported. Previously, we developed an automated off line SPE methodfor measuring 13 PFCs.27 Although this method had adequatesensitivity, the recovery and precision for some sulfonamides andshort-alkyl chain acids were low. This was mainly due to lossesduring evaporation and preconcentration processes after SPE. Toeliminate these steps, we developed an on-line SPE method. Theon-line SPE-HPLC-MS/MS method has a throughput similar tothat of our previous off-line SPE method, but has better recovery,sensitivity, and precision for all analytes and uses smaler amountsof sample. The method also allows for the measurement of therelatively volatile N-alkyl sulfonamide and sulfonamido ethanolderivatives, potential metabolic precursors of PFOS.33 Although,at present, toxicologic data on these sulfonamide derivatives areambiguous, the method reported here may be used for theiranalysis in other biologic and environmental matrices. We testedthe applicability of the method on human serum collected frompersons nonoccupationally exposed to PFCs. MATERIALS AND METHODS Chemicals. PFOSA, N-ethylperfluorooctane sulfonamide (Et·PFOSA), N-methylperfluorooctane sulfonamide (Me-PFOSA),2-(N-ethylperfluorooctane sulfonamido) ethanol (EtPFOSA-EtOH), ( (20) Ha n sen, K. J; Jo h nson, H. O .; Eld r idge, J. S.; Bu t enhoff, J. L; Dick, L. A. Enuiron. S ci. Technol. 2002, 36,1681-5. ) (21) Moody, C. A.; Kwan, W. C.; Martin, J. W.; Muir, D. C. G.; Mabury,S. A.Anal. Chem.2001,73,2200-6. (22) Moody, C. A; Martin, J. W.; Kwan, W. C.; Muir,D. C. G.; Mabury, S. AMCEnviron. Sci. Technol. 2002, 36,545-51. (23) Takino, M.; Daishima, S.; Nakahara, T. Rapid Commun. Mass Spectrom.2003, 17,383-90. (24)SShoeib, M.; Harner, T.; Ikonomou, M.; Kannan, K. Environ. Sci. Technol.2004,38,1313-20. (25) Tittlemier, S. A.; Pepper, K.; Edwards, L.; Tomy, G. J. Chromatogr., A 2005,1066,189-95. ( (26) M oody, C. A. ; Hebert, G. N. ; Strauss, S. H.; F i eld, J. A. J . Environ. Monit. 2003,5,341-5 . ) ( ( 27) K u klenyik, Z; Re i ch, J. A . ; Tu l ly, J. S . ; Needham, L. L.; C alafat, A. M . Environ. Sci.Technol. 2004,38,3698-704. ) (28)Lau,C.;Thibodeaux,J. R; Hanson, R. G.; Rogers, J. M.; Grey, B. E.;Stanton,M. E.; Butenhoff, J. L.; Stevenson, L. A. Toxicol. Sci. 2003, 74, 382-92. (29) Thibodeaux, J. R.; Hanson, R. G.; Rogers, J. M.; Grey, B. E.; Barbee, B. D.;Richards,J. H.; Butenhoff, J. L.; Stevenson, L. A.; Lau, C. Toxicol. Sci. 2003,74,369-81. (30) Karrman, A.; van Bavel, B.; Jarnberg, U.; Hardell, L.; Lindstrom, G. Anal.Chem.2005,77,864-70. (31) Flaherty,J. M.; Connolly, P. D.; Decker, E. R; Kennedy, S. M.; Ellefson,M. E; Reagen, W. K; Szostek,B. J. Chromatogr., B-Anal. Technol. Biomed.Life Sci. 2005, 819,329-38. (32) Holm, A; Wilson, S. R.; Molander, P.; Lundanes, E.; Greibrokk, T. J. Sep.Sci.2004,27,1071-9. (33) Xu, L; Krenitsky, D. M.; Seacat, A. M.; Butenhoff, J. L.; Anders, M. W.Chem. Res. Toxicol.2004, 17,767-75. 6086 Analytical Chemistry, Vol. 77, No. 18, September 15, 2005 2-(N-methylperfluorooctane sulfonamido) ethanol (MePFOSA.EtOH), 2-(N-ethylperfluorooctane sulfonamido) acetic acid (Et-PFOSA-AcOH), 2-(N-methylperfluorooctane sulfonamido) aceticacid (MePFOSA-AcOH), potassium perfluorobutane sulfonate(PFBuS), potassium perfluorohexanesulfonate (PFHxS), potas-sium perfluorooctanesulfonate (PFOS), and ammonium perfluo-rooctanoate (PFOA) were provided by 3M Co. (Saint Paul, MN).Perfluoropentanoic acid (PFPeA), perfluorohexanoic acid (PF-HxA), perfluoroheptanoic acid (PFHpA), perfluorononanoic acid(PFNA), perfluorodecanoic acid (PFDeA), perfluoroundecanoicacid (PFUA), and perfluorododecanoic acid (PFDoA) were pur-chased from Oakwood Products (West Columbia, SC). 1,2-13CrPerfluorooctanoic acid ("CzPFOA) was provided by Dupont Co.(Wilmington,DE). 180rPerfluorooctanesulfonate (8OzPFOS) and180zammonium perfluorooctanesulfonamide (180zPFOSA) werepurchased from Research Triangle Institute (Research TrianglePark, NC). HPLC grade methanol, acetonitrile, and water werepurchased from Caledon (Ontario, Canada), acetic acid was(glacial) from Sigma-Aldrich (St. Louis, MO), formic acid (98%min. GR) from EM Science (Gibbstown, NJ), and ammoniumhydroxide (30%) from J. T. Baker (Phillipsburg, NJ). All chemicalsand solvents were used without further purification. Preparation of Standard Solutions and Quality-ControlMaterials. Standard stock solutions (10 mg/mL) were preparedby dissolving solid standards in methanol. Nine working standardsolutions containing all analytes were prepared by serial dilutionsin methanol to final concentrations such that a 50-uL spike in 200uL of serum would cover a concentration range from 0.1 to 100ng/mL for PFOS and 0.025 to 25 ng/mL for the other analytes. Stock solutions of 13C,-PFOA,1802-PFOS, and 18Oz-PFOSA (0.1mg/mL) in methanol were prepared from the solid standards andwere diluted to provide working solutions such that a 50-uL spikeinto 200 uL pf serum provided a final concentration of ~10 ng/mL. All stock solutions and standards were stored in polypropylenevials at or below -20°C. The quality control (QC) materials were prepared from calfserum (Gibco, Grand Island, NY). The serum was mixed uniformlyand divided into three subpools. One subpool was used as a matrixblank QC and to prepare the calibration standards, and the othertwo were enriched with PFCs as needed to afford low-concentra-tion (QCL) and high-concentration (QCH) subpools. The poolswere dispensed in aliquots (~3mL) into polypropylene vialsprerinsed with methanol and stored at -20 ℃ until used. TheQCH and QCL pools were characterized to define the mean andthe 95 and 99% control limits by a minimum of 30 measurementsin a 3-week period. QC materials extracted and analyzed after theinitial characterization showed that the PFCs remained stable at-20°Cfor at least 3 months. Sample Preparation. Standards, QCs, and blanks wereprepared and processed using the same procedure. To 500 uL of0.1 M formic acid, placed in a 0.9-mL polypropylene autosamplervial and spiked with 50 uL of internal standard solution and 50uL of standard solution (for standards only), 200 uL of serum wasadded. This solution was vortex-mixed, sonicated for 20 min, andplaced on a Symbiosis on-line SPE-HPLC system (Spark Holland,Plainsboro, NJ). Automated SPE. The Symbiosis system was used in concur-rent SPE-HPLC mode (Figure 1, Table 1). The left clamp, left Left clamp Fiaure 1. Tubing diagram for the Symbiosis column switching system used in concurrent SPE/HPLC mode. (LCV, left clamp valve; DV-1,divert valve 1; DV-2, divert valve 2;RCV, right clamp valve). Table 1 Yalve Confiqurations Used for Concurrent SPE and HPLC-MS/MS Acquisition Using a Symbiosis system(Figure 1) duration steps method LCV DV-1 DV-2 RCV (min) 1 2 move cartridge from left clamp to right clamp load new cartridge into left clamp 6-1 6-1 1-2 1-2 6-1 6-1 1-2 1-2 0.1 0.2 3 send contact closure signal to HPLC-MS/MS 6-1 1-2 6-1 1-2 0.1 4 5 begin HPLC gradient elution, bypass analytical column and MS/MS condition left cartridge (2 mL MeOH, 2 mL/min) 6-1 1-2 1-2 1-2 1-2 6-1 6-1 6-1 2.5 1.2 6 1-2 1-2 6-1 6-1 1.2 7 equrbrate rer caenoiet cartidve (4m0.1 M formic acid, 1 mL/min) 1-2 1-2 6-1 6-1 4.4 8 forward wash left cartridge (1 mL 80% 0.1 M formic acid/20% MeOH, 1 mL/min) 1-2 1-2 6-1 6-1 1.2 9 backwash left cartridge (0.5 mL 0.2% NH4OH/water,1mL/min) 1-2 6-1 6-1 6-1 0.7 10 wait for HPLC elution to finish 6-1 1-2 6-1 1-2 2.0 11 return right cartridge to tray 6-1L 1-2 6-1 1-2 0.1 4The method used for the first sample included only steps 2 and 5-9. The method used for the acquisition of the last sample included onlysteps 1, 3, 4, 10, and 11. For the acquisition of the last sample, the duration of step 10 was 10.5 min. clamp valve (LCV), and left divert valve (DV-1) were used for SPEseparation, and the right clamp, right clamp valve (RCV), and rightdivert valve (DV-2) were used for the HPLC elution. The SPErun started with the conditioning of a HySphere HD C18 cartridge(7 um, 10 mm x1 mm; Spark Holland, Plainsboro, NJ, reused amaximum of 10-12 times), with HPLC grade methanol (2 mL)and 0.1 M formic acid (2 mL). Then, 400 uL of the sample(containing 100 uL of serum) was injected into the 1-mL sampleloop and loaded onto the SPE column using 3 mL of 0.1M formicacid (1 mL/min). Next, the SPE column was washed with 1 mof 50% 0.1 M formic acid/50% methanol and then with 300 pL of0.2% NHOH/water (flow reversed with DV-1). Time of the SPEcleanup above (including injection time) was 8 min. Before startingthe SPE for the next sample, the SPE cartridge containing theextracted analytes was transferred by a robotic gripper (part ofthe Symbiosis system) from the left clamp into the right clamp.In this way, the right clamp was used for eluting analytes fromthe SPE cartridge, and the left clamp was used for the SPE of thenext sample. Once the SPE column was positioned in the rightclamp, the RCV remained in bypass (1-2) position until the HPLC-MS/MS system was ready to begin acquisition. HPLC. At the beginning of the HPLC-MS/MS acquisition,the RCV turned automatically to the 6-1 position to allow thetransfer of the analytes from the SPE column to the HPLC column. The analytes were separated from other extracted componentson a Betasil C8 column (3x 50 mm, 5 um; ThermoHypersilKeystone, Bellefonte, PA), preceded by a Betasil C8 precolumn(3 x 10 mm). During the first 2.5 min of the HPLC gradientprogram, the six-port valve (DV-2, Figure 1) placed between theprecolumn and the HPLC column diverted the eluent flow carryingthe fast-eluting matrix components to waste. At 2.5 min, beforeelution of the first analyte from the HPLC precolumn, the flowwas diverted toward the HPLC column for the chromatographicseparation. At 14 min, after elution of the last analyte from theSPE column, the RCV switched back to the 1-2 position, and theSPE column was returned to the cartridge tray while the HPLCgradient program continued. The HPLC pump was an Agilent 1100 HPLC binary pump(Agilent Technologies, Wilmington, DE) operating at a 600 pL/min flow rate with 20 mM ammonium acetate (pH 4) in water asmobile-phase A and methanol as mobile-phase B. The HPLCgradient program (17 min) was as follows: started at 20%methanol; next, the methanol content was increased in 4 min to60%; then from 4 to 14.5 min to 85% methanol. The last-elutinganalyte was Et-PFOSA (14.2 min). The HPLC column wasregenerated by increasing the methanol content to 90% in 0.5 minand kept for 0.5 min. Finally, methanol content was decreased in Table 2. Multiple Reaction Monitoring Analysis of Perfluorochemicals (PFCs) Indicating the PFC Precursora andProductNegative-lon Masses(m/z) analyte abbreviation (M-H)-(m/2) ion (m/z) perfluorooctane sulfonamide PFOSA 498 78 1802-PFOSA 502 82 N-methylperfluorooctane sulfonamide Me-PFOSA 512 169 N-ethylperfluorooctane sulfonamide Et-PFOSA 526 169 2-(N-methylperfluorooctane sulfonamido) ethanol Me-PFOSA-EtOH 616 59 2-(N-ethylperfluorooctane sulfonamido) ethanol Et-PFOSA-EtOH 630° 59 2-(N-methylperfluorooctane sulfonamido) acetic acid Me-PFOSA-AcOH 570 512 2-(N-ethylperfluorooctane sulfonamido) acetic acid Et-PFOSA-AcOH 584 526 perfluorohexane sulfonic acid PFHxS 399 80/99 perfluorooctane sulfonic acid PFOS 499 99/130/80 1802-PFOS 503 1036/84 perfluoropentanoic acid PFPeA 263 219 perfluorohexanoic acid PFHxA 313 269 perfluoroheptanoic acid PFHpA 363 319 perfluorooctanoic acid PFOA 413 369 13C2-PFOA 415 370 perfluorononanoic acid PFNA 463 419 perfluoroundecanoic acid PFDeA PFUA 513 563 469 519 perflurododecanoic acid PFDoA 613 569 “[M-H]- represents the molecular ion; for Me-PFOSA-EtOH and Et-PFOSA-EtOH, the precursor ions were [M - H + acetate]-adducts.Product ions were [M - CO2H]- for the carboxylic acids; [M- CH2CO2H]-for Me-PFOSA-AcOH and Et-PFOSA-AcOH; [FSO]-, [CF2SO3]-,and [SO3)]- for PFOS; [SO3]- and [FSO]- for PFHxS; [SNO2]- for PFOSA; and [CHCOO]- for Me-PFOSA-EtOH and Et-PFOSA-EtOH·Quantitation ion. 0.5 min to 20% and kept for 1.5 min to equilibrate the column.The total HPLC gradient run was 17 min. MS/MS. Negative-ion TurboIonSpray (TIS), a variant ofelectrospray, was used to convert liquid-phase ions into gas-phaseions on an API 4000 Q Trap, a hybrid triple quadrupole/linearion trap mass spectrometer (Applied Biosystems, Foster City,CA).Although the linear ion trap could be useful for qualitativeconfirmation of the analytes using information-dependent acquisi-tion of enhanced resolution product ion or MS/MS/MS massspectra, the quantitative analysis can be performed equally on aregular API 4000 triple quadrupole mass spectrometer. The TISsettings were curtain gas (N) 20 arbitrary units (au), heated TISgas (zero air) 40 au, heated TIS gas temperature 500 ℃, and ionspray voltage -4500 V. Ionization and collision cell parameterswere optimized individually for each analyte (Table 2). Unitresolution was used for both Q1 and Q3 quadrupoles. Me-PFOSA-EtOH and Et-PFOSA-EtOH molecular ions [M -1]~ gave very weak m/z signals that could only be observed abovepH 7. By contrast, strong [M + 59]- m/z signals (Me-PFOSA-EtOH, m/z=616 and Et-PFOSA-EtOH,m/z= 630) that suggestthe formation of strong adducts between these sulfonamidoethanol derivatives and acetate were observed between pH 3 andpH 8. Fragmentation by N2 in the Q2 collision cell producedexclusively m/z = 59 product ions, corresponding to acetate.Under our experimental conditions, this was the only product ionthat could be used for MS/MS quantitation. We obtained qualita-tive confirmation of the presence of the m/z = 616 and m/z =630 adducts and their retention times by fragmentation in the Q3linear ion trap using MS/MS/MS scanning mode during on-lineSPE/HPLC. The ion trap fragmentation of both adduct ionsproduced a dominant product (m/z=419) consistent with theformation of a perfluorooctyl product ion through the loss of thesulfonamide moiety.We also observed 630→526 and 616→512 m/z ion trap fragments consistent with ethoxyl group loss andweak but distinct 630→570 and 616→556 m/z transitionsconsistent with the formation of free sulfonamido ethanol speciesthrough acetate loss. Data Analysis. Data acquisition and analysis for all samples,blanks, standards, and QC materials were performed using theAnalyst 1.4 software of the API 4000. The peak area ratio of eachanalyte to internal standard (i.e., response factor, RF) was usedfor quantification. 180z-PFOSA internal standard was used for theseven sulfonamides, 180z-PFOS for the three sulfonates, and 13C,-PFOA for the eight carboxylates. To correct potential quantitationerrors from contributions of the quantitation ions between analytesand isotope-labeled internal standards, we applied the Colbycorrection method.34 The deviation of the corrected concentrationsin the 1-100 ng/mL range was ±5%. Nine standard analyteconcentrations spiked into calf serum diluted with 0.1 M formicacid were used to construct daily calibration curves weighted bythe reciprocal of the standard amount (1/x). Since standard andunknown samples went through the same extraction procedure,reagent contributions were automatically corrected by the calibra-tion curve intercept. The native amounts of PFCs in calf serumwere calculated from average of multiple measurements from calfserum using a calibration curve obtained from standards spikedinto 0.1 M formic acid (without serum). The calf serum containednondetectable concentrations for most analytes. When using thePFOS 499 → 99 m/z transition for quantitation, blank serumconcentrations of 0.6 ± 0.3 ng/mL PFOS were measured (n =7). To correct for the endogenous PFOS present in calf serum,the calculated PFOS concentrations obtained from this transitionwere increased by 0.6 ng/mL. No corrections were applied to theother PFCs. ( (34) C o lby, B. N.;Rosecrance, A . E; Colby,M. E . Anal . C h em. 1981,53,19 0 7- 11. ) SPE recovery of the analytes from serum was obtained withthe following procedure: First, 400 uL of sample containing 100uL of blank calf serum and a known amount of native standardswas injected on the SPE column. At the start of the HPLC elutionand MS/MS acquisition of the extracted analytes, 50 uL of internalstandard was injected into the HPLC gradient flow (using anAgilent 1100 autosampler). Although injected separately, the nativeand the isotope-labeled compounds eluted from the HPLC columnand were acquired by MS/MS at the same time. A response factor(RF) was calculated from this experiment. Second, a responsefactor (RF) was calculated by injecting a 400 uL of samplecontaining 100 uL of blank calf serum on the SPE column, andinjecting a 50-uL solution of internal standard and standards intothe HPLC flow. The difference between the two experiments wasthat in the first (RF) the same amount of native standards did gothrough the SPE cleanup but in the second (RF) they did not. SPE recovery was calculated from the RF/RF, because theinternal standard amount used for both experiments was the sameand the matrix effects were equivalent. RESULTS AND DISCUSSION The on-line SPE method reported here was developed usinginformation gained from our previous off line SPE method.2PFCswere extracted from serum without protein precipitation bydiluting and sonicating the serum with 0.1 M formic acid. Formicacid effectively suppressed interaction of the PFCs with serummacromolecules (e.g.,proteins) and facilitated binding to the SPEsorbent. Although the off-line SPE method performed very well formeasuring 13 PFCs, including PFOS and PFOA, the two analytesthat have attracted the most attention, it could not be used formeasuring some sulfonamides (Me- and Et-PFOSA. Me- and Et- Table 3. Solid-Phase Extraction Recoveries, Accuracy, and Limits of Detection Using Calibration StandardsExtracted from Serum {Compared with Results Obtained by the Off-Line SPE Method27) analyte on-line (off line) PFOSA 95±6(90) 87±7 100±6 103±2 0.05 (0.2) Me-PFOSA 94±12 130±26 84±5 97±2 0.07 Et-PFOSA 90±13 125±27 89±6 96±2 0.05 Me-PFOSA-EtOH 91±12 105±24 80±16 94±8 0.4 Et-PFOSA-EtOH 80±12 63±25 77±12 95±15 0.4 Me-PFOSA-AcOH 91±12 (40) 135±66 89±7 100±3 0.2(0.6) Et-PFOSA-AcOH 81±12(70) 110±8 90±9 102±2 0.2(0.4) PFBuS 78±16 103±35 82±9 95±3 0.1 PFHxS 72±4(88) 108±30 98±8 95±5 0.1(0.3) PFOS 90±6(84) 118±25 93±10 102±3 0.2(0.4) PFPeA 114±6(22) 75±55 75±55 99±14 0.8 PFHxA 114±4(60) 146±26 90±24 99±14 0.6(3.2) PFHpA 127 ±4 (112) 200±10 130±30 103±15 0.4(0.3) PFOA 105±6(91) 95±60 109±14 99±7 0.2(0.1) PFNA 109±8(82) 95±55 109±20 107±14 0.2(0.1) PFDeA 96±4(70) 123±16 106±9 94±8 0.2(0.3) PFUA 95±7(72) 87±67 102±6 98±11 0.2 (0.3) PFDoA 75±4(30) 80±52 86±15 105±7 0.2(1.0) “ The SPE recovery and standard deviation was obtained from average of duplicate measurements at two serum concentrations, 2.5 and 12.5ng/mL, for all analytes except for PFOS (10 and 50 ng/mL). The standard accuracy and standard deviation were obtained from concentrationvariation of five replicate measurements.For PFOS, accuracies are reported at LOD, 6.5 and 50 ng/mL. PFOSA-EtOH) and short-alkyl chain perfluorinated acids (PFPeAand PFHxA). We believe the source of this problem is the partialvaporization of PFCs during evaporation of the SPE extract beforeHPLC-MS/MS. These evaporation losses were minimized bystopping the evaporator when the extracts’volume was reducedto ~100 pL followed by dilution with 200 uL of aqueous solvent,to a final total volume of ~300 uL, of which 30 uL was injectedinto the HPLC system. Although with partial evaporation weminimized evaporation losses, only ~1/10 of the original serumwas used; the rest was wasted. With on-line SPE, we eliminatedthe evaporation step, were able to measure all 18 analytes ofinterest (Figure 2), and used 1/5 (200 uL of serum instead of1000 uL) of the serum used by our off-line SPE method.Elimination of the evaporation step considerably improved recov-ery of the short-alkyl chain carboxylic acids and the N-substitutedsulfonamides (Table 3). The on-line SPE method also recoveredthe long-alkyl chain carboxylates i.e., PFDeA, PFUA,and PFDoA)more effectively than our off-line SPE method.27 The key to a successful on-line SPE-HPLC method is choosingthe optimal organic content eluent for transferring the analytesfrom the SPE to the HPLC column. Because of the diversechromatographic behavior of the PFCs, very different optimalorganic content was needed for the transfer of short versus longalkyl chain analytes. At nonoptimal conditions, the analyte signalsshowed peak tailing, peak doubling, and substantial peak broaden-ing. These peak distortions are suggestive of a mixed (i.e., normal-phase/reversed-phase) partitioning mechanism that is influencedby the availability of free silanol groups in the sorbent, the organiccontent of the eluent, and the nature of the analytes. We foundevidence of this mixed partitioning mechanism during thedevelopment of the off-line HPLC method, and it is probably dueto the unique dual hydrophobic-hydrophilic surfactant nature ofthe analytes. To accommodate the diverse chromatographic behavior of theanalytes, we transferred them from the SPE to the HPLC columnusing a relatively slow 20-80% methanol gradient for 14 min. Table 4. Precision of Measurements of PFCsConcentrations in Spiked QC Serum Pools (Comparedwith Results Obtained with the Off-Line SPEMethod27) analyte mean %cv mean %CV PFOSA 3.0(2.2) 6 (7) 14.2(12.0) 5(6) Me-PFOSA 3.6(4.0) 9 (35) 5.9 (8.3) 10 (29) Et-PFOSA 3.1(3.1) 11 (30) 8.5 (11.2) 8(29) Me-PFOSA-EtOH 10 11.7 Et-PFOSA-EtOH 7.8 Me-PFOSA-AcOH 3.7(2.7) 9 (11) 9.8(8.3) 8 (12 Et-PFOSA-AcOH 4.3(2.8) 6(15) 9.2(6.7) 8(20) PFBuS 4.5(3.5) 6 (19) 14.2(13.2) 7(17) PFHxS 2.8(2.1) 10 (11) 12.4 (10.7) 5 (10) PFOS 9.1(8.3) 10(7) 33.3(30.3) 5 (6) PFPeA 5.4 (4.6 5.4(4.6) 24 (49) 27.7(24.0) 31(56) PFHxA 5.0(5.1) 16 (34) 15.7(15.5) 21 (34) PFHpA 6.7(7.5) 13 (17) 14.1(16.3) 18 (13) PFOA 3.0(3.2) 10 (16) 13.3(14.5) 11(12) PFNA 2.6(2.5) 17 (14) 13.7(12.6) 13 (13) PFDeA 2.4(2.1) 15 (24) 9.6(8.2) 19 (22) PFUA 1.8(1.7) 13 (26) 10.6(10.3) 19 (26) PFDoA 1.7(2.2) 15 (21) 7.7(8.8) 9 (23) " Mean concentrations (N=30) in ng/mL; CV is the coefficient ofvariation. Without the HPLC column, the fastest eluting analyte left the SPEcolumn in 0.5 min and the last analyte left at 13 min. Therefore,the SPE column needed to be kept in front of the HPLC columnduring most of the HPLC-MS/MS acquisition. For a high-throughput method using the HPLC-MS/MS acquisition timeperiod for the injection and cleanup of the next sample, a secondSPE column was needed. Fortunately, such concurrent SPE andHPLC operations, using two SPE columns, can be easily per.formed on the Symbiosis on-line SPE system. We took fulladvantage of the system by incorporating both column clampsand all four switching valves into our method (Figure 1 and Table1). In particular, we used DV-1 to reverse the flow going through Table 5. Concentrations {in ng/mL) of Selected PFCs Measured in Serum Samples Collected in Atlanta, GA, inMarch 2004 from Five Adults: Me- Et- PFOSA PFOSA- AcOH PFOSA- AcOH PFHxS PFOS PFOA PFNA PFDeA A
确定


还剩5页未读,是否继续阅读?

产品配置单

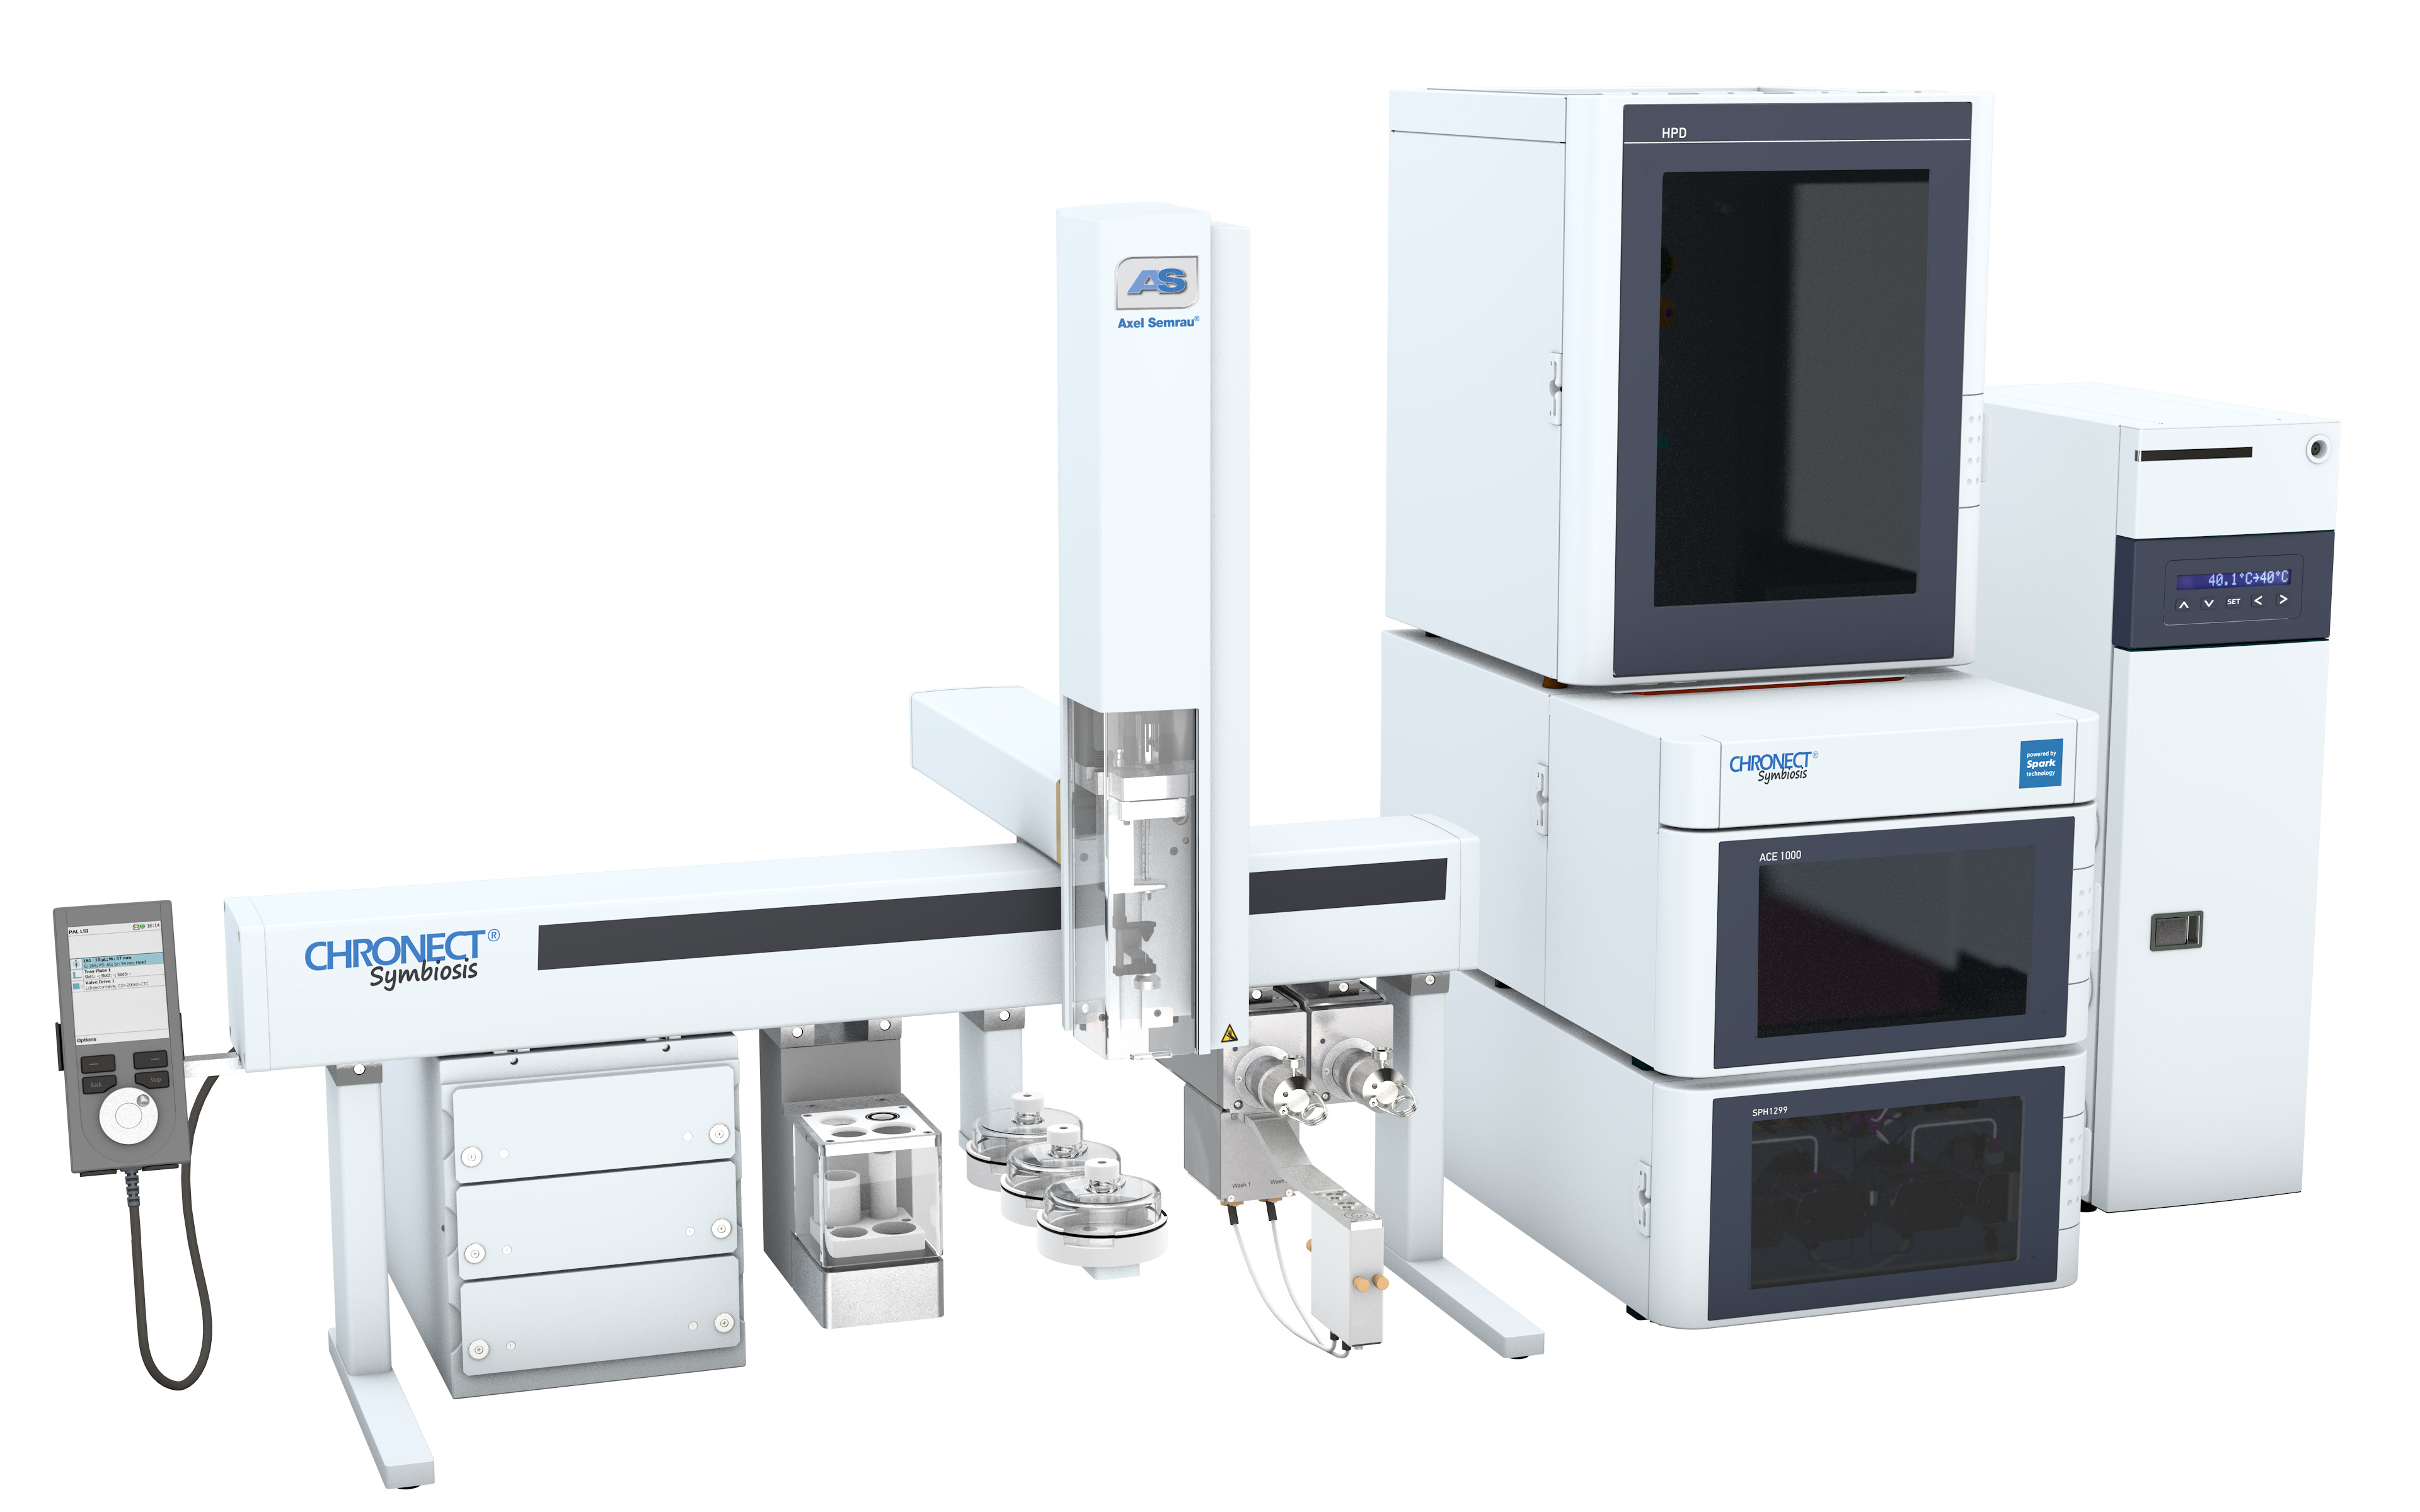
仪真分析仪器有限公司为您提供《人血清中全氟化合物检测方案(固相萃取仪)》,该方案主要用于全血/血清/血浆中生化检验检测,参考标准--,《人血清中全氟化合物检测方案(固相萃取仪)》用到的仪器有超高压液相在线SPE色谱联用系统CHRONECT Symbiosis
推荐专场


相关方案
更多
该厂商其他方案
更多