


方案详情
文
汞是一种剧烈的神经毒素,是威胁人类公共健康的因素之一。元素汞经常是因为采矿或者煤炭的燃烧从而形成汞蒸汽,并长距离的传播,从而污染水源和土壤。虽然汞通常以无机的形式存在,但是它经常可以在厌氧情况下由微生物作用形成毒性更大的甲基汞。甲基汞的毒性往往可以通过食物链的环节在生物体中形成生物积聚和生物放大,从而急剧恶化。
头发中的汞和血液中的汞常被用做人体汞暴露程度评估的生物指标。一般头发中的汞是血液中汞浓度的250倍。与血汞测试比较,头发中的汞测试更为常用,因为汞在头发的生长过程中会累积,更能反应汞暴露的长期性。另一项研究表明,食用鱼肉是被认定为除了汞职业暴露之外的另一主要的甲基汞在人体中积聚的主要原因。基本上有75%-100%的汞在鱼肉中是以甲基汞的形式存在,所以通常食用更多鱼肉的人,头发中汞的含量也越高。
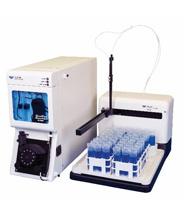
因此作者以中国南方珠江三角洲一带以渔业为生的人群作为研究对象,设计了调查问卷,并对广东省多个地区人群的头发,主要食物如:鱼类,贝类,蔬菜,谷物进行了采样,并进行汞含量的分析。实验中甲基汞的测定用到的是Brooks Rand 生产的MERX全自甲基汞分析系统。
通过实验分析发现,被调查人群头发中总汞和甲基汞的平均含量分别为1.08 ± 0.94 μg g-1 (0.14–7.15)和0.58 ±0.59μg g-1 (0.03–4.64)。进一步的研究表明,影响这些人头发中汞含量的因素主要和被分析人的年龄、饮食习惯以及抽烟习惯有密切关系,其中鱼肉和谷物的摄入是当地居民汞暴露的主要途径。
方案详情

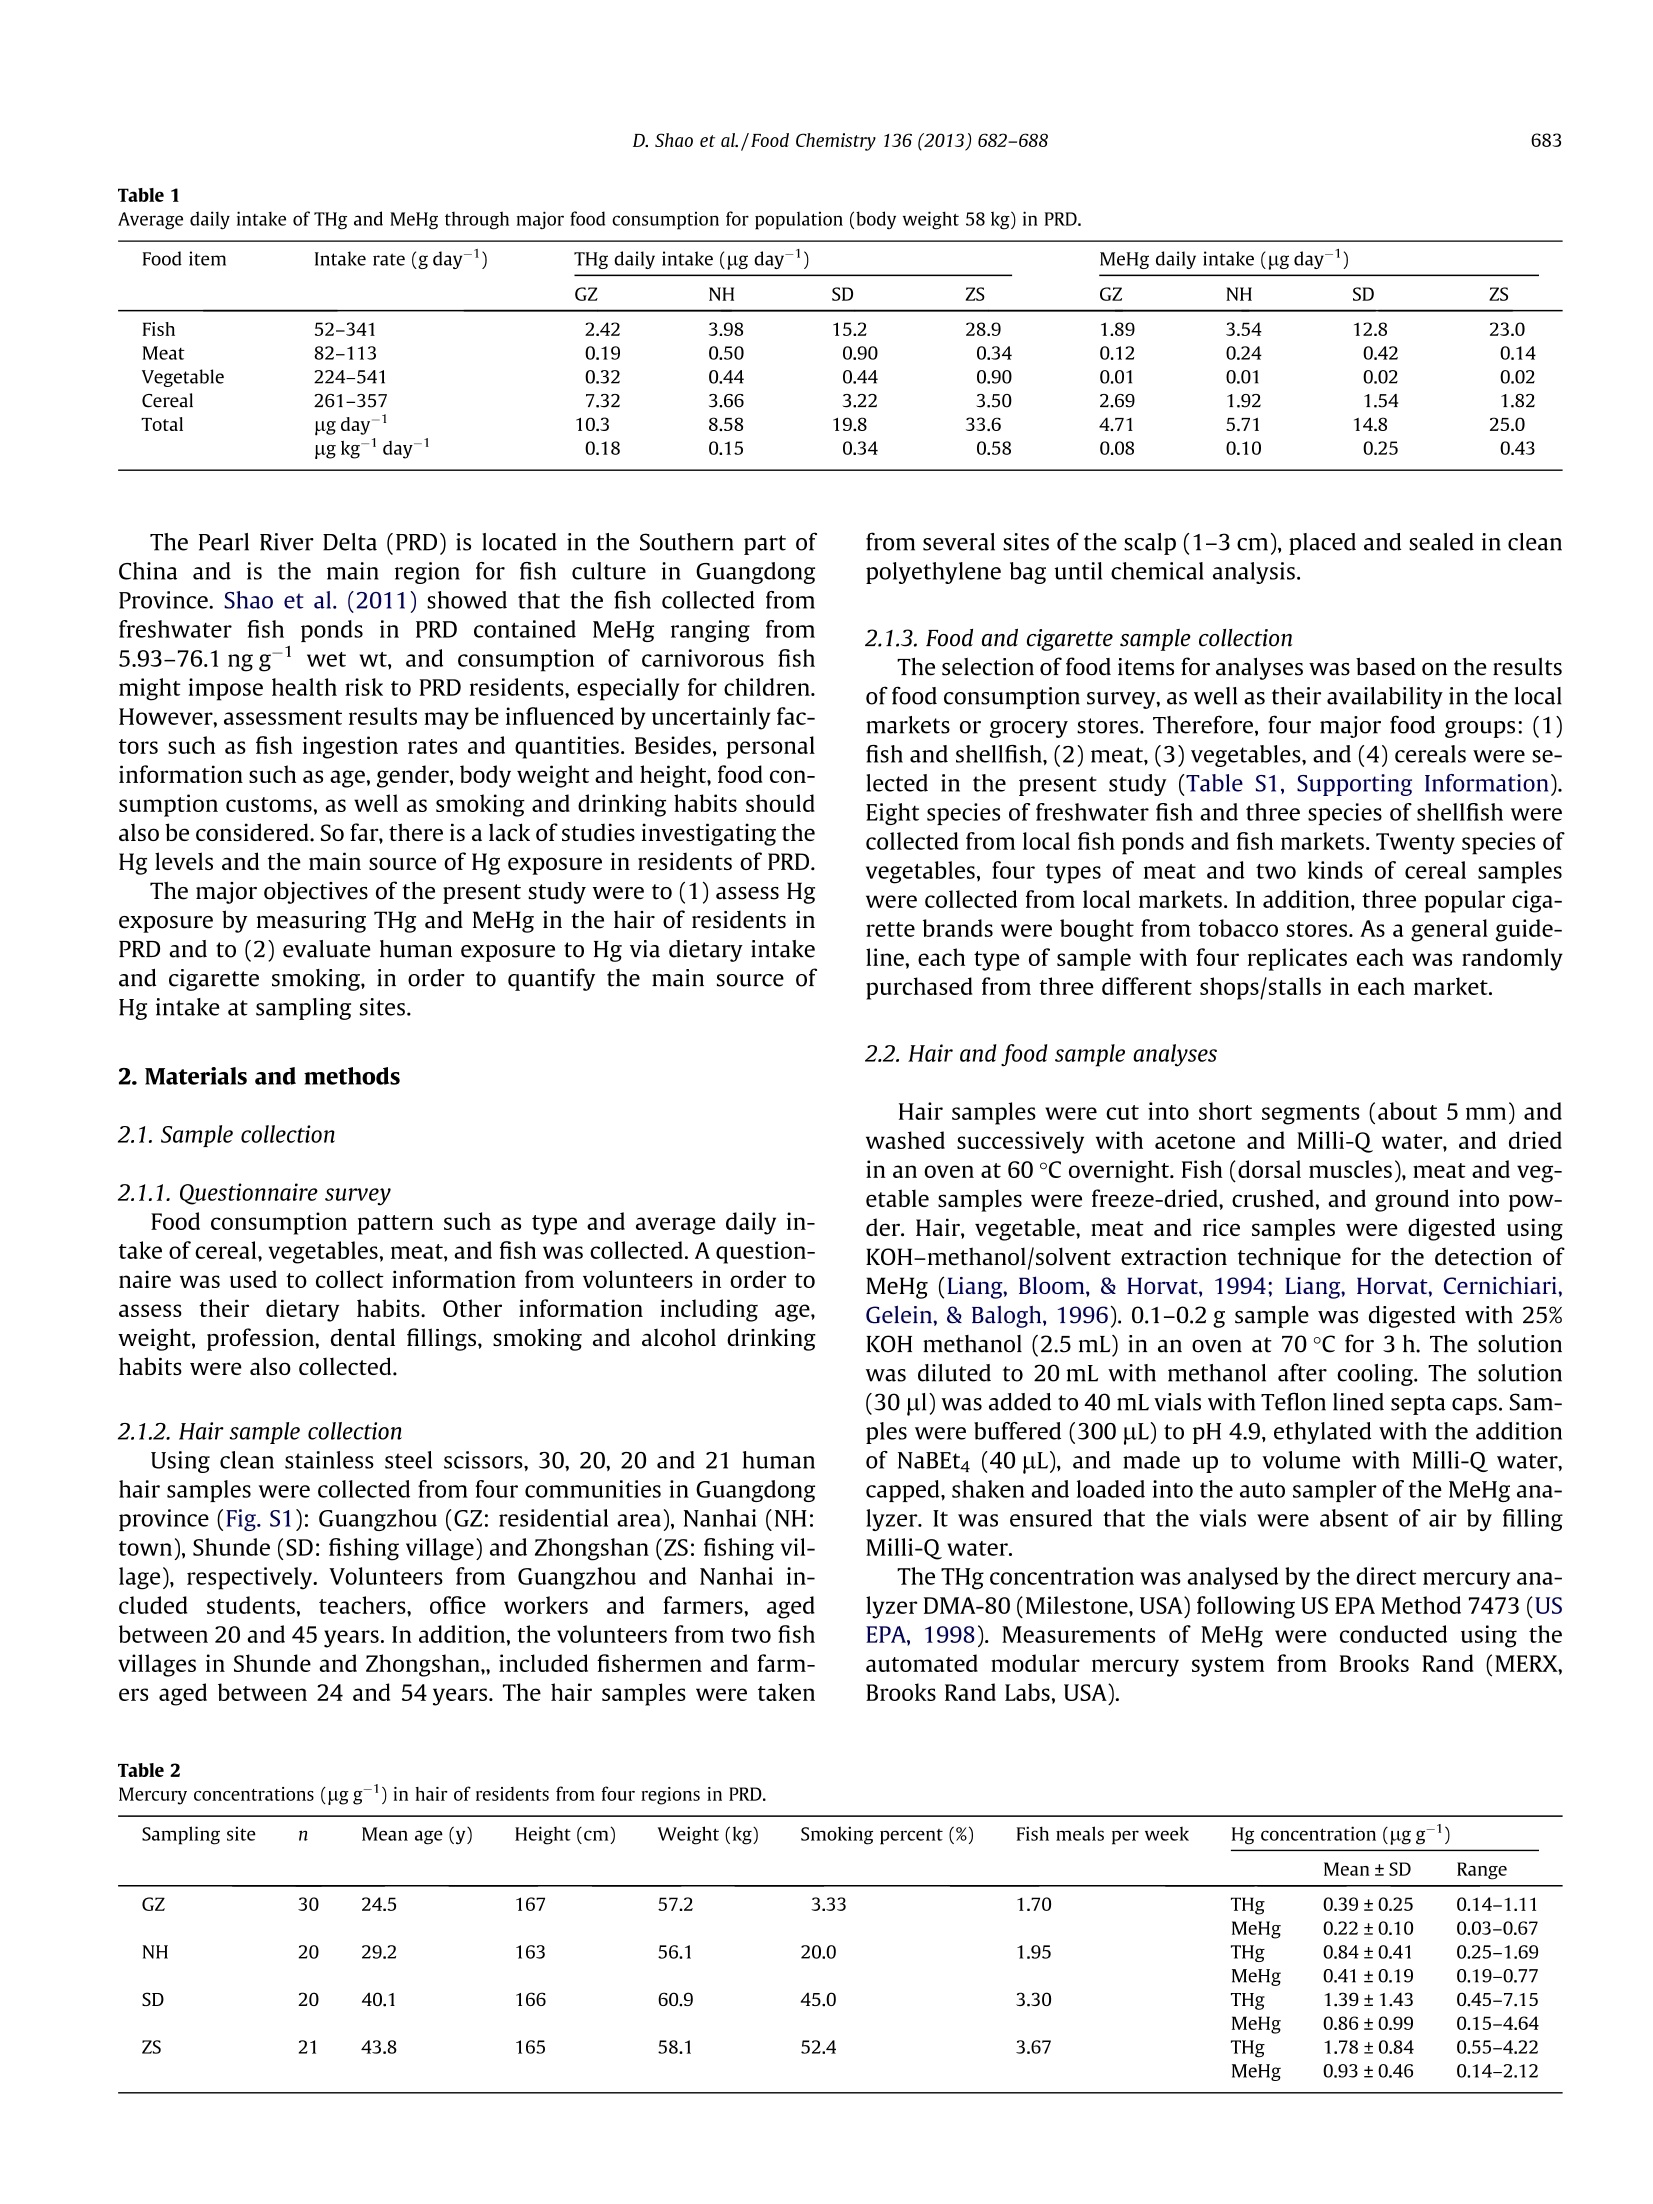
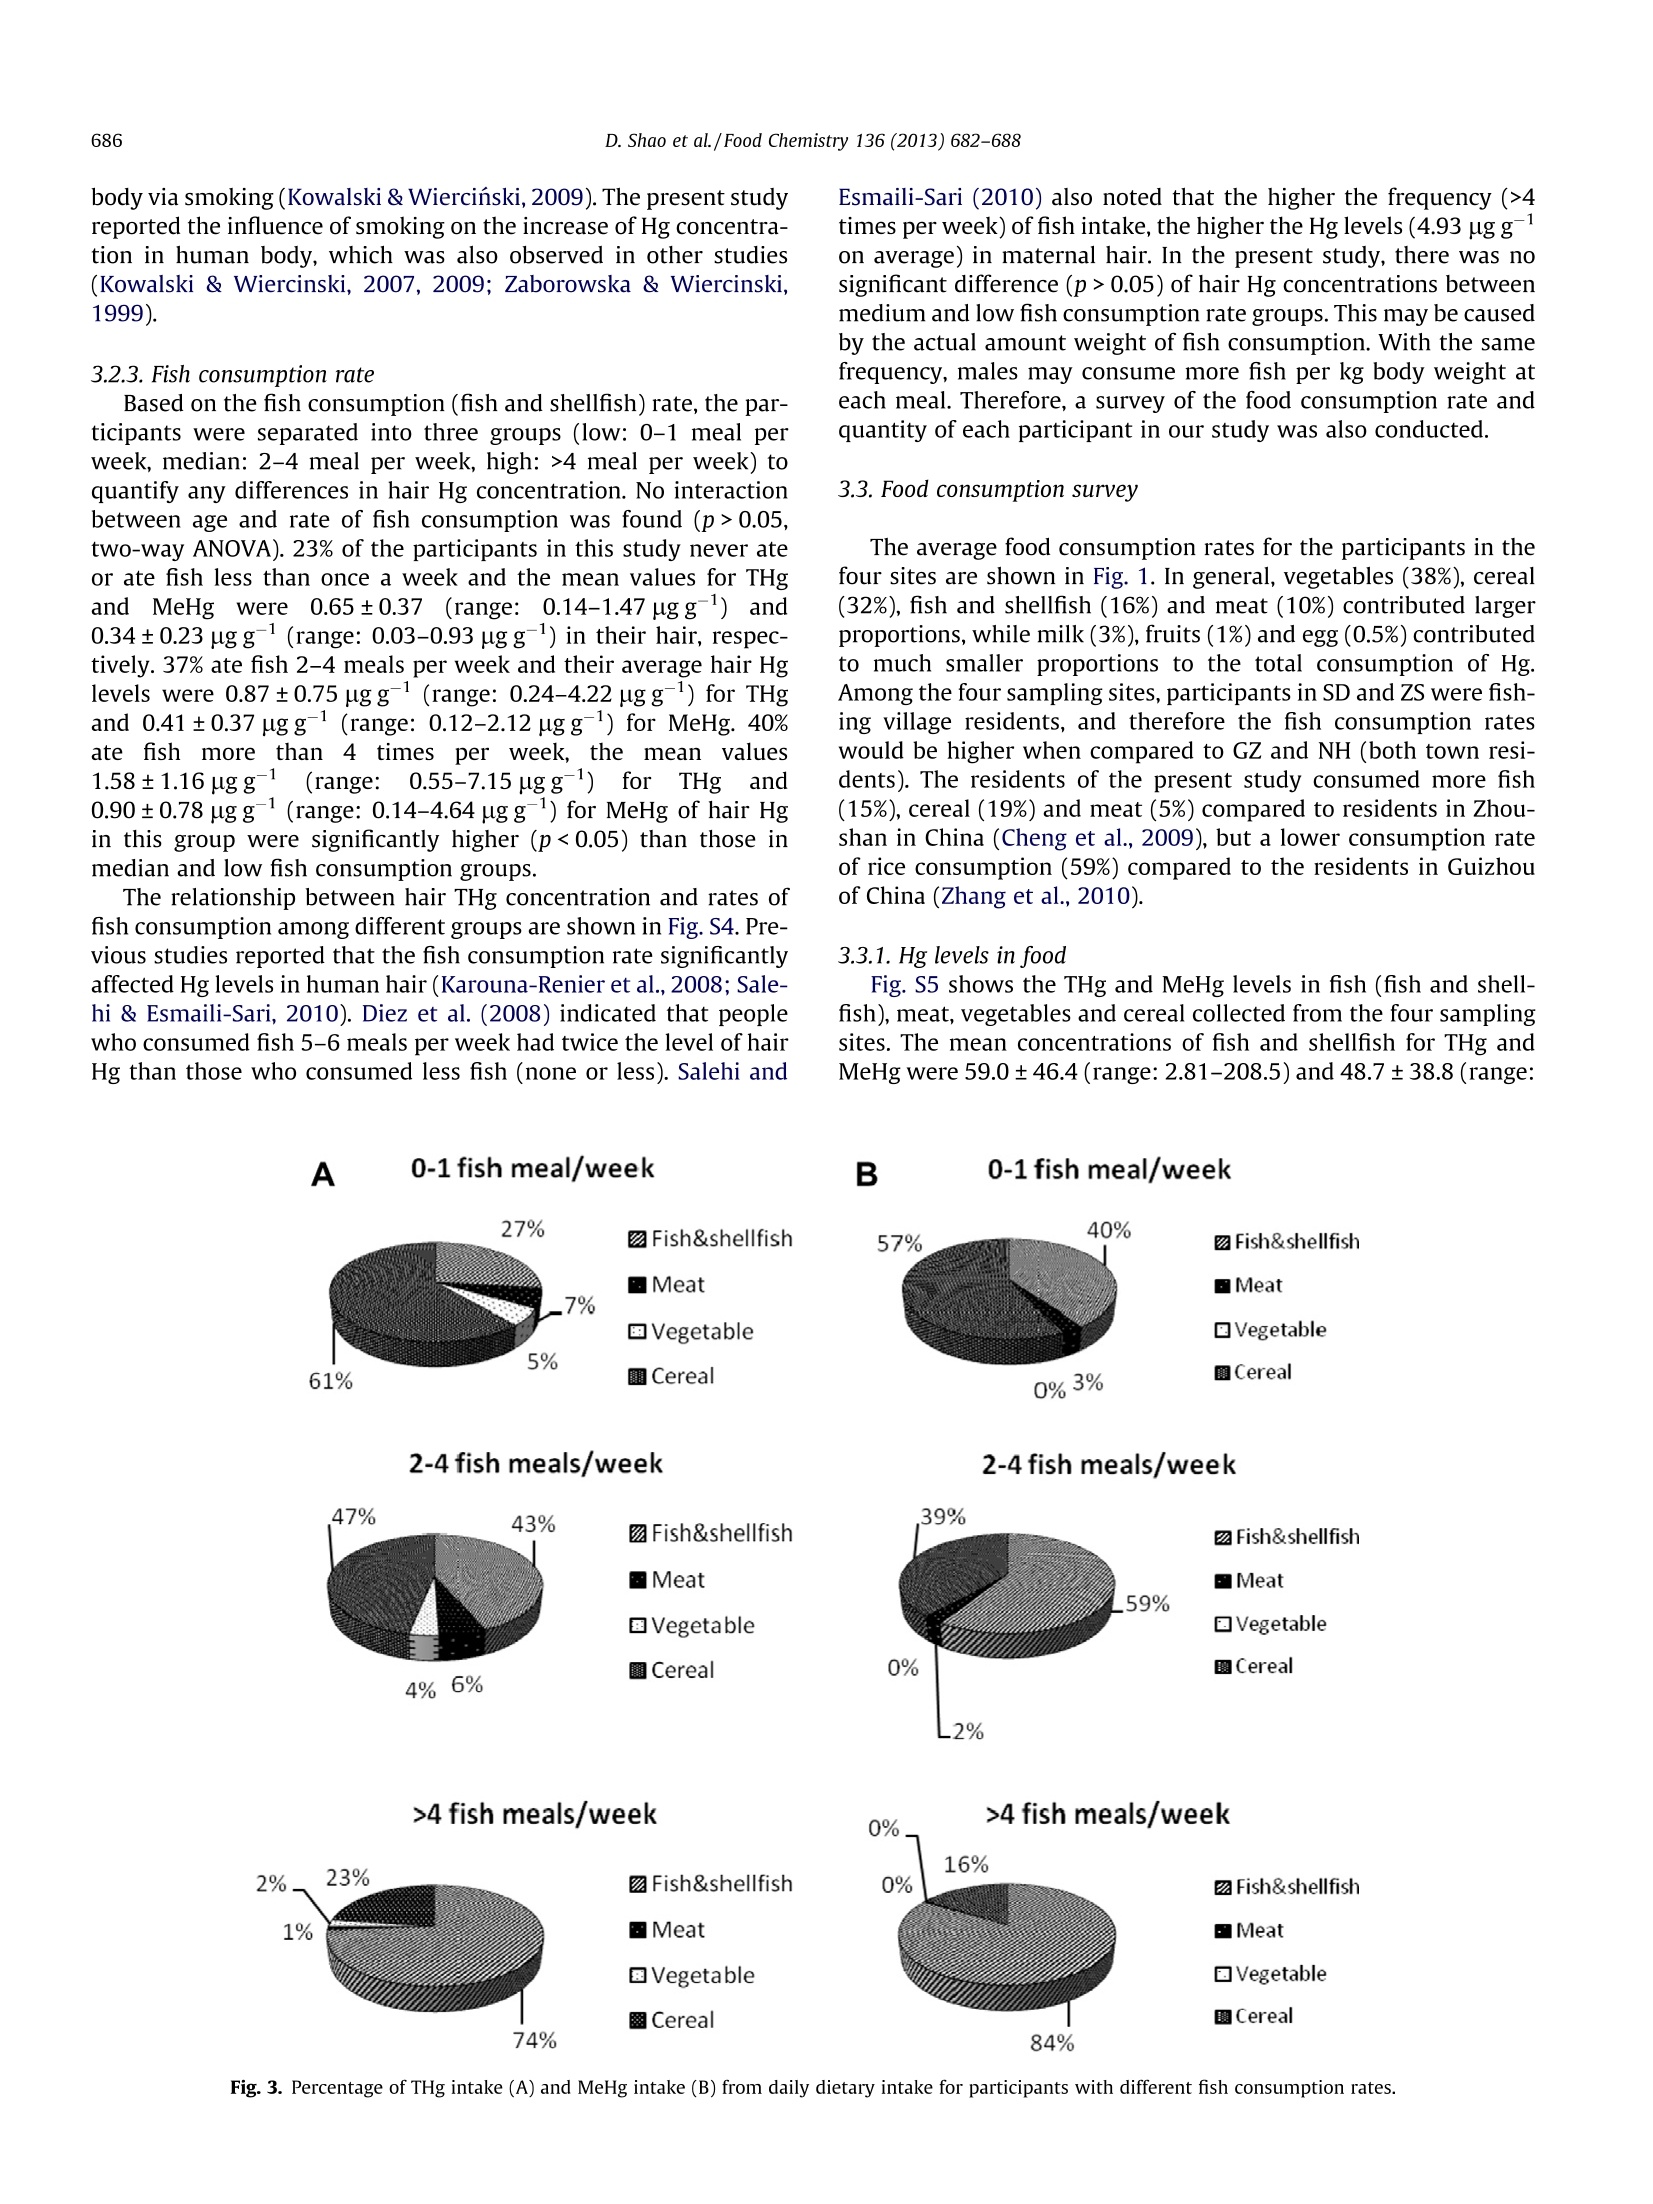
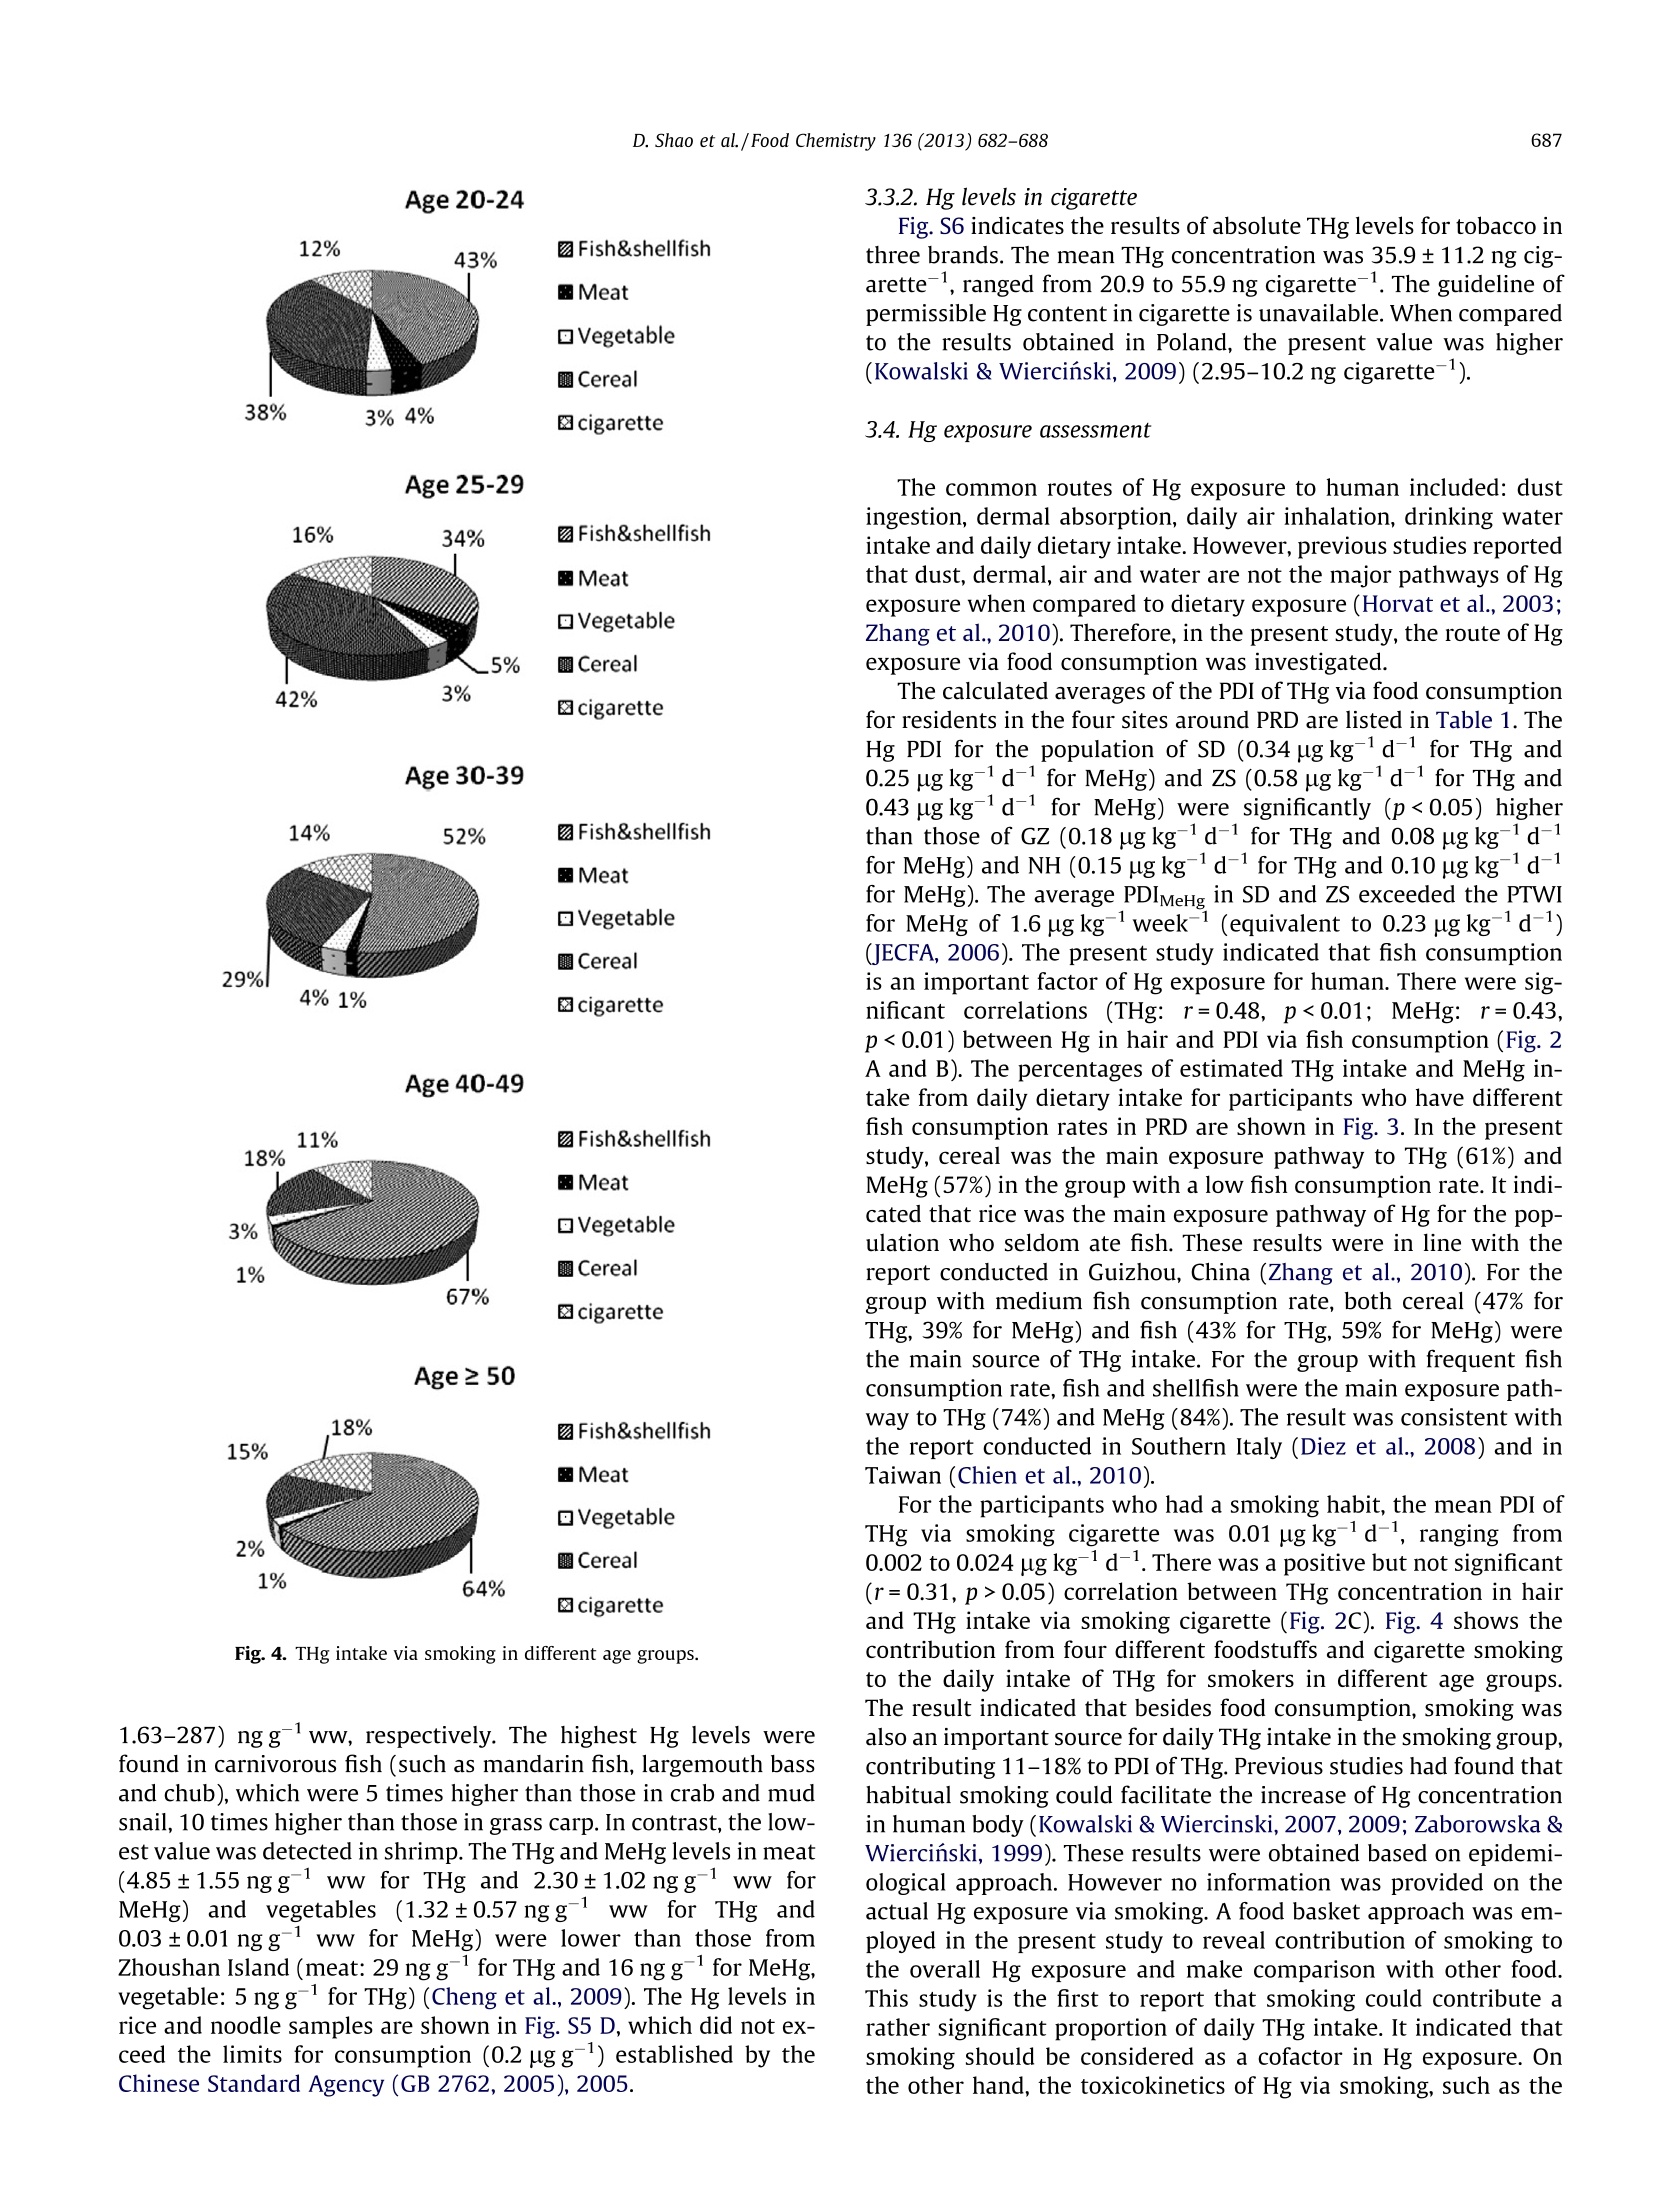
Food Chemistry 136(2013)682-688 683D. Shao et al./Food Chemistry 136 (2013) 682-688 Contents lists available at SciVerse ScienceDirect Food Chemistryjournal homepage: www.elsevier.com/locate/foodchem Hair mercury levels and food consumption in residents from the Pearl RiverDelta: South China Dingding Shao, Yuan Kang ,Zhang Cheng, Hongsheng Wang, Minjuan Huang,Shengchun Wu,Kunci Chen, Ming H. Wonga,* Croucher Institute for Environmental Sciences, and Department of Biology, Hong Kong Baptist University, Kowloon Tong, Hong Kong, PR China"Pearl River Fisheries Research Institute, Chinese Academy of Fishery Sciences, Guangzhou, PR China ARTICL EI N F O ABSTRACT Article history:Received 12 May 2011Received in revised form 13 July 2012Accepted 22 August 2012 Available online 2 September 2012 Keywords:MercuryMethylmercuryHairCigaretteFish consumption The Pearl River Delta (PRD) is located in the Southern part of China and is the main region for fish culturein Guangdong Province. In order to assess the potential health risks associated with dietary consumptionof mercury, hair samples from 91 urban, town and fishing village residents, 37 species of fish, cereal, veg-etables, and meat samples were collected. The average total mercury (THg) and methylmercury (MeHg)concentrations in hair were 1.08±0.94 and 0.58±0.59 pg/g, respectively. Daily Hg intake via fish con-sumption is significantly correlated with THg and MeHg accumulated in human hair (r=0.48, p<0.01;r=0.43, p<0.01). The estimated daily intake of Hg via different food types showed that both fish and cer-eal consumption were the two main routes of Hg exposure for residents in the sampling areas. Besidesfood intake, smoking was also an important source for daily THg intake in the smokegroup, contributing11-18%to EDI of THg. ◎ 2012 Elsevier Ltd. All rights reserved. 1. Introduction Mercury (Hg) is a potent neurotoxin of significant ecologicaland public health concern. Vapourised elemental Hg emitted intothe atmosphere by mining and coal combustion may be over trans-ported very long distances and contaminate water and soil upondeposition. Although Hg is deposited primarily in its inorganicform, it can be converted by microbial activity into a more toxicform: methylmercury (MeHg) under anaerobic conditions (Har-mon, King, Gladden, & Newman,2007). Toxicity of MeHg can beexacerbated by bioaccumulation and biomagnification throughfood webs in aquatic systems (Cheng et al., 2011;Jaeger, Hop, &Gabrielsen, 2009). Fish consumption is considered the main source of MeHg expo-sure in populations that are not occupationally exposed (Johnsson,Sallsten, Schutz, Sjors, & Barregard, 2004). About 75-100% of Hg infish exists as MeHg (Shao et al., 2011). Chien, Gao, and Lin (2010)revealed that people who consumed greater quantities of fishhad higher hair Hg concentrations (r=0.32, p<0.0001). In Kuwait,there were significant differences in MeHg concentrations in fish-ermen hair between high and low fish consumption groups (Al-Majed & Preston, 2000). In addition, cereals and cereal productsare the largest source of dietary Hg intake in China (54%) (Jiang,Shi, & Feng, 2006). A recent study indicated that rice is the main ( * C orresponding author. Tel.: +852 3411 7746; fax: +852 3411 7 743. E-mail address: mhwong@hkbu.edu.hk (M.H. Wong). ) ( 0308-8146/$ -see front ma t ter @ 201 2 Else v ier Ltd. All rights re s erved. h t tp://dx. d oi.org/10.10 1 6/j. f o o dchem.2012.08. 0 59 ) route of MeHg exposure for residents whom seldom consumed fishmeals (1.2 g day-), accounted for 94-96% of the PDI of MeHg inGuizhou province of China (Zhang, Feng, Larssen, Qiu, & Vogt,2010). The levels of THg in human hair are also influenced by theirsmoking cigarettes. The concentration of THg is significantly higherfor smokers as compared to non-smoking groups (Kowalski &Wiercinski, 2007). Heavy metal (Cd, Cu, Pb, Cr,Zn, Hg) concentra-tions of tobacco had been determined in 47 brands of cigarettesfrom five countries. The average THg concentration ranged be-tween 0.02 and 0.11 ugg-, and 0.04 ugg- for China (GermanMiller, 2000). Mercury concentrations in hair and blood have been widely usedas biomarkers for human Hg exposure. The normal ratio of Hg inhair(ugg)and blood (ng L-1) is frequently cited as 250:1 (UsEPA, 1997). When compared to blood, hair is more widely used asa non-invasive method with higher element concentrations (Salehi& Esmaili-Sari, 2010). Moreover, MeHg can accumulate in hairduring growth (1 cm per month), and hair MeHg concentrationcan possibly reflect longer-term MeHg exposure (Karouna-Renieret al., 2008).It has been noted that MeHg exposure may cause anincreased risk of foetal brain damage if the maternal hair Hgconcentration exceeds a level of 10-20 pg g(WHO, 1990). Forinstance, the high dose of MeHg exposure in Minamata of Japanand in Iraq during the 1970 caused foetal death, serious birthdefects, mental retardation and blindness (NRC,2000). It has beennoted that higher maternal Hg levels (>1.2 ugg-) are associatedwith lower offspring cognition (Oken et al., 2005). Table 1Average daily intake of THg and MeHg through major food consumption for population (body weight 58 kg) in PRD. Food item Intake rate (g day-) THg daily intake (ug day) MeHg daily intake (ug day-) GZ NH SD ZS GZ NH SD ZS Fish 52-341 2.42 3.98 15.2 28.9 1.89 3.54 12.8 23.0 Meat 82-113 0.19 0.50 0.90 0.34 0.12 0.24 0.42 0.14 Vegetable 224-541 0.32 0.44 0.44 0.90 0.01 0.01 0.02 0.02 Cereal 261-357 7.32 3.66 3.22 3.50 2.69 1.92 1.54 1.82 Total ug day 10.3 8.58 19.8 33.6 4.71 5.71 14.8 25.0 ugkgday 0.18 0.15 0.34 0.58 0.08 0.10 0.25 0.43 The Pearl River Delta (PRD) is located in the Southern part ofChina and is the main region for fish culture in GuangdongProvince. Shao et al. (2011) showed that the fish collected fromfreshwater fish ponds in PRD contained MeHg ranging from5.93-76.1 ngg-1wet wt, and consumption of carnivorous fishmight impose health risk to PRD residents, especially for children.However, assessment results may be influenced by uncertainly fac-tors such as fish ingestion rates and quantities. Besides, personalinformation such as age, gender, body weight and height, food con-sumption customs, as well as smoking and drinking habits shouldalso be considered. So far, there is a lack of studies investigating theHg levels and the main source of Hg exposure in residents of PRD. The major objectives of the present study were to (1) assess Hg exposure by measuring THg and MeHg in the hair of residents in PRD and to (2) evaluate human exposure to Hg via dietary intake and cigarette smoking, in order to quantify the main source of Hg intake at sampling sites. 2. Materials and methods 2.1. Sample collection 2.1.1. Questionnaire survey Food consumption pattern such as type and average daily in-take of cereal, vegetables, meat, and fish was collected. A question-naire was used to collect information from volunteers in order toassess their dietary habits. Other information including age,weight, profession, dental fillings, smoking and alcohol drinkinghabits were also collected. 2.1.2. Hair sample collection Using clean stainless steel scissors, 30, 20, 20 and 21 humanhair samples were collected from four communities in Guangdongprovince (Fig. S1): Guangzhou (GZ: residential area), Nanhai (NH:town), Shunde (SD: fishing village) and Zhongshan (ZS: fishing vil-lage), respectively. Volunteers from Guangzhou and Nanhai in-cluded students, teachers, office workers and farmers, agedbetween 20 and 45 years. In addition, the volunteers from two fishvillages in Shunde and Zhongshan,, included fishermen and farm-ers aged between 24 and 54 years. The hair samples were taken from several sites of the scalp (1-3 cm), placed and sealed in cleanpolyethylene bag until chemical analysis. 2.1.3. Food and cigarette sample collection The selection of food items for analyses was based on the resultsof food consumption survey, as well as their availability in the localmarkets or grocery stores. Therefore, four major food groups: (1)fish and shellfish, (2) meat, (3) vegetables, and (4) cereals were se-lected in the present study (Table S1, Supporting Information).Eight species of freshwater fish and three species of shellfish werecollected from local fish ponds and fish markets. Twenty species ofvegetables, four types of meat and two kinds of cereal sampleswere collected from local markets. In addition, three popular ciga-rette brands were bought from tobacco stores. As a general guide-line, each type of sample with four replicates each was randomlypurchased from three different shops/stalls in each market. 2.2. Hair and food sample analyses Hair samples were cut into short segments (about 5 mm) andwashed successively with acetone and Milli-Q water, and driedin an oven at 60 °℃ overnight. Fish (dorsal muscles), meat and veg-etable samples were freeze-dried, crushed, and ground into pow-der. Hair, vegetable, meat and rice samples were digested usingKOH-methanol/solvent extraction technique for the detection ofMeHg (Liang, Bloom, & Horvat, 1994; Liang, Horvat, Cernichiari,Gelein, & Balogh,1996). 0.1-0.2 g sample was digested with 25%KOH methanol (2.5mL) in an oven at 70 ℃ for 3 h. The solutionwas diluted to 20 mL with methanol after cooling. The solution(30 ul) was added to 40 mL vials with Teflon lined septa caps. Sam-ples were buffered (300 uL) to pH 4.9, ethylated with the additionof NaBEt4 (40 uL), and made up to volume with Milli-Q water,capped, shaken and loaded into the auto sampler of the MeHg ana-lyzer. It was ensured that the vials were absent of air by fillingMilli-Q water. The THg concentration was analysed by the direct mercury ana-lyzer DMA-80 (Milestone,USA) following US EPA Method 7473 (USEPA, 1998). Measurements of MeHg were conducted using theautomated modular mercury system from Brooks Rand (MERX,Brooks Rand Labs, USA). Sampling site n Mean age (y) Height (cm) Weight (kg) Smoking percent (%) Fish meals per week Hg concentration (ugg) Mean± SD Range GZ 30 24.5 167 57.2 3.33 1.70 THg 0.39±0.25 0.14-1.11 MeHg 0.22±0.10 0.03-0.67 NH 20 29.2 163 56.1 20.0 1.95 THg 0.84±0.41 0.25-1.69 MeHg 0.41±0.19 0.19-0.77 SD 20 40.1 166 60.9 45.0 3.30 THg 1.39±1.43 0.45-7.15 MeHg 0.86±0.99 0.15-4.64 ZS 21 43.8 165 58.1 52.4 3.67 THg 1.78±0.84 0.55-4.22 MeHg 0.93±0.46 0.14-2.12 2.3. Cigarette sample determination Cigarettes of each brand were divided into two parts whichwere stored in desiccators to prevent from drying. One part of eachsample was subjected to determination of THg concentration in to-bacco and filter, and the other part was simulated smoking by asyringe with subsequent determination of THg content in ashand filter. THg determination was carried out using the samemethod as hair and food samples. 2.4. QA/QC Quality control system consisted of method blanks, blankspikes, matrix spikes, Certified reference materials (CRM) and blindduplicates. The limits of determination were 0.05 ng g- for THg inall samples and 0.02 nggfor MeHg in both hair and food sam-ples, respectively. The accuracy of Hg analysis was examined byusing SRM with each batch of samples (set of 20 samples). Therecovery rates varied between 94.6 and 105% for THg and 94.6%and 98.0% for MeHg (Table S2, Supporting Information). Threeblank samples were also run with each set. The results showedundetectable levels of THg and MeHg in all the analysed blanksamples. In order to check the reproducibility of the analysis, 22%of the samples were analysed in duplicate. 2.5.Calculation of probable daily intake (PDI) To determine THg and MeHg exposure via food consumptionand smoking, the probable daily intake (PDI) values for the generaladult population were calculated according to the followingformula: where PDI is given in micrograms per kilogram of body weight(bw)per day; body weight=58 kg; C is the concentration of exposedmedium; IR is intake rate, and i= intake of fish, meat, vegetable, riceand cigarette. The intake rates for different exposure media for theadult populations used were based on the questionnaire survey(Table 1). THg absorption was calculated using the following formula(Kowalski & Wiercinski, 2009): where C is the THg concentration; 80% is the percentage of THgretention in the organism via smoke available for absorption inthe lung. 2.6. Statistical analyses The relationship between mercury in hair and PDI of mercuryvia fish consumption was determined by linear regression. Groupdifference in Hg concentrations of hair was tested by two-way AN-OVA. These statistical analyses were performed using the Statisti-cal Package for Social Sciences(SPSS)i)13.0.The level ofsignificance was set at p<0.05. 3.Results and discussion 3.1. THg and MeHg in hair The mean THg and MeHg concentrations in the hair samples ofparticipantsy weree1.08±0.94ugg(0.14-7.15) and 0.58±0.59 ugg(0.03-4.64), respectively. 39.6% of the population ex-ceeded the safety standard of 1 uggfor hair Hg, correspondingto the reference dose (RfD) of 0.1 ug kg- body weight d- (USEPA,1997), and 8.8% of the population had THg levels higher thanhair Hg concentration for non-exposed people of 2 ugg(Foulke,1994). None of the data exceeded the WHO tolerance limit of 10 ugg(WHO, 1990). MeHg in the hair was significantly corre-lated with THg in the hair (r²=0.81, p<0.01,Fig. S2), which is sim-ilar to other studies (Feng et al., 2008; McDowell et al., 2004).MeHg in the hair accounted for, on average, 50-60% of THg forthe residents in the PRD, similar to the results by Li et al. (2009)and Feng et al. (2008). Most of the previous studies reported thatMeHg constituted 70-100% of THg in hair and the major exposureroute was through fish consumption (Al-Majed & Preston, 2000;Barbosa,Jardim, Dorea, Fosberg, & Souza, 2001; McDowell et al.,2004). There was no specific Hg contamination source such as goldmining, coal combustion and fluorescent light factory locatedaround the studied area, which may exclude the possibility of ele-vation of inorganic Hg concentration in hair samples through Hgvapour exposure. This ratio difference might have resulted fromthe diet of the sampled populations. Apart from fish, cereal, vege-tables and meat were also major dietary routes in the presentstudy. The percentages of inorganic Hg as Hg in cereal and vegeta-bles from the PRD were close to 80% and 100%, respectively. There-fore, the inorganic Hg exposure through diet ingestion (for rice andvegetable) was very high, even though the absorbed proportion ofinorganic Hg is very low (8%;WHO, 1991). This may also beresponsible for the low percentages of Hg as Me-Hg in the hairsamples. Table 2 shows the Hg levels in hair samples collectedfrom GZ, NH, SD and ZS. Concentrations of THg and MeHg in hairsamples collected from SD and zs were significantly higher(p<0.05) than those from GZ and NH. A significant correlation(y=0.586x-0.053,r=0.93,p<0.01)between THg and MeHg con-centrations for participants was observed.Compared with studieson Chinese coastal people, the average concentration of THg inthe hair in the present study was similar to that found in thoseof residents in Shanghai (0.5 ug g), Xiamen (0.8 ugg-) andNingbo (1.0ugg), but lower than that in fishermen fromZhoushan (2.1 ugg) (Liu et al.,2008). This may be explained byhigh consumption rate (241.2 g day-) of fish for fishermen inZhoushan. 3.2. Influencing factors The personal information of the participants is shown in Table 2.The results showed that the participants from GZ (24.5 years ofaverage age) and NH (29.2) were younger than those from SD(40.1) and ZS (43.8). They exhibited a relative narrow range of bodyweight and height. The percentages of participants who had smok-ing habit in SD (45.0%) and ZS (53.4%) were higher than those in GZ(3.33%) and NH (20.0%). In addition, the food consumption ratesespecially for daily fish consumption rates were different (Numberof weekly fish meal: GZ 1.7, NH 1.9, SD 3.3, ZS 3.7) among thesefour areas. None of the participants had dental problem or amal-gam fillings. Therefore, the levels of THg and MeHg were evaluatedin relation to the following factors. 3.2.1. Age The hair Hg concentrations in different age groups and statisticdifferences among all age groups are shown in Fig. S3. Significantpositive correlations (r=0.52, p<0.01; r=0.49, p<0.01) were ob-served between age and THg (MeHg) levels in hair of residents. Themean concentrations of THg increased with age up to 49 and de-creased thereafter. A similar trend was observed in MeHg concen-trations. The highest mean values for THg and MeHg were2.12±1.57 and 1.21±1.01 pg gin the age group of 40-49 years,respectively; the lowest values for THg and MeHg were 0.57±0.32and 0.27±0.18 ug g-for the age group of 25-29 years. These results agreed with the findings of Liu et al.(2008) whofound that the total hair Hg increased between twenties and for-ties, and then gradually decreased with age. Al-Majed and Preston,(2000) also showed that the THg and MeHg decreased in human hair after 45 years of age. However, Buzina et al.(1995) reportedthat the THg content of hair did not increase after 40 and 35 yearsof age, respectively. It seems apparent that body burden of Hg in-creased with age due to gradual accumulation, and cannot be eas-ily excreted from human bodies. However, the reason why Hgcontent in hair decreased after 45 years old needs further investi-gation. One possible explanation is due to inclusion of grey hairsfrom the sample before analysis, as grey hairs have no Hg content(Al-Majed & Preston, 2000). 3.2.2. Smoking habit In the present study, 27.5% of participants had cigarette smok-ing habit, and 36% of the smokers were older than 50 years old.Two-way ANOVA test showed there was no interaction betweenage and smoking habit (p>0.05). The mean THg and MeHg levelsin the hair of the smoking groupwere1.76±1.40 and0.98±0.90 ug g, respectively, which were significantly higher(p<0.05) than the values of 0.82±0.51 and 0.42±0.32 ugg-forTHg and MeHg levels in the hair of non-smoking group. This maybe explained by Hg contained in tobacco may enter into human Fig. 2. The relationships between (A) THg concentrations in hair and PDITHg via fishconsumption, (B) MeHg concentrations in hair and PDIMeHg via fish consumption,(C) THg concentrations in hair and THg intake via smoking cigarette. body via smoking (Kowalski & Wiercinski, 2009). The present studyreported the influence of smoking on the increase of Hg concentra-tion in human body, which was also observed in other studies(Kowalski & Wiercinski, 2007,2009; Zaborowska & Wiercinski,1999). 3.2.3. Fish consumption rate Based on the fish consumption (fish and shellfish) rate, the par-ticipants were separated into three groups (low: 0-1 meal perweek, median: 2-4 meal per week, high: >4 meal per week) toquantify any differences in hair Hg concentration. No interactionbetween age and rate of fish consumption was found (p>0.05,two-way ANOVA). 23% of the participants in this study never ateor ate fish less than once a week and the mean values for THgand MeHg were 0.65±0.37((range: 0.14-1.47 ugg-l) and0.34±0.23 ugg(range: 0.03-0.93 ug g) in their hair, respec-tively. 37% ate fish 2-4 meals per week and their average hair Hglevels were 0.87±0.75 pgg(range: 0.24-4.22ugg) for THgand 0.41±0.37 ugg(range: 0.12-2.12 pgg) for MeHg. 40%ateifish moretthan 4ttimes per week, the mean values1.58±1.16 pgg1 ((1range: 0.55-7.15 ugg-) fforTHgand0.90±0.78 ugg-(range: 0.14-4.64 ugg-) for MeHg of hair Hgin this group were significantly higher (p<0.05) than those inmedian and low fish consumption groups. The relationship between hair THg concentration and rates offish consumption among different groups are shown in Fig. S4. Pre-vious studies reported that the fish consumption rate significantlyaffected Hg levels in human hair (Karouna-Renier et al., 2008; Sale-hi & Esmaili-Sari, 2010). Diez et al.(2008) indicated that peoplewho consumed fish 5-6 meals per week had twice the level of hairHg than those who consumed less fish (none or less). Salehi and 2% Esmaili-Sari (2010) also noted that the higher the frequency (>4times per week) of fish intake, the higher the Hg levels (4.93 pggon average) in maternal hair. In the present study, there was nosignificant difference (p>0.05) of hair Hg concentrations betweenmedium and low fish consumption rate groups. This may be causedby the actual amount weight of fish consumption. With the samefrequency, males may consume more fish per kg body weight ateach meal.Therefore, a survey of the food consumption rate andquantity of each participant in our study was also conducted. 3.3. Food consumption survey The average food consumption rates for the participants in thefour sites are shown in Fig. 1. In general,vegetables (38%), cereal(32%), fish and shellfish (16%) and meat (10%) contributed largerproportions, while milk (3%), fruits (1%) and egg (0.5%) contributedto much smaller proportions to the total consumption of Hg.Among the four sampling sites, participants in SD and ZS were fish-ing village residents, and therefore the fish consumption rateswould be higher when compared to GZ and NH (both town resi-dents). The residents of the present study consumed more fish(15%), cereal (19%) and meat (5%) compared to residents in Zhou-shan in China (Cheng et al., 2009), but a lower consumption rateof rice consumption (59%) compared to the residents in Guizhouof China (Zhang et al., 2010). 3.3.1. Hg levels in food Fig. S5 shows the THg and MeHg levels in fish (fish and shell-fish), meat, vegetables and cereal collected from the four samplingsites. The mean concentrations of fish and shellfish for THg andMeHg were 59.0±46.4 (range: 2.81-208.5) and 48.7±38.8 (range: Age 20-24 Fig. 4. THg intake via smoking in different age groups. 1.63-287) ng g ww, respectively. The highest Hg levels werefound in carnivorous fish (such as mandarin fish, largemouth bassand chub), which were 5 times higher than those in crab and mudsnail, 10 times higher than those in grass carp. In contrast, the low-est value was detected in shrimp. The THg and MeHg levels in meat(4.85±1.55 ngg;1 ww for THg and 2.30±1.02 ngg-ww forMeHg) and vegetables (1.32±0.57 nggww for THg and0.03±0.01 ng ggww for MeHg) were lower than those fromZhoushan Island (meat: 29 ngg-for THg and 16 ng g-for MeHg,vegetable: 5 ng g- for THg) (Cheng et al., 2009). The Hg levels inrice and noodle samples are shown in Fig. S5 D, which did not ex-ceed the limits for consumption (0.2 ug g) established by theChinese Standard Agency (GB 2762,2005), 2005. 3.3.2. Hg levels in cigarette Fig. S6 indicates the results of absolute THg levels for tobacco inthree brands.The mean THg concentration was 35.9±11.2 ng cig-arette-l, ranged from 20.9 to 55.9 ng cigarette-. The guideline ofpermissible Hg content in cigarette is unavailable. When comparedto the results obtained in Poland, the present value was higher(Kowalski & Wiercinski, 2009) (2.95-10.2 ng cigarette). 3.4. Hg exposure assessment The common routes of Hg exposure to human included:dustingestion, dermal absorption, daily air inhalation, drinking waterintake and daily dietary intake. However, previous studies reportedthat dust, dermal, air and water are not the major pathways of Hgexposure when compared to dietary exposure (Horvat et al., 2003;Zhang et al.,2010). Therefore, in the present study, the route of Hgexposure via food consumption was investigated. The calculated averages of the PDI of THg via food consumptionfor residents in the four sites around PRD are listed in Table 1. TheHg PDI for the population of SD (0.34 ugkg-d-1 for THg and0.25 pgkg d-for MeHg) and ZS (0.58 pg kgd-1 for THg and0.43 ugkg-d-1for MeHg) were significantly (p<0.05) higherthan those of GZ (0.18 ug kgd- for THg and 0.08 ug kg d-for MeHg) and NH(0.15 pg kg-d-1 for THg and 0.10 ug kg d-1for MeHg). The average PDIMeHg in SD and ZS exceeded the PTWIfor MeHg of 1.6 ugkg-week- (equivalent to 0.23 ug kg-d-1)(JECFA, 2006). The present study indicated that fish consumptionis an important factor of Hg exposure for human. There were sig-nificant correlations (THg: r=0.48, p<0.01; MeHg:r=0.43,p<0.01) between Hg in hair and PDI via fish consumption (Fig. 2A and B). The percentages of estimated THg intake and MeHg in-take from daily dietary intake for participants who have differentfish consumption rates in PRD are shown in Fig. 3. In the presentstudy, cereal was the main exposure pathway to THg (61%) andMeHg (57%) in the group with a low fish consumption rate. It indi-cated that rice was the main exposure pathway of Hg for the pop-ulation who seldom ate fish. These results were in line with thereport conducted in Guizhou, China (Zhang et al., 2010). For thegroup with medium fish consumption rate, both cereal (47% forTHg, 39% for MeHg) and fish (43% for THg, 59% for MeHg) werethe main source of THg intake. For the group with frequent fishconsumption rate, fish and shellfish were the main exposure path-way to THg (74%) and MeHg (84%). The result was consistent withthe report conducted in Southern Italy (Diez et al., 2008) and inTaiwan (Chien et al., 2010). For the participants who had a smoking habit, the mean PDI ofTHg via smoking cigarette was 0.01 ugkgd-1, ranging from0.002 to 0.024 ug kgd-1. There was a positive but not significant(r=0.31, p>0.05) correlation between THg concentration in hairand THg intake via smoking cigarette (Fig. 2C). Fig. 4 shows thecontribution from four different foodstuffs and cigarette smokingto the daily intake of THg for smokers in different age groups.The result indicated that besides food consumption, smoking wasalso an important source for daily THg intake in the smoking group,contributing 11-18% to PDI of THg. Previous studies had found thathabitual smoking could facilitate the increase of Hg concentrationin human body (Kowalski & Wiercinski, 2007,2009; Zaborowska &Wiercinski, 1999). These results were obtained based on epidemi-ological approach. However no information was provided on theactual Hg exposure via smoking. A food basket approach was em-ployed in the present study to reveal contribution of smoking tothe overall Hg exposure and make comparison with other food.This study is the first to report that smoking could contribute arather significant proportion of daily THg intake. It indicated thatsmoking should be considered as a cofactor in Hg exposure. Onthe other hand, the toxicokinetics of Hg via smoking, such as the pathway of Hg entering into human body via smoking should befurther investigated. It should be noted that the heterogeneity of the studied popula-tion including students, teachers, office workers, farmers and fish-men.could affect thestatistical results.Their workingenvironment, possibly related to Hg exposure, were not adjustedin the statistical analyses (two-way ANOVA and regression analy-ses)due to relative small sample size (n=91) in the present study.Furthermore, the relative small sample size would weaken the sta-tistical power and affect the results. For example, smoking wasidentified as an important source for daily THg intake in the smok-ing group,contributing 11-18% to PDI of THg. Whereas, THg con-centrations in hair in smoke group were not significant (r=0.31,p>0.05) correlated with THg intake via smoking cigarette, possiblydue to the small sample size. The significant difference among thedifferent fish consumption rate groups or between the smoker andnon-smoker group were observed, which also needs further inves-tigation to exclude the possibility of false-positive result resultingfrom small sample size. 4. Conclusion In the present study, THg and MeHg levels were determined inhair of residents in four areas of PRD. Hair Hg concentrations weremainly dependent on age, fish consumption and smoking habit.The results of Hg PDI calculation showed that fish and cereal con-sumption were the two main routes of Hg exposure. Besides foodintake, smoking was also a major source for daily THg intake inthe smoking group. Acknowledgements The authors are grateful to the Research Grants Council of theUniversity Grants Committee of Hong Kong (Central Allocation,Group Research, No. HKBU 01/7C and Special Equipment Grant,No. HKBU09) for financial support. Appendix A. Supplementary data Supplementary data associated with this article can be found, inthe online version, at http://dx.doi.org/10.1016/j.foodchem.2012.08.059. References Al-Majed,N.,& Preston, M. (2000). Factors influencing the total mercury and methylmercury in the hair of the fishermen of Kuwait. Environmental Pollution, 109,239-250. Barbosa, A. C., Jardim, W., Dorea, J. G., Fosberg, B., & Souza,J. (2001). Hair mercuryspeciation as a function of gender, age, and body mass index in inhabitants ofthe Negro river basin, Amazon, Brazil. Archives of Environmental Contaminationand Toxicology, 40, 439-444. Buzina, R., Stegnar, P., Buzinasuboticanec, K., Horvat, M., Petric, I., & Farley, T. M. M.(1995). Dietary mercury intake and human exposure in an Adriatic population.Science of the Total Environment, 170, 199-208. Cheng, J. P., Gao, L. L., Zhao, W. C., Liu, X. J., Sakamoto, M., & Wang, W. H. (2009).Mercury levels in fisherman and their household members in Zhoushan, China:Impact of public health. Science of the Total Environment, 407,2625-2630. Cheng, Z., Liang, P., Shao, D. D., Wu, S. C., Nie, X. P., Chen, K. C., etal. (2011). Mercurybiomagnification in the aquaculture pond ecosystem in the Pearl River Delta.Archives of Environmental Contamination and Toxicology, 61, 491-499. Chien, L. C., Gao, C. S., & Lin, H. H. (2010). Hair mercury concentration and fishconsumption: Risk and perceptions of risk among women of childbearing age.Environmental Research, 110, 123-129. Chinese National Standard Agency.(2005). Maximum levels of contaminants in foods(in Chinese). GB 2762-2005. pp.56-63. Diez, S., Montuori, P., Pagano, A., Sarnacchiaro, P., Bavona,J. M., & Triassi, M.(2008).Hair mercury levels in an urban population from Southern Italy: Fish consumption as a determinant of exposure. Environment International, 34,162-167. Foulke,J. E.(1994).Mercury in fish: Cause for concern? FDA Consumer, 28, 1-7. Feng, X. B., Li, P., Qiu, G. L., Wang, S. F., Li, G. H., Shang, L. H., et al. (2008). Humanexposure to methylmercury through rice intake in mercury mining areas,Guizhou Province, China. Environmental Science and Technology, 42, 326-332. German Muller, D. E. A. N. N. R. (2000). Heavy metal (Cd, Cu, Pb, Cr, Zn, Hg)concentrations in tobacco of commonly smoked cigarette brands purchased inGermany, China, Russia, India and Canada. In Nriagu, J. (Ed.), 11th Annualinternational conference on heavy metals in the environment. University ofMichigan, School of Public Health, Ann Arbor, MI. Harmon, S., King, J., Gladden, J., & Newman, L. (2007). Using sulfate-amendedsediment slurry batch reactors to evaluate mercury methylation. Archives ofEnvironmental Contamination and Toxicology, 52, 326-331. Horvat, M., Nolde, N., Fajon, V., Jereb, V., Logar, M., Lojen, S., et al. (2003). Totalmercury, methylmercury and selenium in mercury polCLLluted areas in theprovince Guizhou, China. Science of the Total Environment, 304,231-256. Jaeger, I, Hop, H., & Gabrielsen, G. W. (2009). Biomagnification of mercury inselected species from an Arctic marine food web in Svalbard. Science of the TotalEnvironment, 407,4744-4751. JECFA. (2006). Summary and conclusions of the sixty-seventh meeting of the JointFood and Agriculture Organization/World Health Organization ExpertCommittee on Food Additives.JECFA/67/SC, Rome, 5, July 2006. Jiang G. B., Shi, J. B., & Feng, X. B. (2006).Mercury pollution in China.EnvironmentalScience & Technology,40, 3672-3678. Johnsson, C., Sallsten, G., Schutz, A., Sjors, A., & Barregard, L. (2004). Hair mercurylevels versus freshwater fish consumption in household members of Swedishangling societies. Environmental Research, 96, 257-263. Karouna-Renier, N. K., Rao, K. R., Lanza,J.J., Rivers, S. D., Wilson, P. A., Hodges, D. K.,et al.(2008).Mercury levels and fish consumption practices in women of child-bearing age in the Florida Panhandle. Environmental Research, 108, 320-326. Kowalski, R., & Wiercinski,J.(2007). Determination of total mercury concentrationin hair of Lubartow-area citizens (Lublin Region, Poland). Polish Journal ofEnvironmental Studies, 16,75-79. Kowalski, R., & Wiercinski,J. (2009). Mercury content in smoke and tobacco fromselected cigarette brands. Ecological Chemistry and Engineering, 16,155-162. Li, S. X., Zhou, L. F., Wang, H. J., Liang, Y.G., Hu, J.X., Chang, J. B., et al. (2009). Feedinghabits and habitats preferences affecting mercury bioaccumulation in 37subtropical fish species from Wujiang River, China. Ecotoxicology,18, 204-210. Liang, L., Bloom, N., & Horvat, M. (1994). Simultaneous determination of mercuryspeciation in biological materials by GC/CVAFS after ethylation and room-temperature precollection. Clinical Chemistry, 40, 602-607. Liang, L., Horvat, M., Cernichiari, E., Gelein, B., & Balogh, S. (1996). Simple solventextraction technique for elimination of matrix interferences in thedetermination of methylmercury in environmental and biological samples byethylation-gas chromatography-cold vapor atomic fluorescence spectrometry.Talanta, 43,1883-1888. Liu, X., Cheng, J., Yuling, S., Honda, S., Wang, L., Liu, Z., et al. (2008). Mercuryconcentration in hair samples from Chinese people in coastal cities. Journal ofEnvironmental Sciences, 20,1258-1262. McDowell, M. A., Dillion, C. F., Osterloh, J., Bolger, P. M., Pellizzari, E., Fernando, R.,et al. (2004). Hair mercury levels in U.S. children and women of childbearingage: Reference range data from NHANES 1999-2000. Environmental HealthPerspectives, 112, 1165-1171. NRC (National Research Council). (2000). Committee on the toxicological effects ofmethylmercury. Toxicological effects of methylmercury. Washington, DC: NationalAcademy Press. Oken, E., Wright, R. O., Kleinman, K. P., Bellinger, D., Amarasiriwardena, C. J., Hu, H.,et al.(2005). Maternal fish consumption, hair mercury, and infant cognition in aUS cohort. Environmental Health Perspectives, 113, 1376-1380. Salehi, Z., & Esmaili-Sari, A. (2010). Hair mercury levels in pregnant women inMahshahr, Iran: Fish consumption as a determinant of exposure. Science oftheTotal Environment, 408,4848-4854. Shao, D., Liang, P., Kang, Y., Wang, H., Cheng, Z., Wu, S., et al.(2011). Mercury speciesof sediment and fish in freshwater fish ponds around the Pearl River Delta, PRChina: Human health risk assessment. Chemosphere, 83, 443-448. US EPA. (1997). Mercury Study Report to the Congress. EPA 452/R-97-0003,Washington, DC: US Environmental Protection Agency US EPA. (1998). Mercury in solids and solutions by thermal decomposition,amalgamation, and atomic absorption spectrophotometry, Draft Method7473.Washington, DC: USEPA. WHO.(1990). International Programme on Chemical Safety, pp. 101. WHO. (1991). Environmental health criteria 118: Inorganic mercury. Geneva: WorldHealth Organization. Zaborowska, W., & Wiercinski, J. (1999). Levels of total mercury in scalp hair ofchildren and youth from the selected rural area of Lublin district. Roczn. PZH,50,49-55. Zhang, H., Feng, X. B., Larssen, T., Qiu, G. L.,& Vogt, R. D. (2010).In inland China, rice,rather than fish, is the major pathway for methylmercury exposure.Environmental Health Perspectives, 118,1183-1188.
确定


还剩5页未读,是否继续阅读?

产品配置单

仪真分析仪器有限公司为您提供《头发中汞含量测定与食物摄入关系检测方案 》,该方案主要用于毛发/头发中汞含量测定与食物摄入关系检测,参考标准--,《头发中汞含量测定与食物摄入关系检测方案 》用到的仪器有MERX全自动烷基汞分析系统
推荐专场


相关方案
更多
该厂商其他方案
更多