


方案详情
文
生物样品的分析往往因基质复杂会引起色谱的峰展宽和灵敏度及检测限的下降。目前常用的方法是提高监测器灵敏度,采用预柱处理等。另外可以使用大体积进样的方式,可以在一定程度上改善这样的问题,但是将生物样品直接进行大体积进样,其中复杂的基质成份也会引起。因此生物样品的在大体积进样前通常需要先进行离线固相萃取进行样品净化。但是对于血浆或者尿液进行固相萃取的条件开发也非常费时,需要耗费大量的人力。
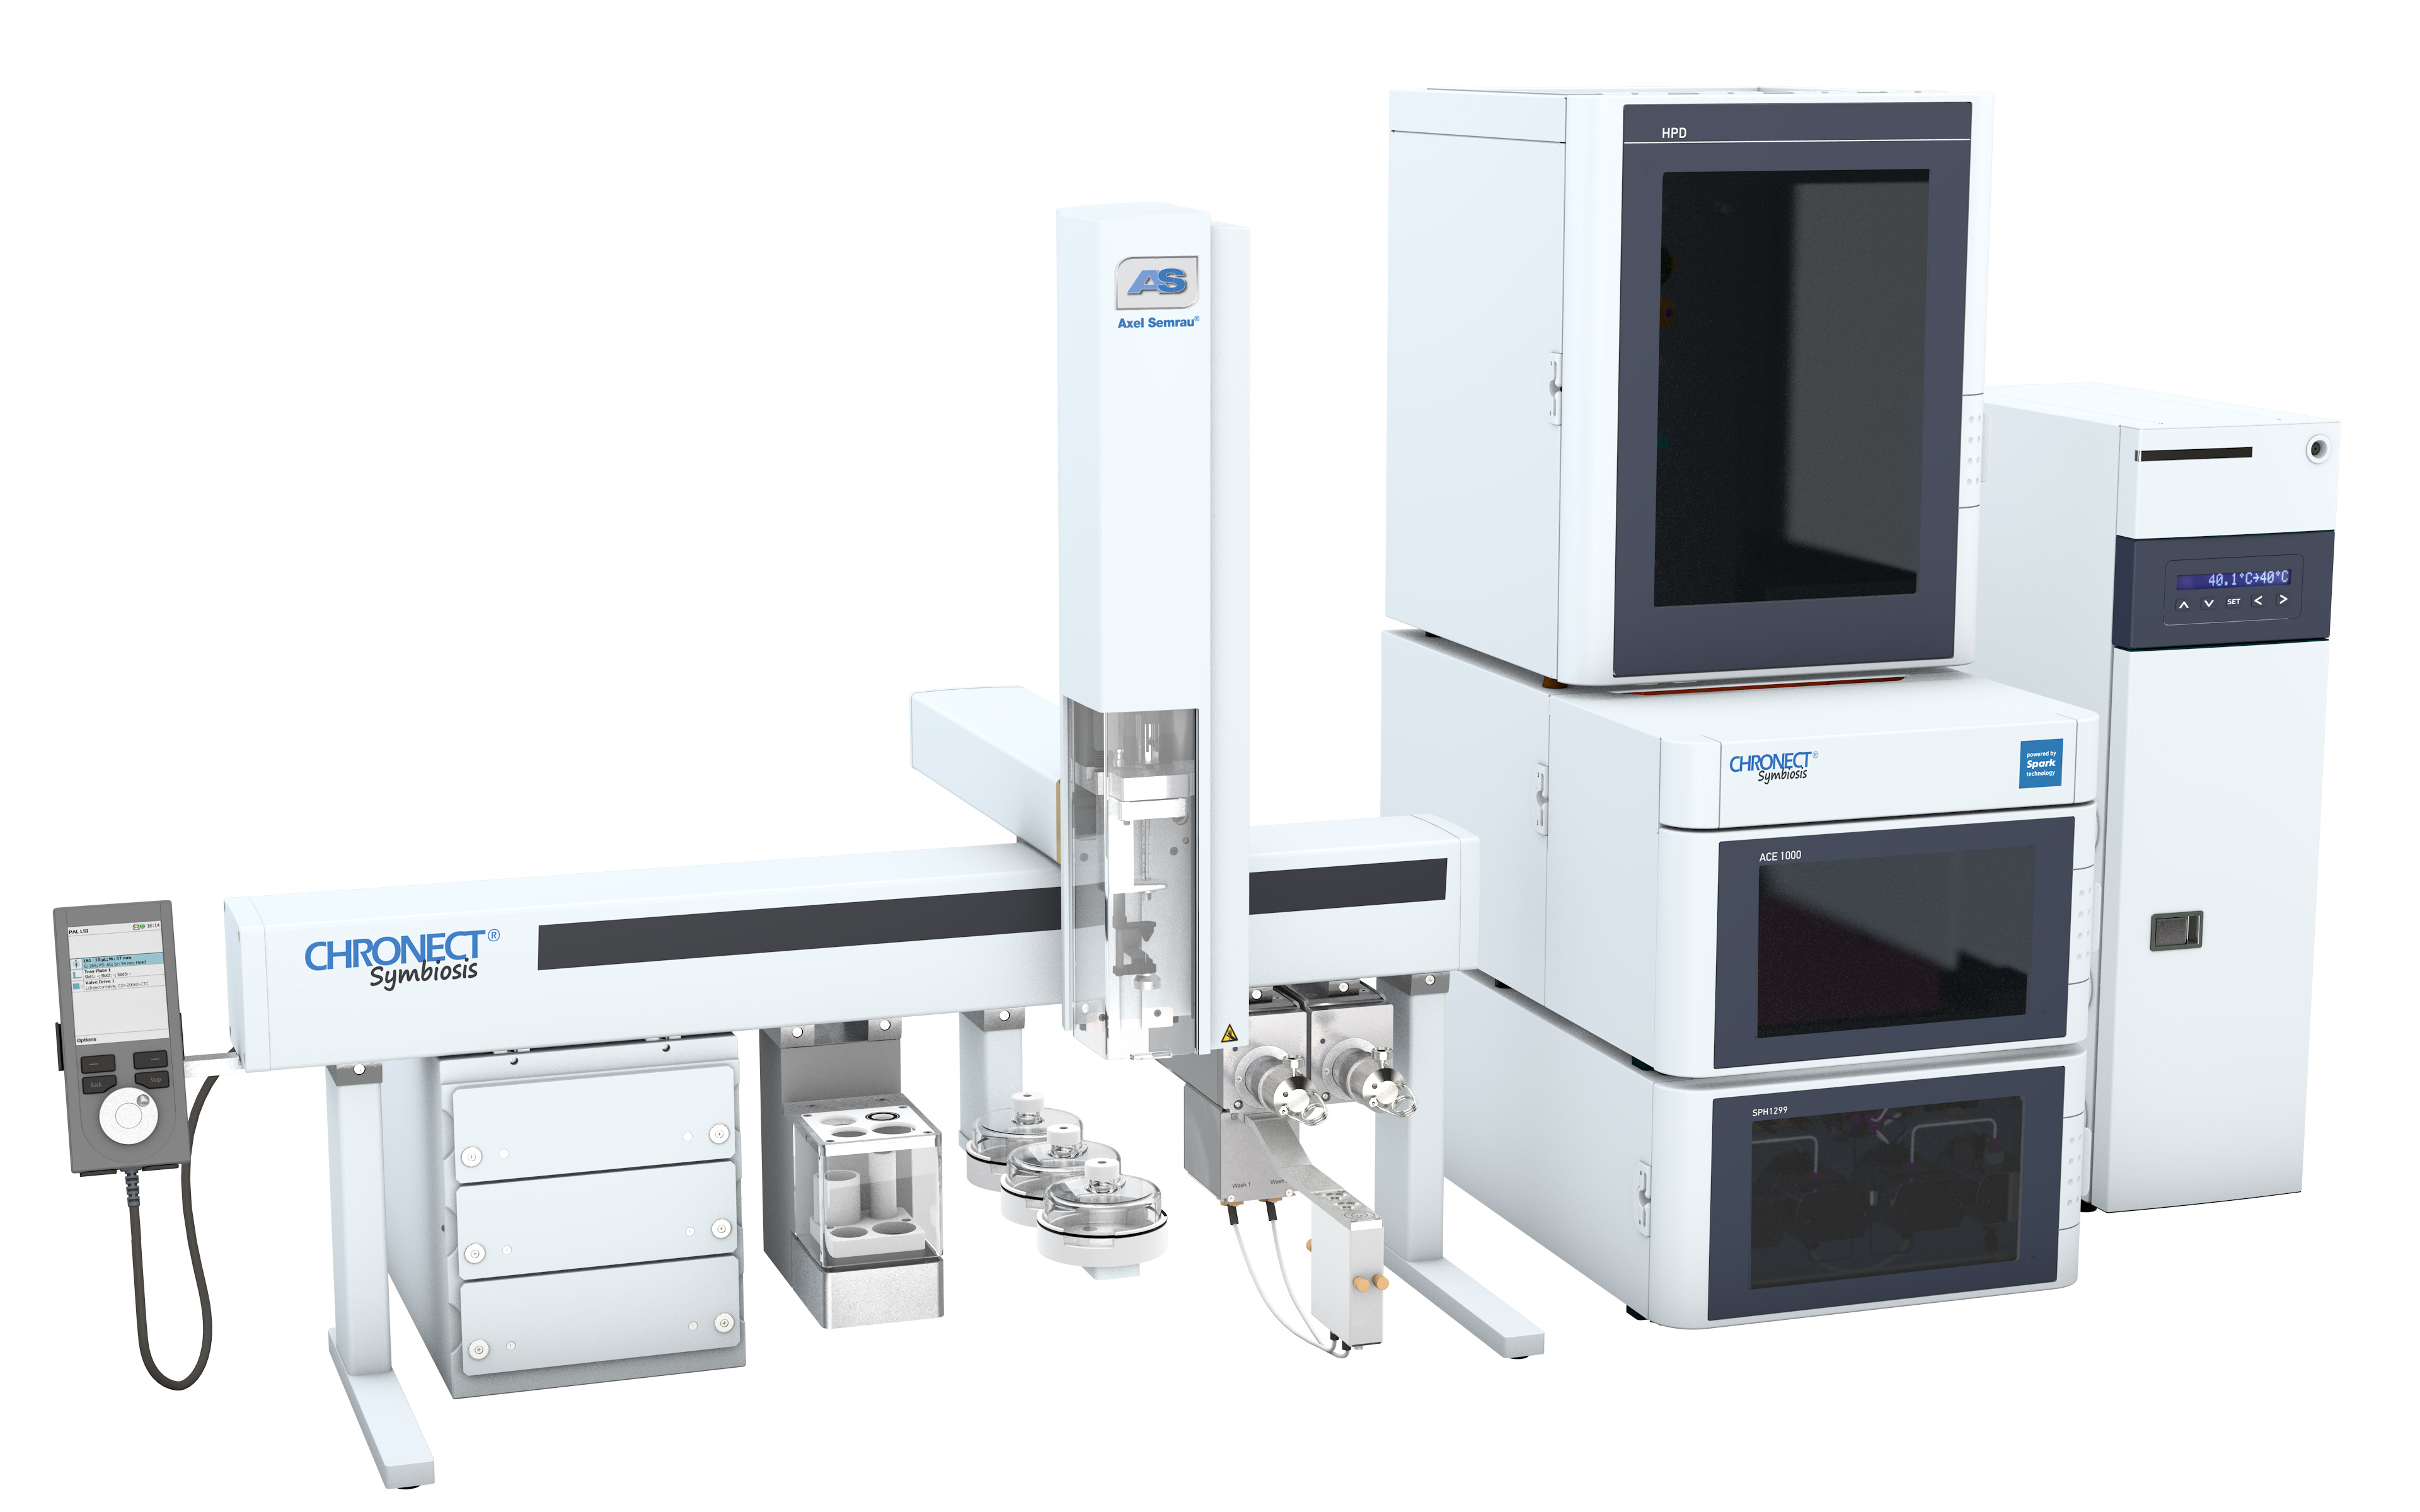
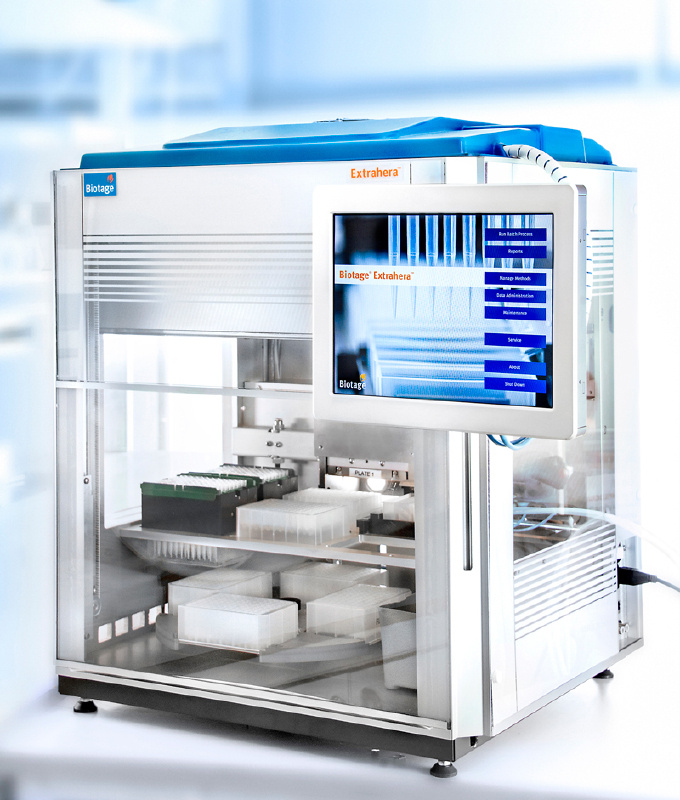
在线样品处理与液质联用可以使得大体积进样的生物样品变得更干净,而且处理速度也快。此研究报道了大体积进样联合在线固相萃取的方式,来研究血清中的药物,通过在线固相萃取的使用,不仅可以保留柱子的选择性和分离性,还能进一步提高检测灵敏度和检测限。实验中使用的是Spark Holland 在线SPE Symbosis系统。
方案详情

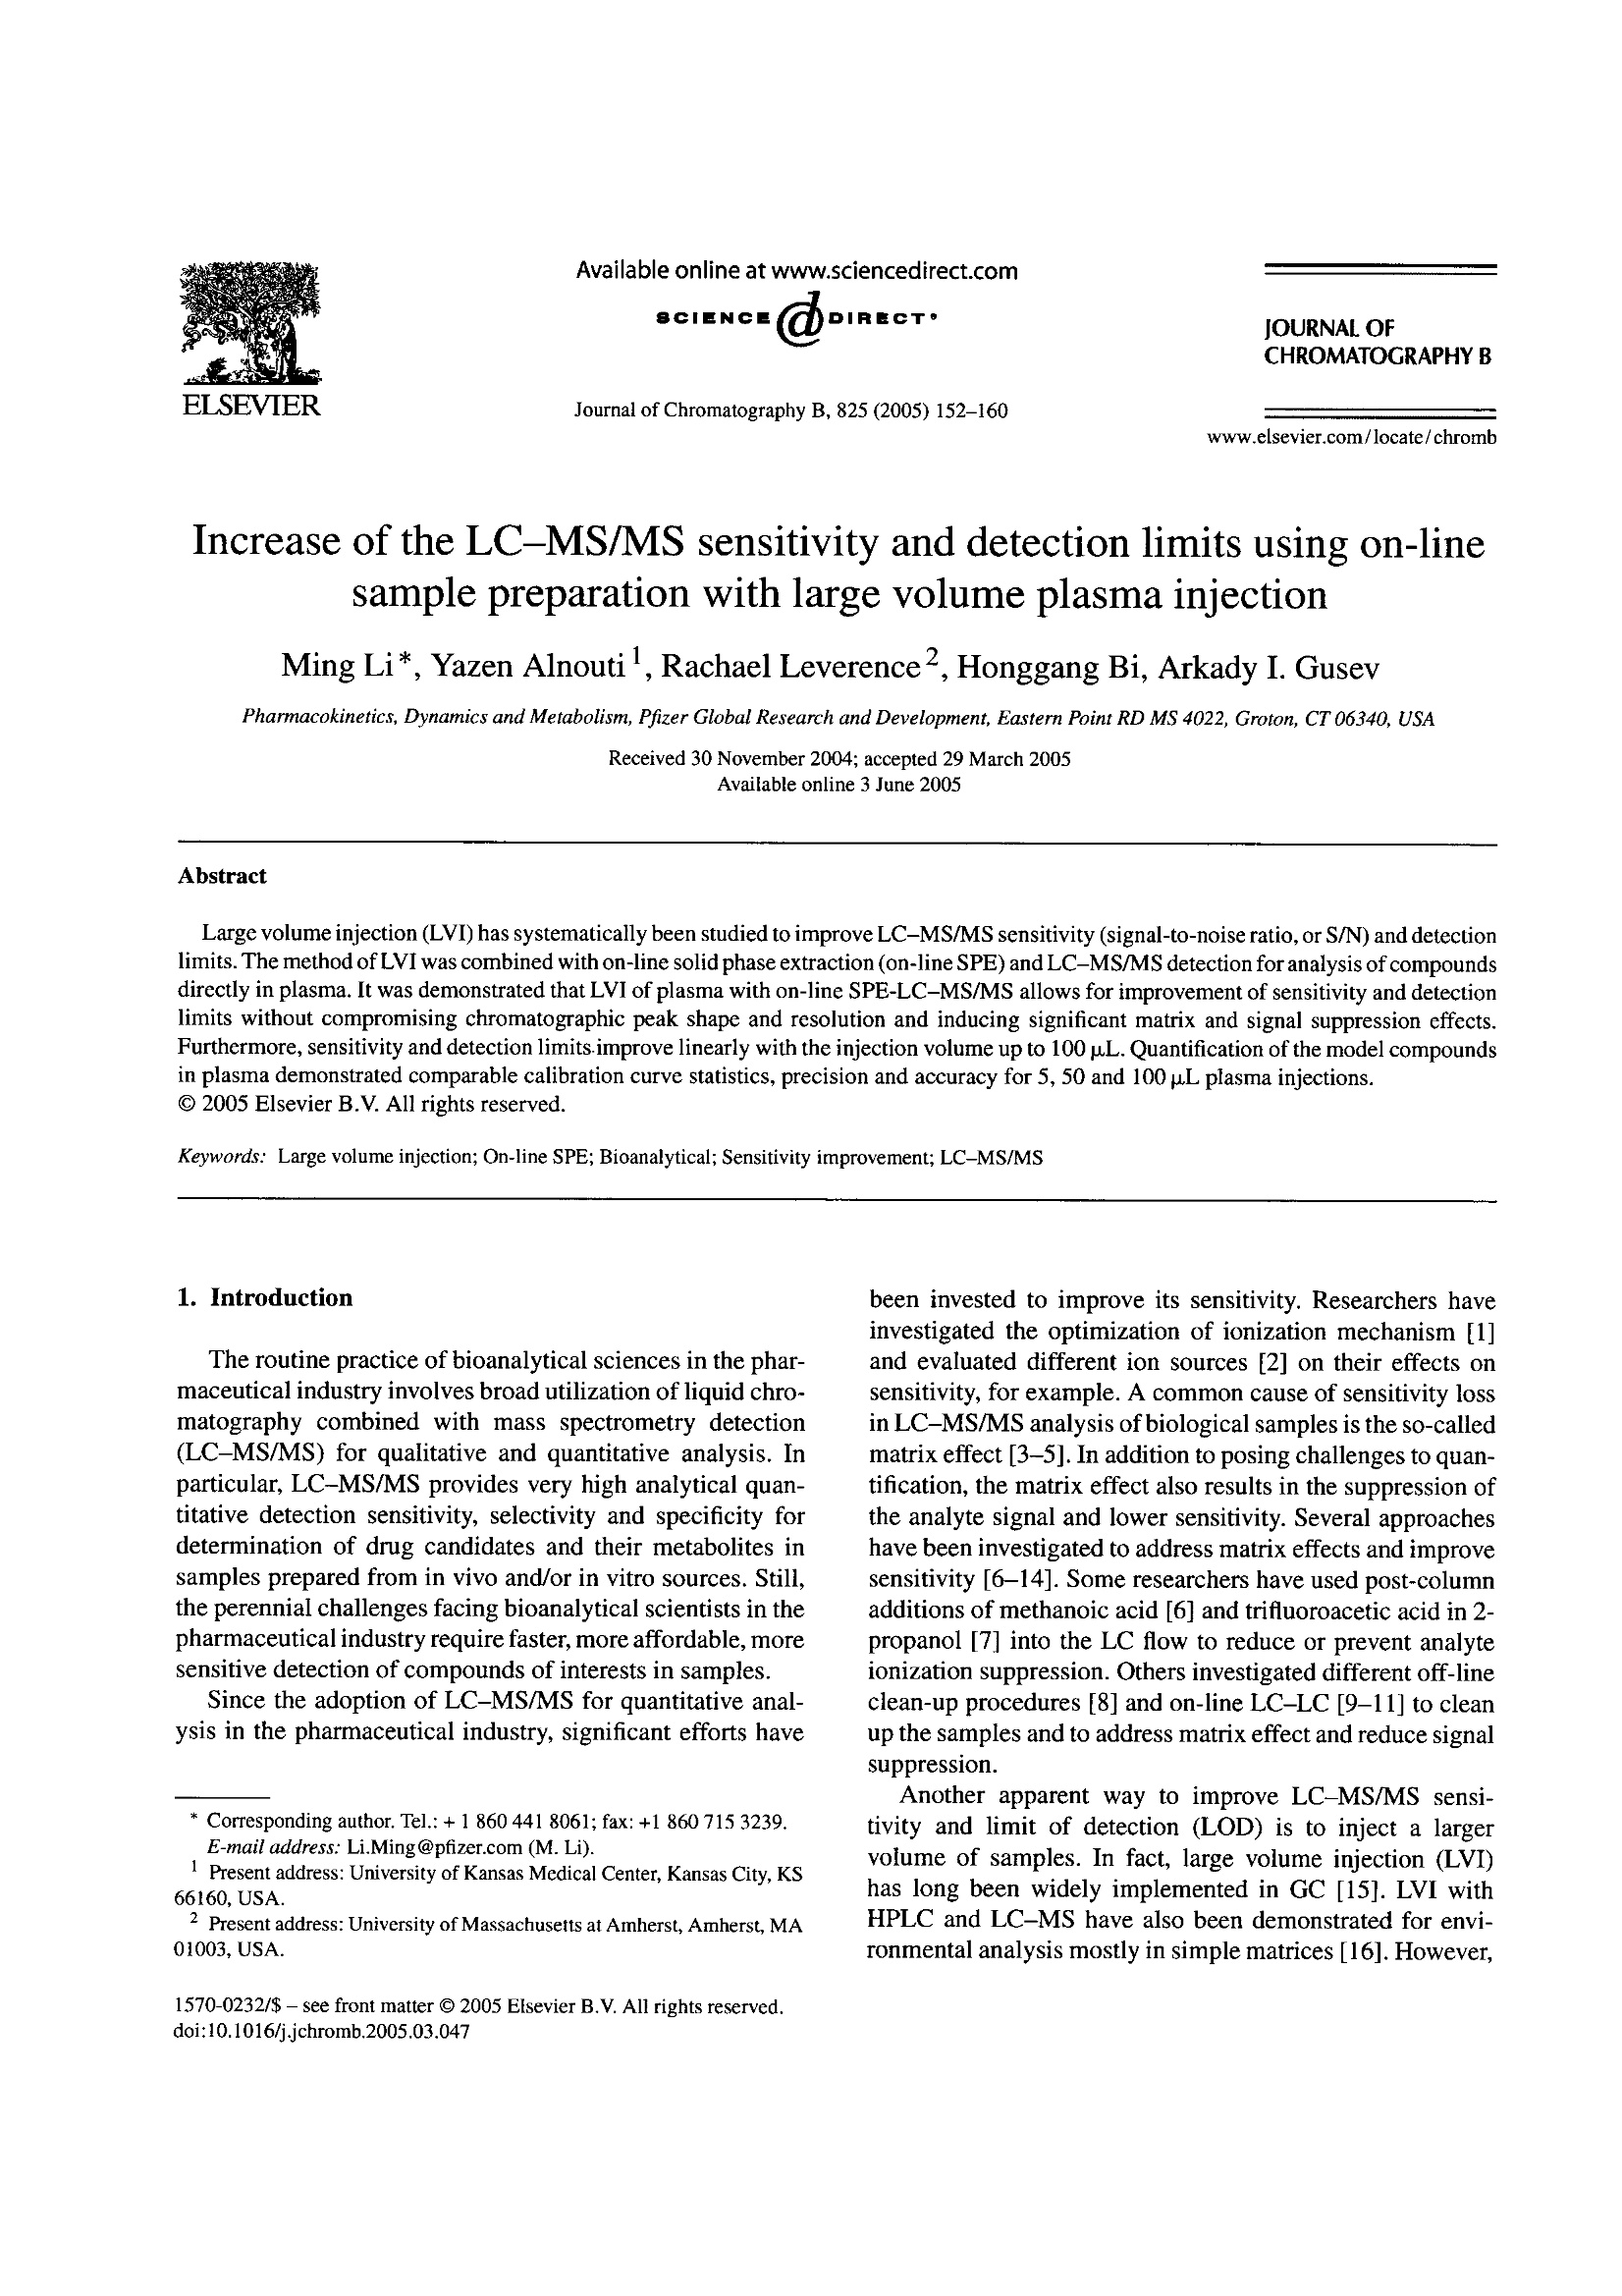
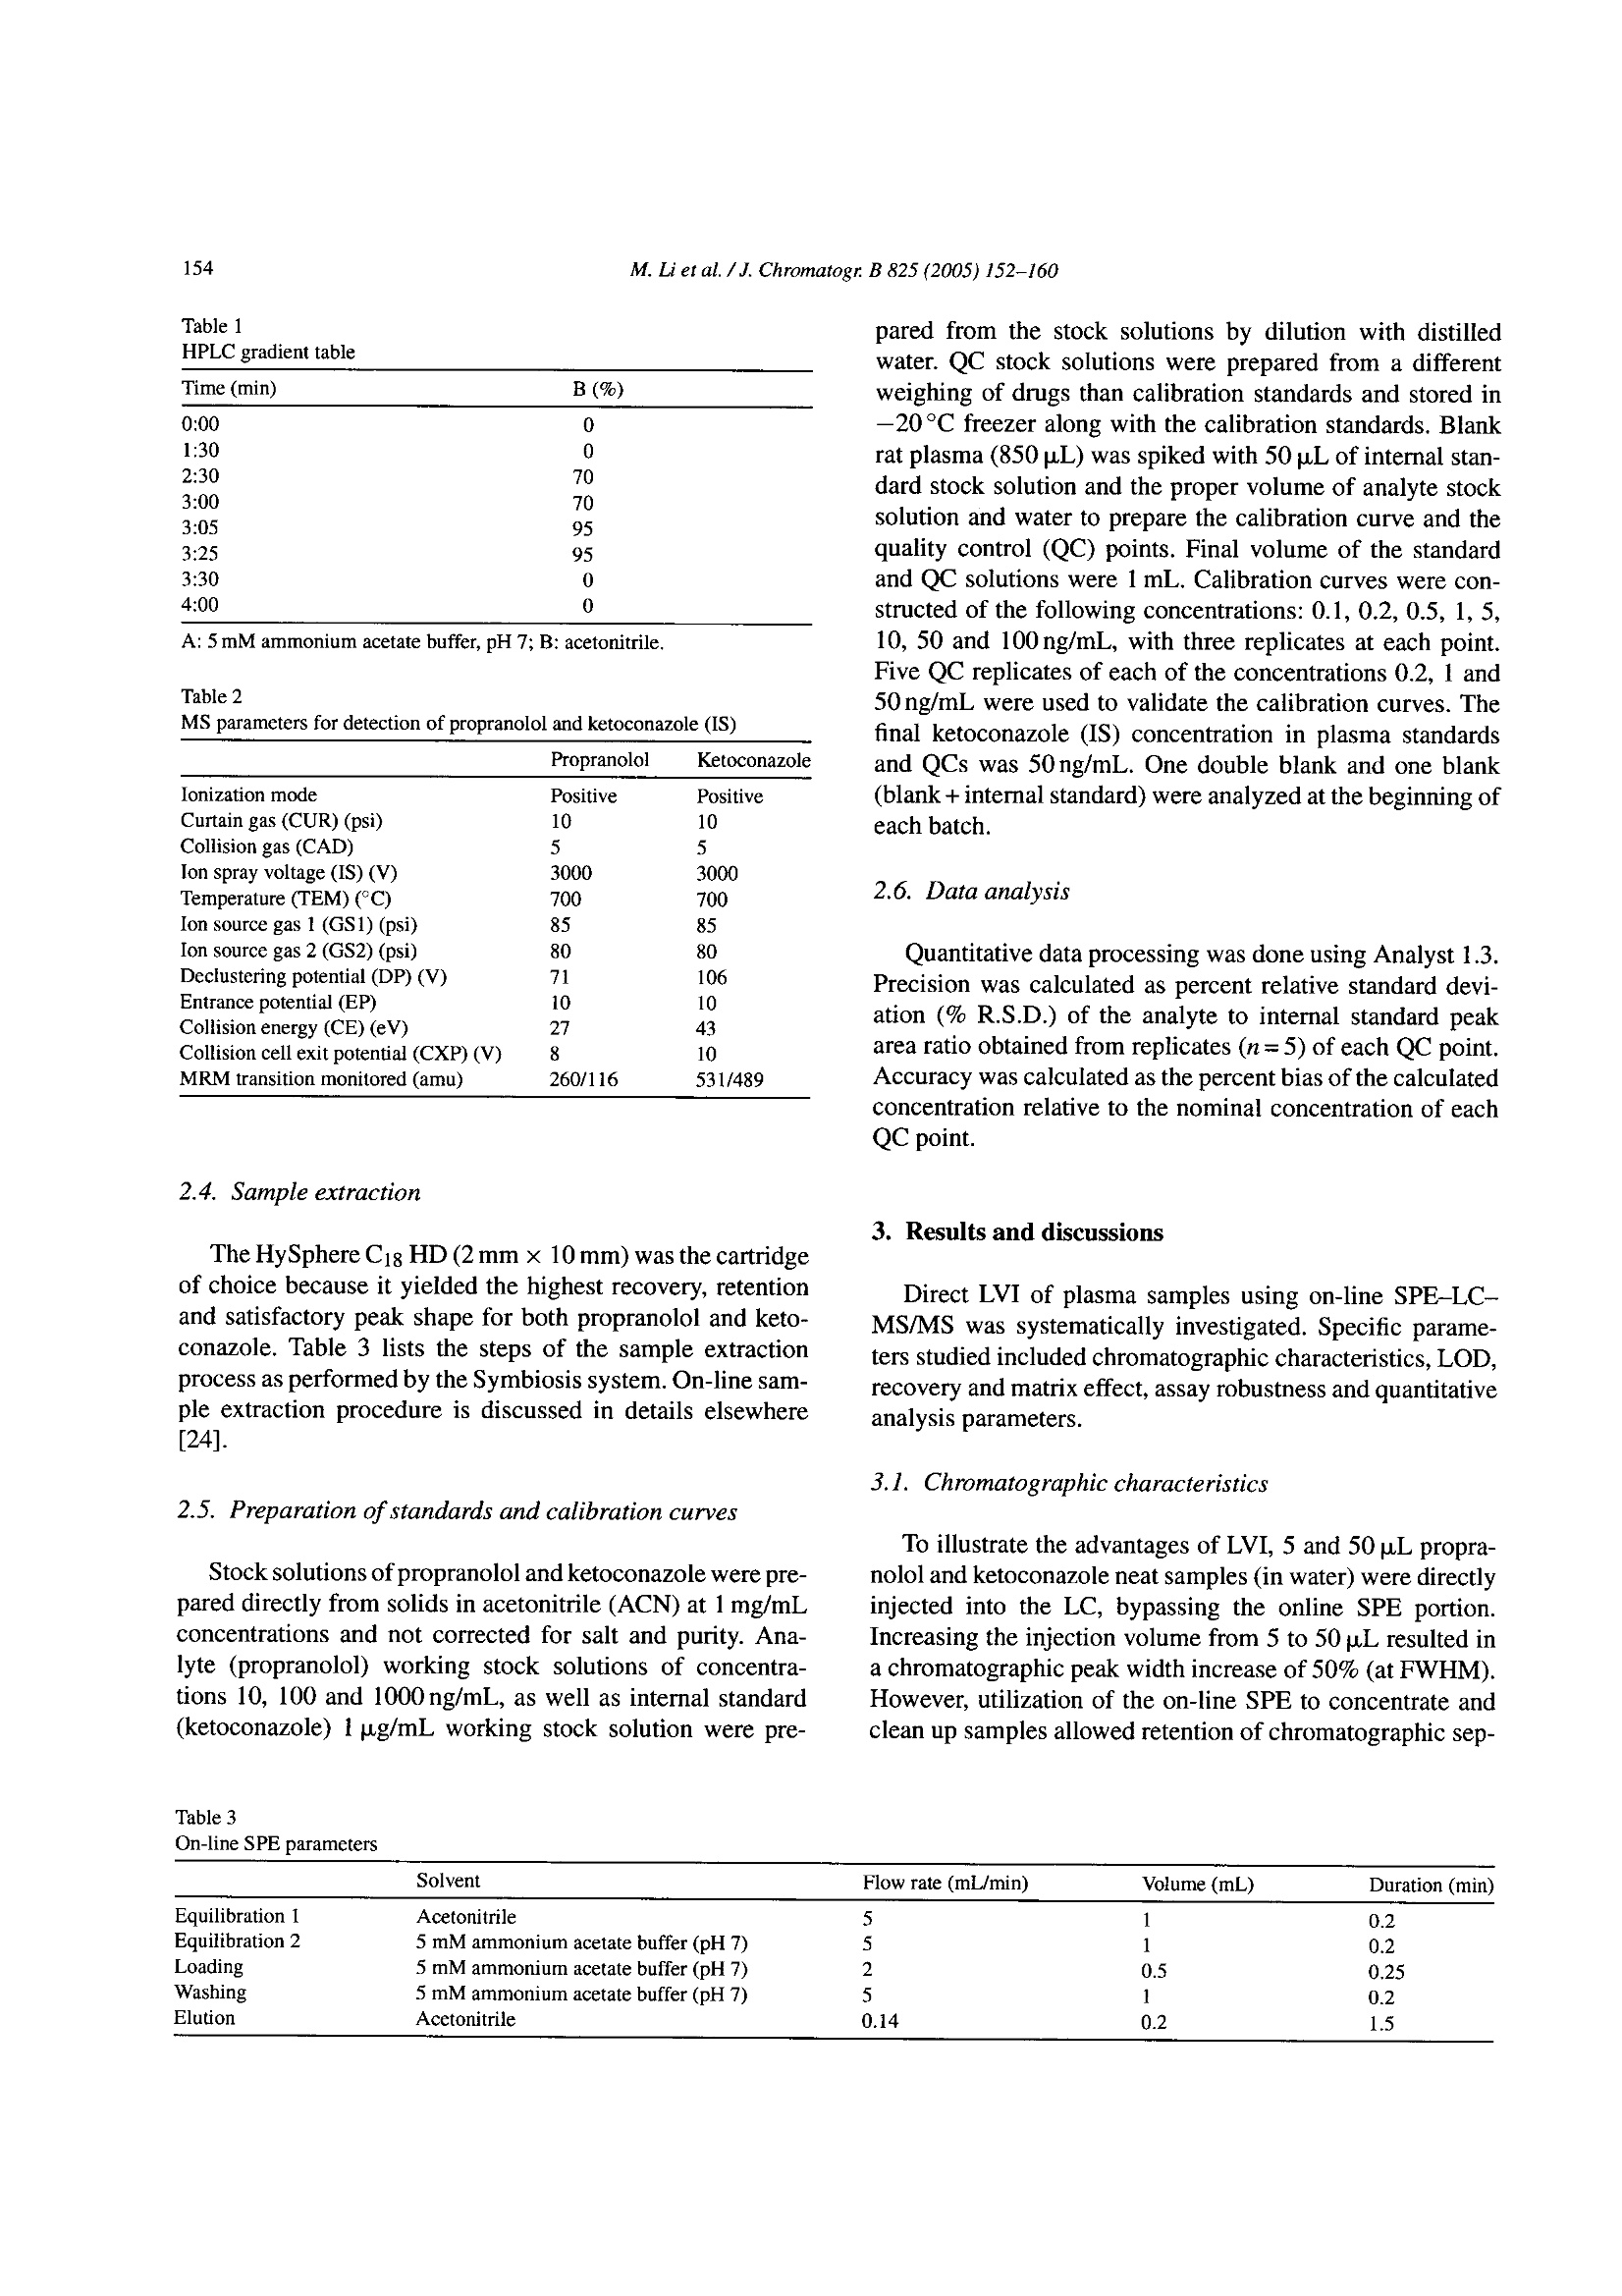
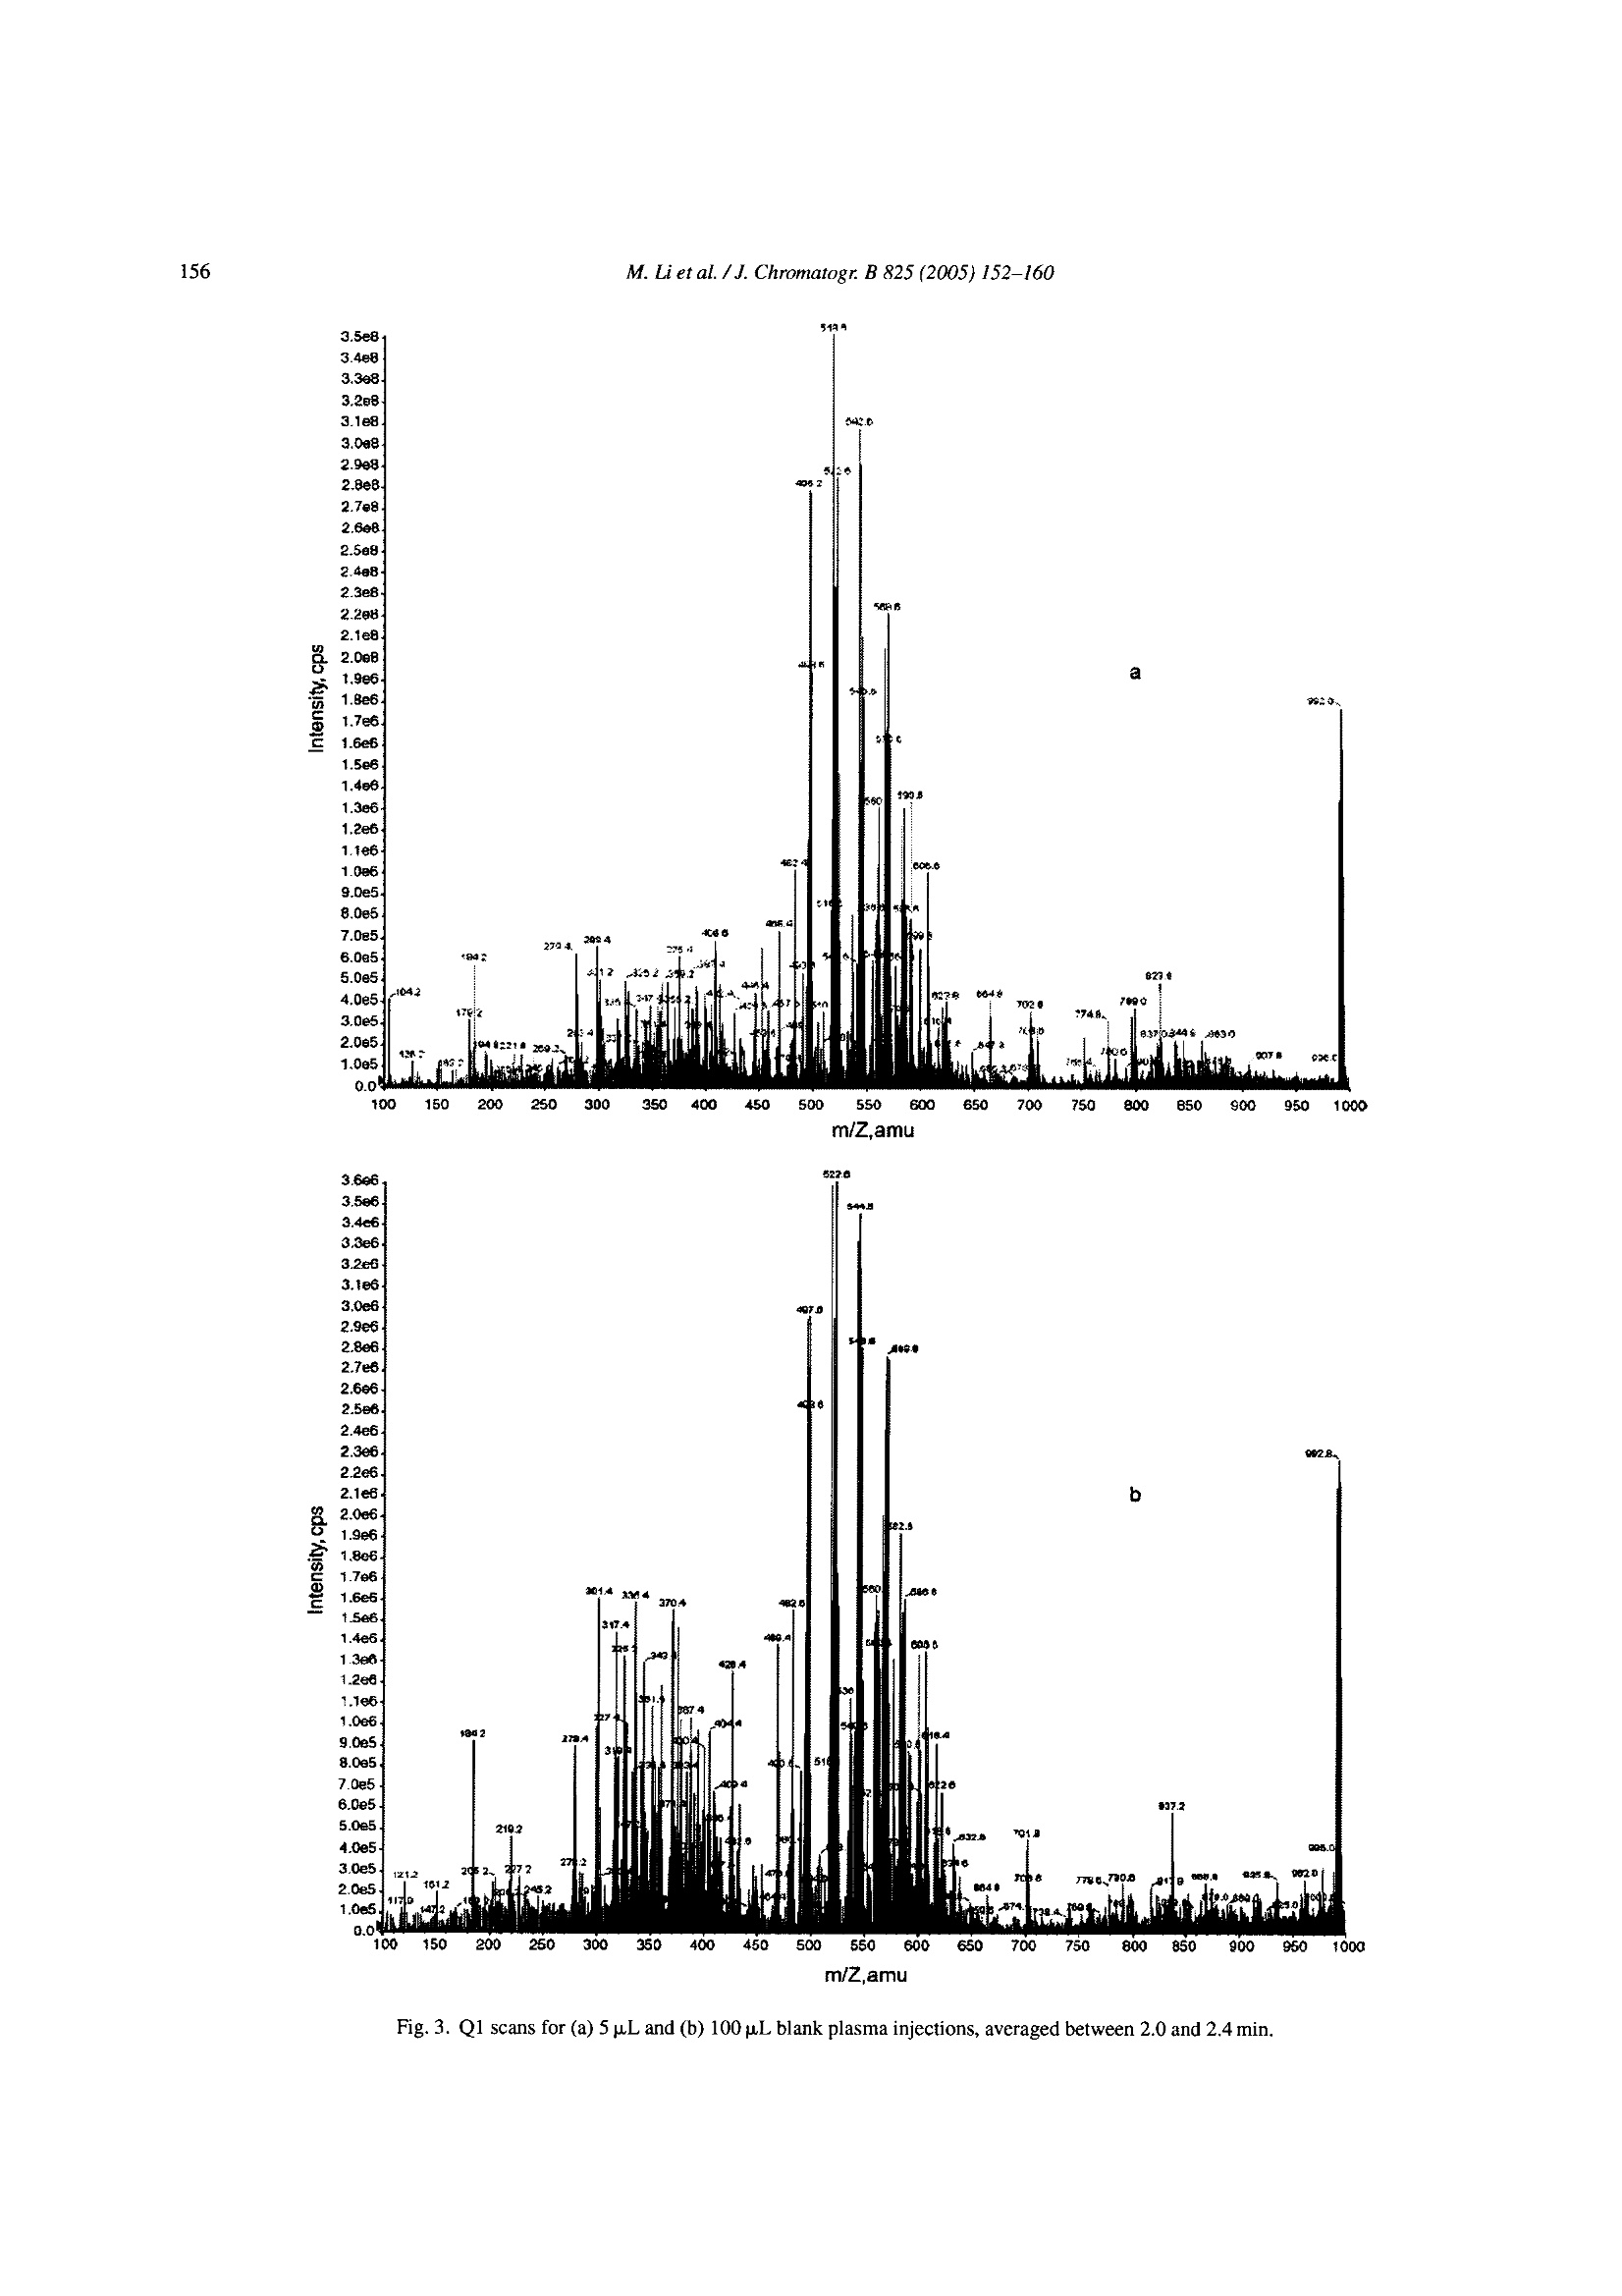
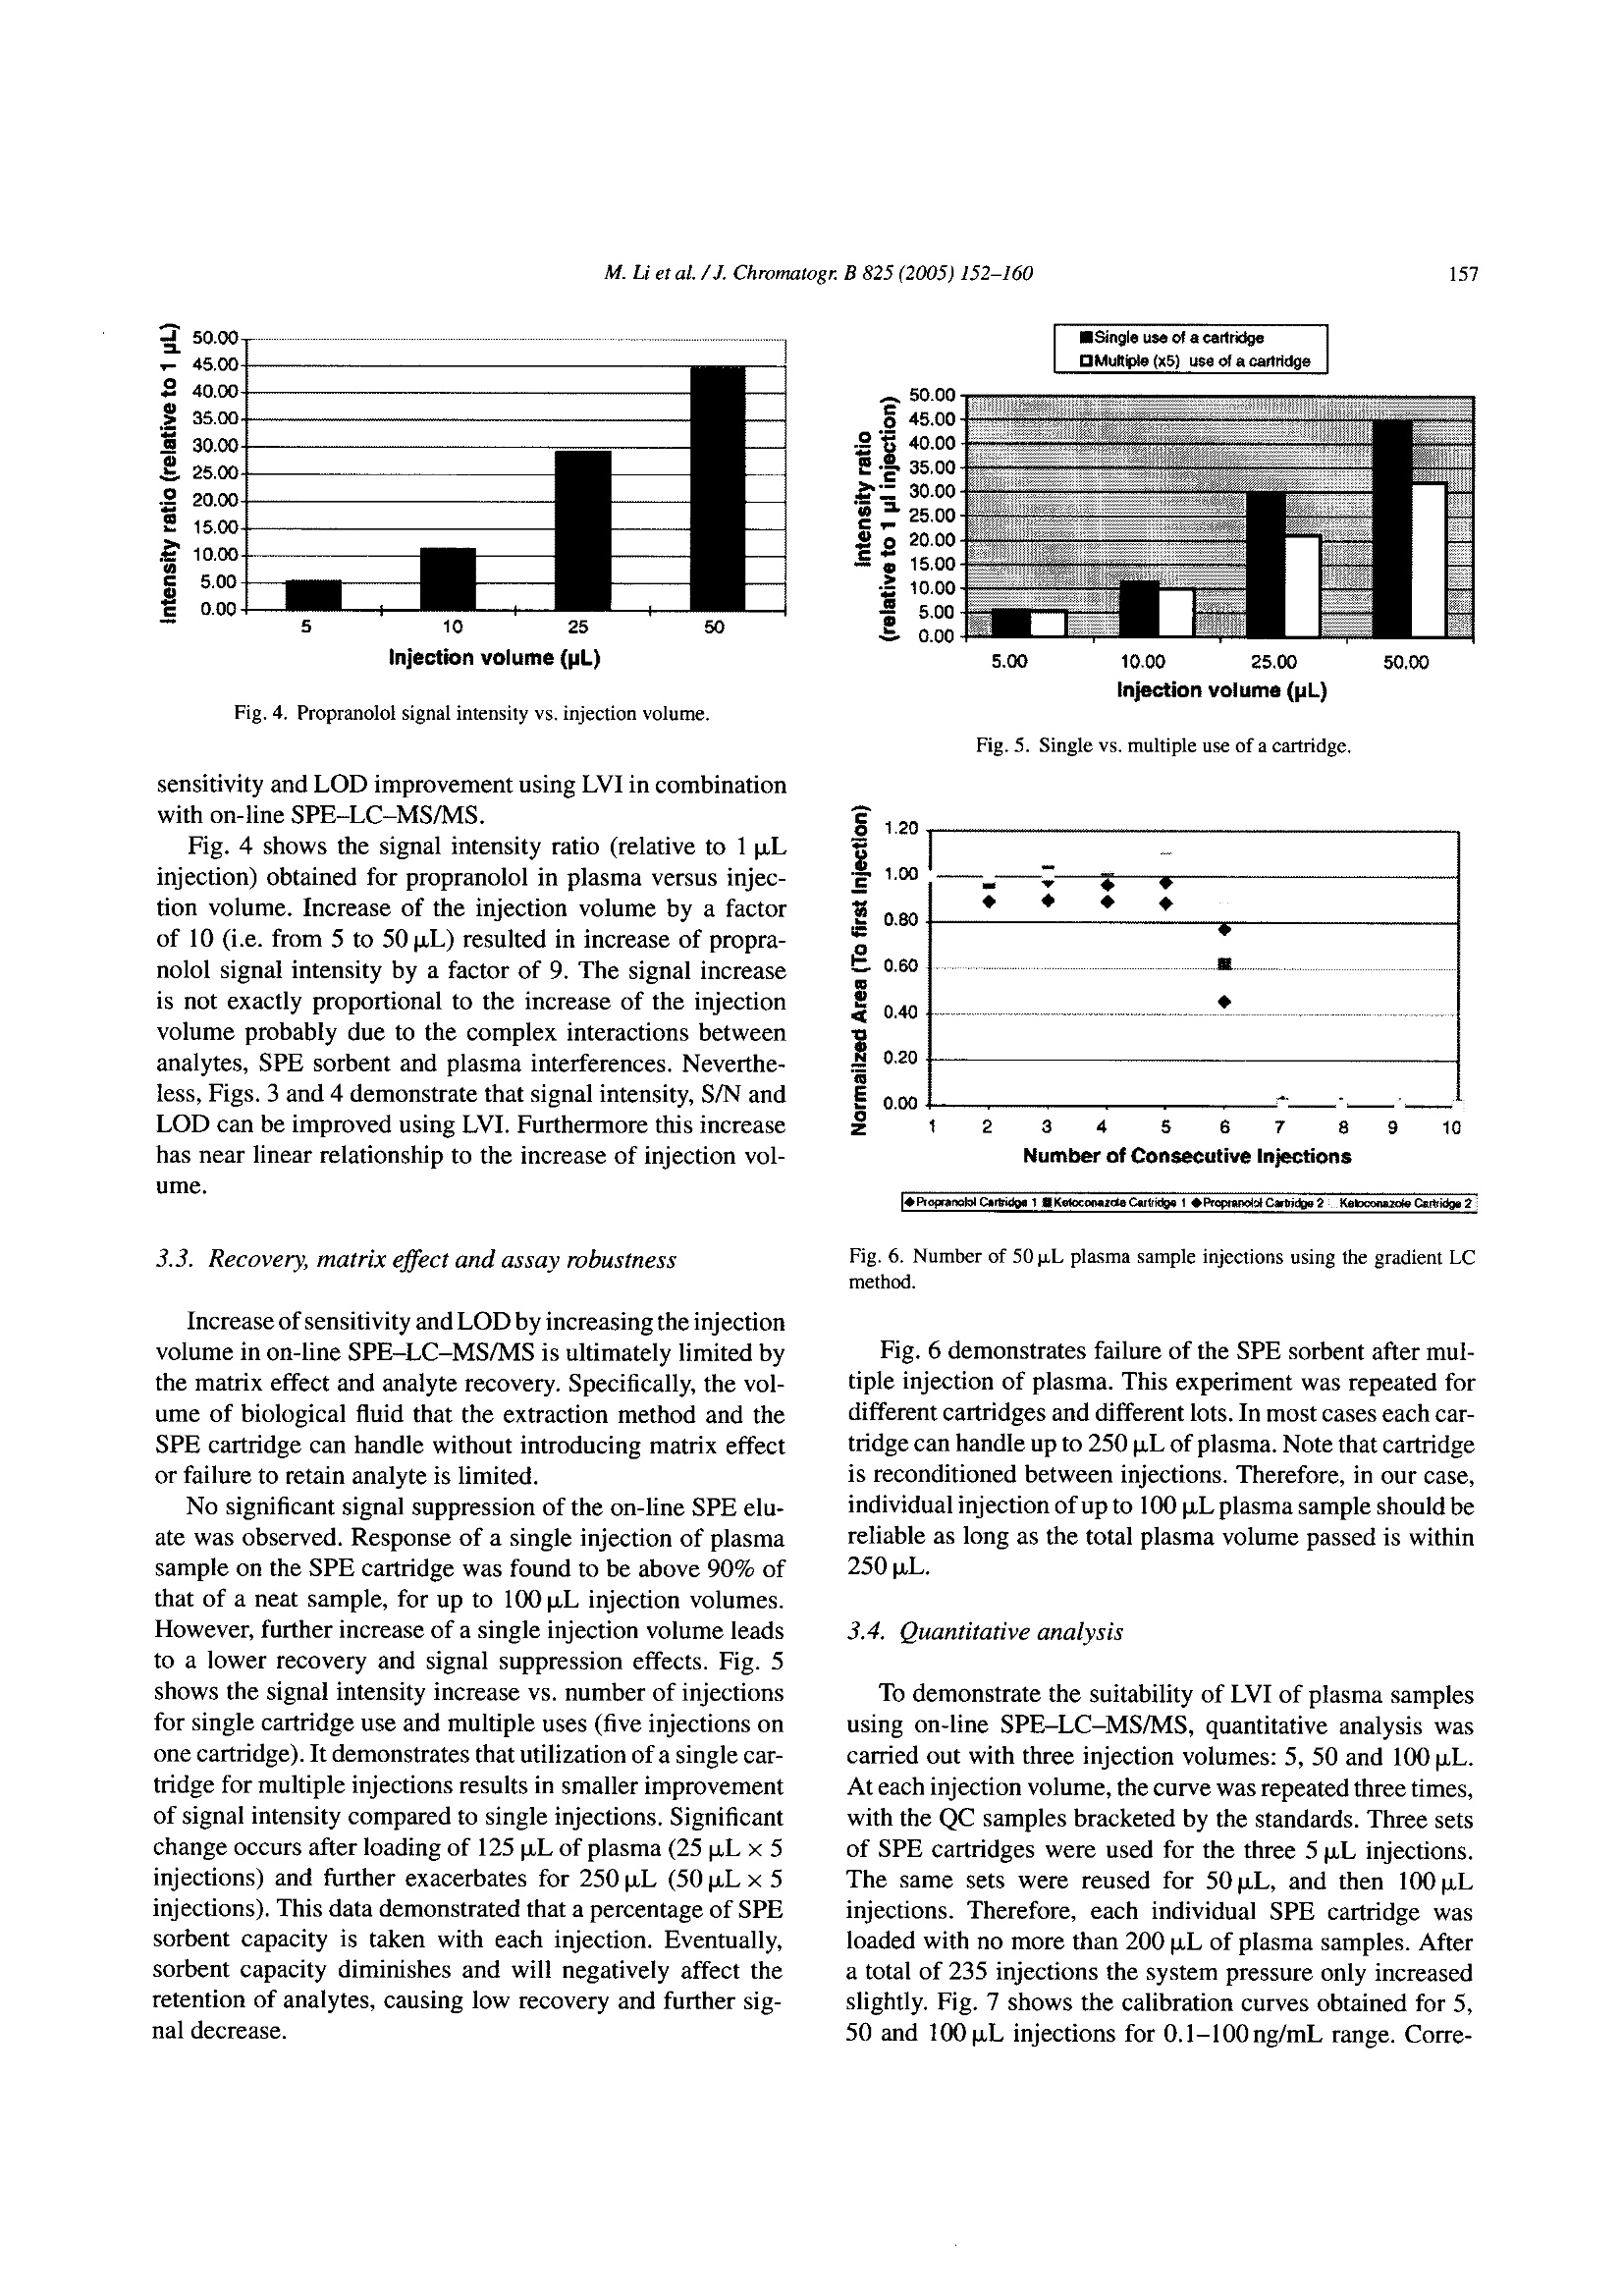
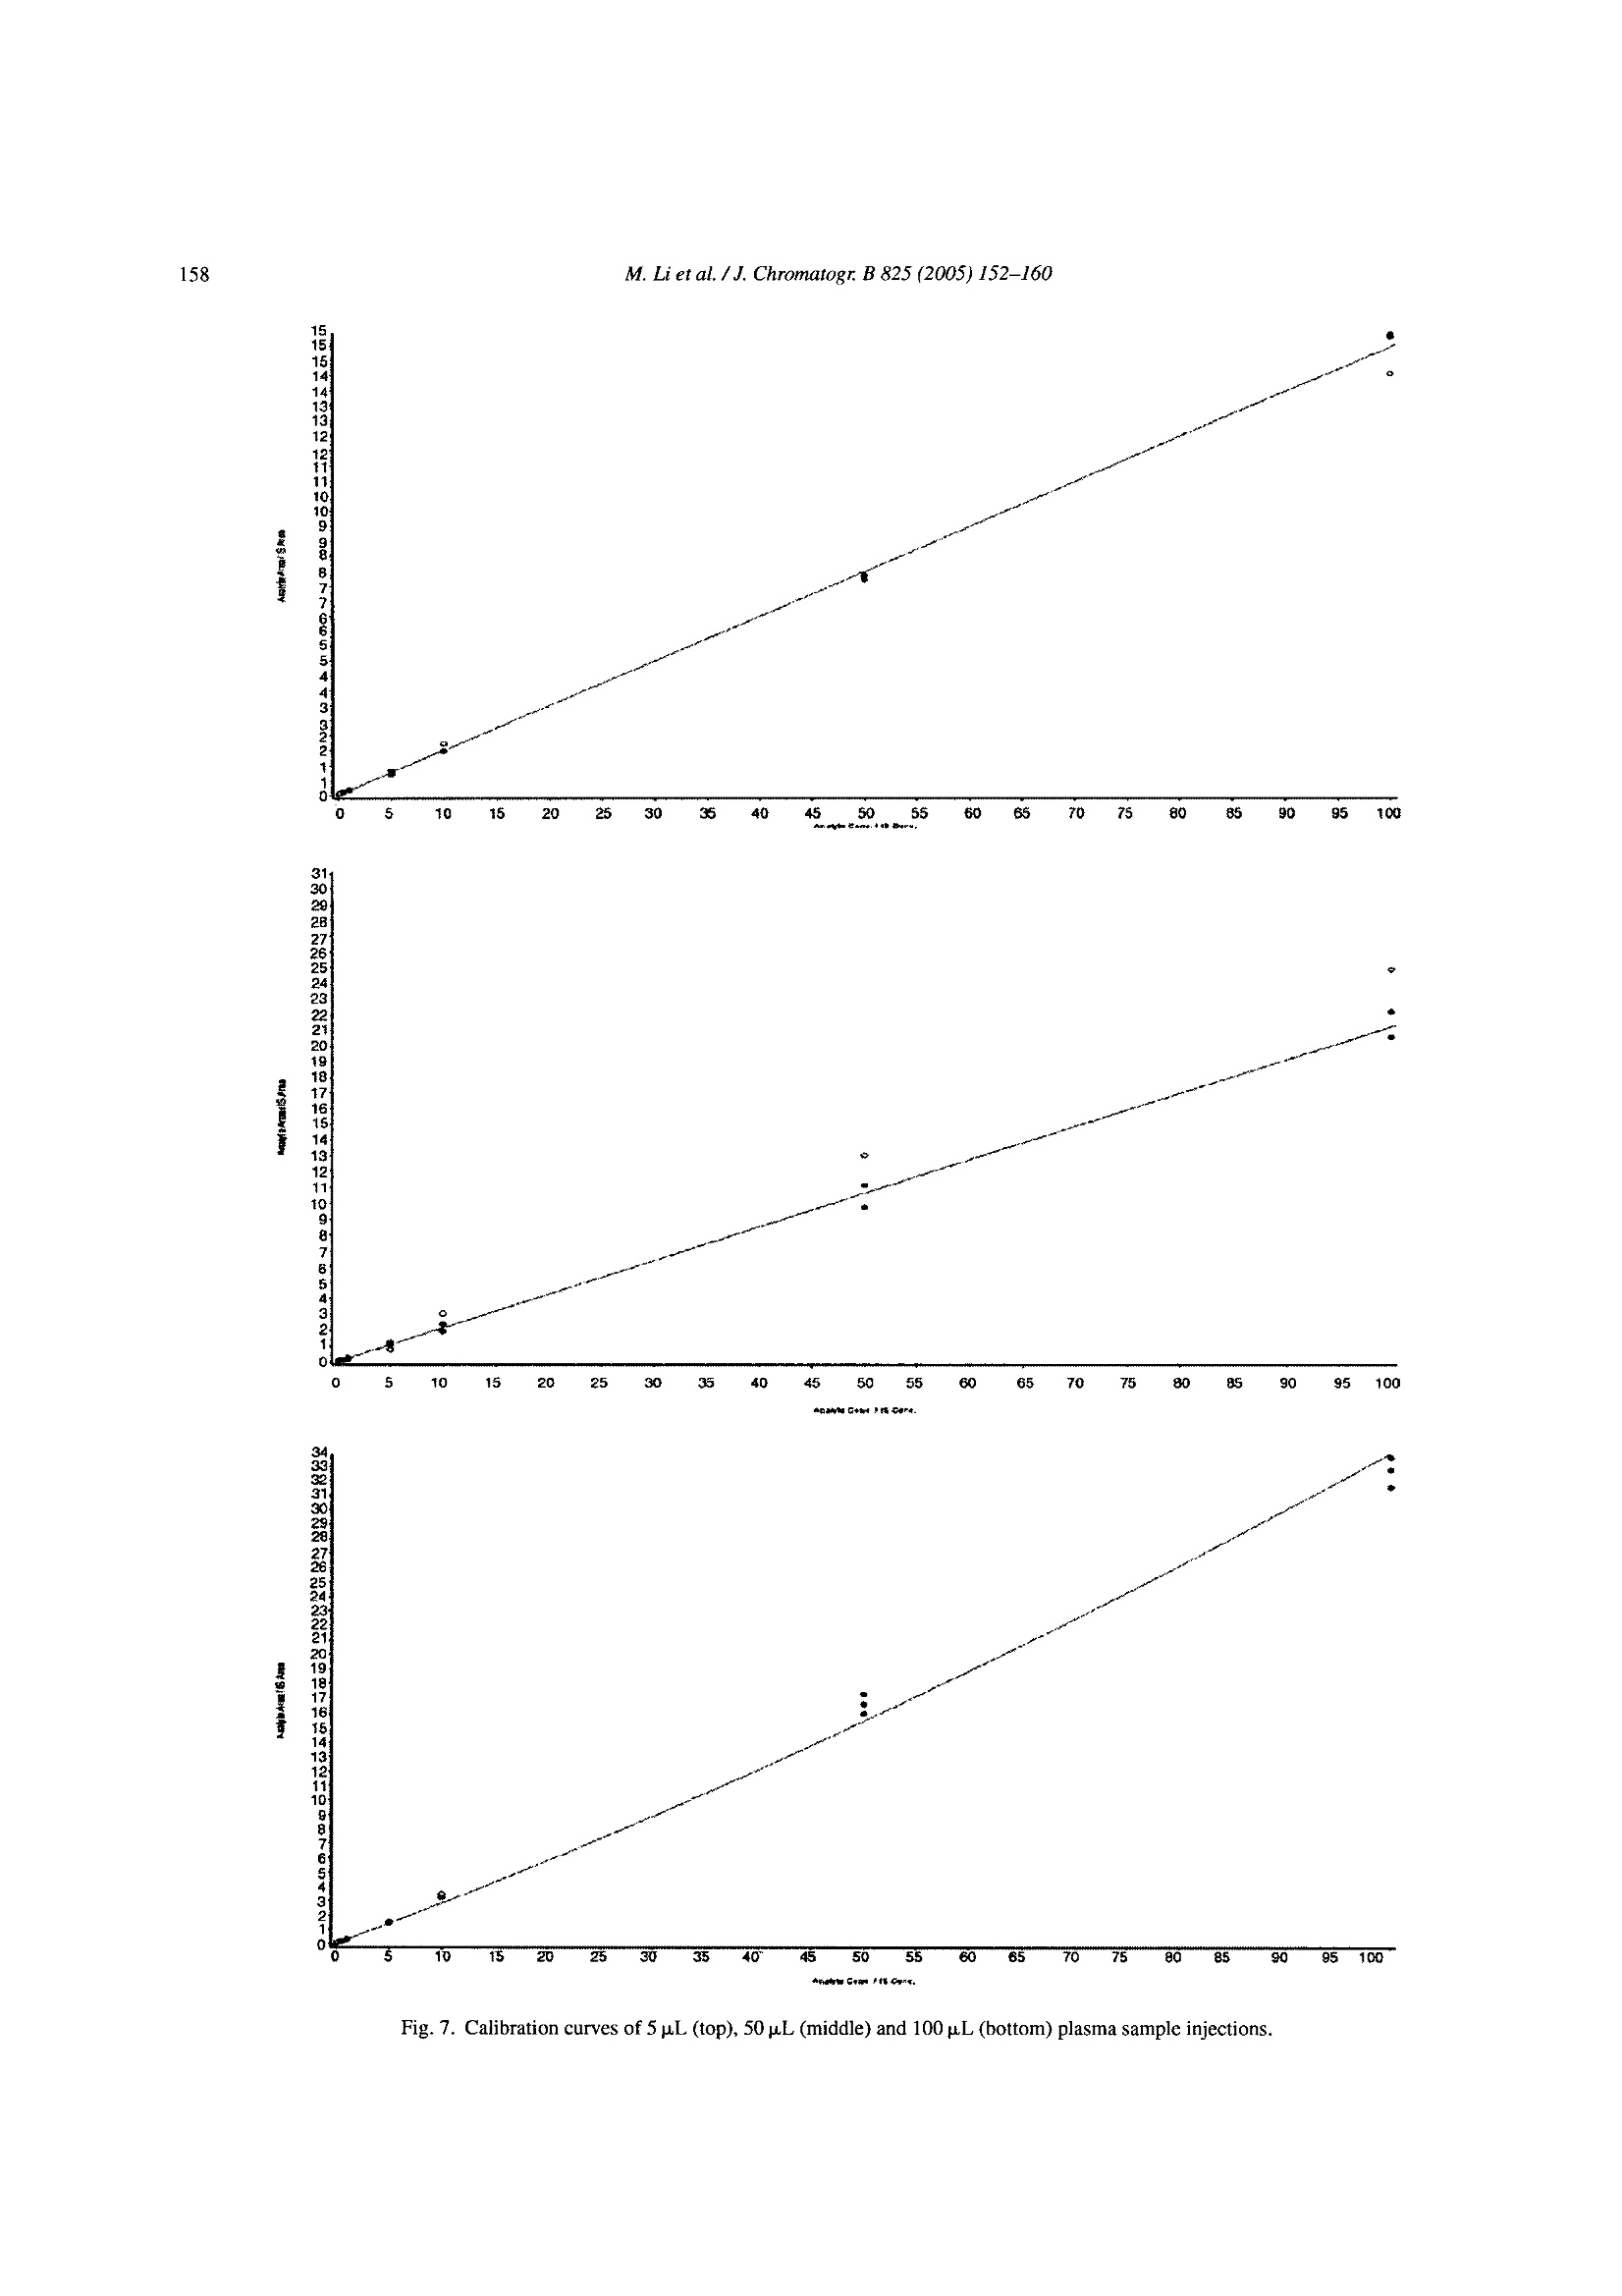
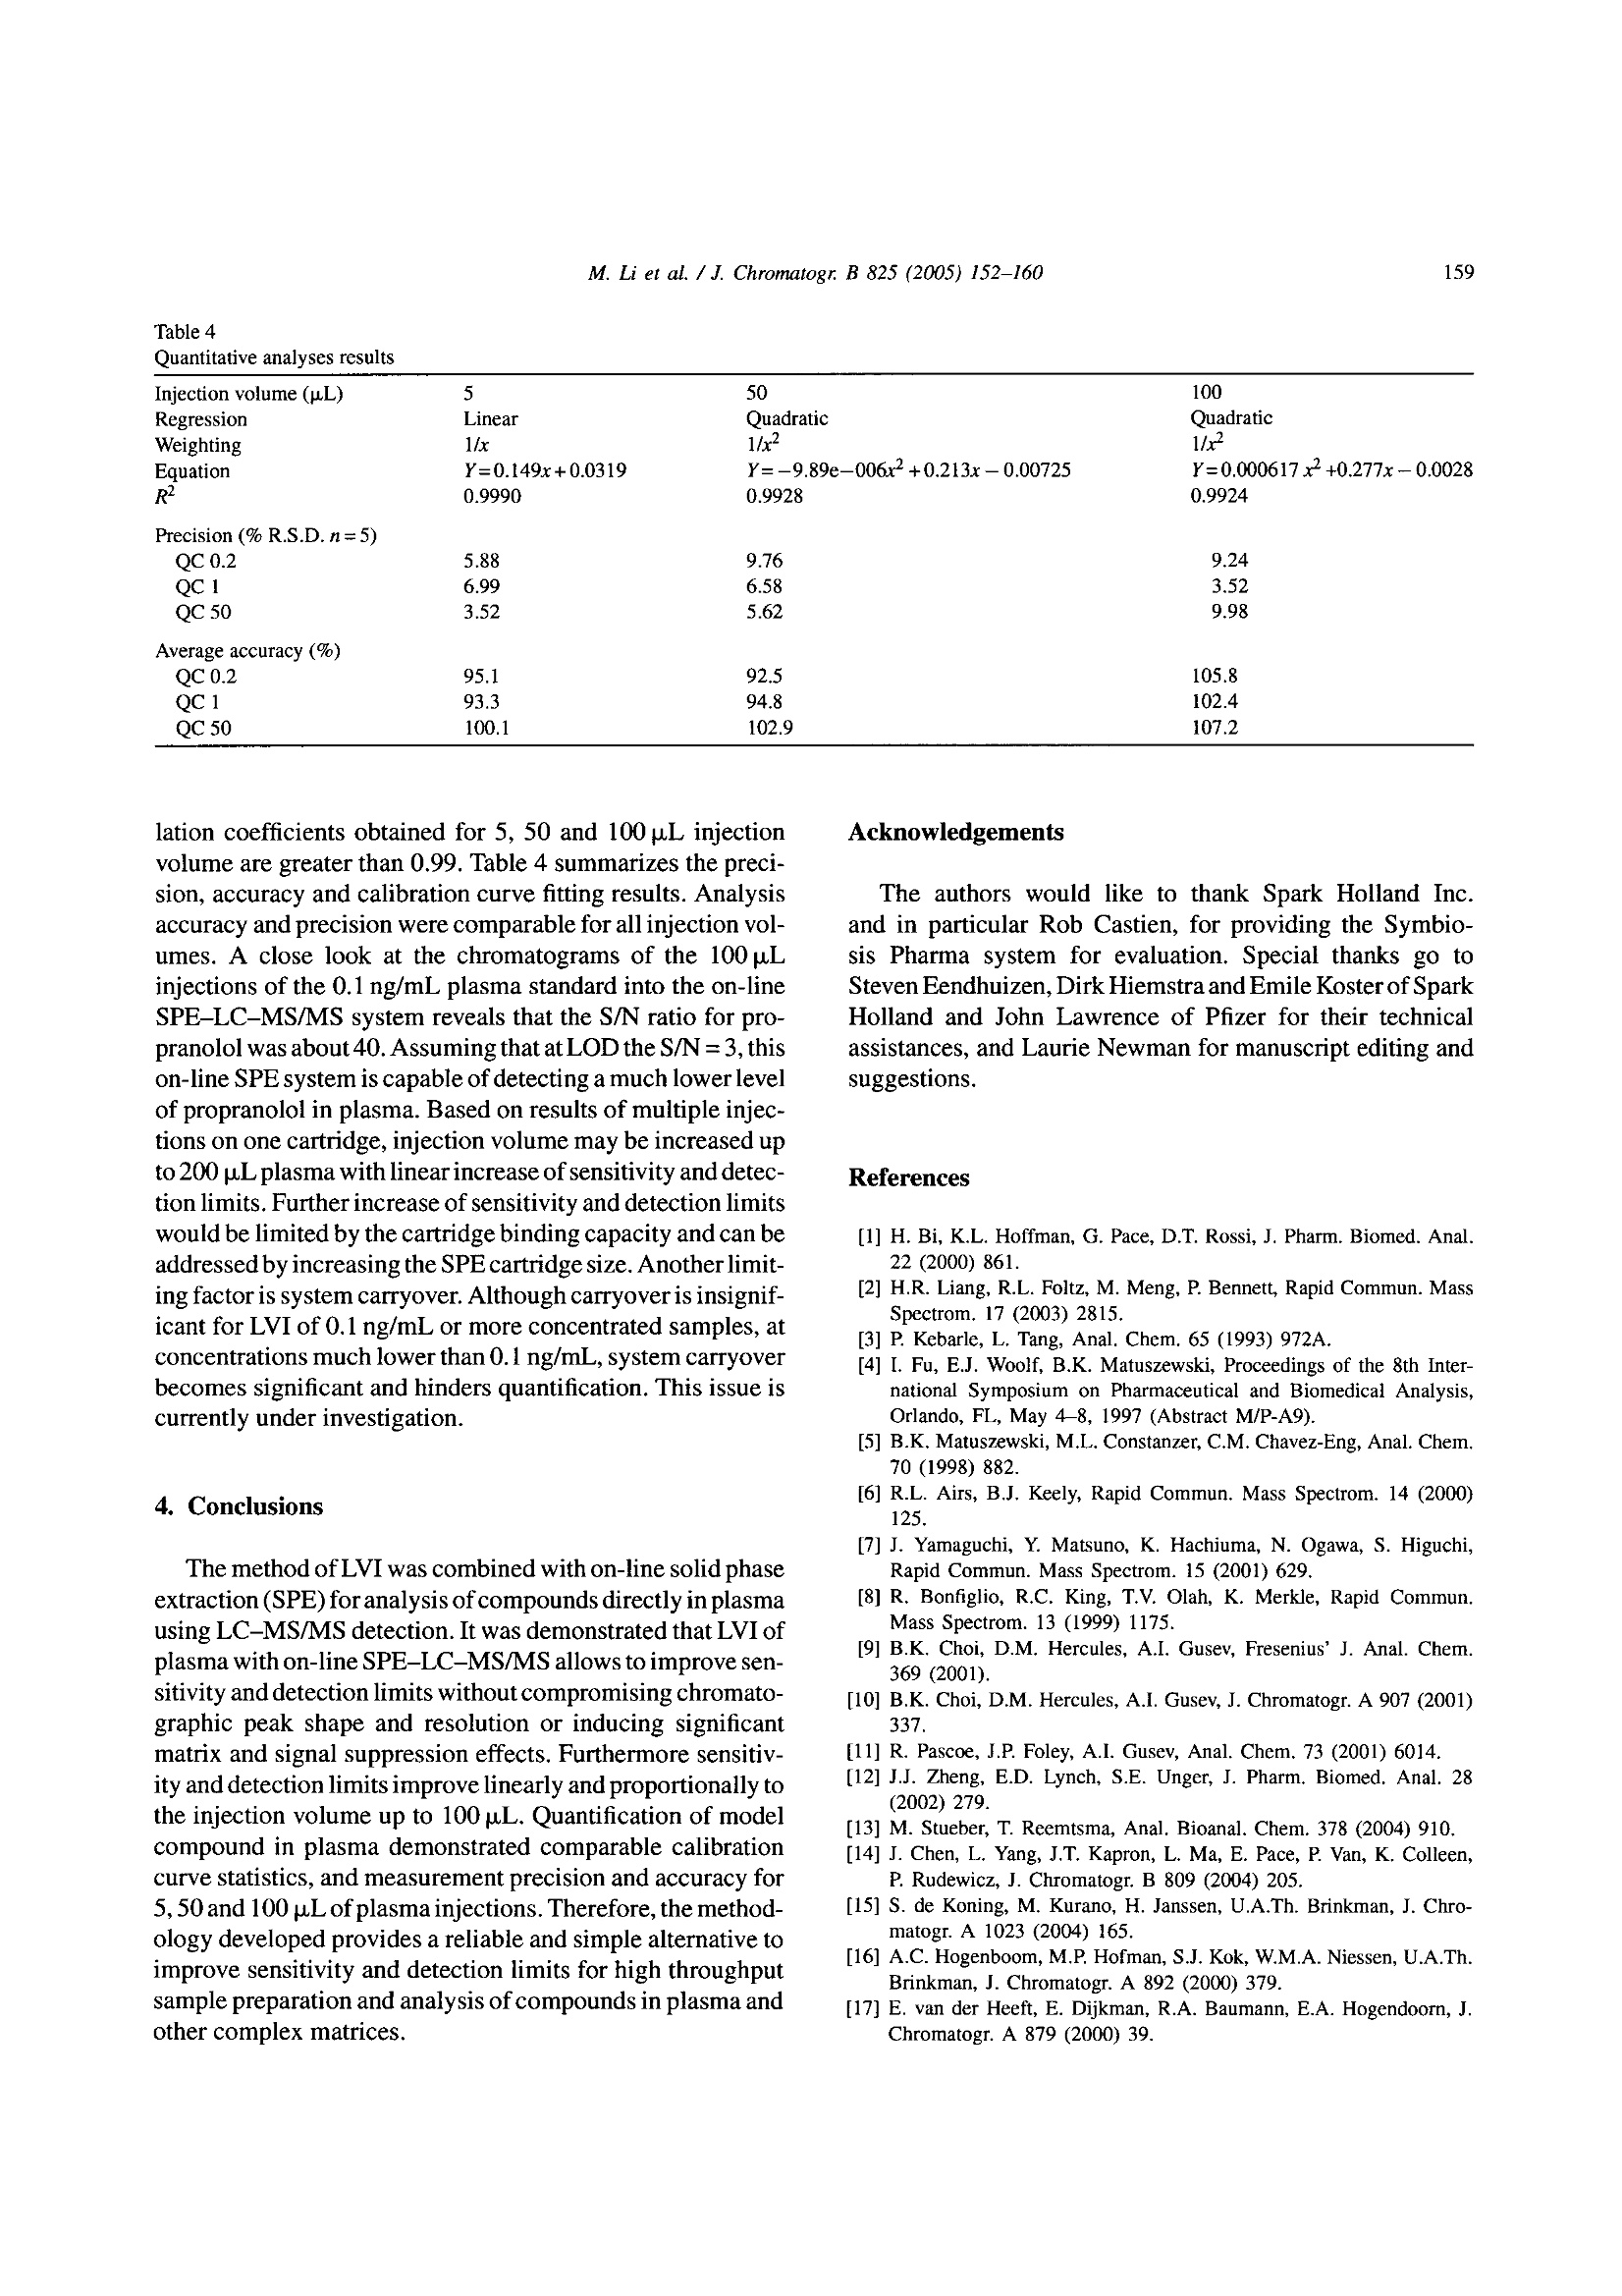
Available online at www.sciencedirect.comJOURNAL OFCHROMATOGRAPHY BJournal of Chromatography B, 825 (2005) 152-160 M. Li et al./J. Chromatogr. B 825(2005)152-160153 www.elsevier.com/locate/chromb Increase of the LC-MS/MS sensitivity and detection limits using on-linesample preparation with large volume plasma injection Ming Li*, Yazen Alnouti, Rachael Leverence, Honggang Bi, Arkady I. Gusev Pharmacokinetics, Dynamics and Metabolism, Pfizer Global Research and Development, Eastern Point RD MS 4022, Groton, CT06340, USA Received 30 November 2004; accepted 29 March 2005 Available online 3 June 2005 Abstract Large volume injection (LVI) has systematically been studied to improve LC-MS/MS sensitivity (signal-to-noise ratio, or S/N) and detectionlimits. The method of LVI was combined with on-line solid phase extraction (on-line SPE) and LC-MS/MS detection for analysis of compoundsdirectly in plasma. It was demonstrated that LVI of plasma with on-line SPE-LC-MS/MS allows for improvement of sensitivity and detectionlimits without compromising chromatographic peak shape and resolution and inducing significant matrix and signal suppression effects.Furthermore, sensitivity and detection limits improve linearly with the injection volume up to 100pL. Quantification of the model compoundsin plasma demonstrated comparable calibration curve statistics, precision and accuracy for 5, 50 and 100 pL plasma injections.C 2005 Elsevier B.V. All rights reserved. Keywords: Large volume injection; On-line SPE; Bioanalytical; Sensitivity improvement; LC-MS/MS 1. Introduction The routine practice of bioanalytical sciences in the phar-maceutical industry involves broad utilization of liquid chro-matography combined with mass spectrometry detection(LC-MS/MS) for qualitative and quantitative analysis. Inparticular,LC-MS/MS provides very high analytical quan-titative detection sensitivity, selectivity and specificity fordetermination of drug candidates and their metabolites insamples prepared from in vivo and/or in vitro sources. Still,the perennial challenges facing bioanalytical scientists in thepharmaceutical industry require faster, more affordable, moresensitive detection of compounds of interests in samples. Since the adoption of LC-MS/MS for quantitative anal-ysis in the pharmaceutical industry, significant efforts have ( *Corresponding author. Tel.: + 1 860 441 8061; fax: +1 860 715 3239. ) ( E-mail address: Li.Ming@pfizer.com (M. Li). ) ( Present address: University of Kansas Medical Center, Kansas City,K S 66160, USA. ) ( Pr e sent address: University of Massachusetts at Amherst, Amherst, MA01003, USA. ) ( 1570-0232/$-see front matter @ 2005 Elsevier B.V. All rights reserved.doi:10.1016/j.jchromb.2005.03.047 ) been invested to improve its sensitivity. Researchers haveinvestigated the optimization of ionization mechanism [1]and evaluated different ion sources [2] on their effects onsensitivity, for example. A common cause of sensitivity lossin LC-MS/MS analysis of biological samples is the so-calledmatrix effect [3-5]. In addition to posing challenges to quan-tification, the matrix effect also results in the suppression ofthe analyte signal and lower sensitivity. Several approacheshave been investigated to address matrix effects and improvesensitivity [6-14]. Some researchers have used post-columnadditions of methanoic acid [6] and trifluoroacetic acid in 2-propanol[7] into the LC flow to reduce or prevent analyteionization suppression. Others investigated different off-lineclean-up procedures [8] and on-line LC-LC[9-11] to cleanup the samples and to address matrix effect and reduce signalsuppression. Another apparent way to improve LC-MS/MS sensi-tivity and limit of detection (LOD) is to inject a largervolume of samples. In fact, large volume injection (LVI)has long been widely implemented in GC [15]. LVI withHPLC and LC-MS have also been demonstrated for envi-ronmental analysis mostly in simple matrices [16]. However, direct LVI of complex matrix extracts into LC-MS/MS sys-tem may induce matrix signal suppression and also resultin peak broadening and degrading chromatographic separa-tion. Therefore a common practice for analysis in complexbiological matrices is to utilize off-line sample prepara-tion to clean up and concentrate the sample before injec-tion. Indeed solid phase extraction (SPE) can be utilizedfor the large volume sample preparation approach. In SPE,the application of a larger volume of plasma or urine sam-ple onto the SPE cartridge does not affect the SPE pro-cedure in any significant way. However, conventional SPEmethod development is fairly time consuming. In addition,sample preparation using conventional SPE, even with theliquid handling robot with 96-well capability, still requireshuman intervention throughout the entire sample preparationprocess. On-line sample clean up such as LC-LC-MS [17],LC-LC-MS/MS [18] and column switching [19,20] allowslarge volume injection and offers cleaner and faster samplepreparation and analysis.Furthermore, most LC-LC methodsrequire matrix dilution or off-line clean up before injection.On another front, recent advancement in on-line SPE instru-mentation brings an integrated, robust, easier to set up, lowercost and efficient alternative to conventional SPE, LC-LCand column switching [21-24]. In this paper, we report a systematic study to improvebioanalytical sensitivity and detection limits (in terms ofS/N) by using the LVI approach in combination withon-line SPE-LC-MS/MS. We studied and developed LVImethods for the analysis of drugs in plasma, whichmaintained the chromatographic separation and selectiv-ity and, allowed for increased sensitivities and improvedLOD without inducing matrix and signal suppressioneffects. 2. Experimental 2.1. Chemicals and materials Propranolol and ketoconazole were purchased fromSigma (St. Louis, MO, USA). Fig. 1 shows the chemical structures of propranolol as well as the internal standard(IS),ketoconazole. HPLC grade methanol, acetonitrile andwater were obtained from J.T. Baker (Philipsburg, NJ,USA). Ammonium acetate, ammonium formate, formicacid, acetic acid and ammonium hydroxide were purchasedfrom J.T. Baker (Philipsburg, NJ, USA). C18 Luna col-umn (2.1 mm × 50 mm, 5 um) was purchased from Phe-nomenex (Torrance, CA, USA). The HySphere C18 HDcartridges (2mm×10 mm) were obtained from Spark Hol-land (Netherlands). Blank pooled rat plasma was purchasedfrom Biochemed Pharmaceuticals Inc. (Winchester, VA,USA). 2.2. Chromatographic conditions The new on-line SPE Symbiosis System(Spark Holland,Netherlands) is composed of two integrated units: auto-sampler (Reliance) with binary LC pumps and the on-lineSPE unit with a pair of high-pressure solvent delivery pumps(HPDs). Up to two 96-well SPE cartridge plates can be usedfor a single batch. While one cartridge is eluting on the rightclamp, the next one is being pre-conditioned in the left clamp.The ACN eluate, combined with LC gradient, is loaded ontoHPLC column for LC-MS/MS analysis. The entire systemis controlled by one software package (SparkLink), whichinterfaces with MS controlling software Analyst 1.3. LC andextraction methods as well as sample list run tables are createdwith the Spark-Link software and submitted to the Analyst1.3. Flow rate was set at 0.8 mL/min.The LC pumps gradientprofile is shown in Table 1. The mobile phase consisted ofsolvent A (5 mM ammonium acetate buffer, pH7) and solventB (acetonitrile). 2.3. Mass spectrometry conditions Mass spectrometry detection was carried out in the pos-itive electrospray (ESI) ion mode using API 4000 (Sciex,Concord, Ontario,Canada) triple quadruple system. Table 2shows the MS parameters used for the detection of propra-nolol/ketoconazole (IS). Fig. 1. Chemical structures of propranolol and ketoconazole. Table 1HPLC gradient table Time (min) B (%) 0:00 0 1:30 0 2:30 70 3:00 70 3:05 95 3:25 95 3:30 0 4:00 0 A: 5 mM ammonium acetate buffer, pH 7; B: acetonitrile. Table 2MS parameters for detection of propranolol and ketoconazole (IS) Propranolol Ketoconazole Ionization mode Positive Positive Curtain gas (CUR) (psi) 10 10 Collision gas (CAD) 5 5 Ion spray voltage (IS) (V) 3000 3000 Temperature (TEM) (C) 700 700 Ion source gas 1 (GS1) (psi) 85 85 Ion source gas 2 (GS2) (psi) 80 80 Declustering potential (DP) (V) 71 106 Entrance potential (EP) 10 10 Collision energy (CE) (eV) 27 43 Collision cell exit potential (CXP) (V) 8 10 MRM transition monitored (amu) 260/116 531/489 2.4. Sample extraction The HySphere C18 HD (2mmx10mm) was the cartridgeof choice because it yielded the highest recovery, retentionand satisfactory peak shape for both propranolol and keto-conazole. Table 3 lists the steps of the sample extractionprocess as performed by the Symbiosis system. On-line sam-ple extraction procedure is discussed in details elsewhere[24]. 2.5. Preparation of standards and calibration curves Stock solutions of propranolol and ketoconazole were pre-pared directly from solids in acetonitrile (ACN) at 1mg/mLconcentrations and not corrected for salt and purity. Ana-lyte (propranolol) working stock solutions of concentra-tions 10, 100 and 1000 ng/mL,as well as internal standard(ketoconazole) 1 ug/mL working stock solution were pre- Table 3 pared from the stock solutions by dilution with distilledwater. QC stock solutions were prepared from a differentweighing of drugs than calibration standards and stored in-20°C freezer along with the calibration standards. Blankrat plasma (850pL) was spiked with 50 pL of internal stan-dard stock solution and the proper volume of analyte stocksolution and water to prepare the calibration curve and thequality control (QC) points. Final volume of the standardand QC solutions were 1mL. Calibration curves were con-structed of the following concentrations: 0.1, 0.2, 0.5, 1,5,10, 50 and 100 ng/mL, with three replicates at each point.Five QC replicates of each of the concentrations 0.2, 1 and50 ng/mL were used to validate the calibration curves. Thefinal ketoconazole (IS) concentration in plasma standardsand QCs was 50 ng/mL. One double blank and one blank(blank +internal standard) were analyzed at the beginning ofeach batch. 2.6. Data analysis Quantitative data processing was done using Analyst 1.3.Precision was calculated as percent relative standard devi-ation (% R.S.D.) of the analyte to internal standard peakarea ratio obtained from replicates (n=5) of each QC point.Accuracy was calculated as the percent bias of the calculatedconcentration relative to the nominal concentration of eachQC point. 3. Results and discussions Direct LVI of plasma samples using on-line SPE-LC-MS/MS was systematically investigated. Specific parame-ters studied included chromatographic characteristics,LOD,recovery and matrix effect, assay robustness and quantitativeanalysis parameters. 3.1. Chromatographic characteristics To illustrate the advantages of LVI, 5 and 50 p.L propra-nolol and ketoconazole neat samples (in water) were directlyinjected into the LC, bypassing the online SPE portion.Increasing the injection volume from 5 to 50 pL resulted ina chromatographic peak width increase of 50% (at FWHM).However, utilization of the on-line SPE to concentrate andclean up samples allowed retention of chromatographic sep- On-line SPE parameters Solvent Flow rate (mL/min) Volume (mL) Duration (min) Equilibration 1 Acetonitrile 5 1 0.2 Equilibration 2 5 mM ammonium acetate buffer (pH7) 5 1 0.2 Loading 5 mM ammonium acetate buffer (pH 7) 2 0.5 0.25 Washing 5 mM ammonium acetate buffer (pH 7) 5 1 0.2 Elution Acetonitrile 0.14 0.2 1.5 330 Fig. 2. Chromatograms of the 5 p.L(1a) and 50 p.L (2a) injections of propranolol (5ng/mL) and ketoconazole (500 ng/mL) plasma samples and their backgroundnoise (1b and 2b, respectively) using on-line SPE-LC-MS/MS method. aration and peaks widths. Fig. 2 shows representative chro-matograms of the 5 pL (1a) and 50 pL (2a) injections ofpropranolol and ketoconazole obtained in plasma using on-line SPE-LC-MS/MS method. Note that the LC conditionsin the on-line SPE-LC/MS/MS method were identical to theHPLC only method. Inspections of Fig. 2(1a and 2a) revealssignificant increase of sensitivity for both propranolol andketoconazole (i.e. peak height) while preserving chromato-graphic parameters and separation (i.e. retention time, peakwidth, peak shape and peak separation; see 1a and 2a insets).Therefore on-line SPE’s near constant peak FWHMs withincreased injection volumes lays one of the foundations forsensitivity improvement. 3.2. Increase of limit of detection (LOD) Improvement of analyte S/N or LOD requires increase ofpeak height (area) while maintaining low noise and back- ground levels. Fig. 2(1b and 2b) shows background noisefor 5 and 100 pL injections of propranolol and ketoconazoleplasmasamples. Fig. 3 shows the Q1 scans of blank plasma at5 paL (a) and 100 pL (b) injection volume, averaged between2.0 and 2.4 min. Note that the maximum intensities of back.ground noise peaks stay essentially the same. The 100 u.Lblank plasma injection has more background noise between250 and 450 amu than the 5 uL injection, but the increase isfar from proportional to injection volume, and is not reflectedin MRM traces. The method developed for the analysis of pro-pranolol and ketoconazole (see Table 3) allows for efficientclean up and washes out most of the matrix (plasma) com-ponents. SPE cartridge binding capacity allows for analyteretention despite increase of the matrix load with LVI. There-fore the matrix interference and background level stay lowand essentially independent of the volumes of the injectionsstudied. As a result, sensitivity, S/N and LOD increase withthe sample injection volume. This is the other foundation for m/Z,amu Fig. 3. Q1 scans for (a) 5 pL and (b) 100 pL blank plasma injections, averaged between 2.0 and 2.4 min. Fig. 4. Propranolol signal intensity vs. injection volume. sensitivity and LOD improvement using LVI in combinationwith on-line SPE-LC-MS/MS. . Fig. 4 shows the signal intensity ratio (relative to 1 pLinjection) obtained for propranolol in plasma versus injec-tion volume. Increase of the injection volume bya factorof 10 (i.e. from 5 to 50 pL) resulted in increase of propra-nolol signal intensity by a factor of 9. The signal increaseis not exactly proportional to the increase of the injectionvolume probably due to the complex interactions betweenanalytes, SPE sorbent and plasma interferences. Neverthe-less, Figs. 3 and 4 demonstrate that signal intensity, S/N andLOD can be improved using LVI. Furthermore this increasehas near linear relationship to the increase of injection vol-ume. 3.3. Recovery, matrix effect and assay robustness Increase of sensitivity and LODby increasing theinjectionvolume in on-line SPE-LC-MS/MS is ultimately limited bythe matrix effect and analyte recovery. Specifically, the vol-ume of biological fluid that the extraction method and theSPE cartridge can handle without introducing matrix effector failure to retain analyte is limited. No significant signal suppression of the on-line SPE elu-ate was observed. Response of a single injection of plasmasample on the SPE cartridge was found to be above 90% ofthat of a neat sample, for up to 100 pL injection volumesHowever, further increase of a single injection volume leadsto a lower recovery and signal suppression effects. Fig. 5shows the signal intensity increase vs. number of injectionsfor single cartridge use and multiple uses (five injections onone cartridge). It demonstrates that utilization of a single car-tridge for multiple injections results in smaller improvementof signal intensity compared to single injections. Significantchange occurs after loading of 125 pL of plasma (25 pL×5injections) and further exacerbates for 250 pL (50 uL x 5injections). This data demonstrated that a percentage of SPEsorbent capacity is taken with each injection. Eventually,sorbent capacity diminishes and will negatively affect theretention of analytes, causing low recovery and further sig-nal decrease. 嘴Single use of a cartridge Injection volume (pL) Fig.5. Single vs. multiple use of a cartridge. ◆Propranolol Cartridga 1 Koloconazdle Cartridge 1 ◆Propranolol Cartidge 2Ketoconazole Cartridge 2 Fig. 6. Number of 50 pL plasma sample injections using the gradient LCmethod. Fig. 6 demonstrates failure of the SPE sorbent after mul-tiple injection of plasma. This experiment was repeated fordifferent cartridges and different lots. In most cases each car-tridge can handle up to 250 pL of plasma. Note that cartridgeis reconditioned between injections. Therefore, in our case,individual injection of up to 100 pL plasma sample should bereliable as long as the total plasma volume passed is within250 uL. 3.4. Quantitative analysis To demonstrate the suitability of LVI of plasma samplesusing on-line SPE-LC-MS/MS, quantitative analysis wascarried out with three injection volumes: 5, 50 and 100 uL.At each injection volume, the curve was repeated three times,with the QC samples bracketed by the standards. Three setsof SPE cartridges were used for the three 5 uL injections.The same sets were reused for 50 uL, and then 100 uLinjections. Therefore, each individual SPE cartridge wasloaded with no more than 200 pL of plasma samples. Aftera total of 235 injections the system pressure only increasedslightly. Fig. 7 shows the calibration curves obtained for 5,50 and 100 uL injections for 0.1-100 ng/mL range. Corre- M. Li et al./J. Chromatogr. B 825 (2005)152-160 Fig. 7. Calibration curves of 5 pL (top), 50 pL (middle) and 100 p.L (bottom) plasma sample injections. 876S4321 Table 4 Injection volume (pL) 5 50 100 Regression Linear Quadratic Quadratic Weighting 1/x 1/x2 1/x- Equation Y=0.149x+0.0319 Y=-9.89e-006x²+0.213x-0.00725 Y=0.000617x+0.277x-0.0028 R² 0.9990 0.9928 0.9924 Precision(%R.S.D.n=5) QC 0.2 5.88 9.76 9.24 QC 1 6.99 6.58 3.52 QC 50 3.52 5.62 9.98 Average accuracy (%) QC 0.2 95.1 92.5 105.8 QC1 93.3 94.8 102.4 QC 50 100.1 102.9 107.2 lation coefficients obtained for 5, 50 and 100 pL injectionvolume are greater than 0.99. Table 4 summarizes the preci-sion, accuracy and calibration curve fitting results. Analysisaccuracy and precision were comparable for all injection vol-umes. A close look at the chromatograms of the 100 uLinjections of the 0.1 ng/mL plasma standard into the on-lineSPE-LC-MS/MS system reveals that the S/N ratio for pro-pranolol was about 40. Assuming that at LOD the S/N=3, thison-line SPEsystem is capable of detecting a much lower levelof propranolol in plasma. Based on results of multiple injec.tions on one cartridge, injection volume may be increased upto 200 uL plasma with linear increase of sensitivity and detec-tion limits. Further increase of sensitivity and detection limitswould be limited by the cartridge binding capacity and can beaddressed by increasing the SPE cartridge size. Another limit-ing factor is system carryover. Although carryover is insignif-icant for LVI of 0.1 ng/mL or more concentrated samples, atconcentrations much lower than 0.1 ng/mL, system carryoverbecomes significant and hinders quantification. This issue iscurrently under investigation. 4. Conclusions The method of LVI was combined with on-line solid phaseextraction (SPE) for analysis of compounds directly in plasmausing LC-MS/MS detection. It was demonstrated that LVI ofplasma with on-line SPE-LC-MS/MS allows to improve sen-sitivity and detection limits without compromising chromato-graphic peak shape and resolution or inducing significantmatrix and signal suppression effects. Furthermore sensitiv-ity and detection limits improve linearly and proportionally tcthe injection volume up to 100 uL. Quantification of modelcompound in plasma demonstrated comparable calibrationcurve statistics, and measurement precision and accuracy for5,50 and 100pL of plasma injections. Therefore, the method-ology developed provides a reliable and simple alternative toimprove sensitivity and detection limits for high throughputsample preparation and analysis of compounds in plasma andother complex matrices. Acknowledgements The authors would like to thank Spark Holland Inc.and in particular Rob Castien, for providing the Symbio-sis Pharma system for evaluation. Special thanks go toSteven Eendhuizen, Dirk Hiemstra and Emile Koster of SparkHolland and John Lawrence of Pfizer for their technicalassistances, and Laurie Newman for manuscript editing andsuggestions. ( References ) ( [1] H. Bi, K.L. Hoffman, G. P a ce, D.T.Rossi, J. P h arm. Biomed. Anal.22 ( 2000) 861. ) ( [2] H.R. Liang, R.L. Foltz, M. Meng, P. Bennett, Rap i d Commun. MassSpectrom. 17 (2003) 2815. ) ( [3] P. Kebarle, L. Tang, Anal. Chem. 6 5 ( 1993) 972A. ) ( [4] I. Fu, E.J. Woolf, B.K. M atuszewski, Proceedings of the 8th In t er-national Symposium o n Pharmaceutical and Bi o medical An a lysis,Orlando, FL, May 4-8, 1 997 (Abstract M/P-A9). ) ( [5] B.K. Matuszewski, M.L. Constanzer, C.M. Chavez-Eng, Anal. C h em.70 (1998)882. ) ( [6] R.L. Airs, B.J. Keel y , Rapid Commun. Mass S pectrom. 14 (2000) 125. ) ( [7] J. Yamaguchi, Y. Matsuno, K. Hachiuma, N. Ogawa, S. H iguchi, R apid C ommun. M a ss Spectrom. 1 5 (2001) 6 29. ) ( [8] R. Bonfiglio, R.C. King, T.V. Olah, K. Merkle, R apid C ommun.Mass Spectrom. 13 (1999) 1 1 75. ) ( [9] B.K. Choi, D.M. H ercules, A.I. Gusev, Fresenius’J. Anal. Chem.369(2001). ) ( [10] B.K. C hoi, D.M. Hercules, A.I. Gusev, J. Chromatogr. A 907 ( 2001)337. ) ( [ 11] R . Pascoe, J.P. Foley, A.I . Gusev, Anal . Chem. 73 (2001) 6014. ) ( [ 12] J .J. Zheng, E .D. L ynch, S . E. U n ger, J . P h arm. Bi o med. Ana l . 28 ( 2002) 279. ) ( [ 13] M . S tueber, T. Reemtsma, Anal. B ioanal. C hem. 378 (2004) 910. ) ( [ 14] J . Chen, L . Y ang, J.T. K apron, L . Ma, E. Pace, P. Van, K. Colleen, P . R udewicz, J. Chromatogr. B 8 0 9 (2004) 205. ) ( [1 5 ] S. de Koning, M. K urano, H. Janssen, U .A.Th. Brinkman, J. C hro- m atogr. A 1 023 (2004) 165. ) ( [ 16] A.C. Hogenboom, M.P. Ho f man, S.J . Ko k , W. M .A. Niessen, U.A . Th. B rinkman, J. C hromatogr. A 8 9 2 (2000) 379. ) ( [ 17] E . van der Heeft, E. Dijkman, R .A. Baumann, E. A . Hogendoorn, J.Chromatogr. A 8 79 ( 2000) 39. ) ( [ 1 8] A. Polettin i , G.M . Bouland , M . Montagna, J . Chromatogr. B 713 (1998) 339. ) ( [ 1 9] J. Haglund, W.V. D ongen, F . Lemiere, E.L. Esmans, J . A m . Soc. M ass Spectrom. 15 ( 2004) 593. ) ( [20] W.M. Mullett, J. P awliszyn, J. Pharm. Biomed.An a l. 26(2001) 899.[21] A. M archese, C. McHugh, J. Ke h ler, H. Bi, J. Mass Spectrom. 33(1998) 1071. ) ( [22] A. Schellen, B. Ooms, D. van de Lagemaat, R . V reeken, W .D. van D ongen, J . C hromatogr. B : A nal. T echnol. Biomed. L ife S ci. 788(2003) 2 51. ) [23] R. Farran, M.T. Serafini, L. Martinez, M.J. Pretel, Adv. Mass Spec-trom. 15 (2001) 667. [24] E. Koster, P.Ringeling, B. Ooms, LC-GC North Am. (Suppl.)(2003)53. 生物样品的分析往往因基质复杂会引起色谱的峰展宽和灵敏度及检测限的下降。目前常用的方法是提高监测器灵敏度,采用预柱处理等。另外可以使用大体积进样的方式,可以在一定程度上改善这样的问题,但是将生物样品直接进行大体积进样,其中复杂的基质成份也会引起。因此生物样品的在大体积进样前通常需要先进行离线固相萃取进行样品净化。但是对于血浆或者尿液进行固相萃取的条件开发也非常费时,需要耗费大量的人力。在线样品处理与液质联用可以使得大体积进样的生物样品变得更干净,而且处理速度也快。此研究报道了大体积进样联合在线固相萃取的方式,来研究血清中的药物,通过在线固相萃取的使用,不仅可以保留柱子的选择性和分离性,还能进一步提高检测灵敏度和检测限。实验中使用的是Spark Holland 在线SPE Symbosis系统。
确定


还剩7页未读,是否继续阅读?

产品配置单
仪真分析仪器有限公司为您提供《血浆尿液中药物检测方案(固相萃取仪)》,该方案主要用于全血/血清/血浆中药物检测,参考标准--,《血浆尿液中药物检测方案(固相萃取仪)》用到的仪器有超高压液相在线SPE色谱联用系统CHRONECT Symbiosis
推荐专场

相关方案
更多
该厂商其他方案
更多