


方案详情
文
FBI实验室制定这个全新的快速而且高灵敏度的可卡因及其代谢产物的标准方法。该标准方法应用了在线固相萃取-高效液相色谱分离和串联质谱检测联用,实现全自动分析可卡因及其代谢物(benzoylecgonine,ecgonine ester,ecgonine 和 cocaethylene )在全血中的检测。样品只需要蛋白质沉淀和离心后尽可以直接进样。SPE萃取相为Hysphere的MM阴离子吸附剂。分析检测器为正离子模式电喷雾串联质谱 ,以提高选择性和灵敏度的方法。30 μL进样量提供了线性分析物8-500ng/mL 的线性范围,方法的检出限为3 〜 16 ng / mL和定量限[ LOQs ]为8-47ng/mL 。方法具有非常好的重现性。
方案详情

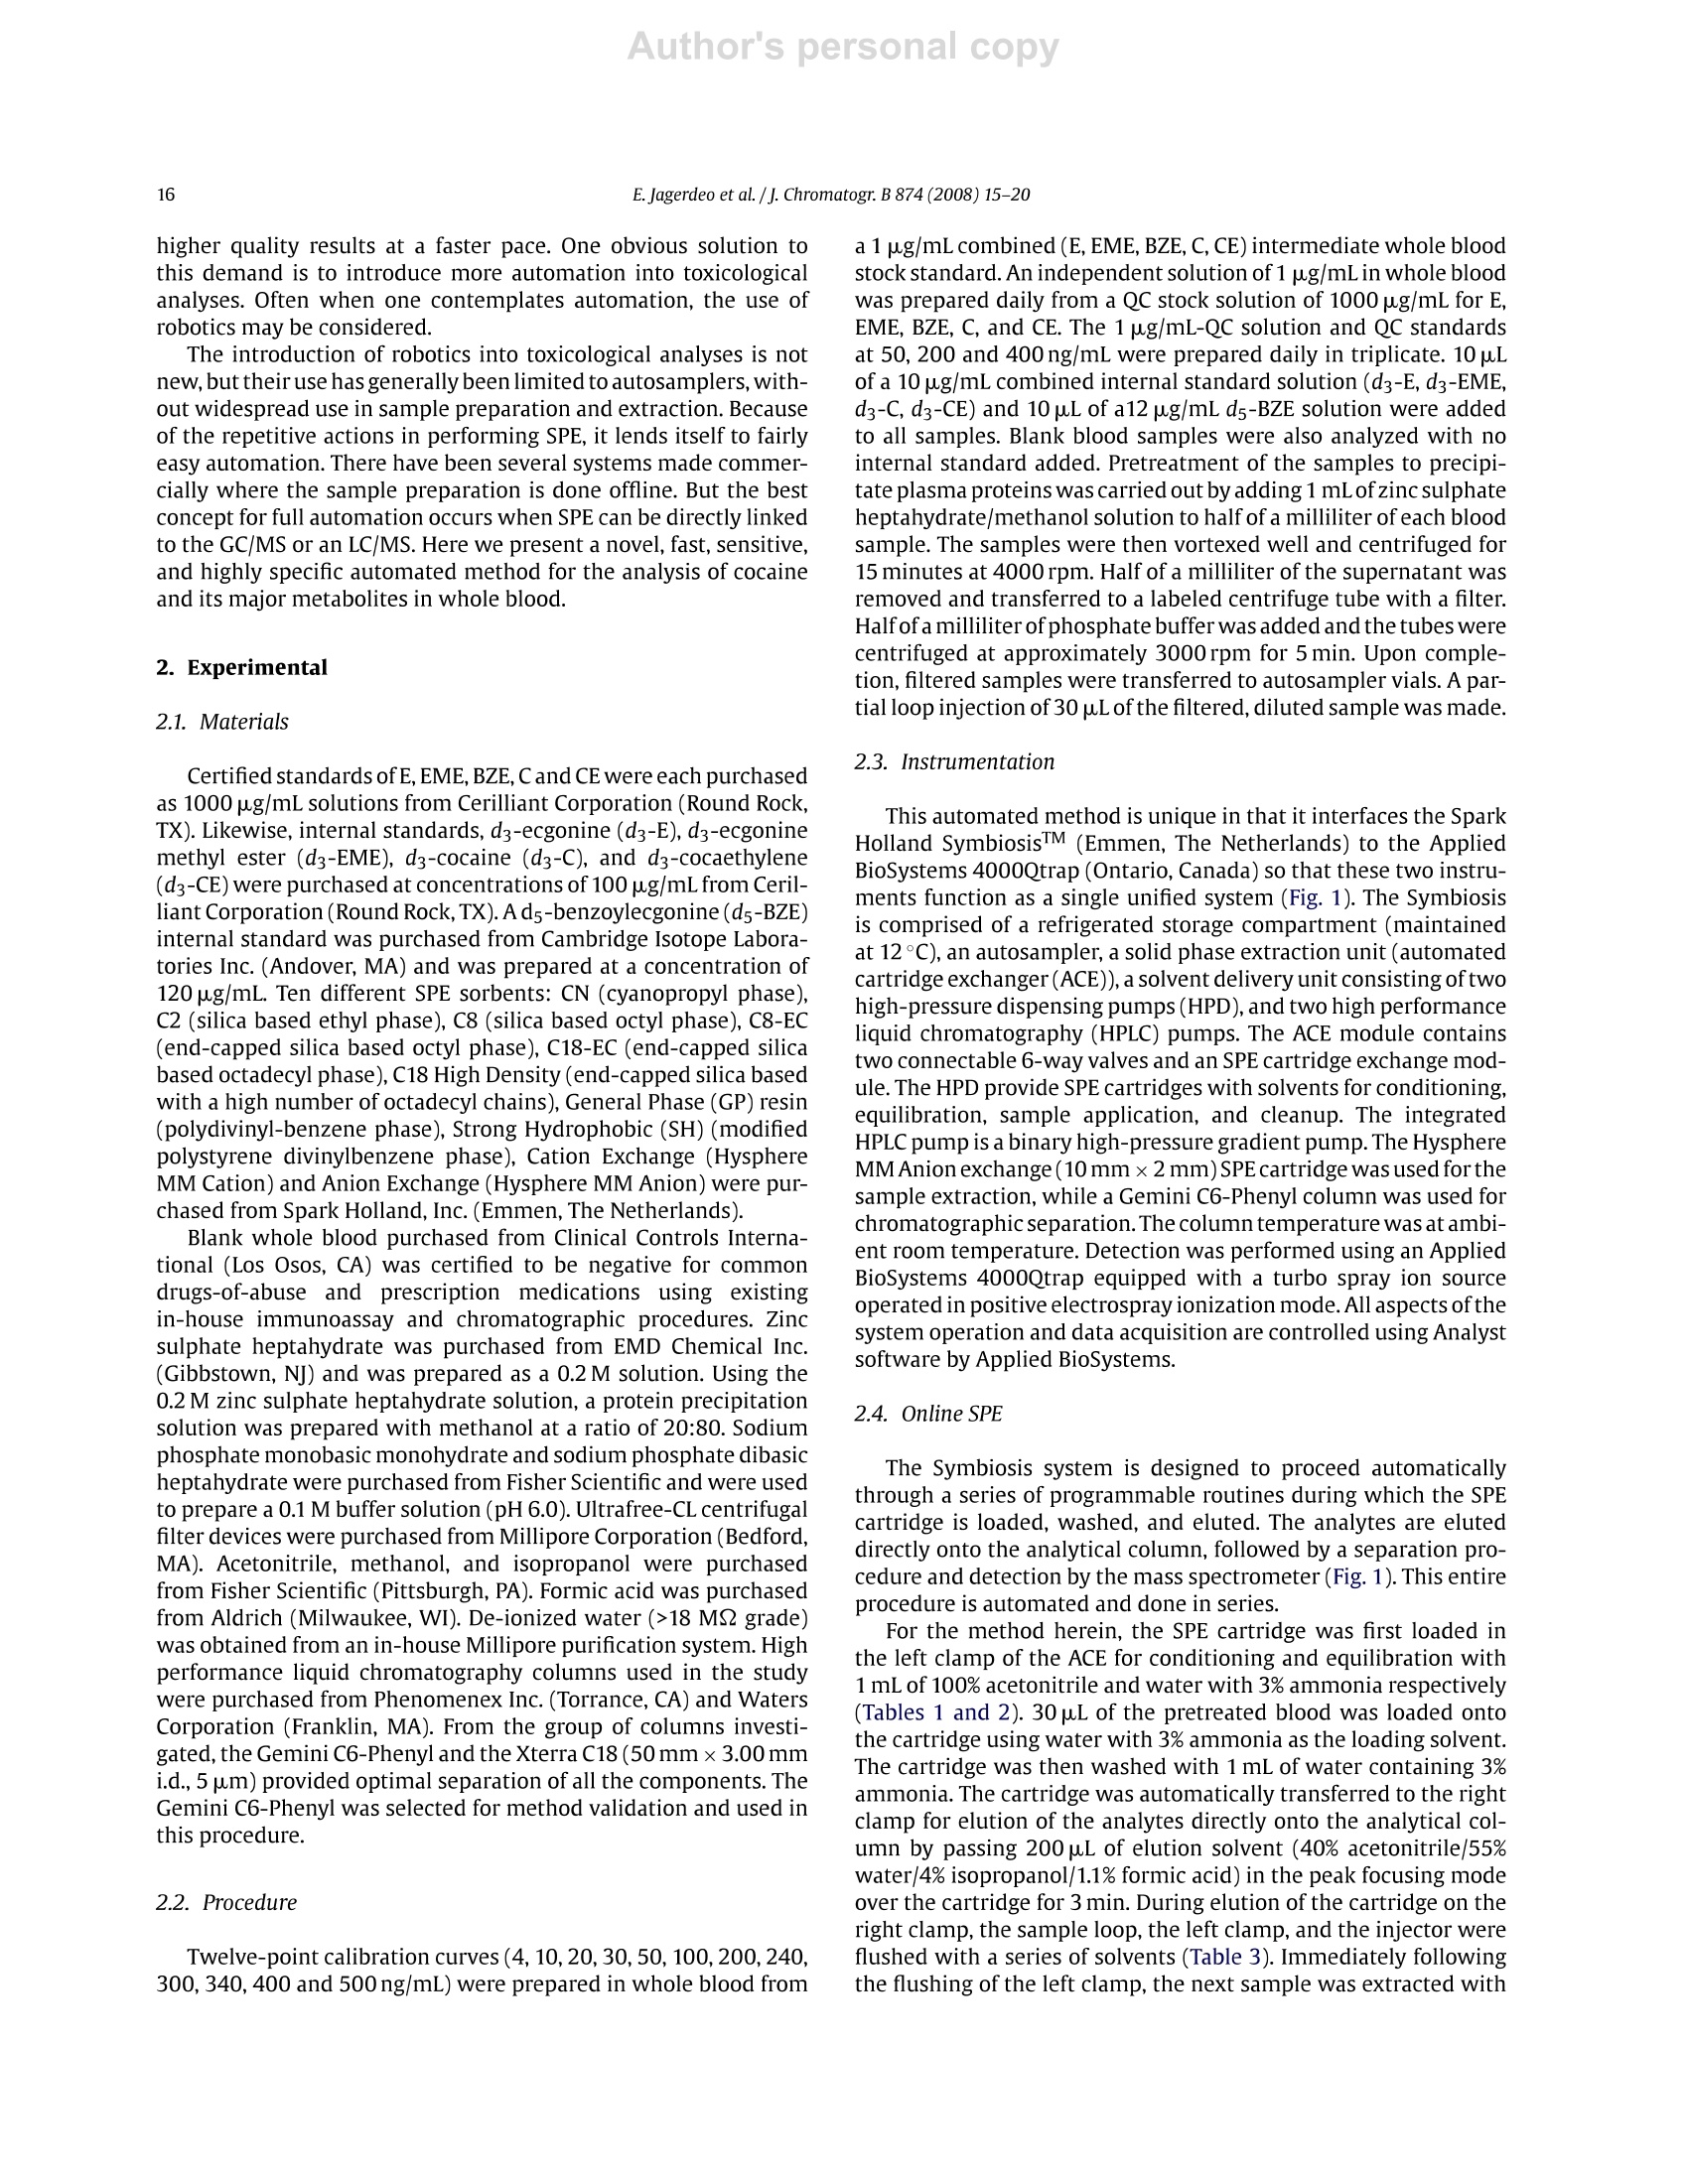
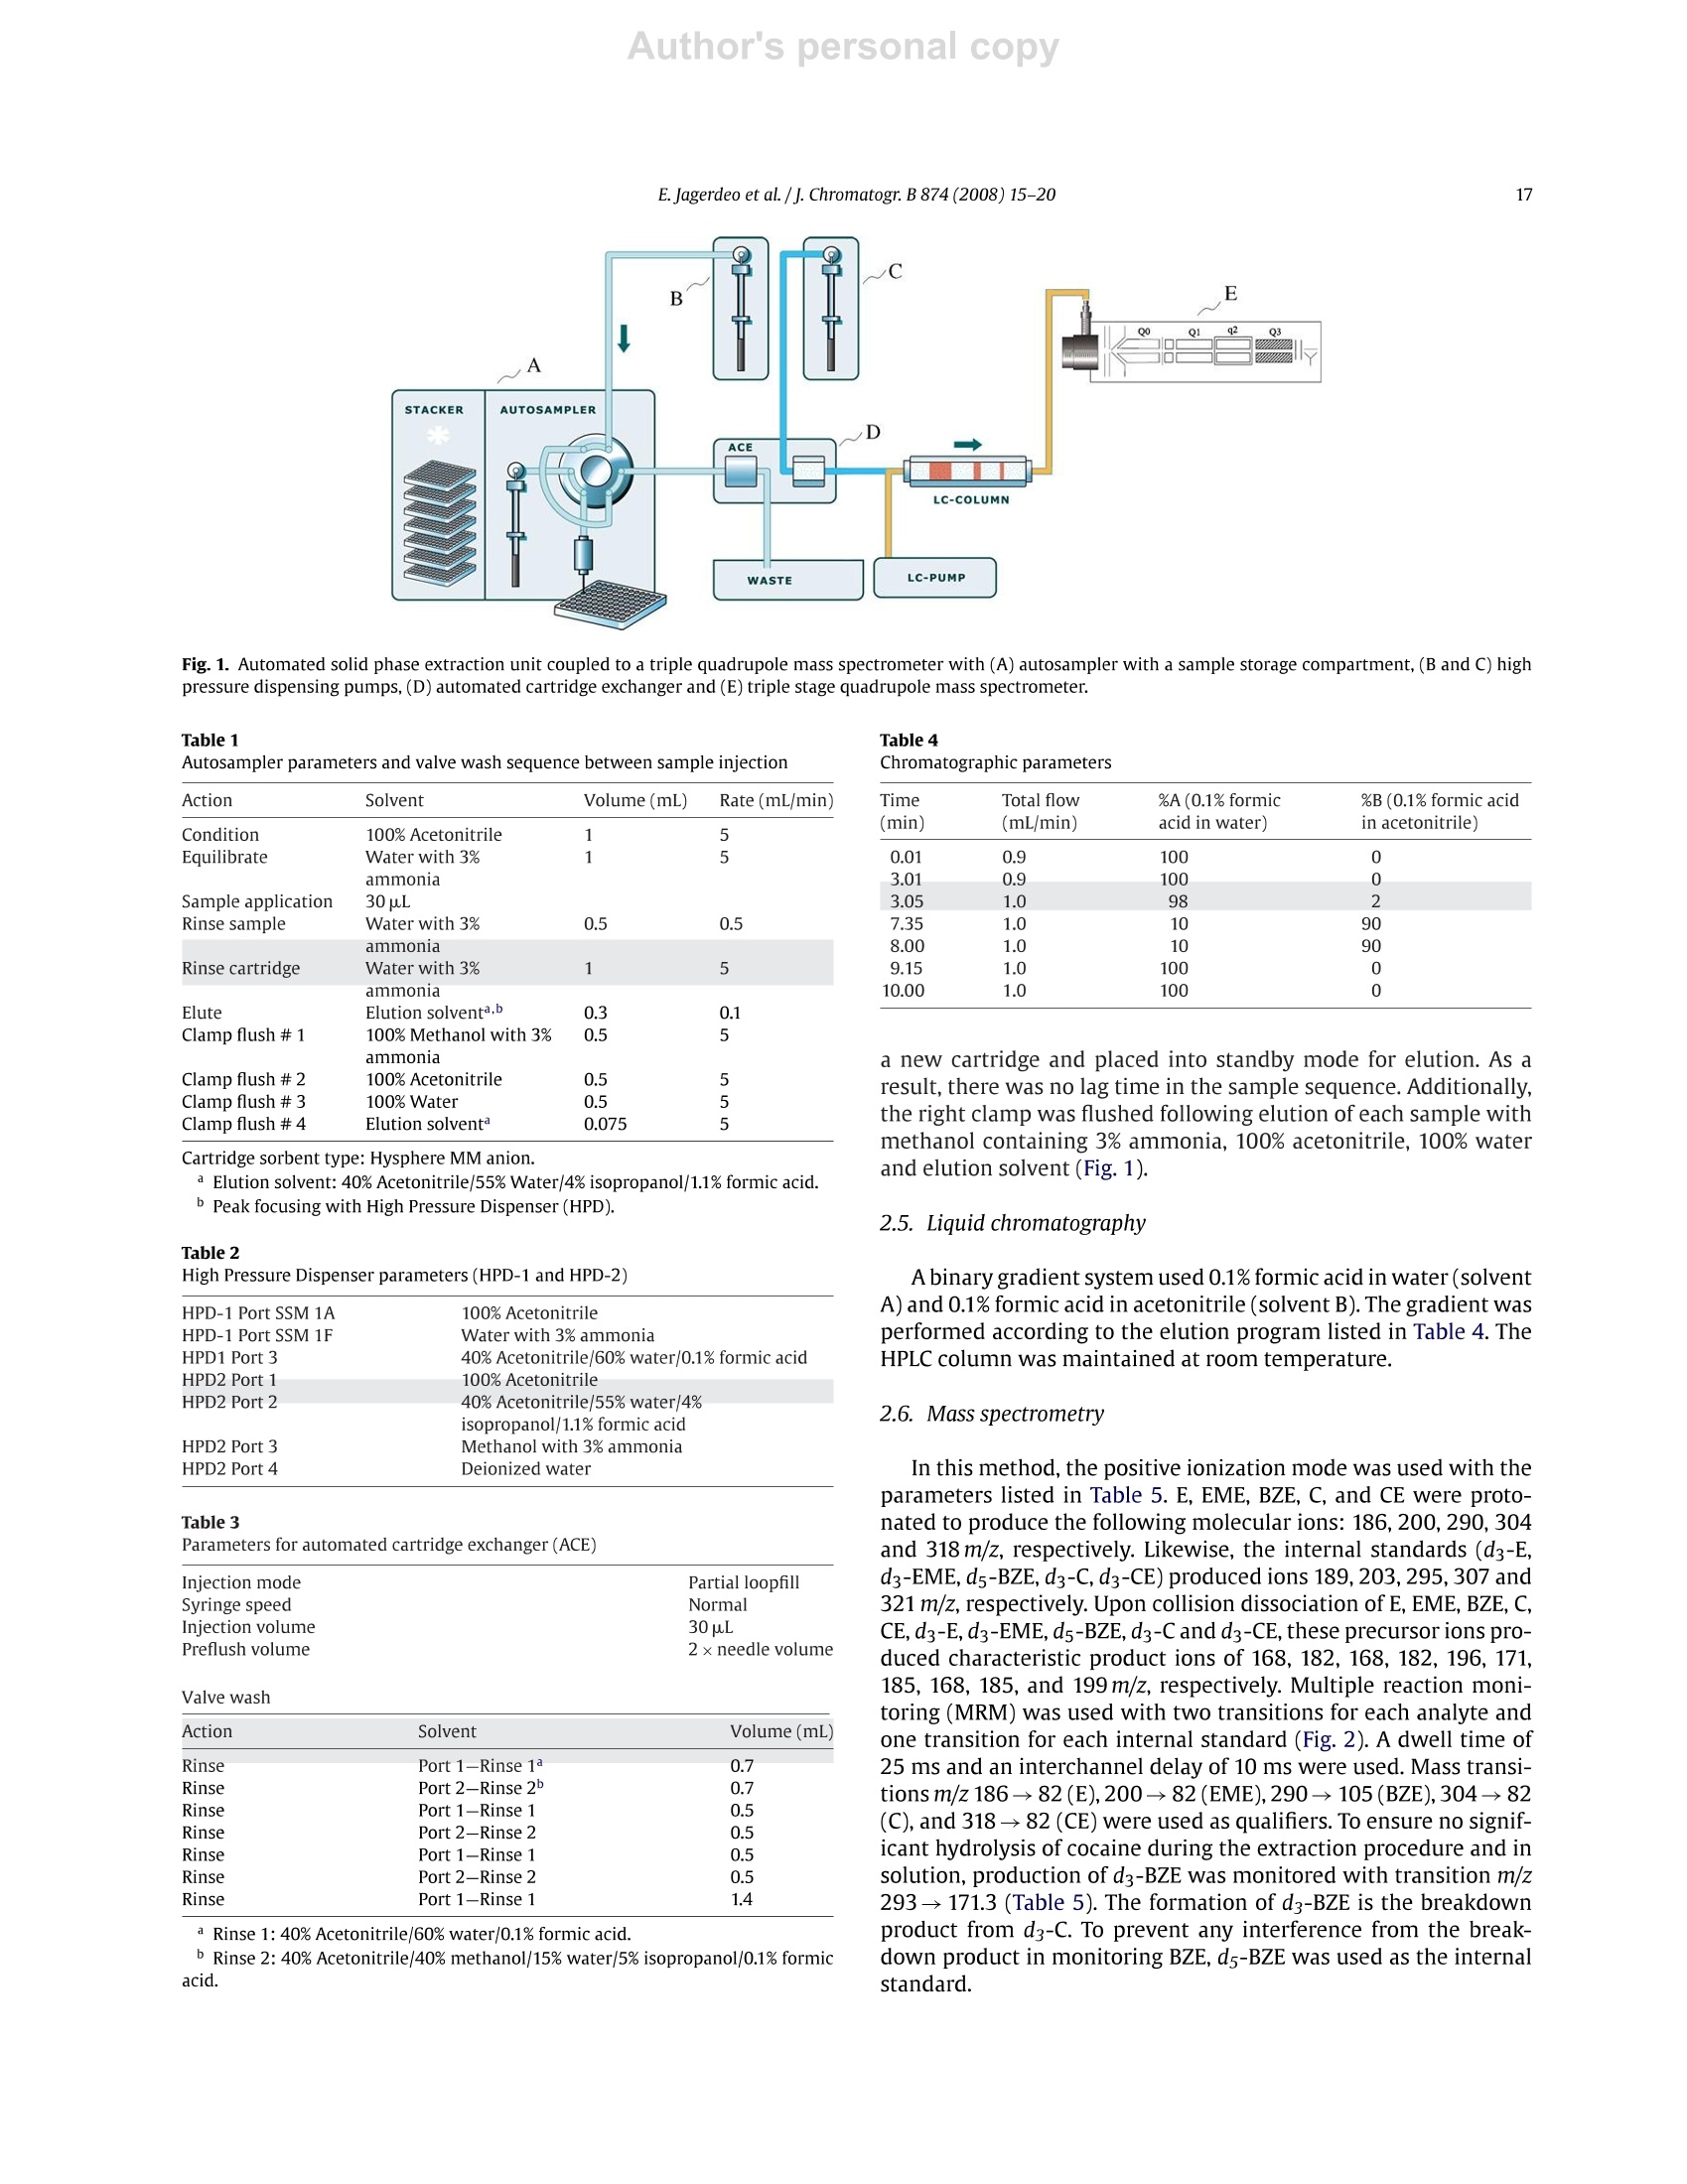
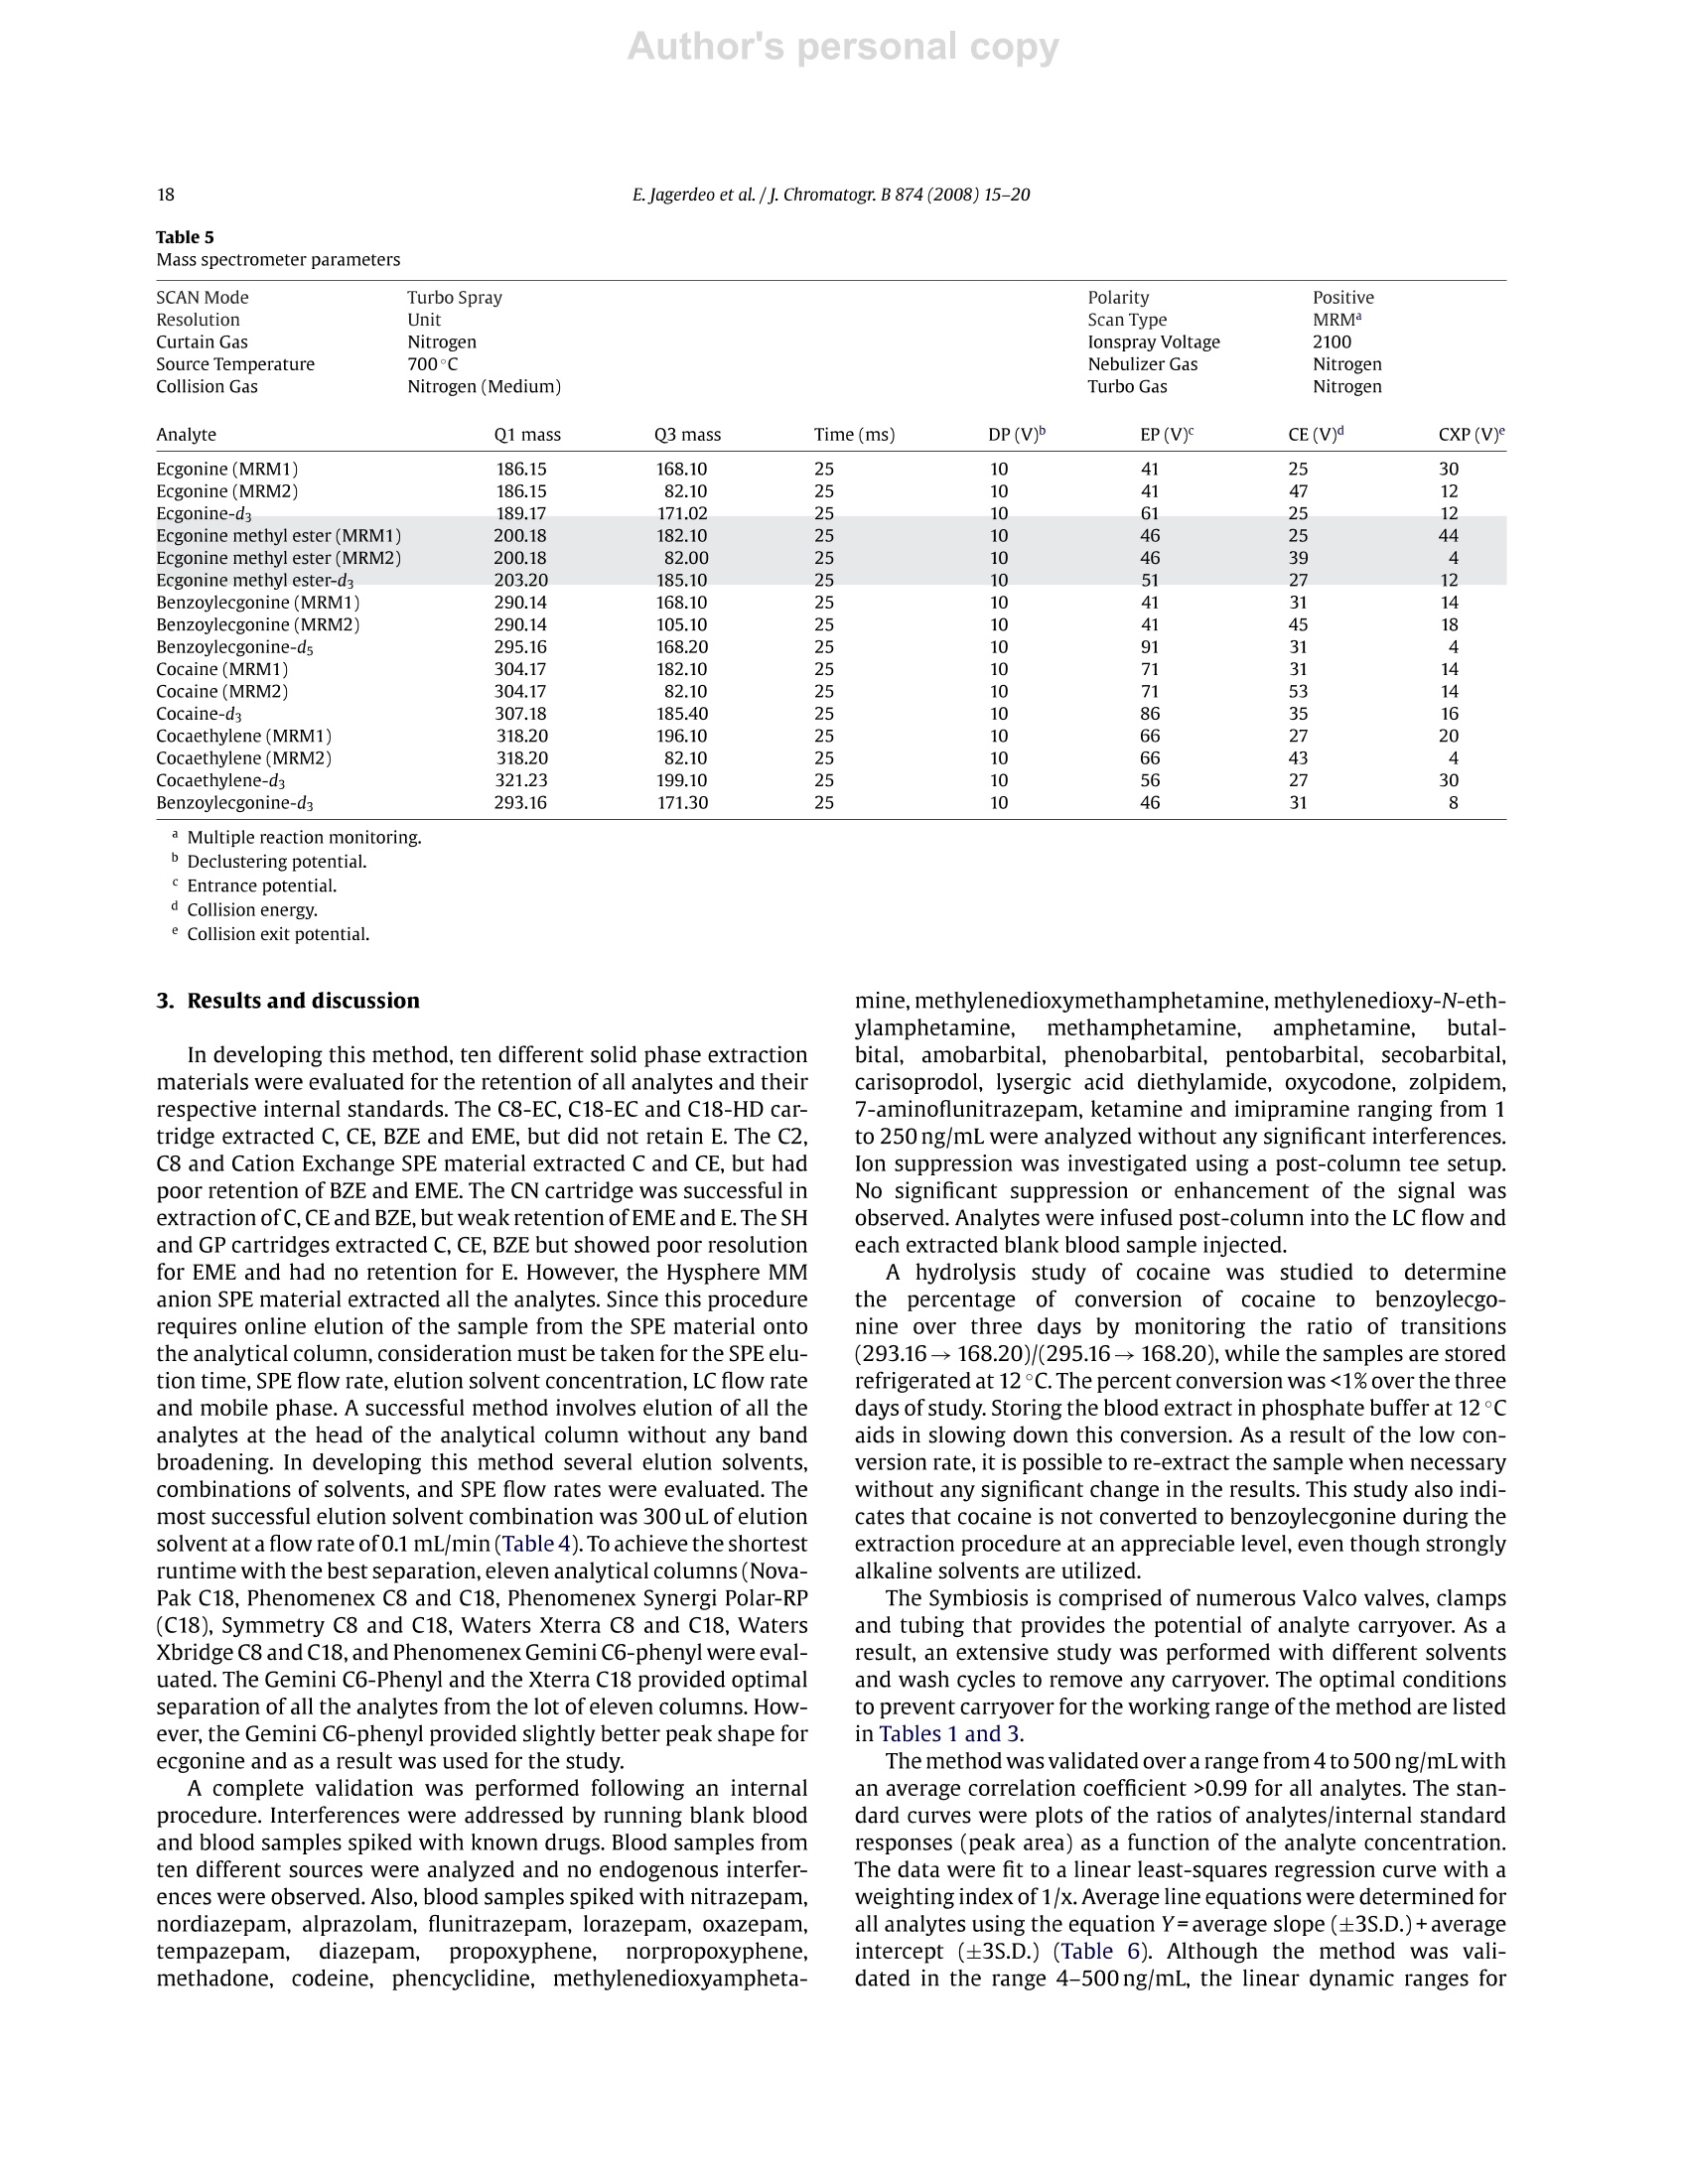
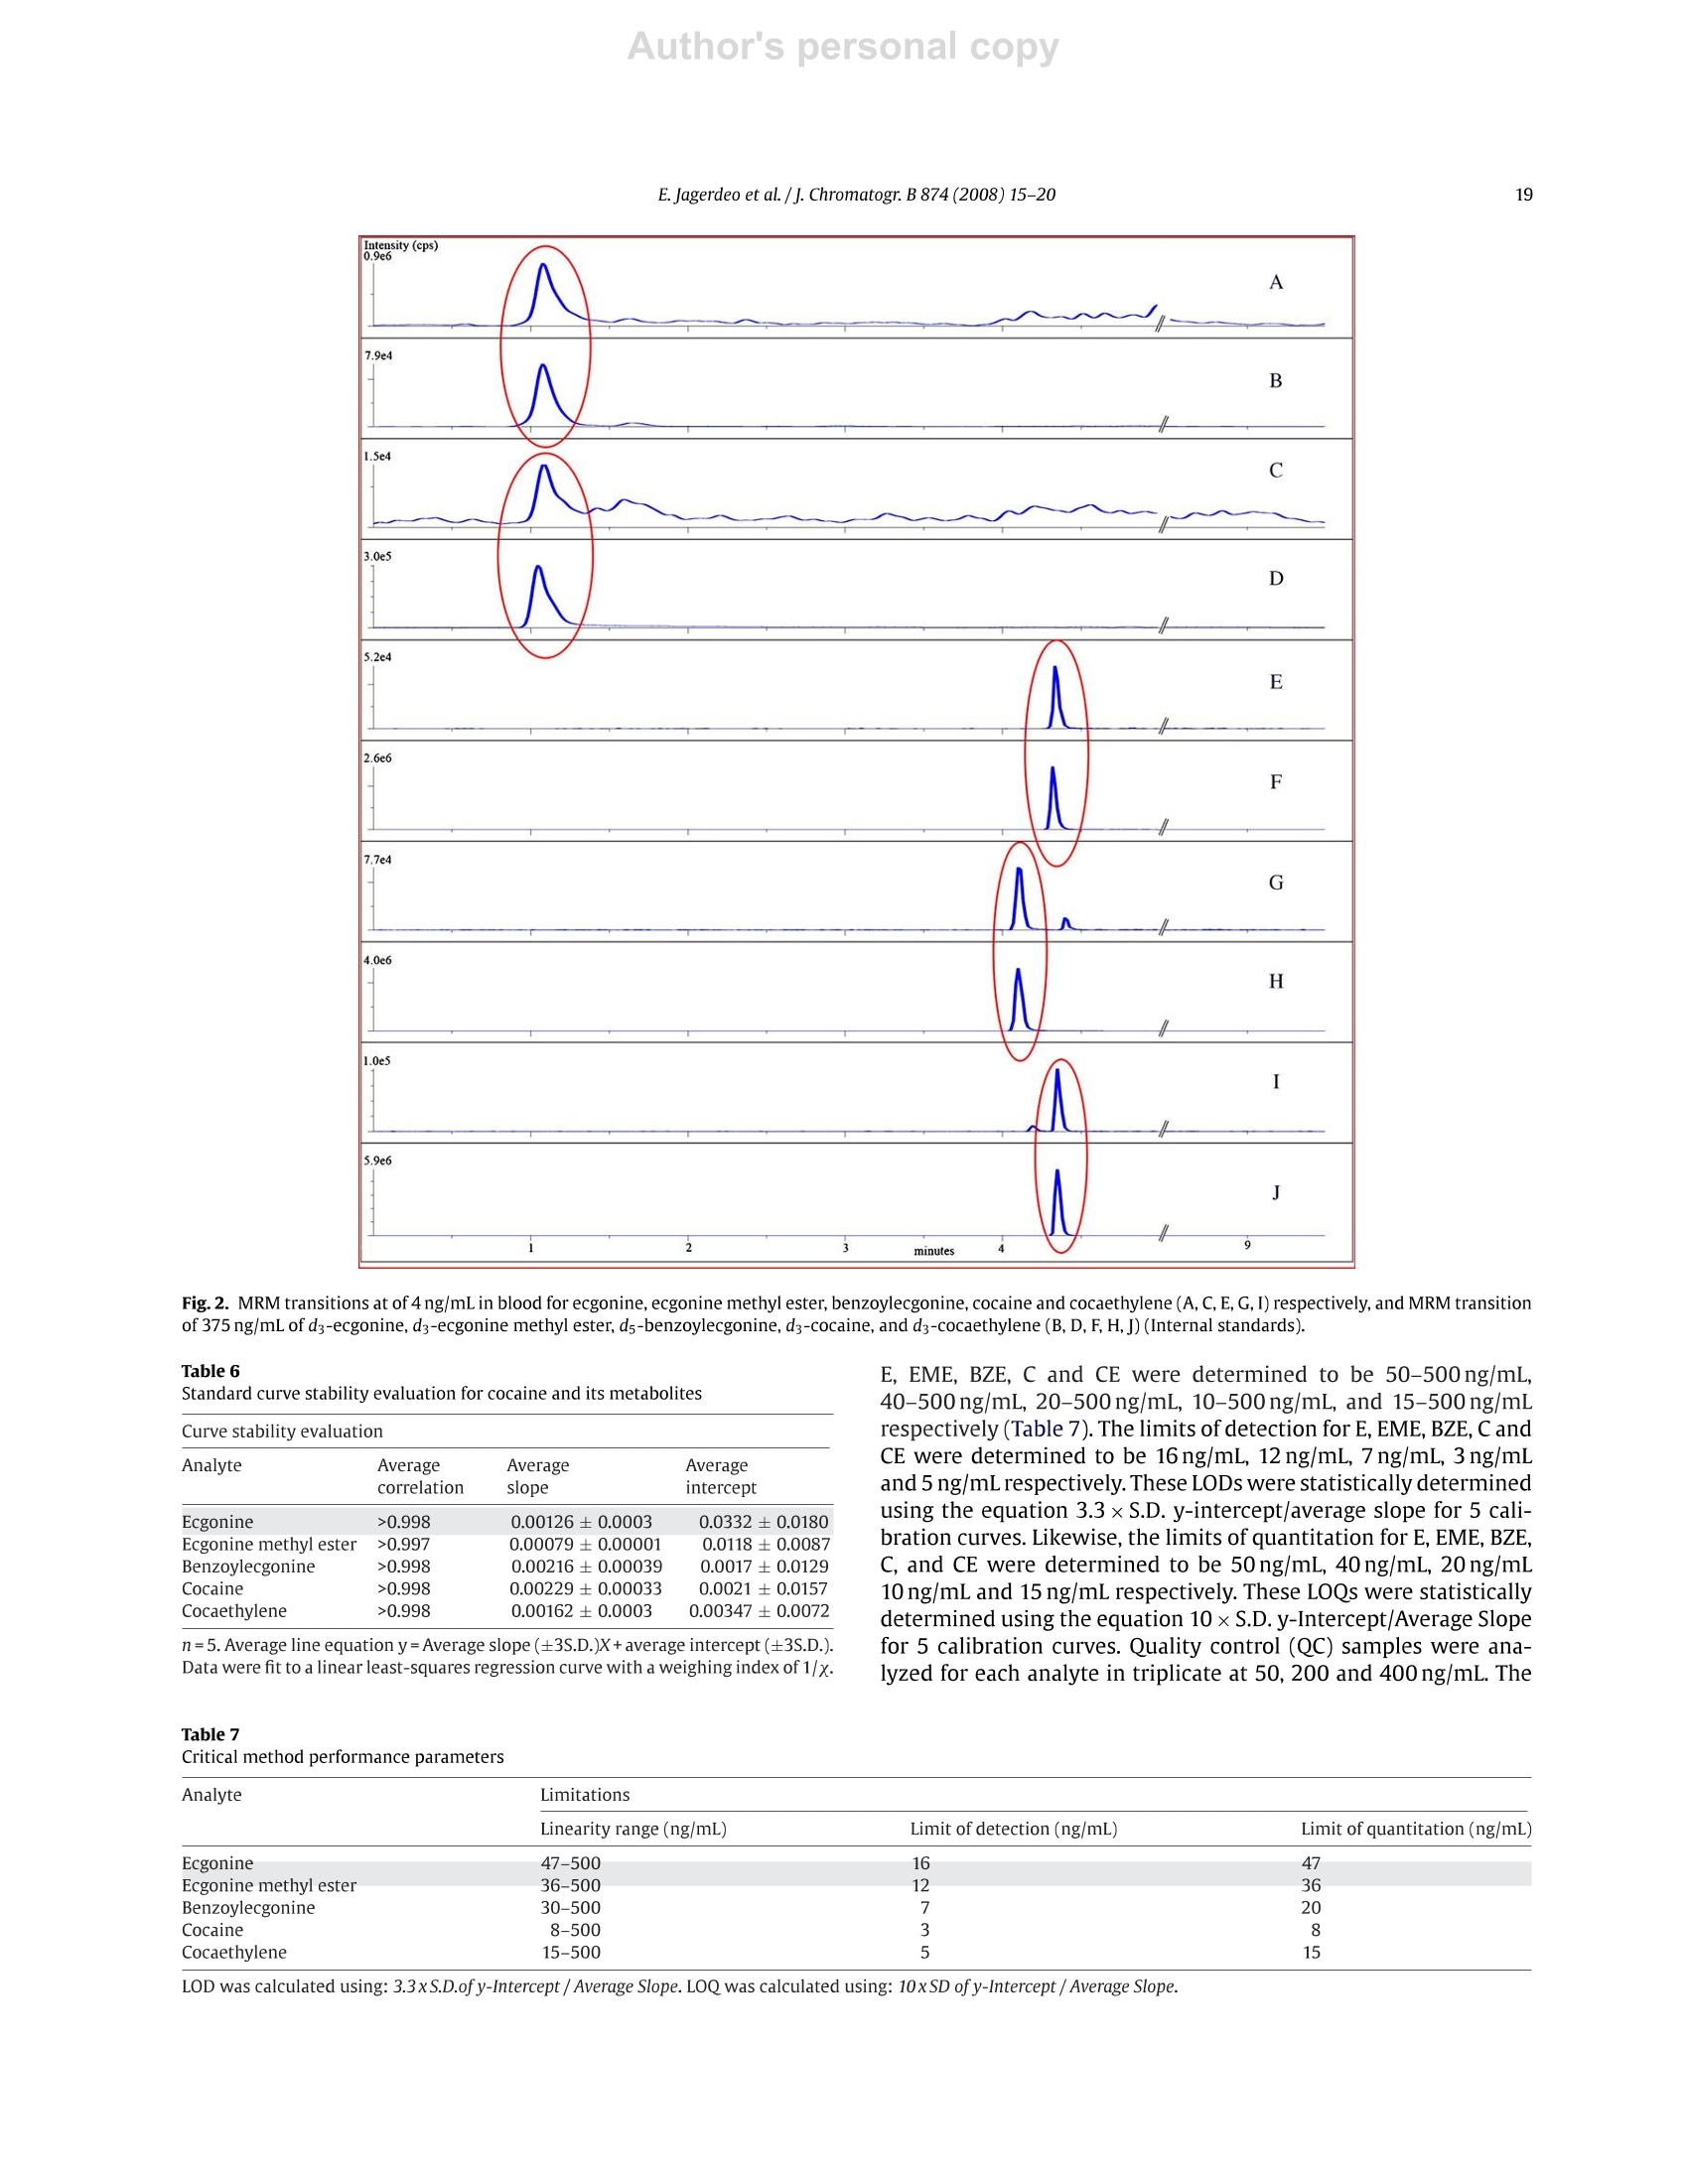
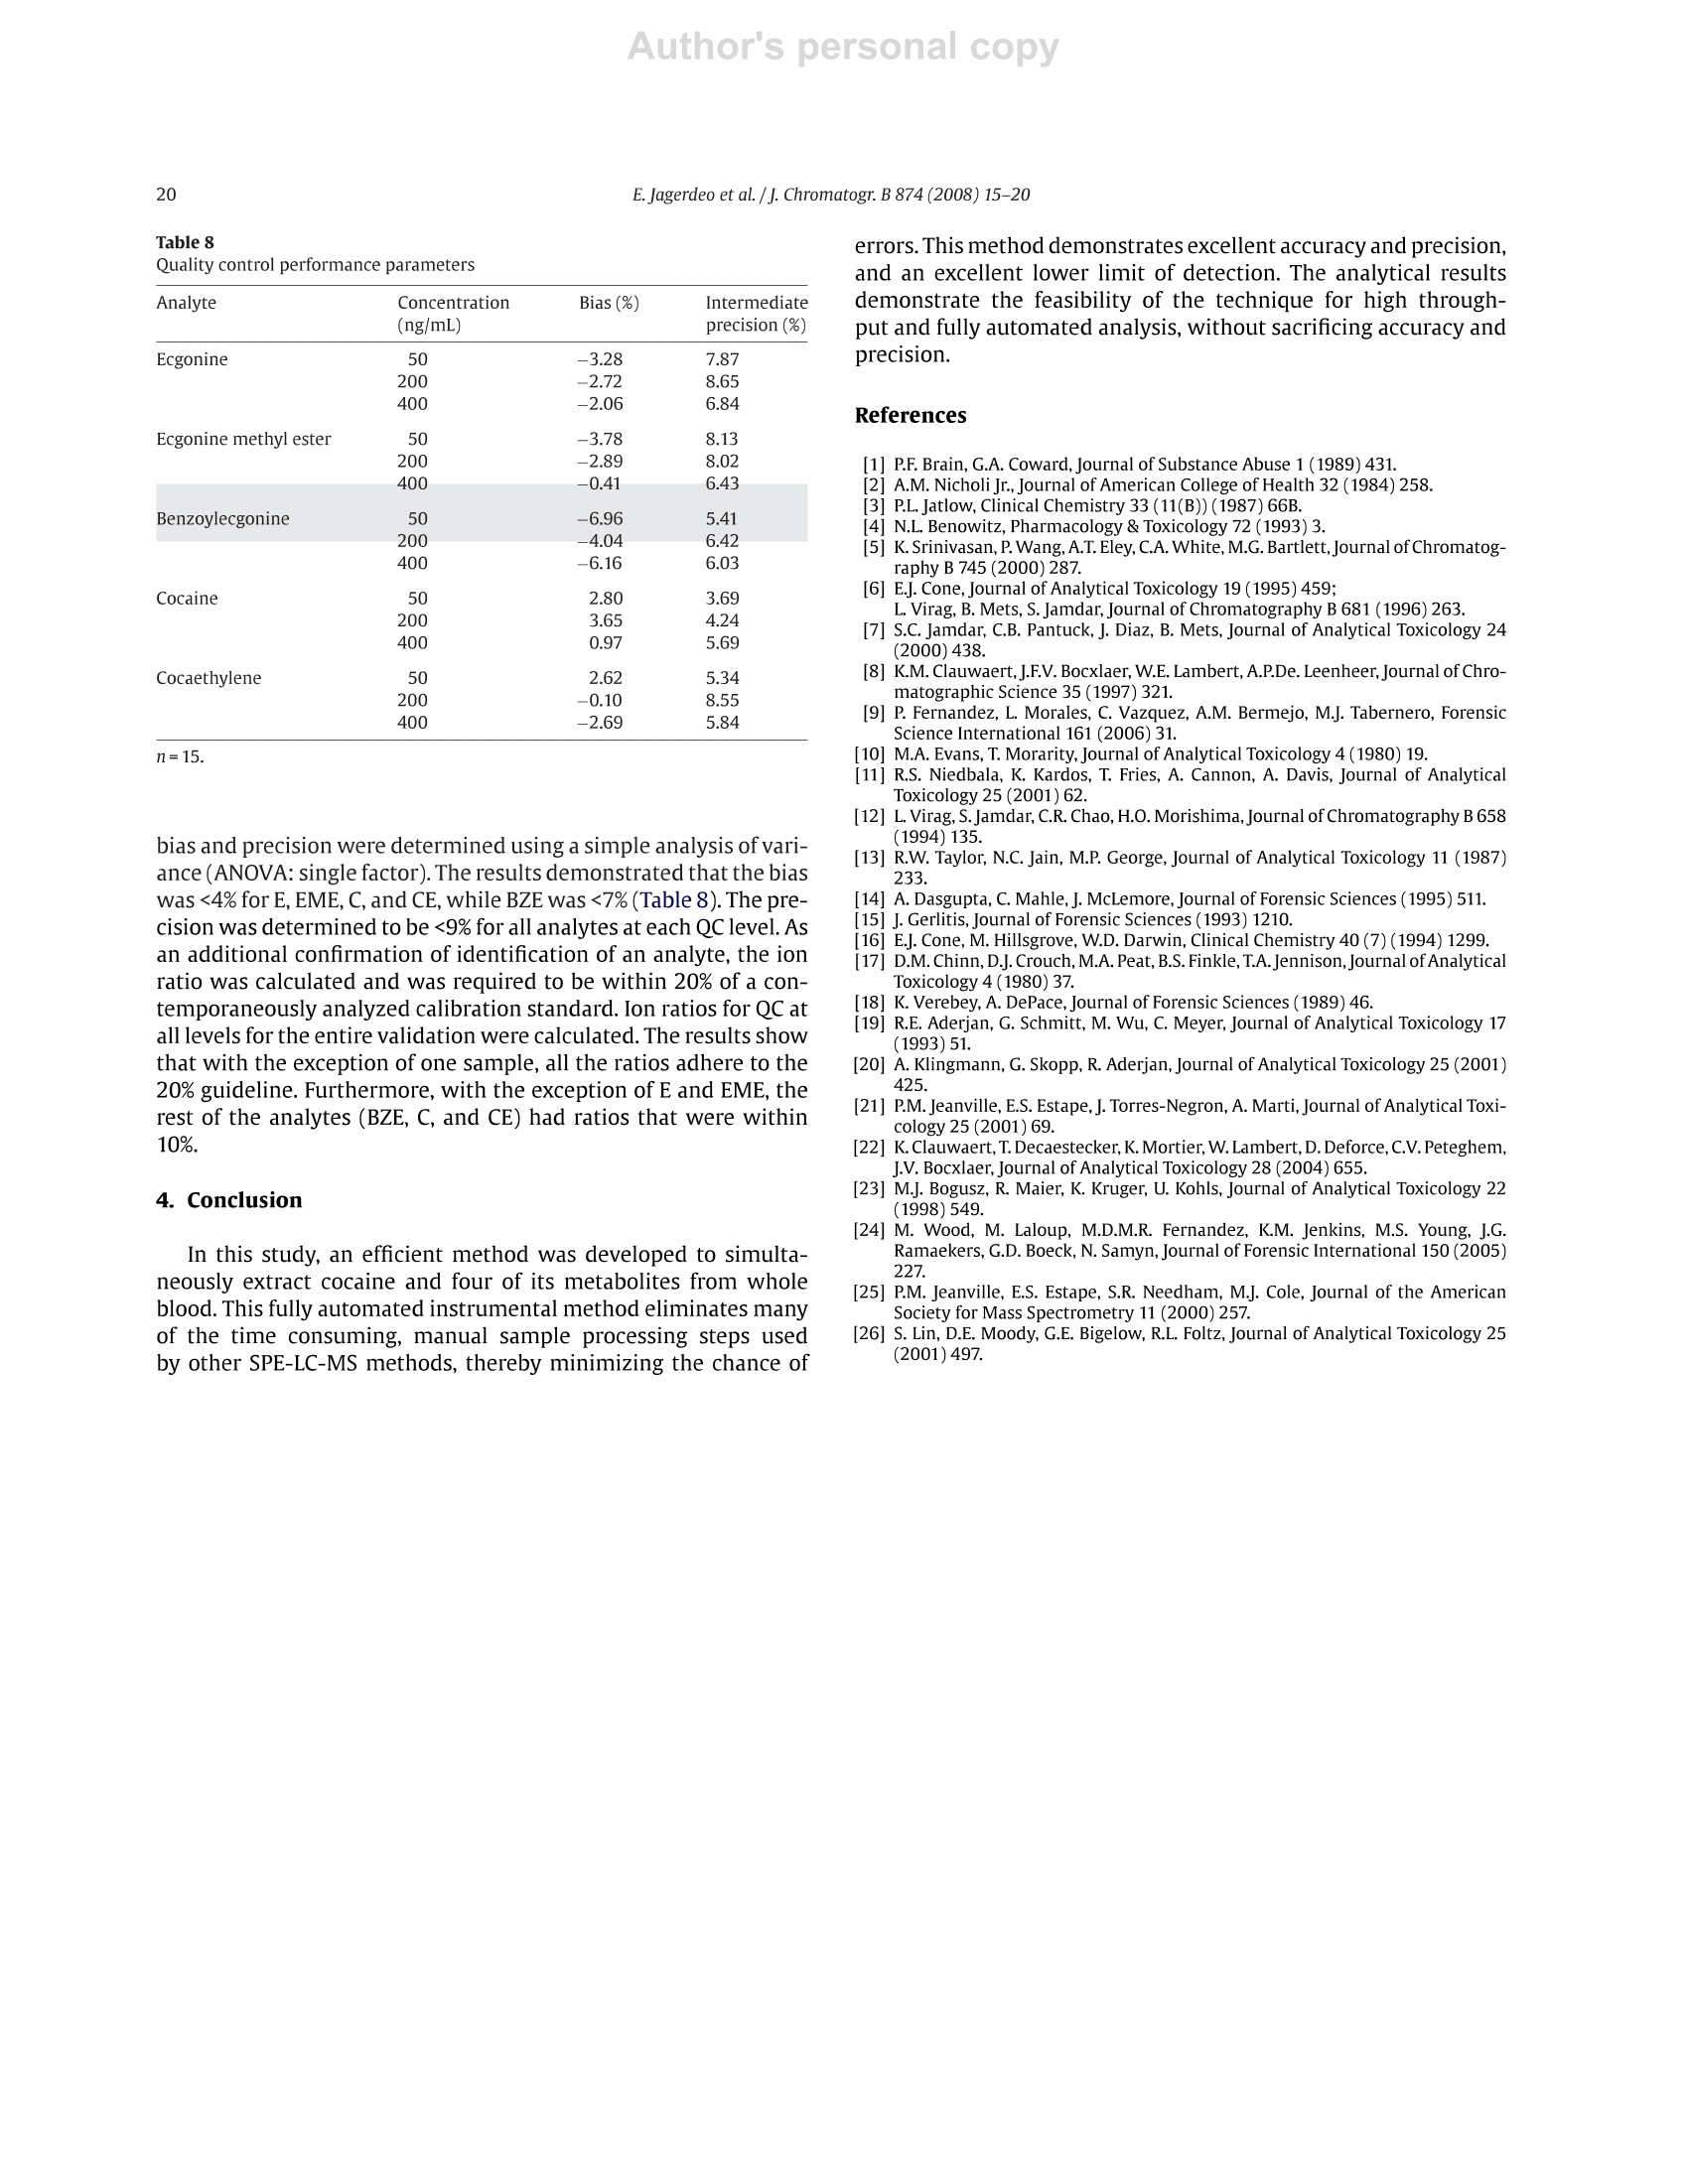
Author's personal copyJournal of Chromatography B, 874 (2008) 15-20 16E. Jagerdeo et al. /j. Chromatogr. B 874 (2008)15-20 Contents lists available at ScienceDirect Journal of Chromatography B journal homepage: www.elsevier.com/locate/chromb An automated SPE/LC/MS/MS method for the analysis of cocaine andmetabolites in whole blood* Eshwar Jagerdeoa*, Madeline A. Montgomery, Marc A. LeBeaud,Martin Sibum Federal Bureau of Investigation Laboratory, 2501 Investigation Parkway, Quantico, VA 22135, United StatesSpark Holland Inc., 7800 AJ Emmen, The Netherlands Article history:Received 19 April 2008Received in revised form 11 July 2008Accepted 24 August 2008Available online 7 September 2008 Keywords: SPELC/MSCocaineCocaine metabolitesWhole blood 1. Introduction Worldwide, cocaine is one of the most widely abused recre-ational drugs and thus, is commonly encountered in many forensicandclinical toxicology cases. A good knowledge of the metabolismof cocaine is critical to understanding its pharmacology and indesigning appropriate analytical protocols [1-3]. In this study, wehave developed and validated an analytical method to quantita-tively measure cocaine and four metabolites (benzoylecgonine,ecgonine methyl ester,ecgonine and cocaethylene) in whole blood.Benzoylecgonine (BZE) is one of the major metabolites formedby either spontaneous hydrolysis or by hepatic carboxyesteraseenzymes. The other major metabolite is ecgonine methyl ester(EME), which is formed by hepatic cholinesterase [4-6]. Both ofthese metabolites have long half-lives in biological matrices and aretherefore important to test for in biological matrices when cocaine ( * T h is is publication 08-08 of the Laboratory Division of the Federal Bureau ofInvestigation. Names o f commercial manufacturers are prov i ded for i d entification purposes only, and inclusion does n o t i m ply endorsement by the FBI. ) ( * C orresponding author. ) ( E -mail address: Es hwar.Jagerdeo@ic.fbi.gov(E . Jagerdeo). ) ( 1570-0232/$ - see front matter. Published by Elsevier B.V . ) exposure is suspected. Both BZE and EME are further hydrolyzedto ecgonine (E). When cocaine is co-administered with alcohol,cocaethylene (CE) is formed in the body. Cocaine is rapidly metab-olized in vivo and in vitro, therefore making it critical to test for itsmetabolites in biological fluids. The large polarity difference between cocaine and its highlypolar metabolites presents challenges in the simultaneous extrac-tion and chromatographic separation of cocaine and metabolitesfrom complex biological matrices. In the past, published litera-ture has shown that analyses were performed using fast screeningby immunoassay followed with confirmation by liquid chro-matography with ultraviolet detection (LC/UV) [6-10]. The LC/UVmethodology does not provide the necessary specificity, and as aresult was replaced with gas chromatography/mass spectrometry(GC/MS) combined with derivatization [11-19].GC/MS has longbeen the analytical technique of choice for analysis of complexmatrices due to its selectivity and sensitivity and is often the refer-ence method for analysis of drugs in biological matrices. However,over the past decade, the use of liquid chromatography/mass spec-trometry (LC/MS) has significantly increased for routine analysisbecause of sensitivity and affordability [20-26]. Throughout the fields of clinical and forensic toxicology, labo-ratories are facing increasing workloads and demands to provide higher quality results at a faster pace. One obvious solution tothis demand is to introduce more automation into toxicologicalanalyses. Often when one contemplates automation, the use ofrobotics may be considered. The introduction of robotics into toxicological analyses is notnew, but their use has generally been limited to autosamplers, with-out widespread use in sample preparation and extraction. Becauseof the repetitive actions in performing SPE, it lends itself to fairlyeasy automation. There have been several systems made commer-cially where the sample preparation is done offline. But the bestconcept for full automation occurs when SPE can be directly linkedto the GC/MS or an LC/MS.Here we present a novel, fast, sensitive,and highly specific automated method for the analysis of cocaineand its major metabolites in whole blood. 2. Experimental 2.1. Materials Certified standards ofE, EME,BZE,Cand CE were each purchasedas 1000 pg/mL solutions from Cerilliant Corporation (Round Rock,TX). Likewise, internal standards, d3-ecgonine (d3-E), d3-ecgoninemethyl ester (d3-EME), d3-cocaine (d3-C), and d3-cocaethylene(d3-CE) were purchased at concentrations of 100 ug/mL from Ceril-liant Corporation (Round Rock,TX).Ad5-benzoylecgonine(d5-BZE)internal standard was purchased from Cambridge Isotope Labora-tories Inc. (Andover, MA) and was prepared at a concentration of120 ug/mL. Ten different SPE sorbents: CN (cyanopropyl phase),C2 (silica based ethyl phase), C8 (silica based octyl phase), C8-EC(end-capped silica based octyl phase), C18-EC (end-capped silicabased octadecyl phase), C18 High Density (end-capped silica basedwith a high number of octadecyl chains), General Phase (GP) resin(polydivinyl-benzene phase), Strong Hydrophobic (SH) (modifiedpolystyrene divinylbenzene phase), Cation Exchange (HysphereMM Cation) and Anion Exchange (Hysphere MM Anion) were pur-chased from Spark Holland, Inc. (Emmen, The Netherlands). Blank whole blood purchased from Clinical Controls Interna-tional (Los Osos, CA) was certified to be negative for commondrugs-of-abuse andprescription medications using existingin-house immunoassay and chromatographic procedures. Zincsulphate heptahydrate was purchased from EMD Chemical Inc.(Gibbstown, NJ) and was prepared as a 0.2 M solution. Using the0.2 M zinc sulphate heptahydrate solution, a protein precipitationsolution was prepared with methanol at a ratio of 20:80. Sodiumphosphate monobasic monohydrate and sodium phosphate dibasicheptahydrate were purchased from Fisher Scientific and were usedto prepare a 0.1 M buffer solution (pH6.0). Ultrafree-CL centrifugalfilter devices were purchased from Millipore Corporation (Bedford,MA). Acetonitrile, methanol, and isopropanol were purchasedfrom Fisher Scientific (Pittsburgh, PA). Formic acid was purchasedfrom Aldrich (Milwaukee, WI). De-ionized water (>18 MQ grade)was obtained from an in-house Millipore purification system. Highperformance liquid chromatography columns used in the studywere purchased from Phenomenex Inc. (Torrance,CA) and WatersCorporation (Franklin, MA). From the group of columns investi-gated, the Gemini C6-Phenyl and the Xterra C18(50mmx3.00 mmi.d., 5 um) provided optimal separation of all the components. TheGemini C6-Phenyl was selected for method validation and used inthis procedure. 2.2. Procedure Twelve-point calibration curves (4, 10,20,30,50,100,200,240,300, 340, 400 and 500 ng/mL) were prepared in whole blood from a1 pg/mLcombined (E,EME, BZE, C, CE)intermediate whole bloodstock standard. An independent solution of 1 pg/mL in whole bloodwas prepared daily from a QC stock solution of 1000 ug/mL for E,EME, BZE, C, and CE. The 1 pug/mL-QC solution and QC standardsat 50, 200 and 400ng/mL were prepared daily in triplicate. 10 uLof a 10 pg/mL combined internal standard solution (d3-E, d3-EME,d3-C,d3-CE) and 10 pL of a12 pg/mL d5-BZE solution were addedto all samples. Blank blood samples were also analyzed with nointernal standard added. Pretreatment of the samples to precipi-tate plasma proteins was carried out by adding 1 mL of zinc sulphateheptahydrate/methanol solution to half of a milliliter of each bloodsample. The samples were then vortexed well and centrifuged for15 minutes at 4000rpm. Half of a milliliter of the supernatant wasremoved and transferred to a labeled centrifuge tube with a filter.Halfof a milliliter of phosphate buffer was added and the tubes werecentrifuged at approximately 3000rpm for 5 min. Upon comple-tion, filtered samples were transferred to autosampler vials. A par-tial loop injection of 30 uL of the filtered, diluted sample was made. 2.3. Instrumentation This automated method is unique in that it interfaces the SparkHolland SymbiosisTM (Emmen, The Netherlands) to the AppliedBioSystems 4000Qtrap (Ontario, Canada)so that these two instru-ments function as a single unified system (Fig. 1). The Symbiosisis comprised of a refrigerated storage compartment (maintainedat 12°C), an autosampler, a solid phase extraction unit (automatedcartridge exchanger (ACE)),a solvent delivery unit consisting oftwohigh-pressure dispensing pumps(HPD), and two high performanceliquid chromatography (HPLC) pumps. The ACE module containstwo connectable 6-way valves and an SPE cartridge exchange mod-ule. The HPD provide SPE cartridges with solvents for conditioning,equilibration, sample application, and cleanup. The integratedHPLCpump is a binary high-pressure gradient pump. The HysphereMM Anion exchange (10mmx2mm)SPEcartridge was used for thesample extraction, while a Gemini C6-Phenyl column was used forchromatographic separation. The columntemperature was at ambi-ent room temperature. Detection was performed using an AppliedBioSystems 4000Qtrap equipped with a turbo spray ion sourceoperated in positive electrosprayionization mode. All aspects of thesystem operation and data acquisition are controlled using Analystsoftware by Applied BioSystems. 2.4. Online SPE The Symbiosis system is designed to proceed automaticallythrough a series of programmable routines during which the SPEcartridge is loaded, washed, and eluted. The analytes are eluteddirectly onto the analytical column, followed by a separation pro-cedure and detection by the mass spectrometer (Fig.1). This entireprocedure is automated and done in series. For the method herein, the SPE cartridge was first loaded inthe left clamp of the ACE for conditioning and equilibration with1 mL of 100% acetonitrile and water with 3% ammonia respectively(Tables 1 and 2). 30 uL of the pretreated blood was loaded ontothe cartridge using water with 3% ammonia as the loading solvent.The cartridge was then washed with 1 mL of water containing 3%ammonia. The cartridge was automatically transferred to the rightclamp for elution of the analytes directly onto the analytical col-umn by passing 200 pL of elution solvent (40% acetonitrile/55%water/4% isopropanol/1.1%formic acid) in the peak focusing modeover the cartridge for 3 min. During elution of the cartridge on theright clamp, the sample loop, the left clamp, and the injector wereflushed with a series of solvents (Table3). Immediately followingthe flushing of the left clamp, the next sample was extracted with Fig. 1. Automated solid phase extraction unit coupled to a triple quadrupole mass spectrometer with (A) autosampler with a sample storage compartment, (B and C) highpressure dispensing pumps, (D) automated cartridge exchanger and (E) triple stage quadrupole mass spectrometer. Table 1 Autosampler parameters and valve wash sequence between sample injection Action Solvent Volume (mL) Rate (mL/min) Condition 100% Acetonitrile 1 5 Equilibrate Water with 3% 1 5 ammonia Sample application 30 pL Rinse sample Water with 3% ammonia Water with 3% 0.5 0.5 Rinse cartridge 1 5 Elute ammonia Elution solventa.b 0.3 0.1 Clamp flush# 1 100%Methanol with 3% 0.5 5 Clamp flush #2 ammonia 100%Acetonitrile 0.5 5 Clamp flush #3 100%Water 0.5 5 Clamp flush#4 Elution solvent 0.075 5 Cartridge sorbent type: Hysphere MM anion. Elution solvent: 40% Acetonitrile/55% Water/4% isopropanol/1.1% formic acid. Peak focusing with High Pressure Dispenser (HPD). Table 2 High Pressure Dispenser parameters (HPD-1 and HPD-2) HPD-1 Port SSM 1A 100%Acetonitrile HPD-1 Port SSM 1F Water with 3% ammonia HPD1 Port 3 40% Acetonitrile/60% water/0.1% formic acid HPD2 Port 1 100%Acetonitrile HPD2 Port 2 40% Acetonitrile/55% water/4% isopropanol/1.1% formic acid HPD2 Port 3 Methanol with 3% ammonia HPD2 Port 4 Deionized water Table 3Parameters for automated cartridge exchanger (ACE) Action Solvent Volume(mL) Rinse Port 1-Rinse 1 0.7 Rinse Port 2-Rinse 2 0.7 Rinse Port 1-Rinse 1 0.5 Rinse Port 2-Rinse 2 0.5 Rinse Port 1-Rinse 1 0.5 Rinse Port 2-Rinse 2 0.5 Rinse Port 1-Rinse 1 1.4 a Rinse 1: 40% Acetonitrile/60% water/0.1% formic acid.Rinse 2: 40% Acetonitrile/40% methanol/15% water/5% isopropanol/0.1% formicacid. Table 4Chromatographic parameters Time Total flow %A (0.1% formic %B (0.1% formic acid (min) (mL/min) acid in water) in acetonitrile) 0.01 0.9 100 0 3.01 0.9 100 0 3.05 1.0 98 2 7.35 1.0 10 90 8.00 1.0 10 90 9.15 1.0 100 0 10.00 1.0 100 0 a new cartridge and placed into standby mode for elution. As aresult, there was no lag time in the sample sequence.Additionally,the right clamp was flushed following elution of each sample withmethanol containing 3% ammonia, 100% acetonitrile, 100% waterand elution solvent (Fig. 1). 2.5. Liquid chromatography A binary gradient system used 0.1% formic acid in water (solventA) and 0.1% formic acid in acetonitrile (solvent B). The gradient wasperformed according to the elution program listed in Table 4. TheHPLC column was maintained at room temperature. 2.6. Mass spectrometry In this method, the positive ionization mode was used with theparameters listed in Table 5. E, EME, BZE, C, and CE were proto-nated to produce the following molecular ions: 186, 200, 290, 304and 318 m/z, respectively. Likewise, the internal standards (d3-E,d3-EME, d5-BZE, d3-C, d3-CE) produced ions 189,203,295,307 and321 m/z, respectively. Upon collision dissociation of E, EME, BZE, C,CE, d3-E, d3-EME, d5-BZE, d3-Cand d3-CE, these precursor ions pro-duced characteristic product ions of 168, 182,168,182,196,171,185,168, 185, and 199 m/z, respectively. Multiple reaction moni-toring (MRM) was used with two transitions for each analyte andone transition for each internal standard (Fig. 2). A dwell time of25 ms and an interchannel delay of 10 ms were used. Mass transi-tions m/z 186→82(E),200→82(EME), 290→ 105(BZE), 304→82(C), and 318→82 (CE) were used as qualifiers. To ensure no signif-icant hydrolysis of cocaine during the extraction procedure and insolution, production of d3-BZE was monitored with transition m/z293→171.3 (Table 5). The formation of d3-BZE is the breakdownproduct from d3-C. To prevent any interference from the break-down product in monitoring BZE, d5-BZE was used as the internalstandard. E. Jagerdeo et al./J. Chromatogr. B 874(2008)15-20 Table 5Mass spectrometer parameters SCAN Mode Turbo Spray Polarity Positive Resolution Unit Scan Type MRM Curtain Gas Nitrogen lonspray Voltage 2100 Source Temperature 700°C Nebulizer Gas Nitrogen Collision Gas Nitrogen (Medium) Turbo Gas Nitrogen Analyte Q1 mass Q3 mass Time (ms) DP(V) EP (V) CE(V)d CXP (V) Ecgonine (MRM1) 186.15 168.10 25 10 41 25 30 Ecgonine(MRM2) 186.15 82.10 25 10 41 47 12 Ecgonine-d3 189.17 171.02 25 10 61 25 12 Ecgonine methyl ester (MRM1) 200.18 182.10 25 44 Ecgonine methyl ester (MRM2) 200.18 82.00 4 Ecgonine methyl ester-ds 203.20 185.10 Benzoylecgonine (MRM1) 290.14 168.10 Benzoylecgonine(MRM2) 290.14 105.10 Benzoylecgonine-ds 295.16 168.20 4 Cocaine (MRM1) 304.17 182.10 Cocaine (MRM2) 304.17 82.10 Cocaine-d3 307.18 185.40 Cocaethylene (MRM1) 318.20 196.10 Cocaethylene (MRM2) 318.20 82.10 4 Cocaethylene-d3 321.23 199.10 30 Benzoylecgonine-d3 293.16 171.30 8 Multiple reaction monitoring. "Declustering potential. Entrance potential. In developing this method, ten different solid phase extractionmaterials were evaluated for the retention of all analytes and theirrespective internal standards. The C8-EC, C18-EC and C18-HD car-tridge extracted C, CE, BZE and EME, but did not retain E. The C2,C8 and Cation Exchange SPE material extracted C and CE, but hadpoor retention of BZE and EME. The CN cartridge was successful inextraction of C, CE and BZE, but weak retention of EME and E. The SHand GP cartridges extracted C, CE, BZE but showed poor resolutionfor EME and had no retention for E. However, the Hysphere MManion SPE material extracted all the analytes. Since this procedurerequires online elution of the sample from the SPE material ontothe analytical column, consideration must be taken for the SPE elu-tion time, SPE flow rate, elution solvent concentration,LC flow rateand mobile phase. A successful method involves elution of all theanalytes at the head of the analytical column without any bandbroadening. In developing this method several elution solvents,combinations of solvents, and SPE flow rates were evaluated. Themost successful elution solvent combination was 300 uL of elutionsolvent at a flow rate of 0.1 mL/min(Table 4). To achieve the shortestruntime with the best separation, eleven analytical columns(Nova-Pak C18, Phenomenex C8 and C18, Phenomenex Synergi Polar-RP(C18), Symmetry C8 and C18, Waters Xterra C8 and C18, WatersXbridge C8 and C18, and Phenomenex Gemini C6-phenyl were eval-uated. The Gemini C6-Phenyl and the Xterra C18 provided optimalseparation of all the analytes from the lot of eleven columns.How-ever, the Gemini C6-phenyl provided slightly better peak shape forecgonine and as a result was used for the study. A complete validation was performed following an internalprocedure. Interferences were addressed by running blank bloodand blood samples spiked withknown drugs. Blood samples fromten different sources were analyzed and no endogenous interfer-ences were observed. Also, blood samples spiked with nitrazepam,nordiazepam, alprazolam, flunitrazepam, lorazepam, oxazepam,tempazepam,ddiazepam,propoxyphene, norpropoxyphene,methadone, codeine, phencyclidine, methylenedioxyampheta- mine,methylenedioxymethamphetamine,methylenedioxy-N-eth-ylamphetamine,methamphetamine, amphetamine, butal-bital, amobarbital, phenobarbital, pentobarbital, secobarbital,carisoprodol, lysergic acid diethylamide, oxycodone, zolpidem,7-aminoflunitrazepam,ketamine and imipramine ranging from 1to 250ng/mL were analyzed without any significant interferences.Ion suppression was investigated using a post-column tee setup.No significant suppression or enhancement of the signal wasobserved. Analytes were infused post-column into the LC flow andeach extracted blank blood sample injected. A hydrolysis study of cocaine was studied to determinethe percentage of conversion of cocaine to benzoylecgo-nine over three days by monitoring the ratio of transitions(293.16→168.20)/(295.16→168.20), while the samples are storedrefrigerated at 12°C. The percent conversion was <1% over the threedays of study. Storing the blood extract in phosphate buffer at 12℃aids in slowing down this conversion. As a result of the low con-version rate, it is possible to re-extract the sample when necessarywithout any significant change in the results. This study also indi-cates that cocaine is not converted to benzoylecgonine during theextraction procedure at an appreciable level, even though stronglyalkaline solvents are utilized. The Symbiosis is comprised of numerous Valco valves, clampsand tubing that provides the potential of analyte carryover. As aresult, an extensive study was performed with different solventsand wash cycles to remove any carryover. The optimal conditionsto prevent carryover for the working range of the method are listedin Tables 1 and 3. The method was validated over a range from 4 to 500 ng/mL withan average correlation coefficient >0.99 for all analytes. The stan-dard curves were plots of the ratios of analytes/internal standardresponses (peak area) as a function of the analyte concentration.The data were fit to a linear least-squares regression curve with aweighting index of 1/x. Average line equations were determined forall analytes using the equation Y=average slope (±3S.D.)+averageintercept (±3S.D.) (Table 6). Although the method was vali-dated in the range 4-500ng/mL, the linear dynamic ranges for Fig.2. MRM transitions at of 4ng/mL in blood for ecgonine, ecgonine methyl ester, benzoylecgonine, cocaine and cocaethylene (A, C, E, G, I) respectively, and MRM transitionof 375 ng/mL of d3-ecgonine,d3-ecgonine methyl ester, ds-benzoylecgonine, d3-cocaine, and ds-cocaethylene (B, D, F, H,J)(Internal standards). Table 6 Standard curve stability evaluation for cocaine and its metabolites Analyte Average Average Average correlation slope intercept Ecgonine >0.998 0.00126±0.0003 0.0332±0.0180 Ecgonine methyl ester >0.997 0.00079±0.00001 0.0118±0.0087 Benzoylecgonine >0.998 0.00216±0.00039 0.0017±0.0129 Cocaine >0.998 0.00229±0.00033 0.0021±0.0157 Cocaethylene >0.998 0.00162±0.0003 0.00347±0.0072 n=5. Average line equation y=Average slope (±3S.D.)X+average intercept (±3S.D.).Data were fit to a linear least-squares regression curve with a weighing index of 1/x. E, EME, BZE, Cand CE were determined to be 50-500ng/mL,40-500ng/mL,20-500ng/mL, 10-500ng/mL, and 15-500ng/mLrespectively (Table 7). The limits of detection for E, EME, BZE, CandCE were determined to be 16 ng/mL, 12 ng/mL, 7 ng/mL, 3 ng/mLand 5 ng/mL respectively. These LODs were statistically determinedusing the equation 3.3xS.D.y-intercept/average slope for 5 cali-bration curves. Likewise, the limits of quantitation for E, EME, BZE,C, and CE were determined to be 50 ng/mL, 40ng/mL, 20ng/mL10 ng/mL and 15 ng/mL respectively. These LOQs were statisticallydetermined using the equation 10× S.D. y-Intercept/Average Slopefor 5 calibration curves. Quality control (QC) samples were ana-lyzed for each analyte in triplicate at 50, 200 and 400 ng/mL. The Table 7 Critical method performance parameters Analyte Limitations Linearity range (ng/mL) Limit of detection (ng/mL) Limit of quantitation (ng/mL) Ecgonine 47-500 16 47 Ecgonine methyl ester 36-500 12 36 Benzoylecgonine 30-500 7 20 Cocaine 8-500 3 8 Cocaethylene 15-500 5 15 LOD was calculated using: 3.3xS.D.of y-Intercept/ Average Slope. LOQ was calculated using: 10xSD of y-Intercept/ Average Slope. Table8Quality control performance parameters Analyte Concentration Bias (%) Intermediate (ng/mL) precision (%) Ecgonine 50 -3.28 7.87 200 -2.72 8.65 400 -2.06 6.84 Ecgonine methyl ester 50 -3.78 8.13 200 2.89 8.02 400 -0.41 6.43 Benzoylecgonine 50 -6.96 5.41 200 -4.04 6.42 400 -6.16 6.03 Cocaine 50 2.80 3.69 200 3.65 4.24 400 0.97 5.69 Cocaethylene 50 2.62 5.34 200 -0.10 8.55 400 -2.69 5.84 n=15. bias and precision were determined using a simple analysis of vari-ance(ANOVA: single factor). The results demonstrated that the biaswas <4% for E, EME, C, and CE, while BZE was <7%(Table 8). The pre-cision was determined to be <9% for all analytes at each QC level. Asan additional confirmation of identification of an analyte, the ionratio was calculated and was required to be within 20% of a con-temporaneously analyzed calibration standard. Ion ratios for QC atall levels for the entire validation were calculated.The results showthat with the exception of one sample, all the ratios adhere to the20% guideline. Furthermore, with the exception of E and EME, therest of the analytes (BZE, C, and CE) had ratios that were within10%. 4. Conclusion In this study, an efficient method was developed to simulta-neously extract cocaine and four of its metabolites from wholeblood. This fully automated instrumental method eliminates manyof the time consuming, manual sample processingsteps usedby other SPE-LC-MS methods, thereby minimizing the chance of errors. This method demonstrates excellent accuracy and precision,and an excellent lower limit of detection. The analytical resultsdemonstrate the feasibility of the technique for high through-put and fully automated analysis, without sacrificing accuracy andprecision. References ( [ 1] P .F. Brain, G.A . Coward, Journal of Substance Abuse 1 (1989)431. ) ( [2] A.M. Nicholi Jr.,Journal of American College of Health 32 (1984)258. ) ( [3] | P.L . Jatlow , Clinical Chemistry 3 3 ( 11(B)) (1987)66B. ) [4] N.L. Benowitz, Pharmacology & Toxicology 72 (1993)3. ( [5] K . Srinivasan,P. Wang, A.T. Eley,C.A. White, M.G. Bartlett,Journal of C h romatog- r aphy B 745 (2000)287. ) ( [6] E J. Cone, Journal of Analytical Toxicology 1 9(1995)459; ) ( L . Virag, B . Mets, S. Jamdar, Journal of Chromatography B 681 (1996)263. ) ( [7] S.C. Jamdar, C .B. Pantuck, J.Diaz, B. M ets, Journal of Analytical T o xicology 24 (20001438 ) ( [8] K .M. Clauwaert, J.F.V. B ocxlaer, W.E. Lambert,A.P.De. Le e nheer, Journal of C hro- m atographic Science 35 (1997)321. ) ( [9] P . Fernandez, L . M orales, C . V azquez, A . M. Bermejo, M.J. Ta b ernero, For e nsic S cience International 1 61 (2006) 31. ) [10] M.A. Evans, T. Morarity, Journal of Analytical Toxicology 4(1980) 19. ( [11] R .S. Niedbala, K . K ardos, T. F ries, A. Cannon, A. Davis, J o urnal of A n alytical T oxicology 25 (2001)62. ) [12] L. Virag, S. Jamdar, C.R. Chao, H.O. Morishima,Journal of Chromatography B 658(1994)135. [13] R.W. Taylor, N.C. Jain, M.P. George, Journal of Analytical Toxicology 11 (1987)233. ( [ 14] A . Dasgupta, C. M ahle,J. M cLemore, Jo u rnal of Forensic Sciences (1995) 51 1 . ) ( [ 1 5]J. Gerlitis, Journal of Forensi c Sciences (1993)1210. ) ( [16] E .J. Cone, M. Hillsgrove, W.D . Darwin, Clinical Chemistry 40(7) ( 1994)1299. ) [17] D.M. Chinn, D.J. Crouch,M.A. Peat, B.S.Finkle,T.A.Jennison,Journal of AnalyticalToxicology4(1980) 37. [18] K. Verebey,A. DePace,Journal of Forensic Sciences (1989)46. ( [ 1 9] R .E. Aderjan, G. S chmitt, M. Wu, C. Meyer, Jo u rnal of Analytical To x icology 17 ( 1993)51. ) [20] A. Klingmann, G. Skopp, R. Aderjan, Journal of Analytical Toxicology 25 (2001)425. ( [21] P .M. Jeanville, E .S. Estape, J . Torres-Negron, A. Marti, Journal of Analytical Toxi- c ology 25(2001)69. ) [22] K. Clauwaert, T.Decaestecker, K. Mortier, W.Lambert,D.Deforce,C.V.Peteghem,J.V. Bocxlaer, Journal of Analytical Toxicology 28 (2004) 655. [23] M.J. Bogusz, R. Maier, K. Kruger, U. Kohls, Journal of Analytical Toxicology 22(1998)549. [24] M. Wood, M. Laloup, M.D.M.R. Fernandez, K.M. Jenkins, M.S. Young, J.G.Ramaekers, G.D. Boeck, N. Samyn, Journal of Forensic International 150 (2005)227. [25] P.M. Jeanville, E.S. Estape, S.R. Needham, M.J. Cole, Journal of the AmericanSociety for Mass Spectrometry 11 (2000) 257. ( [26] S . L i n, D.E. Moody, G.E. B igelow, R.L. Foltz, Journal of Analytical Toxicology 25 (2001)497. )
确定
还剩4页未读,是否继续阅读?

产品配置单
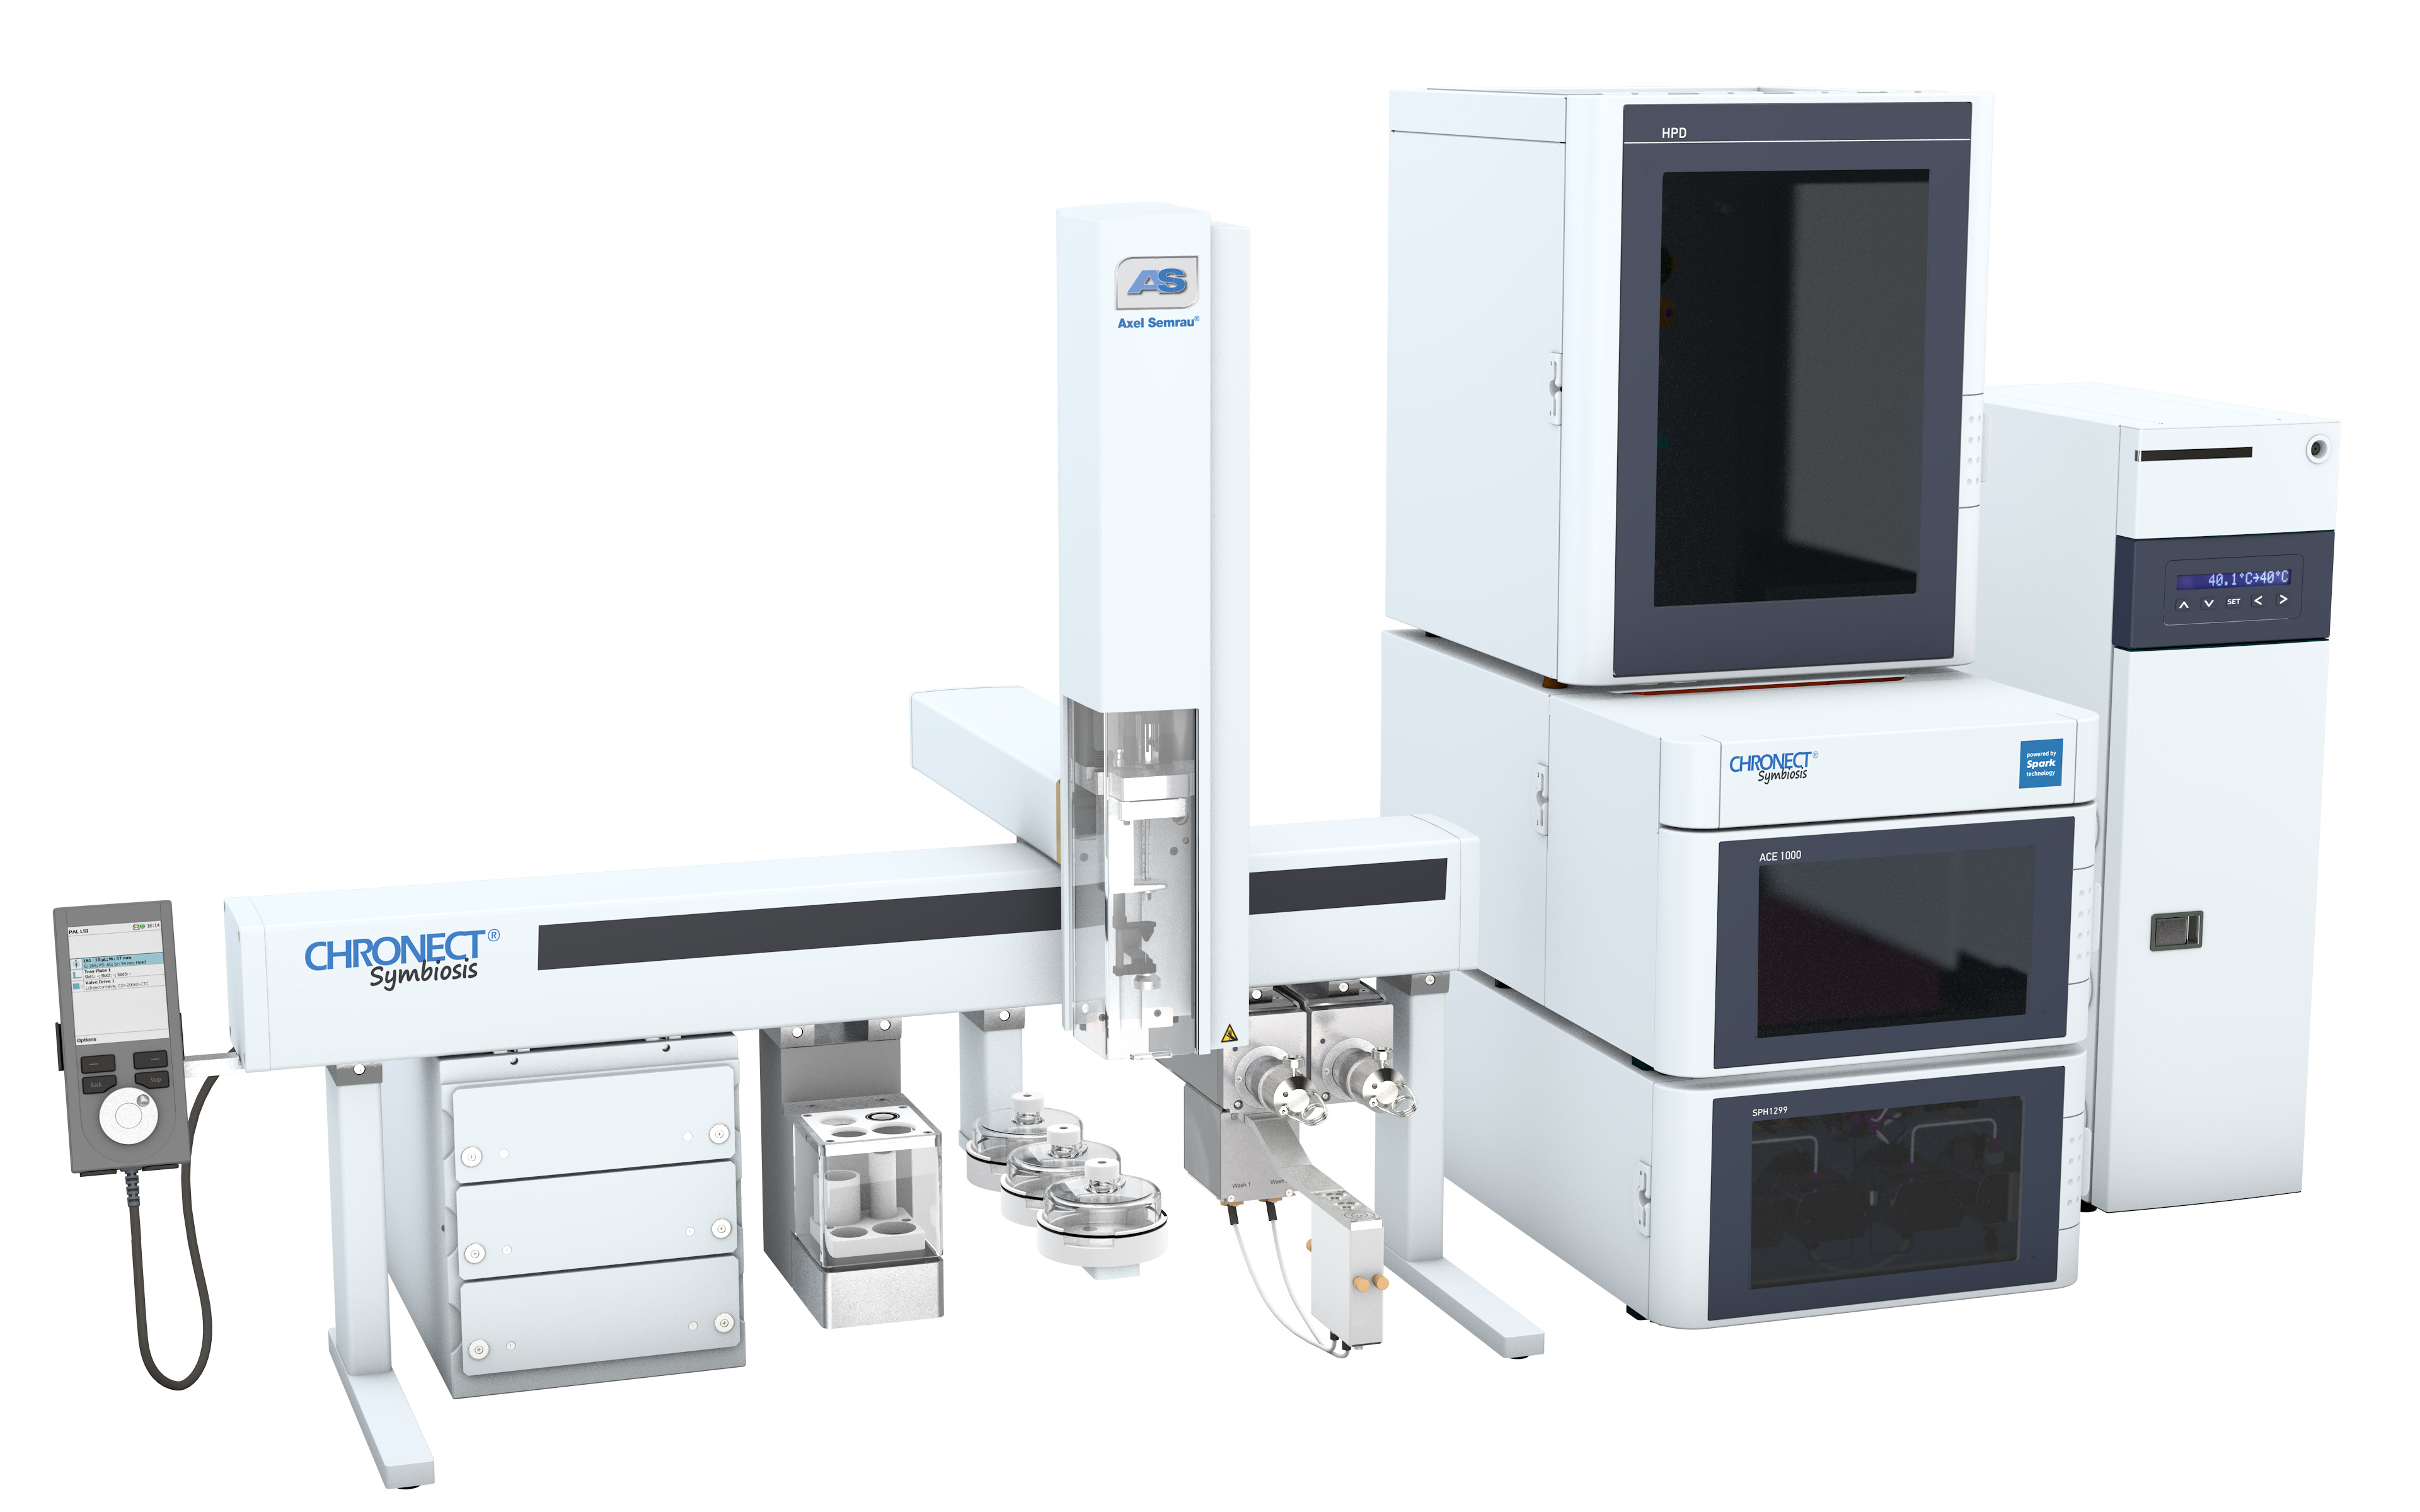
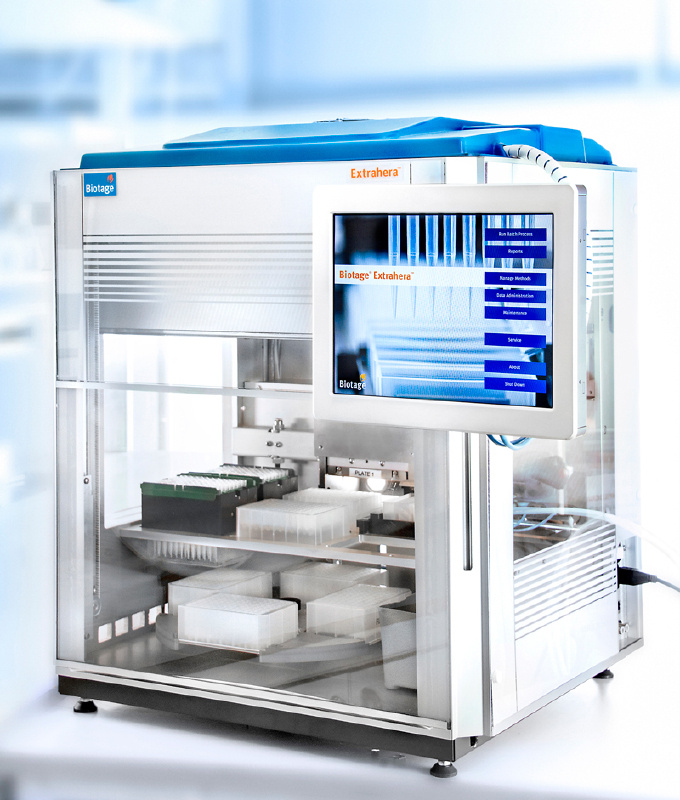
仪真分析仪器有限公司为您提供《血液中可卡因及代谢物检测方案(固相萃取仪)》,该方案主要用于全血/血清/血浆中可卡因及代谢物检测,参考标准--,《血液中可卡因及代谢物检测方案(固相萃取仪)》用到的仪器有超高压液相在线SPE色谱联用系统CHRONECT Symbiosis
推荐专场

相关方案
更多
该厂商其他方案
更多