


通过微波诱导合成,从四羧酸二酐的热解获得的常规软碳化合物中开发出微孔软碳纳米片。边缘处的微孔和缺陷协同产生增强的动力学和额外的钠离子存储位点,这有助于将容量从134 mAh g-1增加到232 mAh g-1,并在1000 mA g-1时具有出色的103 mAh g-1倍率能力钠离子存储。
方案详情

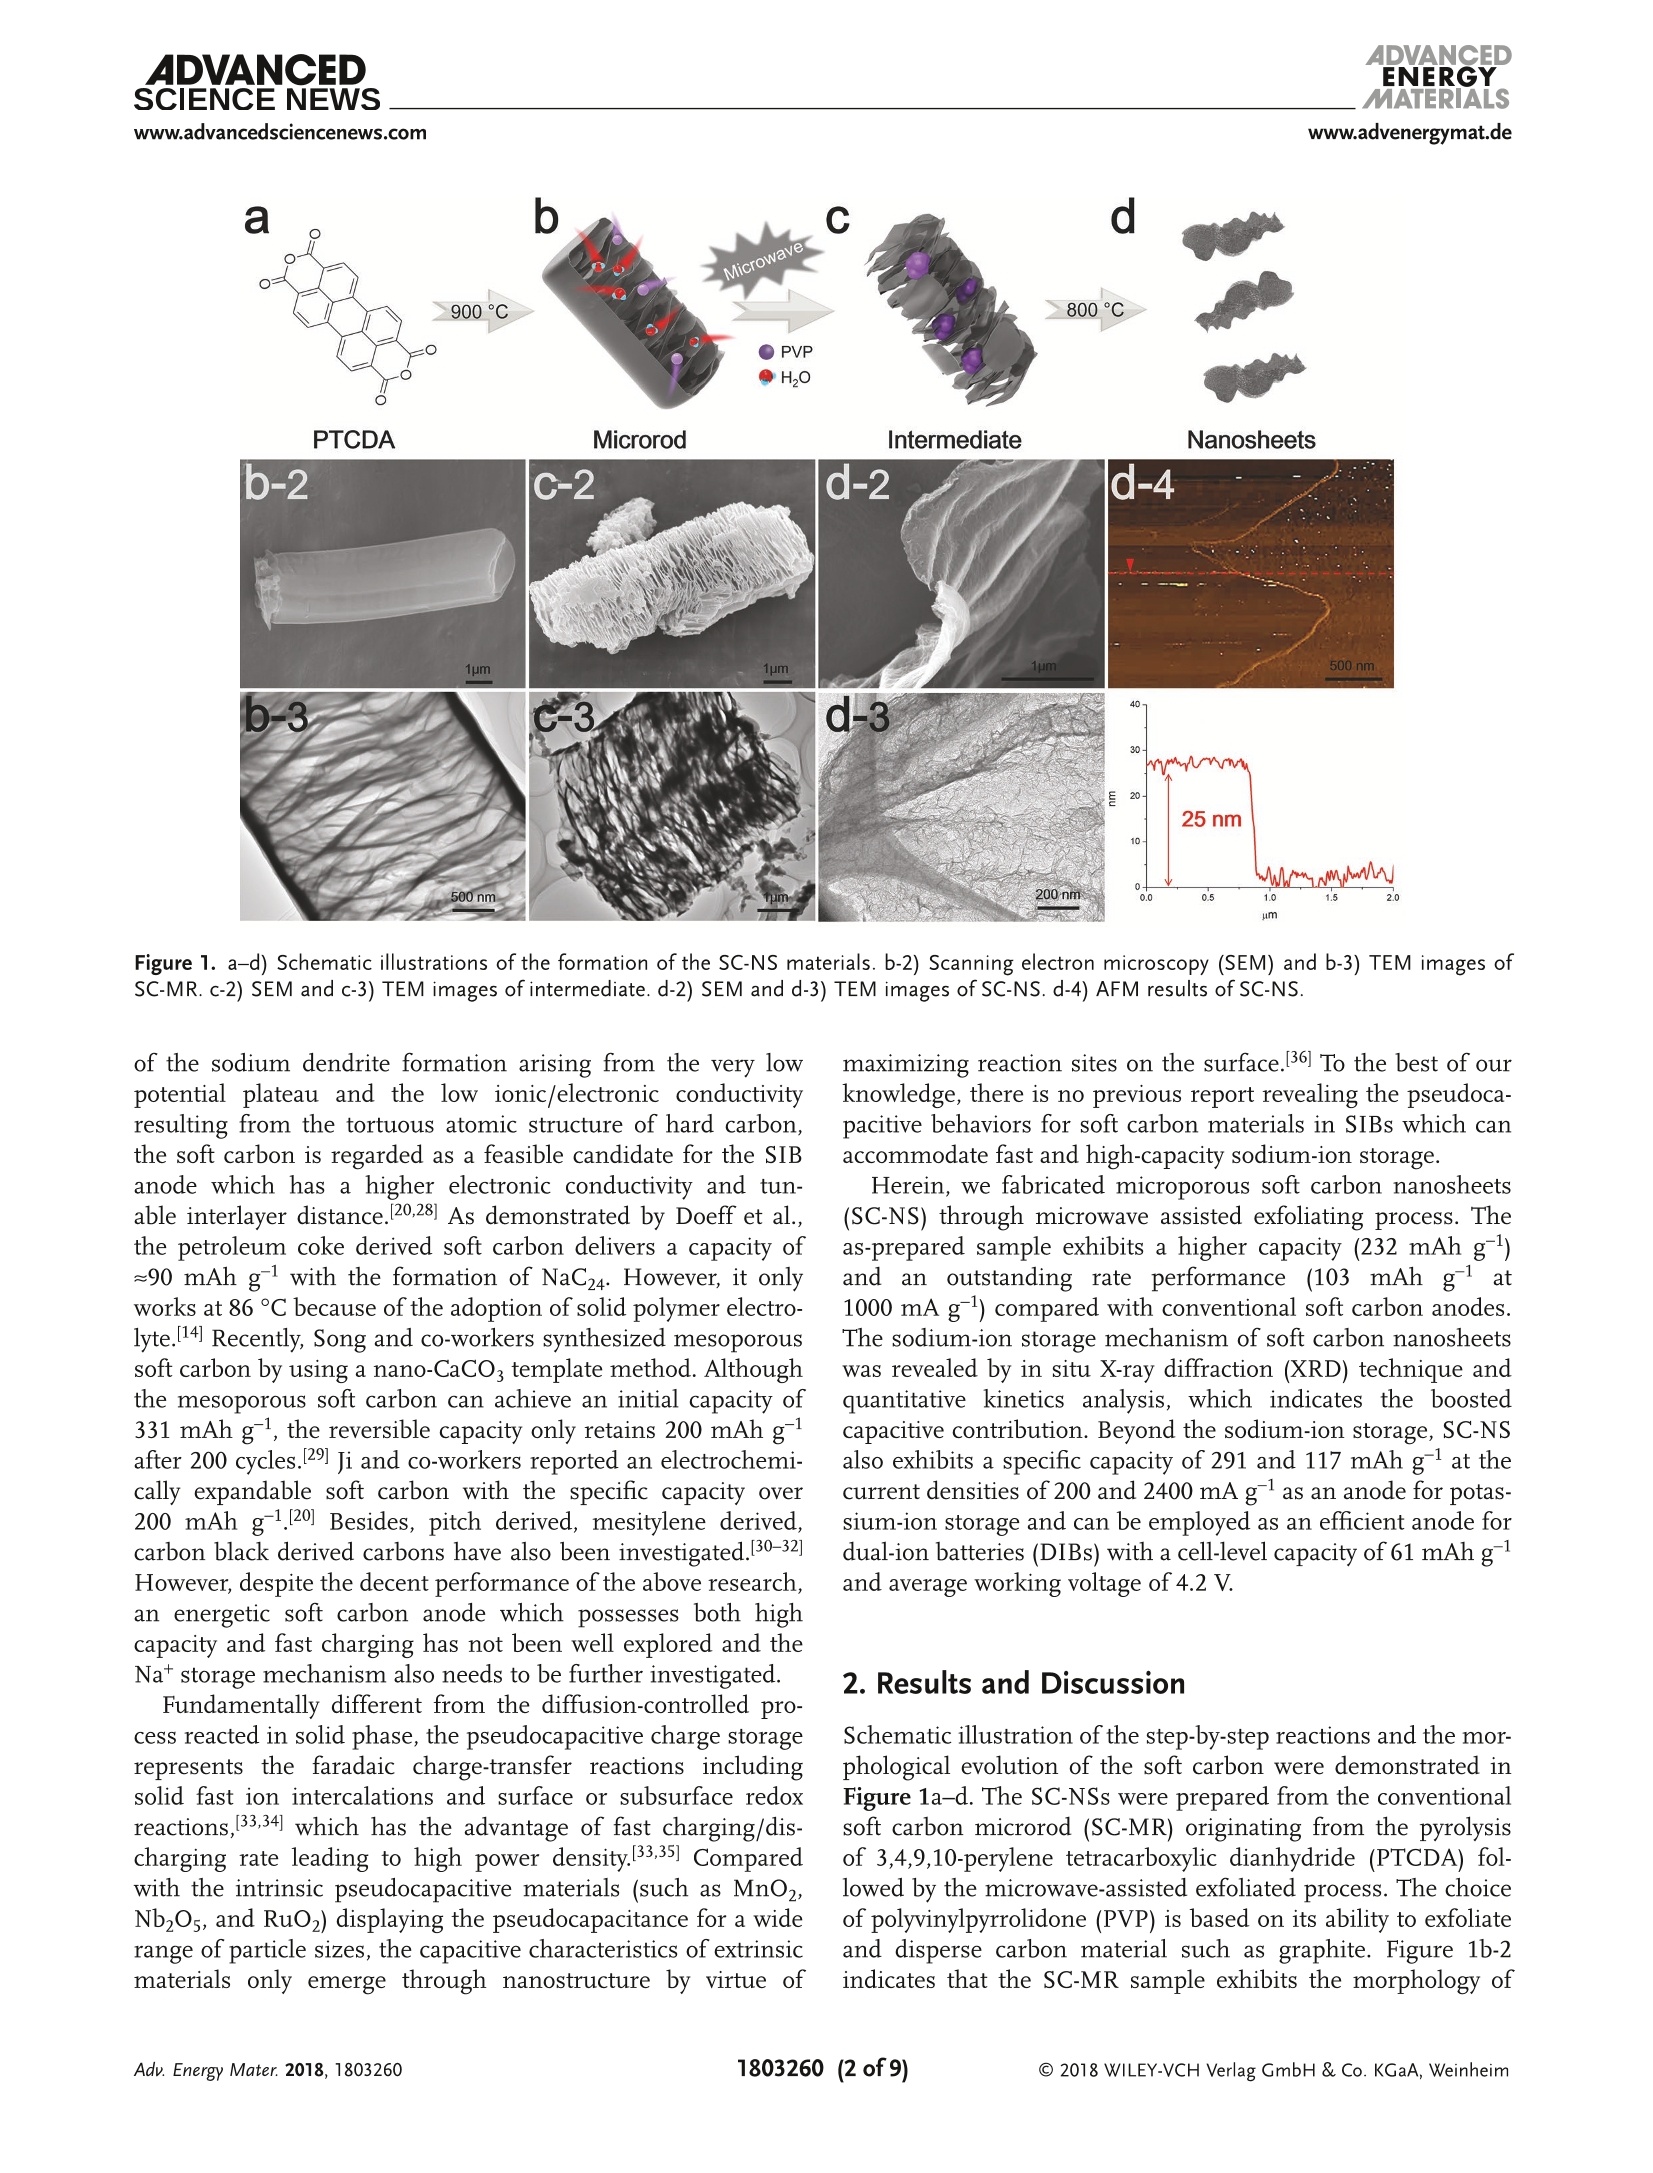
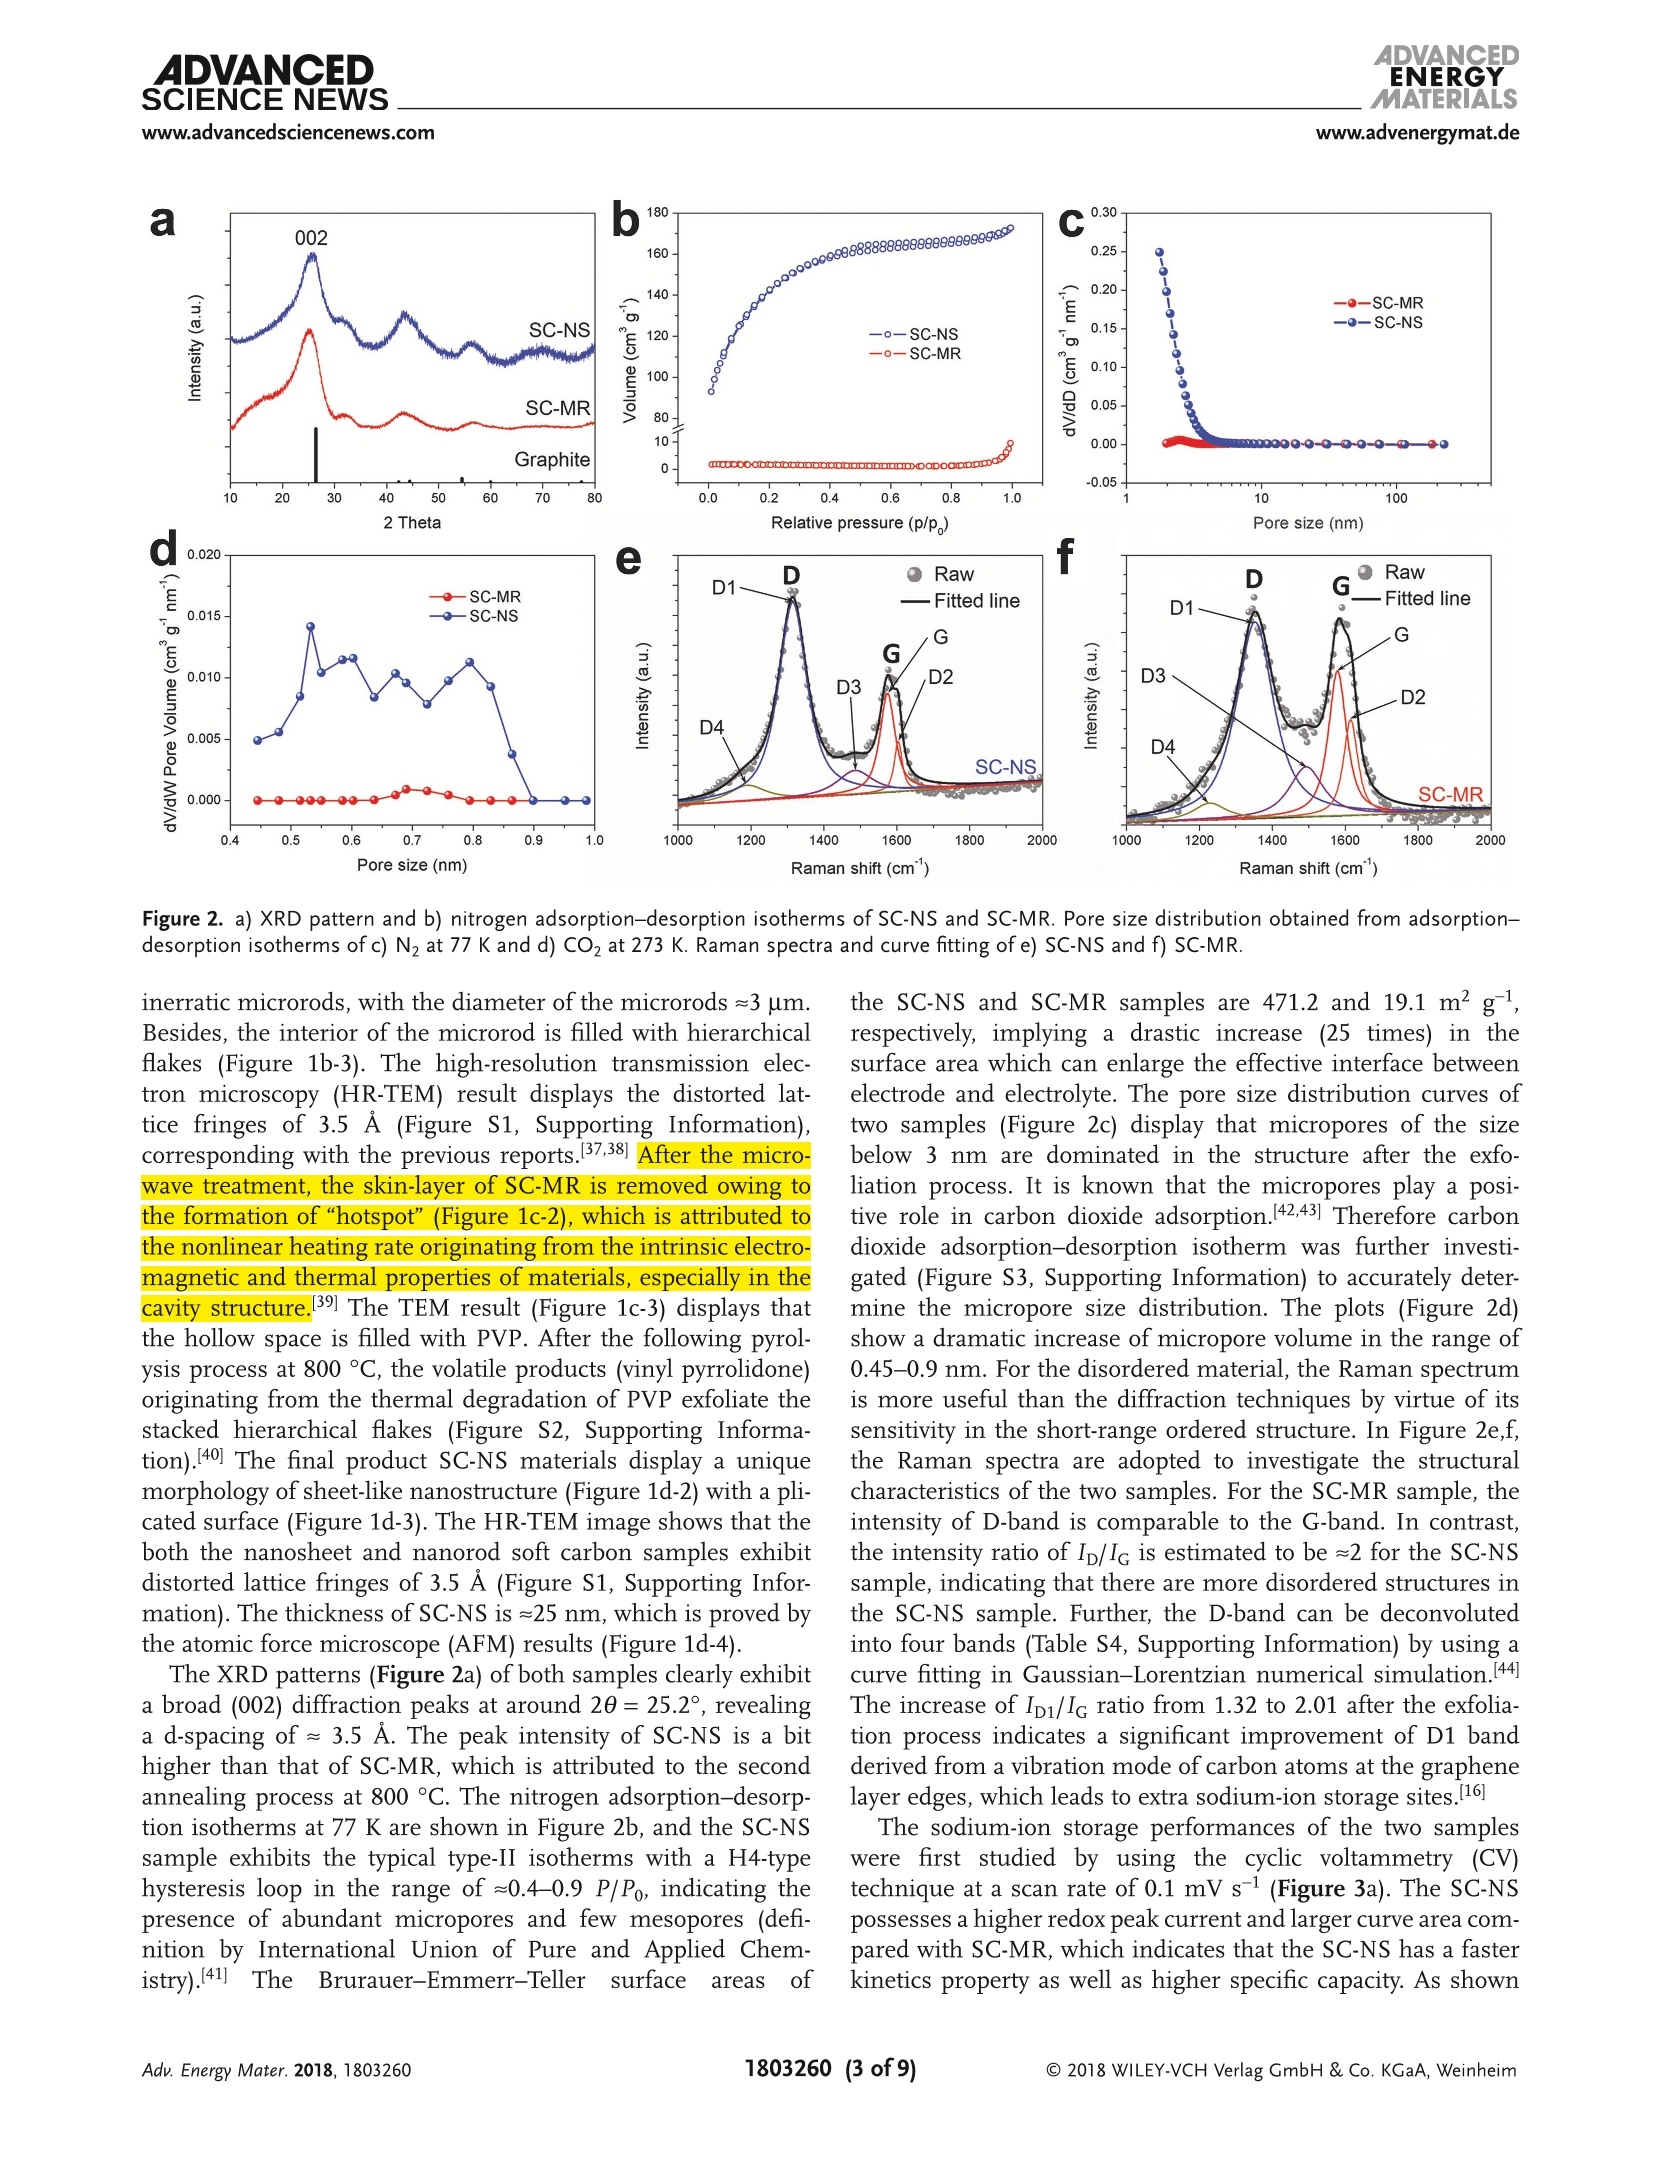
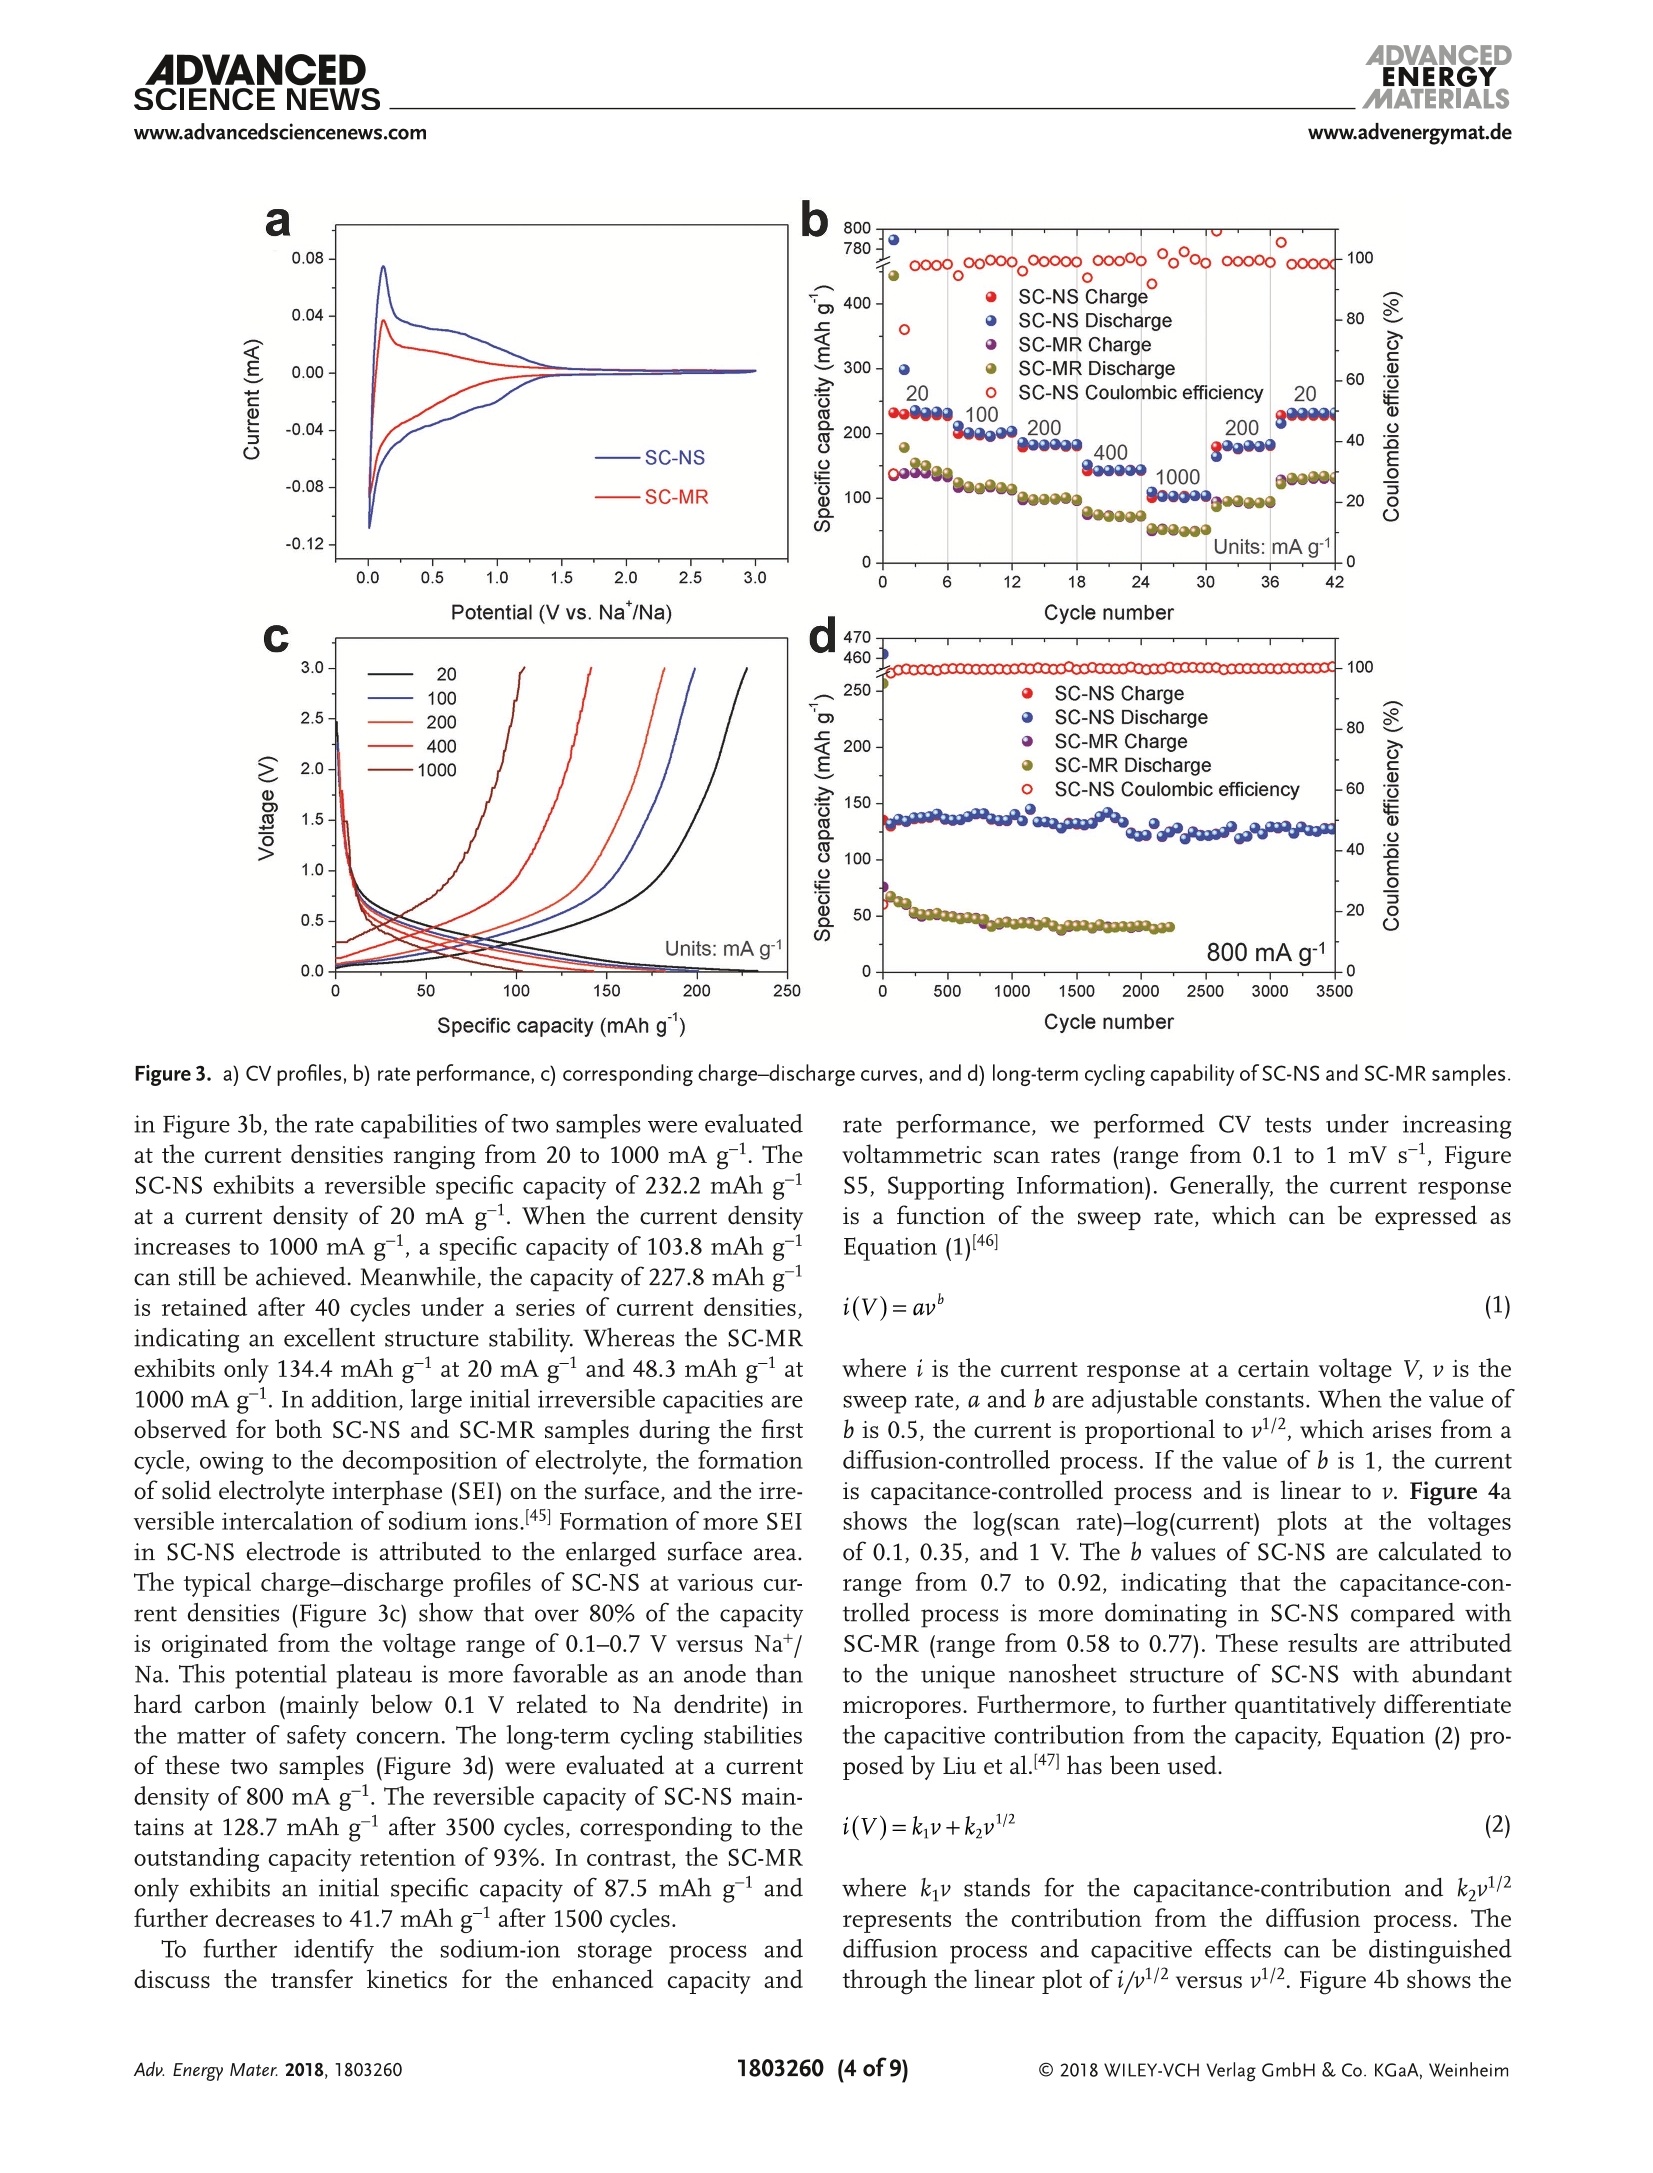
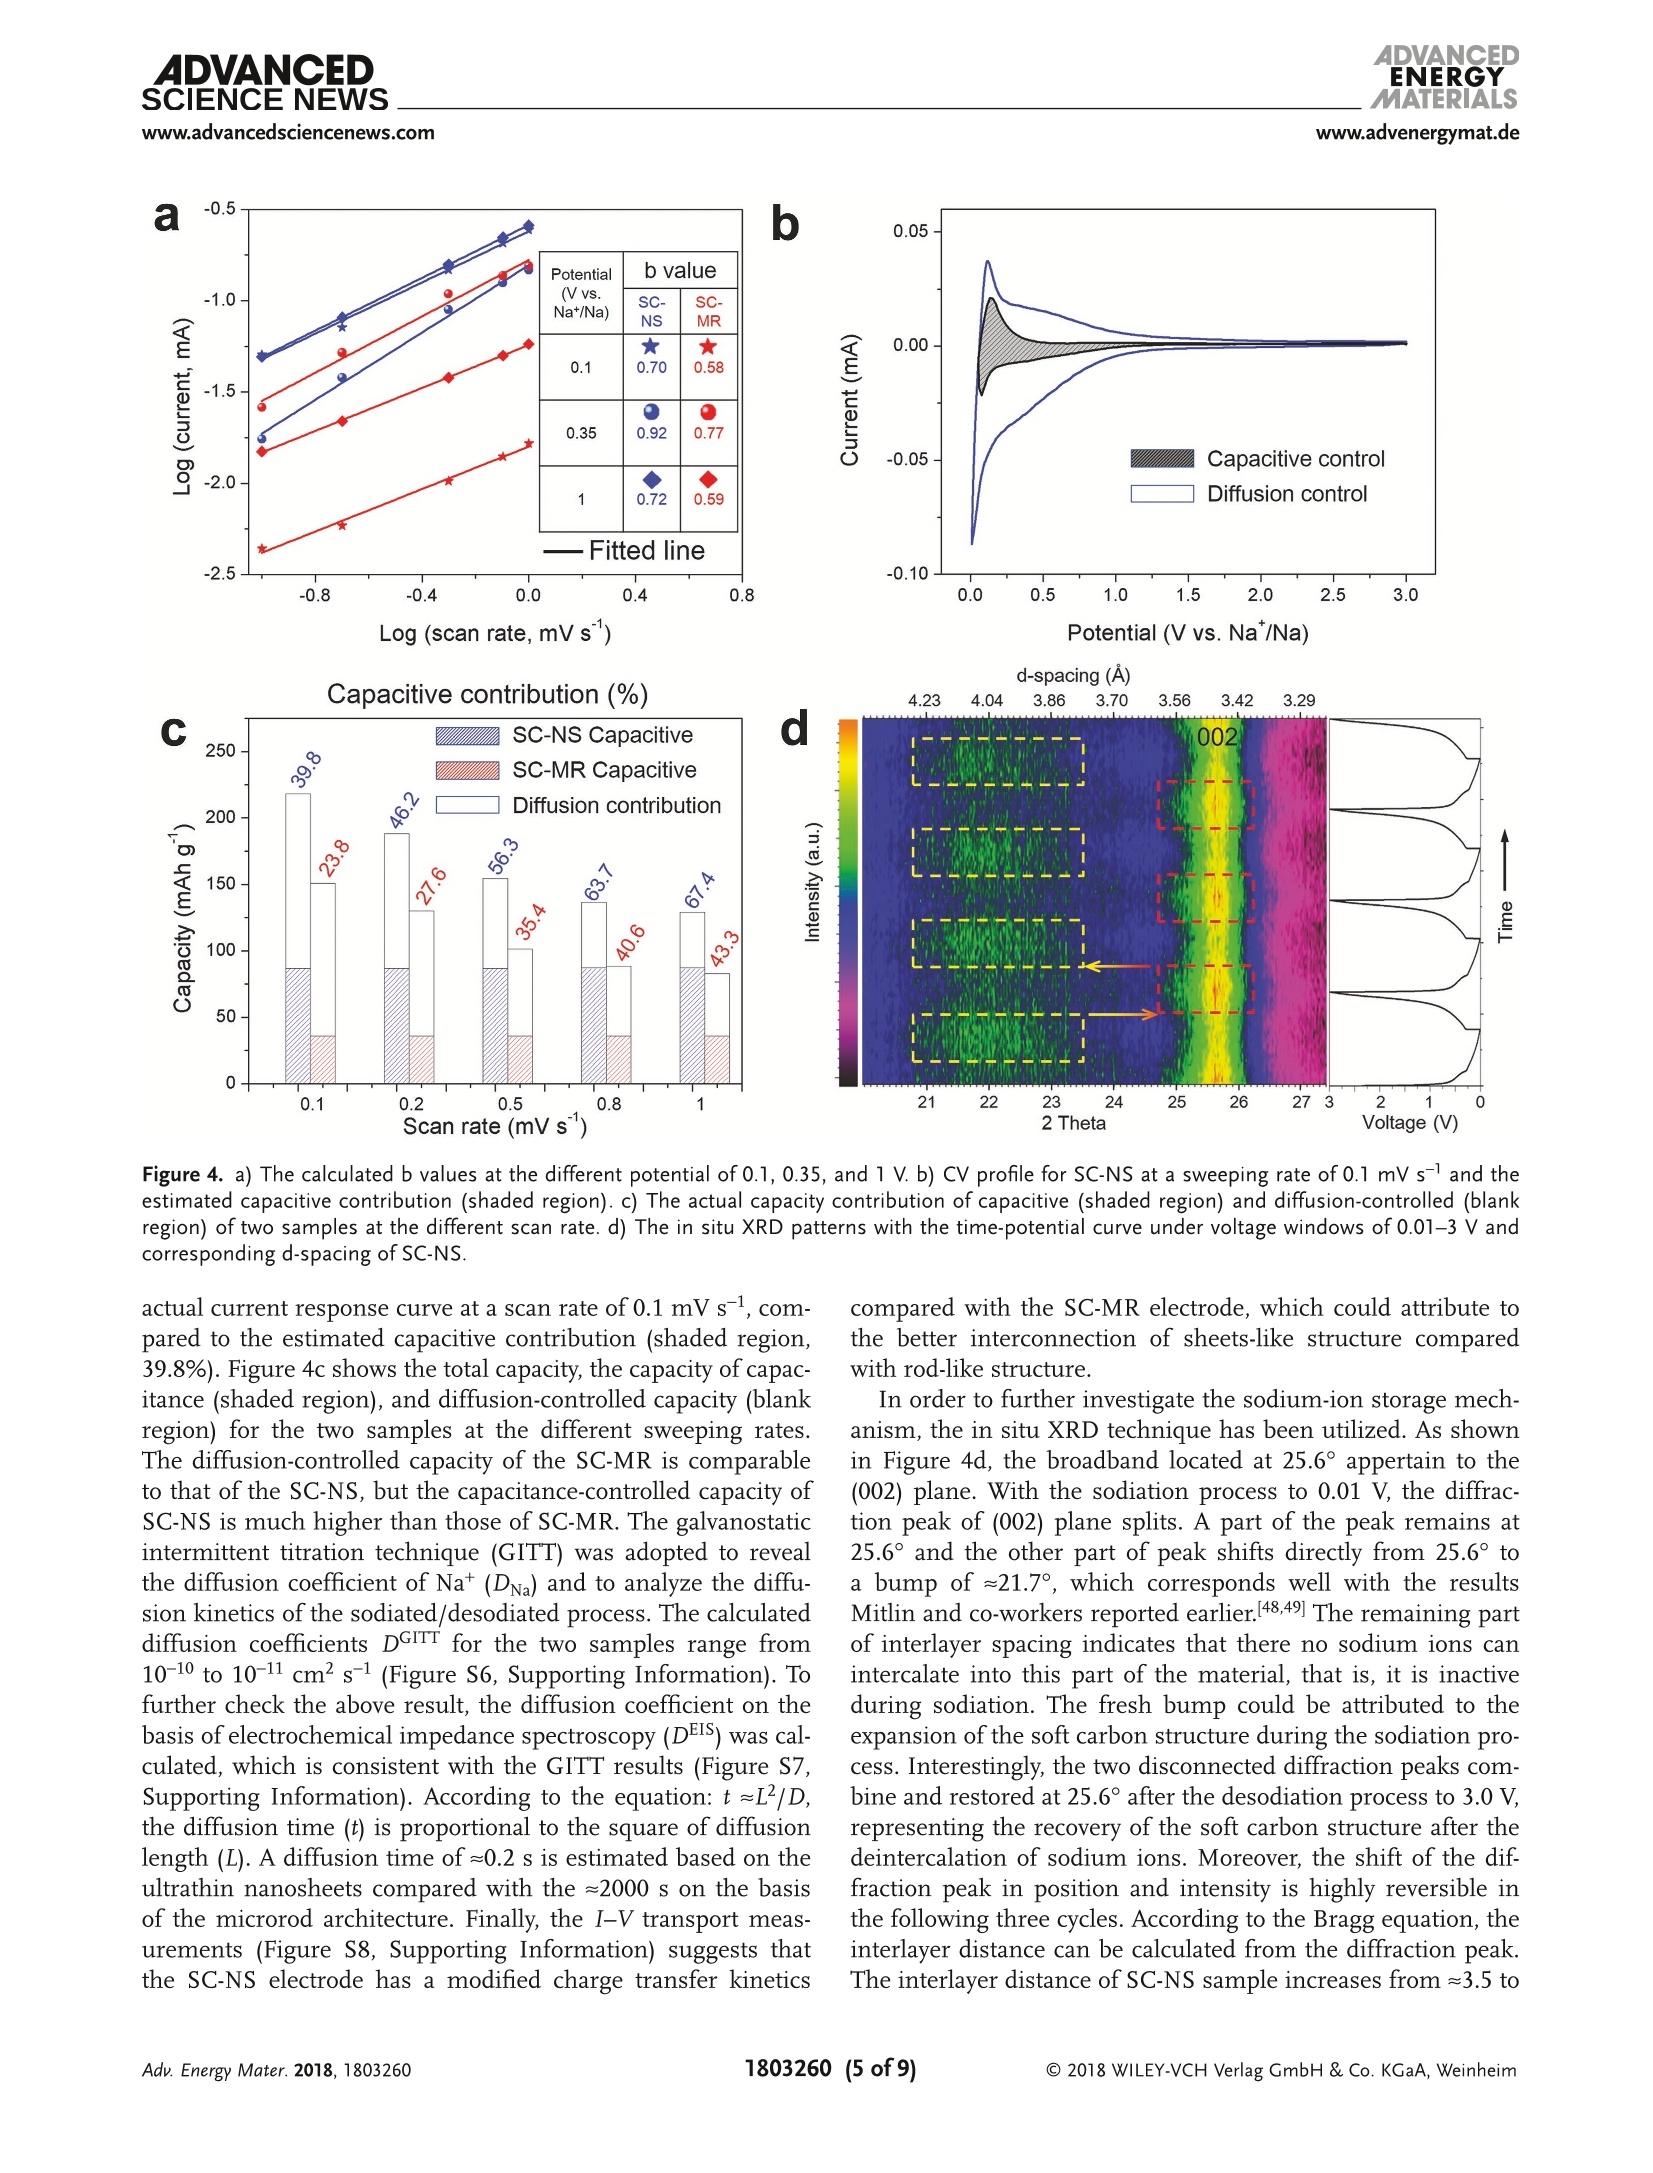
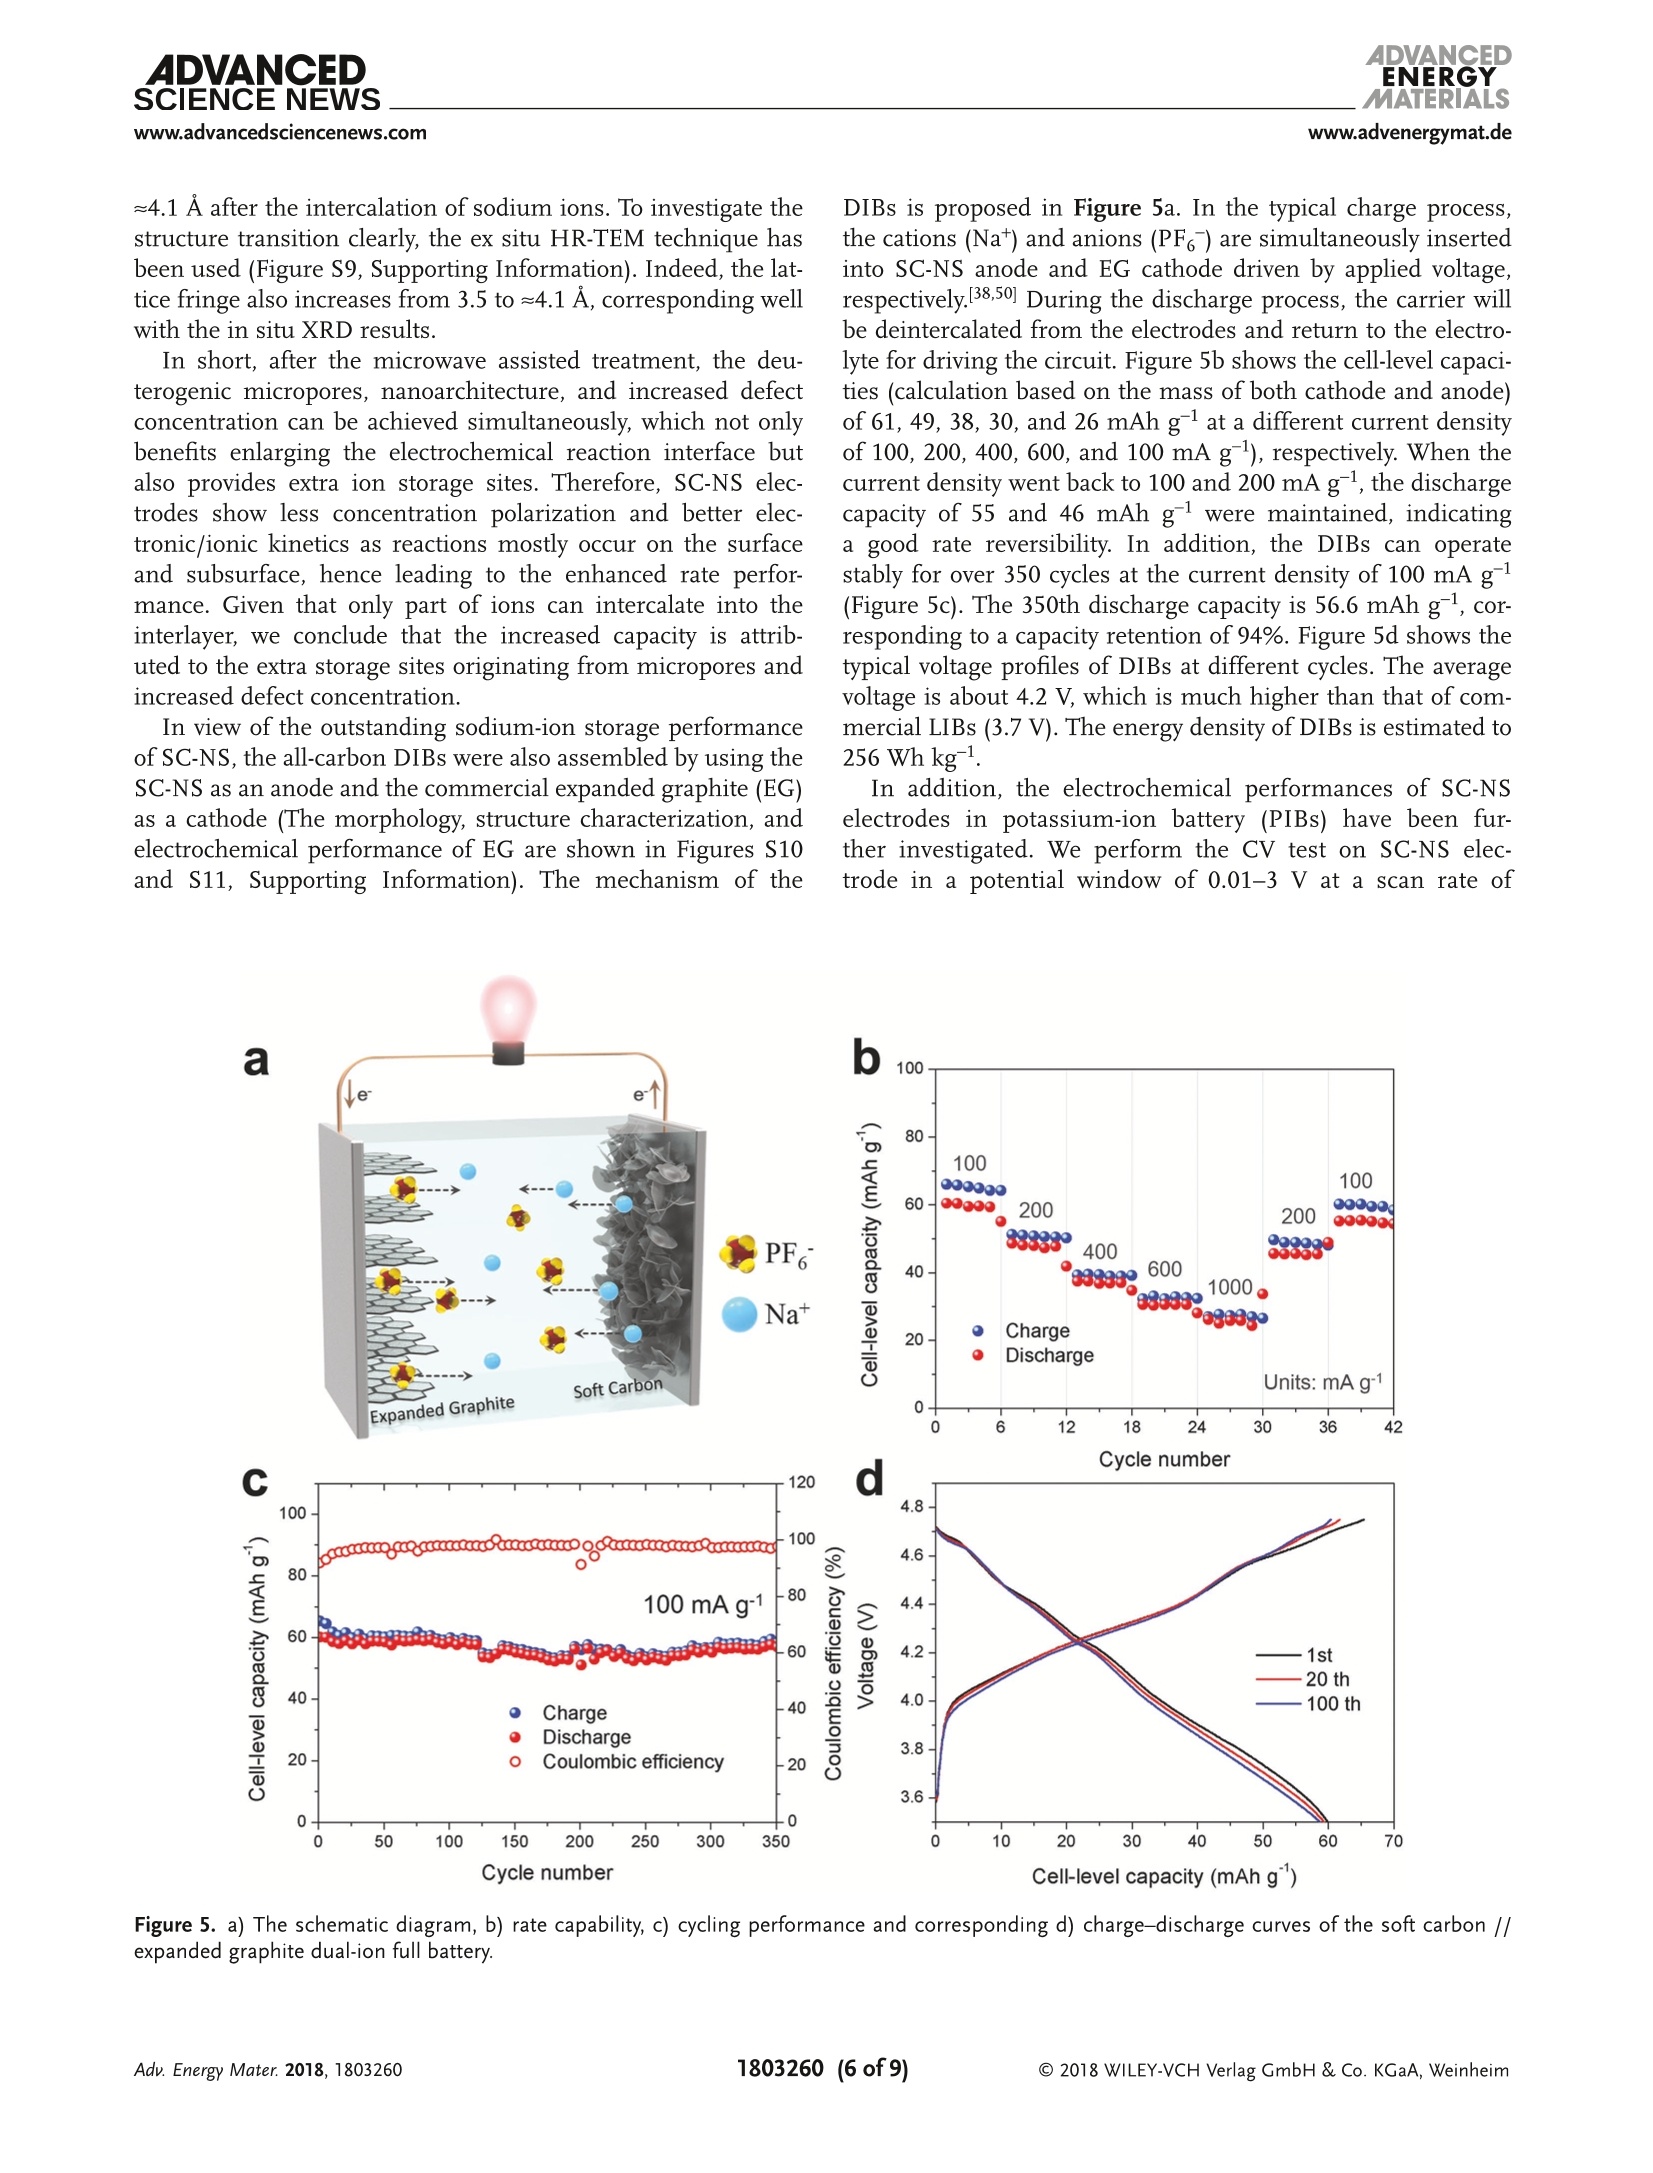
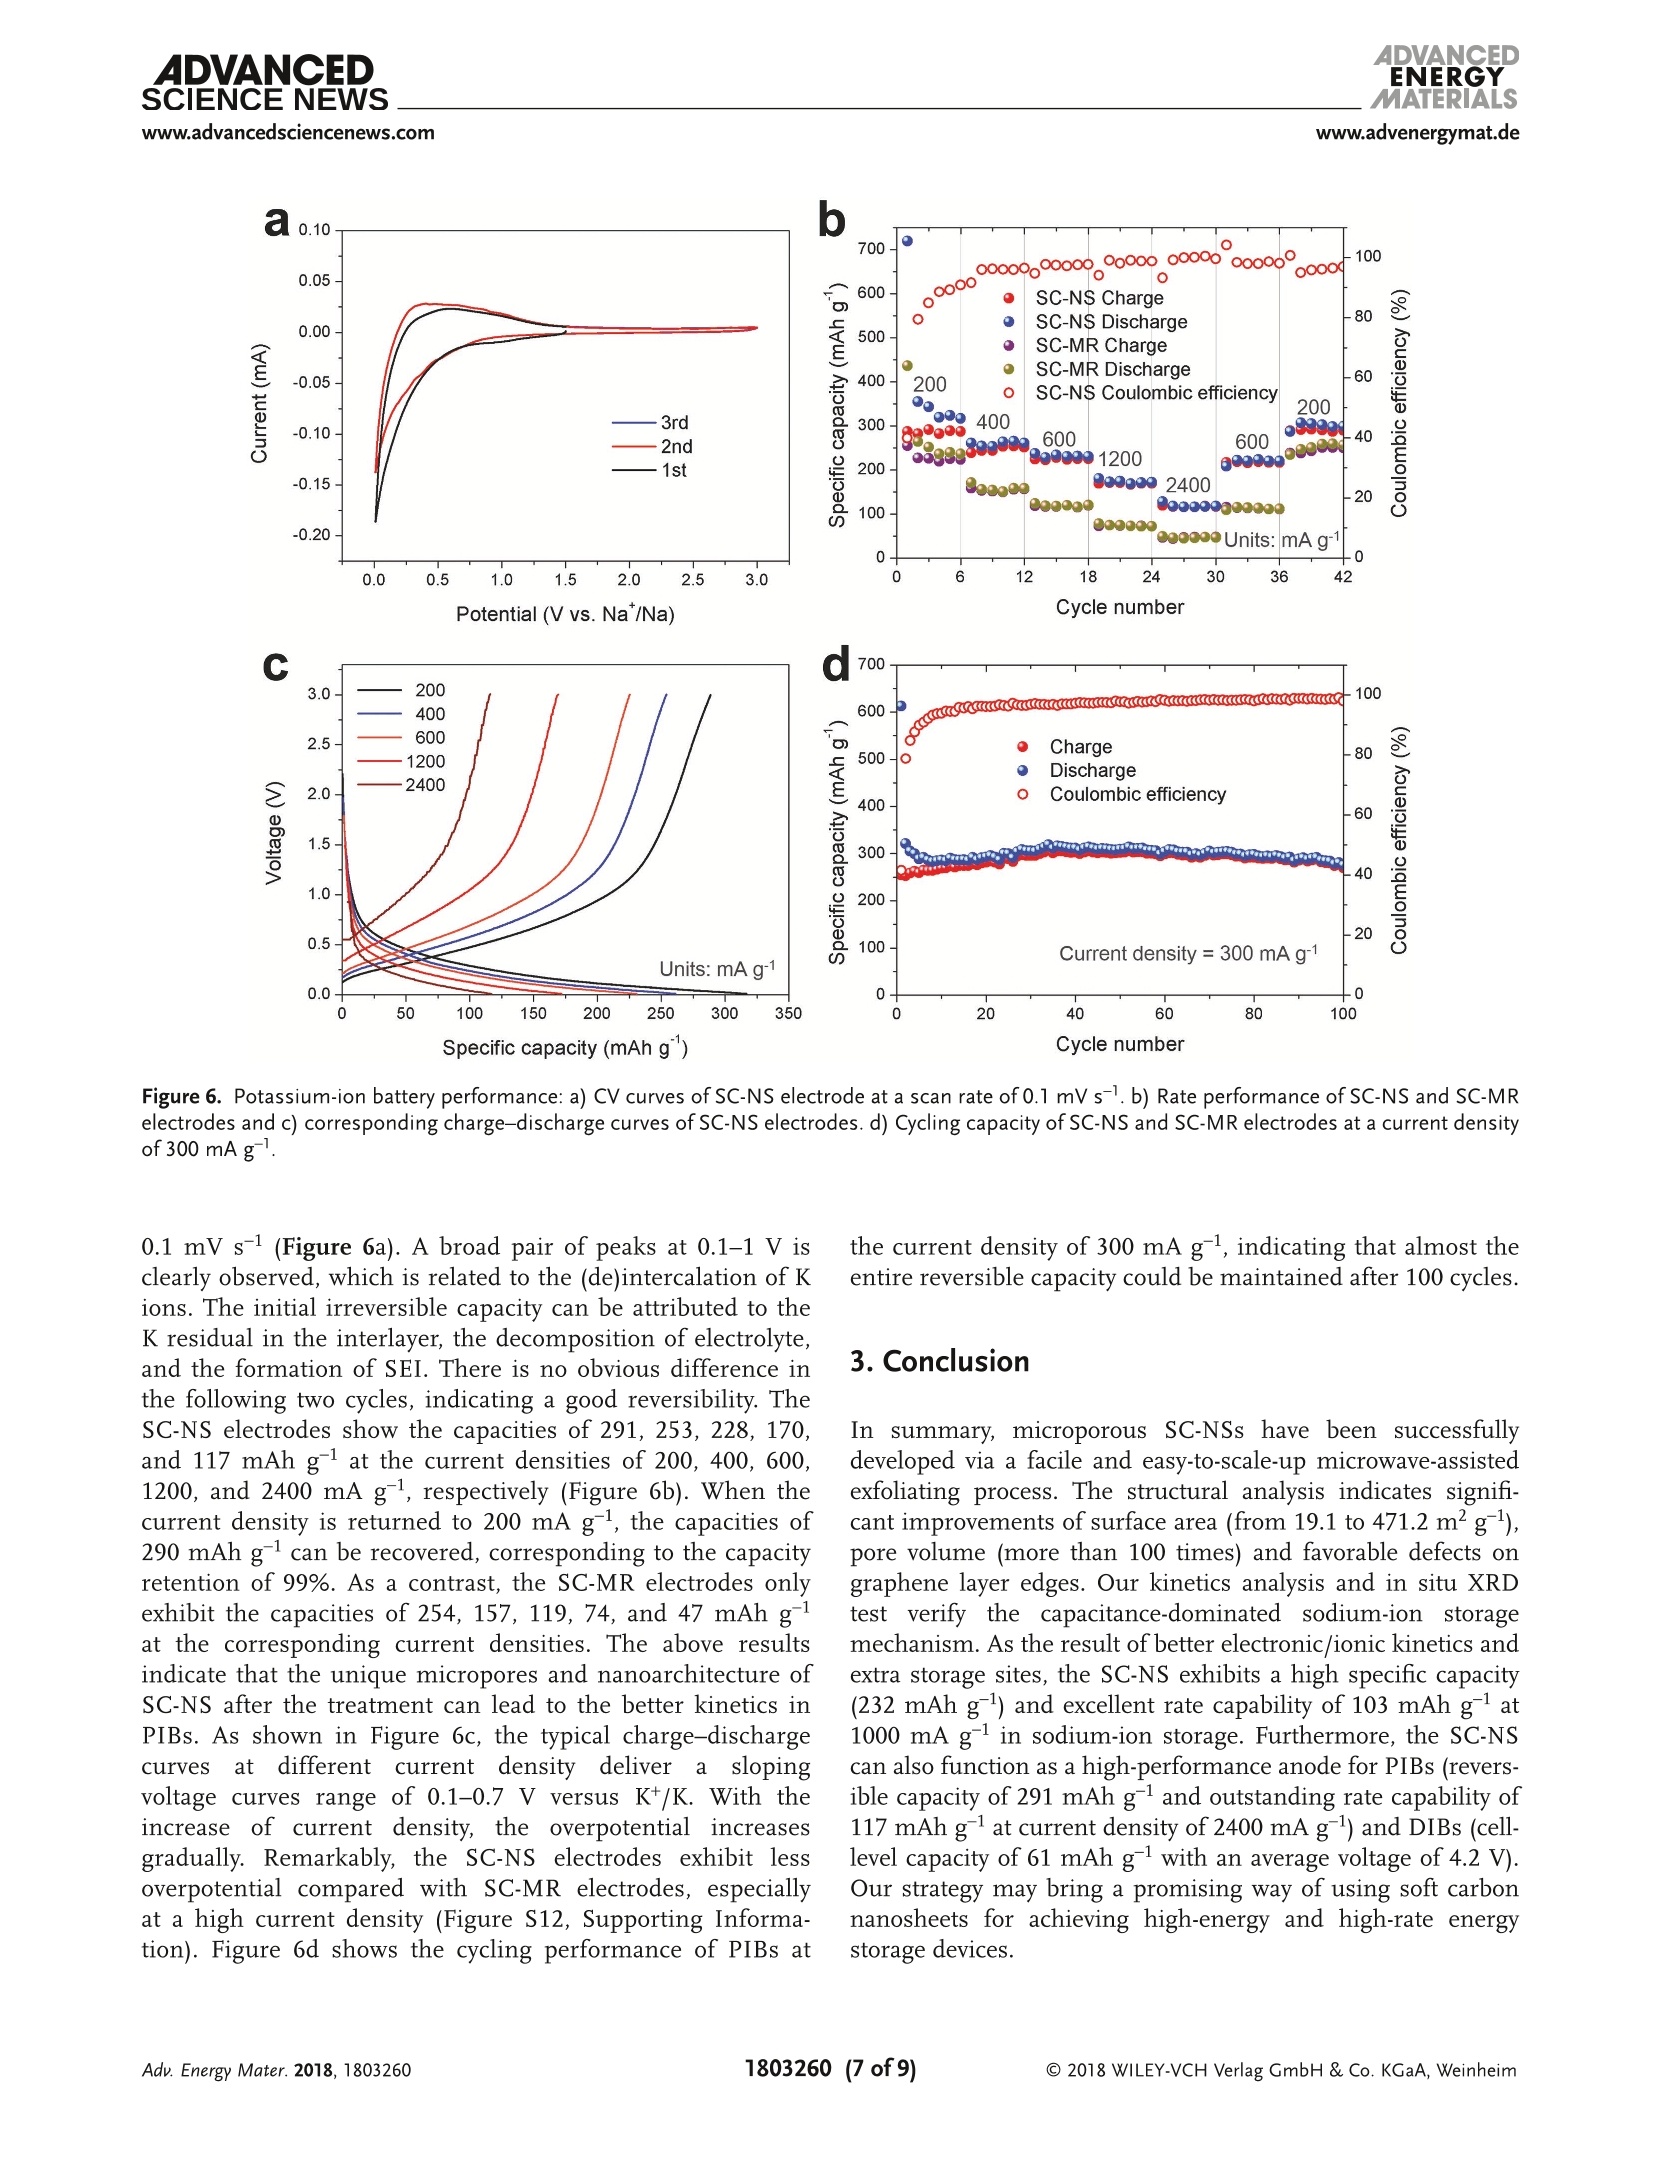
ADVANCEIENERGYMATERIALSFULL PAPERAlkali Metal lon Storagewww.advenergymat.d ADVANCEDENERGYMATERIALS4DVANCEDSCIENCE NEWSwww.advancedsciencenews.comwww.advenergymat.de Defect-Rich Soft Carbon Porous Nanosheets for Fast andHigh-Capacity Sodium-lon Storage Xuhui Yao, Yajie Ke, Wenhao Ren, Xuanpeng Wang, Fangyu Xiong, Wei Yang,Mingsheng Qin, Qi Li,* and Liqiang Mai* Soft carbon has attracted tremendous attention as an anode in rocking-chairbatteries owing to its exceptional properties including low-cost, tunableinterlayer distance, and favorable electronic conductivity. However, it failsto exhibit decent performance for sodium-ion storage owing to difficultiesin the formation of sodium intercalation compounds. Here, microporoussoft carbon nanosheets are developed via a microwave induced exfoliationstrategy from a conventional soft carbon compound obtained by pyrolysis of3,4,9,10-perylene tetracarboxylic dianhydride. The micropores and defectsat the edges synergistically leads to enhanced kinetics and extra sodium-ion storage sites, which contribute to the capacity increase from 134 to232 mAh gand a superior rate capability of 103 mAh gat 1000 mA gfor sodium-ion storage. In addition, the capacitance-dominated sodium-ionstorage mechanism is identified through the kinetics analysis. The in situX-ray diffraction analyses are used to reveal that sodium ions intercalate intographitic layers for the first time. Furthermore, the as-prepared nanosheetscan also function as an outstanding anode for potassium-ion storage(revers-ible capacity of 291 mAh g) and dual-ion full cell (cell-level capacity of61 mAh gand average working voltage of 4.2V). These properties representthe potential of soft carbon for achieving high-energy, high-rate, and low-costenergy storage systems. lithium-ion batteries (LIBs) cannot meetthe increasing requirement of large-scaleenergy storage due to the limited and highcost of lithium resources.[4.5] Other alkalimetals (especially sodium and potassium)are recognized as alternatives to lithiumowing to abundance of elemental sourceand geographical distribution.I6-8] Whilethe lithium and sodium share commonproperties as alkali metals, the assump-tion of adapting the same electrodematerials from LIBs to sodium-ion bat-teries (SIBs) is not always efficacious.9-11]The intrinsically higher redox poten-tial1 of Nat/Na compared with Lit/Li(-2.71> -3.04 V vs standard hydrogenelectrode) and the sluggish Nattransport resulting from the largerradiusofNa+comparedwith Li+(1.02 > 0.76A) directly affect the electro-chemical performance.[10] As the mostcommonaanode for commercialLIBs,graphiteeexhibits superior reversiblecapacity (close to its theoretical capacityof 372 mAh g ) as a result of consecu-tive migration of Lit between layered structures to forming LiC.12,13] Neverthe- 1. Introduction The intermittent renewable energy resources such as tide,wind, and solar are hard to be used without sufficient large-scale energy storage systems. 1-3] The currently commercialized X. Yao, Y. Ke, X. Wang, F. Xiong, W. Yang, M. Qin, Prof. Q. Li, Prof. L. MaiState Key Laboratory of Advanced Technology for Materials Synthesisand Processing International School of Materials Science and Engineering Wuhan University of Technology Hubei, Wuhan 430070, China E-mail: qi.li@whut.edu.cn; mlq518@whut.edu.cn Dr. W. Ren School of Chemistry Faculty of Science The University of New South Wales Sydney, New South Wales 2052, Australia The ORCID identification number(s) for the author(s) of this articlecan be found under https://doi.org/10.1002/aenm.201803260. less, as demonstrated by previous reports, both the experimentcarried out by Doeff et al.[14 and the theoretical calculationperformed via Density Functional Theory studies by Wanget al. 15] in 2014 prove that it is hard to form sodium interca-lated graphite compounds.[16,17] Only a small amount of Natcan be stored in graphite, leading to the suppressed reversiblecapacity of≈30 mAh g-1.[11,18,19] In contrast to the graphite, thenongraphitizable hard carbon and graphitizable nongraphiticsoft carbon have attracted most attentions as anodes for SIBson account of their high capacity.[20,21] The sodiation of hardcarbon at room temperature has been first reported by Stevensand Dahn, 22] achieving a capacity of =300 mAh g-. A inser-tion-absorption process named as "house of cards" has beenintroduced at the same time and further proved by in situ smallangle X-ray scattering study, which ascribes the sodiation toinsertion of Na-ions and metallic adsorption (deposition) intothe pores.[23,24] After that, other sodium storage mechanismsof hard carbon called "absorption-insertion”and “absorption-filling" have been introduced by Cao et al.[25] and Tarascon andco-workers,[26] respectively.[27] Considering the safety concern Figure 1. a-d) Schematic illustrations of the formation of the SC-NS materials. b-2) Scanning electron microscopy (SEM) and b-3) TEM images ofSC-MR. c-2) SEM and c-3) TEM images of intermediate. d-2) SEM and d-3) TEM images of SC-NS. d-4) AFM results of SC-NS. of the sodium dendrite formation arising from the very lowpotential plateau and the low ionic/electronic conductivityresulting from the tortuous atomic structure of hard carbon,the soft carbon is regarded as a feasible candidate for the SIBanode which has a higher electronic conductivity and tun-able interlayer distance.[20,28] As demonstrated by Doeff et al.,the petroleum coke derived soft carbon delivers a capacity of=90 mAh g- with the formation of NaC24. However, it onlyworks at 86°C because of the adoption of solid polymer electro-lyte. 14 Recently, Song and co-workers synthesized mesoporoussoft carbon by using a nano-CaCO, template method.Althoughthe mesoporous soft carbon can achieve an initial capacity of331 mAh g, the reversible capacity only retains 200 mAh gafter 200 cycles.29] Ji and co-workers reported an electrochemi-cally expandable soft carbon with the specific capacity over200 mAh g-1.[20] Besides, pitch derived, mesitylene derived,carbon black derived carbons have also been investigated.30-32]However, despite the decent performance of the above research,an energetic soft carbon anode which possesses both highcapacity and fast charging has not been well explored and theNat storage mechanism also needs to be further investigated. Fundamentally different from the diffusion-controlled pro-cess reacted in solid phase, the pseudocapacitive charge storagerepresents the faradaic charge-transfer reactions includingsolid fast ion intercalations and surface or subsurface redoxreactions,[33,34 which has the advantage of fast charging/dis-charging rate leading to high power density.33,35] Comparedwith the intrinsic pseudocapacitive materials (such as MnO2,Nb20s, and RuO2) displaying the pseudocapacitance for a widerange of particle sizes, the capacitive characteristics of extrinsicmaterials only emerge through nanostructure by virtue of maximizing reaction sites on the surface.[36 To the best of ourknowledge, there is no previous report revealing the pseudoca-pacitive behaviors for soft carbon materials in SIBs which canaccommodate fast and high-capacity sodium-ion storage. Herein, we fabricated microporous soft carbon nanosheets(SC-NS) through microwave assisted exfoliating process. Theas-prepared sample exhibits a higher capacity (232 mAh g)and an outstanding rate performance: (103 mAh g at1000 mA gl) compared with conventional soft carbon anodes.The sodium-ion storage mechanism of soft carbon nanosheetswas revealed by in situ X-ray diffraction (XRD) technique andquantitative kinetics analysis, which indicates the boostedcapacitive contribution. Beyond the sodium-ion storage, SC-NSalso exhibits a specific capacity of 291 and 117 mAh gat thecurrent densities of 200 and 2400 mA g as an anode for potas-sum-ion storage and can be employed as an efficient anode fordual-ion batteries (DIBs) with a cell-level capacity of 61 mAh gand average working voltage of 4.2V. 2. Results and Discussion Schematic illustration of the step-by-step reactions and the mor-phological evolution of the soft carbon were demonstrated inFigure 1a-d. The SC-NSs were prepared from the conventionalsoft carbon microrod (SC-MR) originating from the pyrolysisof 3,4,9,10-perylene tetracarboxylic dianhydride (PTCDA) fol-lowed by the microwave-assisted exfoliated process. The choiceof polyvinylpyrrolidone (PVP) is based on its ability to exfoliateand disperse carbon material such as graphite. Figure 1b-2indicates that the SC-MR sample exhibits the morphology of Pore size (nm) Raman shift (cm') Figure 2. a) XRD pattern and b) nitrogen adsorption-desorption isotherms of SC-NS and SC-MR. Pore size distribution obtained from adsorption-desorption isotherms of c) N2 at 77 K and d) CO at 273 K. Raman spectra and curve fitting of e) SC-NS and f) SC-MR. inerratic microrods, with the diameter of the microrods 3 um.Besides, the interior of the microrod is filled with hierarchicalflakes (Figure 1b-3). The high-resolution transmission elec-tron microscopy (HR-TEM) result displays the distorted lat-tice fringes of 3.5 A (Figure S1, Supporting Information),corresponding with the previous reports.37,38]After the micro-wave treatment, the skin-layer of SC-MR is removed owing tothe formation of“hotspot”’(Figure 1c-2), which is attributed tothe nonlinear heating rate originating from the intrinsic electro-magnetic and thermal properties of materials, especially in thecavity structure.[39 The TEM result (Figure 1c-3) displays thatthe hollow space is filled with PVP. After the following pyrol-ysis process at 800C, the volatile products (vinyl pyrrolidone)originating from the thermal degradation of PVP exfoliate thestacked hierarchical flakes (Figure S2, Supporting Informa-tion). 40 The final product SC-NS materials display a uniquemorphology of sheet-like nanostructure (Figure 1d-2) with a pli-cated surface (Figure 1d-3). The HR-TEM image shows that theboth the nanosheet and nanorod soft carbon samples exhibitdistorted lattice fringes of 3.5 A (Figure S1, Supporting Infor-mation). The thickness of SC-NS is ≈25 nm,which is proved bythe atomic force microscope (AFM) results (Figure 1d-4). The XRD patterns (Figure 2a) of both samples clearly exhibita broad (002) diffraction peaks at around 20=25.2°, revealinga d-spacing of = 3.5 A. The peak intensity of SC-NS is a bithigher than that of SC-MR, which is attributed to the secondannealing process at 800℃. The nitrogen adsorption-desorp-tion isotherms at 77 Kare shown in Figure 2b, and the SC-NSsample exhibits the typical type-II isotherms with a H4-typehysteresis loop in the range of =0.4-0.9 P/Po, indicating thepresence of abundant micropores and few mesopores (defi-nition by International Union of Pure and Applied Chem-istry).41]The Brurauer-Emmerr-Teller surface areas of the SC-NS and SC-MR samples are 471.2 and 19.1 m²;,respectively, implyinga drastic increase (25 times) in thesurface area which can enlarge the effective interface betweenelectrode and electrolyte. The pore size distribution curves oftwo samples (Figure 2c) display that micropores of the sizebelow 3 nm are dominated in the structure after the exfo-liation process. It is known that the micropores play a posi-tive role in carbon dioxide adsorption.[42,43] Therefore carbondioxide adsorption-desorption isotherm was further investi-gated (Figure S3, Supporting Information) to accurately deter-mine the micropore size distribution. The plots (Figure 2d)show a dramatic increase of micropore volume in the range of0.45-0.9 nm. For the disordered material, the Raman spectrumis more useful than the diffraction techniques by virtue of itssensitivity in the short-range ordered structure. In Figure 2e,f,the Raman spectra are adopted to investigate the structuralcharacteristics of the two samples. For the SC-MR sample, theintensity of D-band is comparable to the G-band. In contrast,the intensity ratio of Ip/Ic is estimated to be ≈2 for the SC-NSsample, indicating that there are more disordered structures inthe SC-NS sample. Further, the D-band can be deconvolutedinto four bands (Table S4, Supporting Information) by using acurve fitting in Gaussian-Lorentzian numerical simulation.44]The increase of Ipi/Ic ratio from 1.32 to 2.01 after the exfolia-tion process indicates a significant improvement of D1 bandderived from a vibration mode of carbon atoms at the graphenelayer edges, which leads to extra sodium-ion storage sites.[16] The sodium-ion storage performances of the two sampleswere first studied by using the cyclic voltammetry (CV)technique at a scan rate of 0.1 mV s-1(Figure 3a). The SC-NSpossesses a higher redox peak current and larger curve area com-pared with SC-MR, which indicates that the SC-NS has a fasterkinetics property as well as higher specific capacity. As shown Specific capacity (mAh g) Figure 3. a) CV profiles, b) rate performance, c) corresponding charge-discharge curves, and d) long-term cycling capability of SC-NS and SC-MR samples. in Figure 3b, the rate capabilities of two samples were evaluatedat the current densities ranging from 20 to 1000 mA g. TheSC-NS exhibits a reversible specific capacity of 232.2 mAh gat a current density of 20 mA g. When the current densityincreases to 1000 mA g, a specific capacity of 103.8 mAh g-can still be achieved. Meanwhile, the capacity of 227.8 mAh gis retained after 40 cycles under a series of current densities,indicating an excellent structure stability. Whereas the SC-MRexhibits only 134.4 mAh gat 20 mA gand 48.3 mAh gat1000 mA g. In addition, large initial irreversible capacities areobserved for both SC-NS and SC-MR samples during the firstcycle, owing to the decomposition of electrolyte, the formationof solid electrolyte interphase (SEI) on the surface, and the irre-versible intercalation of sodium ions.[45] Formation of more SEIin SC-NS electrode is attributed to the enlarged surface area.The typical charge-discharge profiles of SC-NS at various cur-rent densities (Figure 3c) show that over 80% of the capacityis originated from the voltage range of 0.1-0.7 V versus Na+/Na. This potential plateau is more favorable as an anode thanhard carbon (mainly below 0.1 V related to Na dendrite) inthe matter of safety concern. The long-term cycling stabilitiesof these two samples (Figure 3d) were evaluated at a currentdensity of 800 mA g. The reversible capacity of SC-NS main-tains at 128.7 mAh gafter 3500 cycles, corresponding to theoutstanding capacity retention of 93%. In contrast, the SC-MRonly exhibits an initial specific capacity of 87.5 mAh g andfurther decreases to 41.7 mAh gafter 1500 cycles. To further identify the sodium-ion storage process anddiscuss the transfer kinetics for the enhanced capacity and rate performance, we performed CV tests under increasingvoltammetric scan rates (range from 0.1 to 1 mV s-l, FigureS5, Supporting Information). Generally, the current responseis a function of the sweep rate, which can be expressed asEquation (1)[46] where i is the current response at a certain voltage V, v is thesweep rate, a and b are adjustable constants. When the value ofb is 0.5, the current is proportional to vl/2, which arises from adiffusion-controlled process. If the value of b is 1, the currentis capacitance-controlled process and is linear to v. Figure 4ashows the log(scan rate)-log(current) plots at the voltagesof 0.1, 0.35, and1 V. The b values of SC-NS are calculated torange from 0.7 to 0.92, indicating that the capacitance-con-trolled process is more dominating in SC-NS compared withSC-MR (range from 0.58 to 0.77). These results are attributedto the unique nanosheet structure of SC-NS with abundantmicropores. Furthermore, to further quantitatively differentiatethe capacitive contribution from the capacity, Equation (2) pro-posed by Liu et al.[47 has been used. where kjv stands for the capacitance-contribution and kzv1/2represents the contribution from the diffusion process. Thediffusion process and capacitive effects can be distinguishedthrough the linear plot of i/v1/2 versus v1/2. Figure 4b shows the Figure 4. a) The calculated b values at the different potential of 0.1, 0.35, and 1 V. b) CV profile for SC-NS at a sweeping rate of 0.1 mV s- and theestimated capacitive contribution (shaded region). c) The actual capacity contribution of capacitive (shaded region) and diffusion-controlled (blankregion) of two samples at the different scan rate. d) The in situ XRD patterns with the time-potential curve under voltage windows of 0.01-3 V andcorresponding d-spacing of SC-NS. actual current response curve at a scan rate of 0.1 mV s-, com-pared to the estimated capacitive contribution (shaded region,39.8%). Figure 4c shows the total capacity, the capacity of capac-itance (shaded region), and diffusion-controlled capacity (blankregion) for the two samples at the different sweeping rates.The diffusion-controlled capacity of the SC-MR is comparableto that of the SC-NS, but the capacitance-controlled capacity ofSC-NS is much higher than those of SC-MR. The galvanostaticintermittent titration technique (GITT) was adopted to revealthe diffusion coefficient of Nat (DNa) and to analyze the diffu-sion kinetics of the sodiated/desodiated process. The calculateddiffusion coefficients DGITT for the two samples range from10-10 to 10-11 cm² s-1 (Figure S6, Supporting Information). Tofurther check the above result, the diffusion coefficient on thebasis of electrochemical impedance spectroscopy (Dis) was cal-culated, which is consistent with the GITT results (Figure S7,Supporting Information). According to the equation: t =L|D,the diffusion time (t) is proportional to the square of diffusionlength (L). A diffusion time of ~0.2 s is estimated based on theultrathin nanosheets compared with the≈2000 s on the basisof the microrod architecture. Finally, the I-V transport meas-urements (Figure S8, Supporting Information) suggests thatthe SC-NS electrode has a modified charge transfer kinetics compared with the SC-MR electrode, which could attribute tothe better interconnection of sheets-like structure comparedwith rod-like structure. In order to further investigate the sodium-ion storage mech-anism, the in situ XRD technique has been utilized. As shownin Figure 4d, the broadband located at 25.6° appertain to the(002) plane. With the sodiation process to 0.01 V, the diffrac-tion peak of (002) plane splits. A part of the peak remains at25.6°and the other part of peak shifts directly from 25.6° toa bump of~21.7°, which corresponds well with the resultsMitlin and co-workers reported earlier.[48,49] The remaining partof interlayer spacing indicates that there no sodium ions canintercalate into this part of the material, that is, it is inactiveduring sodiation. The fresh bump could be attributed to theexpansion of the soft carbon structure during the sodiation pro-cess. Interestingly, the two disconnected diffraction peaks com-bine and restored at 25.6° after the desodiation process to 3.0 V,representing the recovery of the soft carbon structure after thedeintercalation of sodium ions. Moreover, the shift of the dif-fraction peak in position and intensity is highly reversible inthe following three cycles. According to the Bragg equation, theinterlayer distance can be calculated from the diffraction peak.The interlayer distance of SC-NS sample increases from =3.5 to ~4.1 A after the intercalation of sodium ions. To investigate thestructure transition clearly, the ex situ HR-TEM technique hasbeen used (Figure S9, Supporting Information). Indeed, the lat-tice fringe also increases from 3.5 to ~4.1 A, corresponding wellwith the in situ XRD results. In short, after the microwave assisted treatment, the deu-terogenic micropores, nanoarchitecture, and increased defectconcentration can be achieved simultaneously, which not onlybenefits enlarging the electrochemical reaction interface butalso provides extra ion storage sites. Therefore, SC-NS elec-trodes show less concentration polarization and better elec-tronic/ionic kinetics as reactions mostly occur on the surfaceand subsurface, hence leading to the enhanced rate perfor-mance. Given that only part of ions can intercalate into theinterlayer, we conclude that the increased capacity is attrib-uted to the extra storage sites originating from micropores andincreased defect concentration. In view of the outstanding sodium-ion storage performanceof SC-NS, the all-carbon DIBs were also asseiemmbled by using theSC-NS as an anode and the commercial expanded graphite (EG)as a cathode (The morphology, structure characterization, andelectrochemical performance of EG are shown in Figures S10and S11, Supporting Information). The mechanism of the DIBs is proposed in Figure 5a. In the typical charge process,the cations (Na*) and anions (PF6 ) are simultaneously insertedinto SC-NS anode and EG cathode driven by applied voltage,respectively. 38.50] During the discharge process, the carrier willbe deintercalated from the electrodes and return to the electro-lyte for driving the circuit. Figure 5b shows the cell-level capaci-ties (calculation based on the mass of both cathode and anode)of 61, 49, 38, 30, and 26 mAhgat a different current densityof 100, 200, 400, 600, and 100 mA g-l), respectively. When thecurrent density went back to 100 and 200 mA g, the dischargecapacity of 55 and 46 mAh g-were maintained, indicatinga good rate reversibility. In addition, the DIBs can operatestably for over 350 cycles at the current density of 100 mA g(Figure 5c). The 350th discharge capacity is 56.6 mAh g, cor-responding to a capacity retention of 94%. Figure 5d shows thetypical voltage profiles of DIBs at different cycles. The averagevoltage is about 4.2 V, which is much higher than that of com-mercial LIBs (3.7 V). The energy density of DIBs is estimated to256 Wh kgg.· In addition, the electrochemical performances of SC-NSelectrodes in potassium-ion battery (PIBs) have been fur-ther investigated. We perform the CV test on SC-NS elec-trode in a potential window of 0.01-3 V at a scan rate of Figure 5. a) The schematic diagram, b) rate capability, c) cycling performance and corresponding d) charge-discharge curves of the soft carbon //expanded graphite dual-ion full battery. Figure 6. Potassium-ion battery performance: a) CV curves of SC-NS electrode at a scan rate of 0.1 mV s-1. b) Rate performance of SC-NS and SC-MRelectrodes and c) corresponding charge-discharge curves of SC-NS electrodes. d) Cycling capacity of SC-NS and SC-MR electrodes at a current densityof 300 mAg. 0.1 mV s (Figure 6a). A broad pair of peaks at 0.1-1 V isclearly observed, which is related to the (de)intercalation of Kions. The initial irreversible capacity can be attributed to theK residual in the interlayer, the decomposition of electrolyte,and the formation of SEI. There is no obvious difference inthe following two cycles, indicating a good reversibility. TheSC-NS electrodes show the capacities of 291, 253, 228, 170,and 117 mAh g-at the current densities of 200, 400, 600,1200, and 2400 mA g, respectively (Figure 6b). When thecurrent density is returned to 200 mA g, the capacities of290 mAh g-can be recovered, corresponding to the capacityretention of 99%. As a contrast, the SC-MR electrodes onlyexhibit the capacities of 254, 157,119, 74, and 47 mAh g-1at the corresponding current densities. The above resultsindicate that the unique micropores and nanoarchitecture ofSC-NS after the treatment can lead to the better kinetics inPIBs. As shown in Figure 6c, the typical charge-dischargecurves at differentC(currentdensitydeliveraslopingvoltage curves range of 0.1-0.7 V versus K+/K. With theincrease of currentdensity, the overpotentialiincreasesgradually. Remarkably, the SC-NS electrodes exhibit lessoverpotential compared with SC-MR electrodes, especiallyat a high current density (Figure S12, Supporting Informa-tion). Figure 6d shows the cycling performance of PIBs at the current density of 300 mA g, indicating that almost theentire reversible capacity could be maintained after 100 cycles. 3. Conclusion In summary, microporous SC-NSs have been successfullydeveloped via a facile and easy-to-scale-up microwave-assistedexfoliating process. The structural analysis indicates signifi-cant improvements of surface area (from 19.1 to 471.2 m² g-l),pore volume (more than 100 times) and favorable defects ongraphene layer edges. Our kinetics analysis and in situ XRDtest verify the capacitance-dominated sodium-ion storagemechanism. As the result of better electronic/ionic kinetics andextra storage sites, the SC-NS exhibits a high specific capacity(232 mAh g) and excellent rate capability of 103 mAh g-at1000 mA gin sodium-ion storage. Furthermore, the SC-NScan also function as a high-performance anode for PIBs (revers-ible capacity of 291 mAh gand outstanding rate capability of117 mAh gat current density of 2400 mAg) and DIBs (cell-level capacity of 61 mAh gwith an average voltage of 4.2 V).Our strategy may bring a promising way of using soft carbonnanosheets for achieving high-energy and high-rate energystorage devices. 4. Experimental Section Synthesis of Microporous Soft Carbon Nanosheets: The conventionalsoft carbon was prepared by directly pyrolysis of PTCDA (Alfa Aesar98%) at 900 °C for 10 h under flowing argonatmosphere (5C min-).Next, conventional soft carbon sample was added in 100 mL water with10 wt% polyvinylpyrrolidone and the above mixture was sonicated atroom temperature for 12 h. KOH (5 g) was added to the mixture and thesolution was then further stirred at 60 °C for 2 h. Then, the sample wastreated by using a microwave oven at an irradiation power of 300 W for5 min. Next, the solid powder obtained was washed with 1 M HCl anddeionized water several times to remove the remaining KOH and driedat 70 ℃ for 12 h. The dried powder was then annealed in a tube furnacefrom room temperature to 800 ℃ with a heating rate of 5 ℃min-under argon gas flow. Structural Characterization: The morphology was observed by usingthe field emission scanning electron microscopy (EOL JSM-7100F,acceleration voltage:15 kV). The transmission electron microscopy(TEM) and high-resolution TEM were performed on a JEOL JEM-2100Fmicroscope at 200 kV. The powder XRD and in situ XRD experimentswere performed using Bruker D8 Discover X-ray diffractometer with anonmonochromated Cu KX-ray source. The surface area and pore-sizedistribution were calculated from N2 adsorption isotherms and COzadsorption isotherms measured by using a Tristar-3020 instrument.Atomic force microscope measurements were performed by SmartSPM 1000 (AIST-NT) with the aluminum coating n-type silicon probe(umasch, HQ: NSC14/AIB5, 125 um, 160 kHz, 5 N/M). The Ramanspectra were recorded using a HORIBA LabRAM HR Evolution micro-Raman spectroscopy system. Electrochemical Measurements: The electrochemical measurementswere investigated with 2016 coin cells assembled in a glove box filled withargon atmosphere. The electrodes were made by mixing active materials,acetylene black, and polyvinylidene fluoride (7:2:1) in N-methylpyrrolidonesolution. Then, the slurry was spread onto the Al foil and dried for at least10 h at 70 ℃. The mass loadings of the active material were 1.5-2 mg cm.For sodium-ion batteries, the electrolyte was 1 M NaPF in ethyl carbonate,dimethyl carbonate, and ethyl-methyl carbonate with a mass ratio of1:1:1. Counter electrode was Na metal. For potassium-ion batteries, theelectrolyte was 1 M potassium bis (fluorosulfonyl) imide in a mixture ofethylene carbon/dimethyl carbonate (1:1 w/w). Counter electrode wasK metal. The dual-ion full batteries were assembled by using expandedgraphite as cathode and SC-NS as anode. The electrolyte was as sameas the sodium-ion batteries. The Whatman glass microfiber filter (GradeGF/A) was used as the separator. The batteries were aged for at least 6 hto ensure sufficient infiltration of the electrolyte before testing. The cyclicvoltammetry curves were obtained with the CHI1000D electrochemicalworkstation. Galvanostatic charge/discharge tests were cycled by using theLAND CT2001A multichannel battery testing system. The electrochemicalimpedance spectroscopy was evaluated by using an electrochemicalworkstation (Autolab PGSTAT302N). The cell-level capacity of the dual-ionbattery was determined based on the total mass of the cathode and anodeactive materials according to the relationship as following Equation (3)[51,52] where the Ctotal, Ca, and Cc stand for the capacity of dual-ion full cell,anode, and cathode, respectively. Supporting Information Supporting Information is available from the Wiley Online Library orfrom the author. Acknowledgements X.Y. and Y.K. contributed equally to this work. This work was supportedby tthe National Natural Science FFund for Distinguished Young Scholars (51425204), the National Natural Science Foundation ofChina (51832004, 21805219, and 51521001), thee Programme ofIntroducing Talents of Discipline to Universities (B17034), the YellowCrane Talent (Science and Technology) Program of Wuhan City, andthe Fundamental Research Funds for the Central Universities (WUT:2017IVA096, 2017I11009, and 2017I11040) the State Key Laboratory ofAdvanced Technology for Materials Synthesis and Processing (WUT:2018-KF-1,2018-KF-7). The authors thank Prof. Ali Javey of the Universityof California, Berkeley and Prof. Xudong Wang of the University ofWisconsin-Madison for strong support and stimulating discussions. Conflict of Interest The authors declare no conflict of interest. Keywords dual-ion full batteries, microwave, nanosheets, sodium/potassium-ionstorage, soft carbon Received: October 21, 2018 Revised: November 26, 2018 Published online: ( [1] P. Lu, Y. Sun, H. X iang, X. Liang, Y. Yu, Adv. Energy Mater. 2018, 8, 1702434. ) ( [2] M. Z . Jacobson, M. A. Delucchi, E n ergy Policy 2011, 39, 1154. ) [3] X. Yao, Z. Zhu,Q. Li, X. Wang, X. Xu, J. Meng, W. Ren, X. Zhang,Y. Huang, L. Mai, ACS Appl. Mater. Interfaces 2018, 10, 10022. [4] Y. Jiang, Y. Wu, Y. Chen, Z. Qi, J. Shi, L. Gu, Y. Yu, Small 2018, 14,1703471. ( [5] M. Wang, Z. Yang, W.Li, L. Gu,Y. Yu, Small 2016, 12, 2 559. ) ( [6] P. Barpanda, G. Oyama, S . N i shimura, S . C . C h ung, A. Ya m ada, Nat. Commun. 2014, 5, 4358. ) ( [7] M. D. Slater, D. Kim, E. Lee, C. S. Johnson, Adv. Funct. Mater. 2013, 23,947. ) ( [8] S. Komaba, T. Hasegawa, M . D a hbi, K . K u bota, Electrochem. Commun.2 0 15,60,172. ) ( [9] 1. W. Choi, D. A urbach, Nat. Rev. Mater. 20 1 6, 1,160 1 3. ) ( [10] N. Yabuuchi, K. Kubota, M. Dahbi, S. Komaba, Chem. R ev. 2 014, 114,11636. ) ( [11] s.-W. Kim, D.- H. Seo, X . M a, G. C e der, K . Kang, Adv. Energy Mater. 2012, 2 , 710. ) ( [12] J . Jiang, J . R. Dahn, E lectrochim. A c ta 2004, 49 , 45 9 9. ) ( [13] K. Ozawa, Solid S tate l onics 1994, 69, 2 12. ) ( [14] M. M . Doeff, Y. Ma, S . J. Visco, L . C. De Jonghe,J. Electrochem. Soc. 1993, 140, L169. ) ( [15] Z. Wang, S. M . Selbach, T. Grande, RSC Adv. 2014, 4, 4069. ) ( [16] Y.Okamoto,J. P h ys. Chem. C 2014, 118, 1 6 . ) ( [17] D. P . DiVincenzo, E. J. Mele, Phys. Rev. B 19 8 5, 32, 2538. ) ( [18] J . Sangster, J. Phase E quilib. D iffus. 2007,2 8 ,571. ) ( [19] P . Ge, M . Fouletier, Solid State lonics 1988, 28-30, 11 72. ) ( [20] W. Luo, Z. Jian, Z. Xing, W. Wang,C . B o mmier, M. M. L erner, X. J i, ACS Cent. Sci.2015, 1,516. ) ( [21] K. Tang, L. Fu, R . J. White, L . Y u, M .-M. T i tirici, M. A ntonietti, J . Maier, Adv. Energy Mater. 2012,2,873. ) ( [22] D. Stevens, J. Dahn,J. Electrochem. Soc. 2000, 1 47,1271. ) ( [23] C. Bommier, D. Mitlin, X. Ji , Prog. M a ter. Sci. 2 0 18, 97 , 17 0 . ) ( [24] D. Stevens, J. Dahn, J. Electrochem. Soc. 2000, 147, 4428. ) ( [25] Y. Cao, L. Xiao, M. L . S ushko, W. W a ng, B. Sch w enzer, J. X i ao, Z. Nie, L . V. Saraf, Z. Yang,J. Liu, Nano Lett. 2012, 1 2,3 7 83. ) ( [26] B . Zhang, C . M . Ghimbeu, C. Labe r ty, C. Vix-Guterl, J. M. T ara s con, Adv. Energy Mater. 2016,6, 1 501588. ) ( [27] H. H ou, X. Qiu, W. Wei, Y.Zhang, X. J i , A dv. Ene r gy Mater. 2017 , 7, 1602898. ) ( [28] Z .Jian, C . B ommier, L. Luo, Z. Li , W . Wang, C. Wang, P. A. Greaney, X . Ji , Chem. Mater . 2017 , 29,2314. ) ( [29] B. Cao , H. L iu, B. Xu,Y. Lei, X. Chen, H. Song,J. Mater. C hem. A 2016, 4, 6472. ) ( [30] D. A. Stevens, j. R. Dahn,J. Electrochem. S o c. 2 0 01, 14 8 , A803. ) ( [3 1 ] V. G. Pol, E. Lee, D. Zhou, F. Dogan, J . M . C alderon-Moreno, C. S. Johnson, Electrochim. Acta 2014, 127,61. ) ( [32] R . Alcantara, J. M. Jimenez-Mateos, P. Lavela, J.L. Tirado, Electro- chem. Commun. 2001, 3 , 639. ) ( [33] V. Augustyn, P. Simon, B. D u nn, Energy Environ. Sci . 2014, 7,1 5 97. ) ( [34] V. Augustyn, J. Come, M. A . Lowe, J. W . K im, P . L . T a berna, S . H. Tolbert, H. D. Abruna, P. Simon, B. Dunn, Nat. M ater. 2013, 12,518. ) ( [35] T. Brezesinski,J. Wang, S. H. Tolbert, B. Dunn, N at. M a ter. 2 0 10, 9,14 6 . ) ( [36] P. S imon,Y. Gogotsi, B. D u nn, Science 2014, 343, 1210. ) ( [37] X. Wang, K . Han, D . Qin, Q. Li, C. Wang, C. Niu, L. Mai, Nanoscale 2017, 9 , 1 8216. ) ( [38] L. Fan, Q. L iu, S . Chen, Z. Xu, B . L u , A d v. E n ergy Mater. 20 1 7, 7, 1602778. ) ( [39] D. A. Jones, T . L elyveld, S. M a vrofidis, S . K i ngman, N. M il e s, Resour., Conserv. Recycl. 2002, 34, 75. ) ( [40] M. I . L orfa-Bastarrachea, W. H errera-Kao, J.V. C a uich-Rodriguez, J . M. C ervantes-Uc, H. Va z quez-Torres, A. A vi l a-Ortega, J. Therm.Anal. Calorim. 2011, 1 04, 737. ) ( [41] F. Barzegar , A . Bell o , D. Momodu, M. J . Madito , J. Dangbegnon, N . Manyala, J. P ower Sources 2016, 309, 245. ) ( [ 42] M. S e villa, A . B . Fuertes, E nergy Environ. Sci. 2 011,4,1765 . ) ( [43] X. Hu, M . R a dosz, K. A . C y chosz, M. Th o m mes, Environ. Sci. Technol. 2011, 45, 7 068. ) ( [44] A. Sadezky, H . M uckenhuber, H. Gro t he, R. N ie s sner, U. P oschl, Carbon 2005, 43,1731. ) ( [45] E. M. Lotfabad, P . K alisvaart , A. Kohandehghan, D. Ka rpuzov, D. M itlin, J. Mater. Chem. A 2014, 2 , 19685. ) ( [46] H. Lindstrom, S. Sodergren, A. Solbrand, H. Rensmo, J . Hjelm,A. Hagfeldt, S.-E. Lindquist, J. Phys. Chem. B 1997, 1 0 1,7717. ) ( [47] T . C. Liu, W. Pell, B. Conway, S. Roberson,J. E l ectrochem. Soc. 19 9 8, 145, 1882. ) ( [48]J. Ding, H. Wang, Z. L i, A. Kohandehghan, K. Cui, Z. Xu, B. Zahiri, X . Tan , E. M . Lotfabad , B. C. Olsen, ACS Nano 2013, 7, 1 1004. ) ( [49] E. M. L otfabad, J. Ding, K. Cui, A. Kohandehghan, W. P. Ka l isvaart, M . Hazelton, D . Mitlin, ACS N a no 2014, 8, 7115. ) ( [50] S. Chen,J. Wang, L . Fan, R. M a, E. Z hang, Q . Liu, B. Lu, Adv. E nergy Mater. 2018, 8, 1800140. ) ( [51] M. Y oshio, S . K ugino, N. Dimov,J. P o wer Sources 20 0 6, 15 3 , 37 5 . ) ( [52] U. K asavajjula, C. Wang, A. J. Appleby,J. Power Sources 2007, 163,1003. ) DOI: aenm.( of )◎ WILEY-VCH Verlag GmbH & Co. KGaA, WeinheimAdv. Energy Mater. ( of)@ WILEY-VCH Verlag GmbH & Co. KGaA, WeinheimAdv. Energy Mater.
确定
还剩7页未读,是否继续阅读?

北京祥鹄科技发展有限公司为您提供《软碳多孔纳米片中微波水热合成方法检测方案(微波合成仪)》,该方案主要用于太阳能中微波水热合成方法检测,参考标准--,《软碳多孔纳米片中微波水热合成方法检测方案(微波合成仪)》用到的仪器有
相关方案
更多