


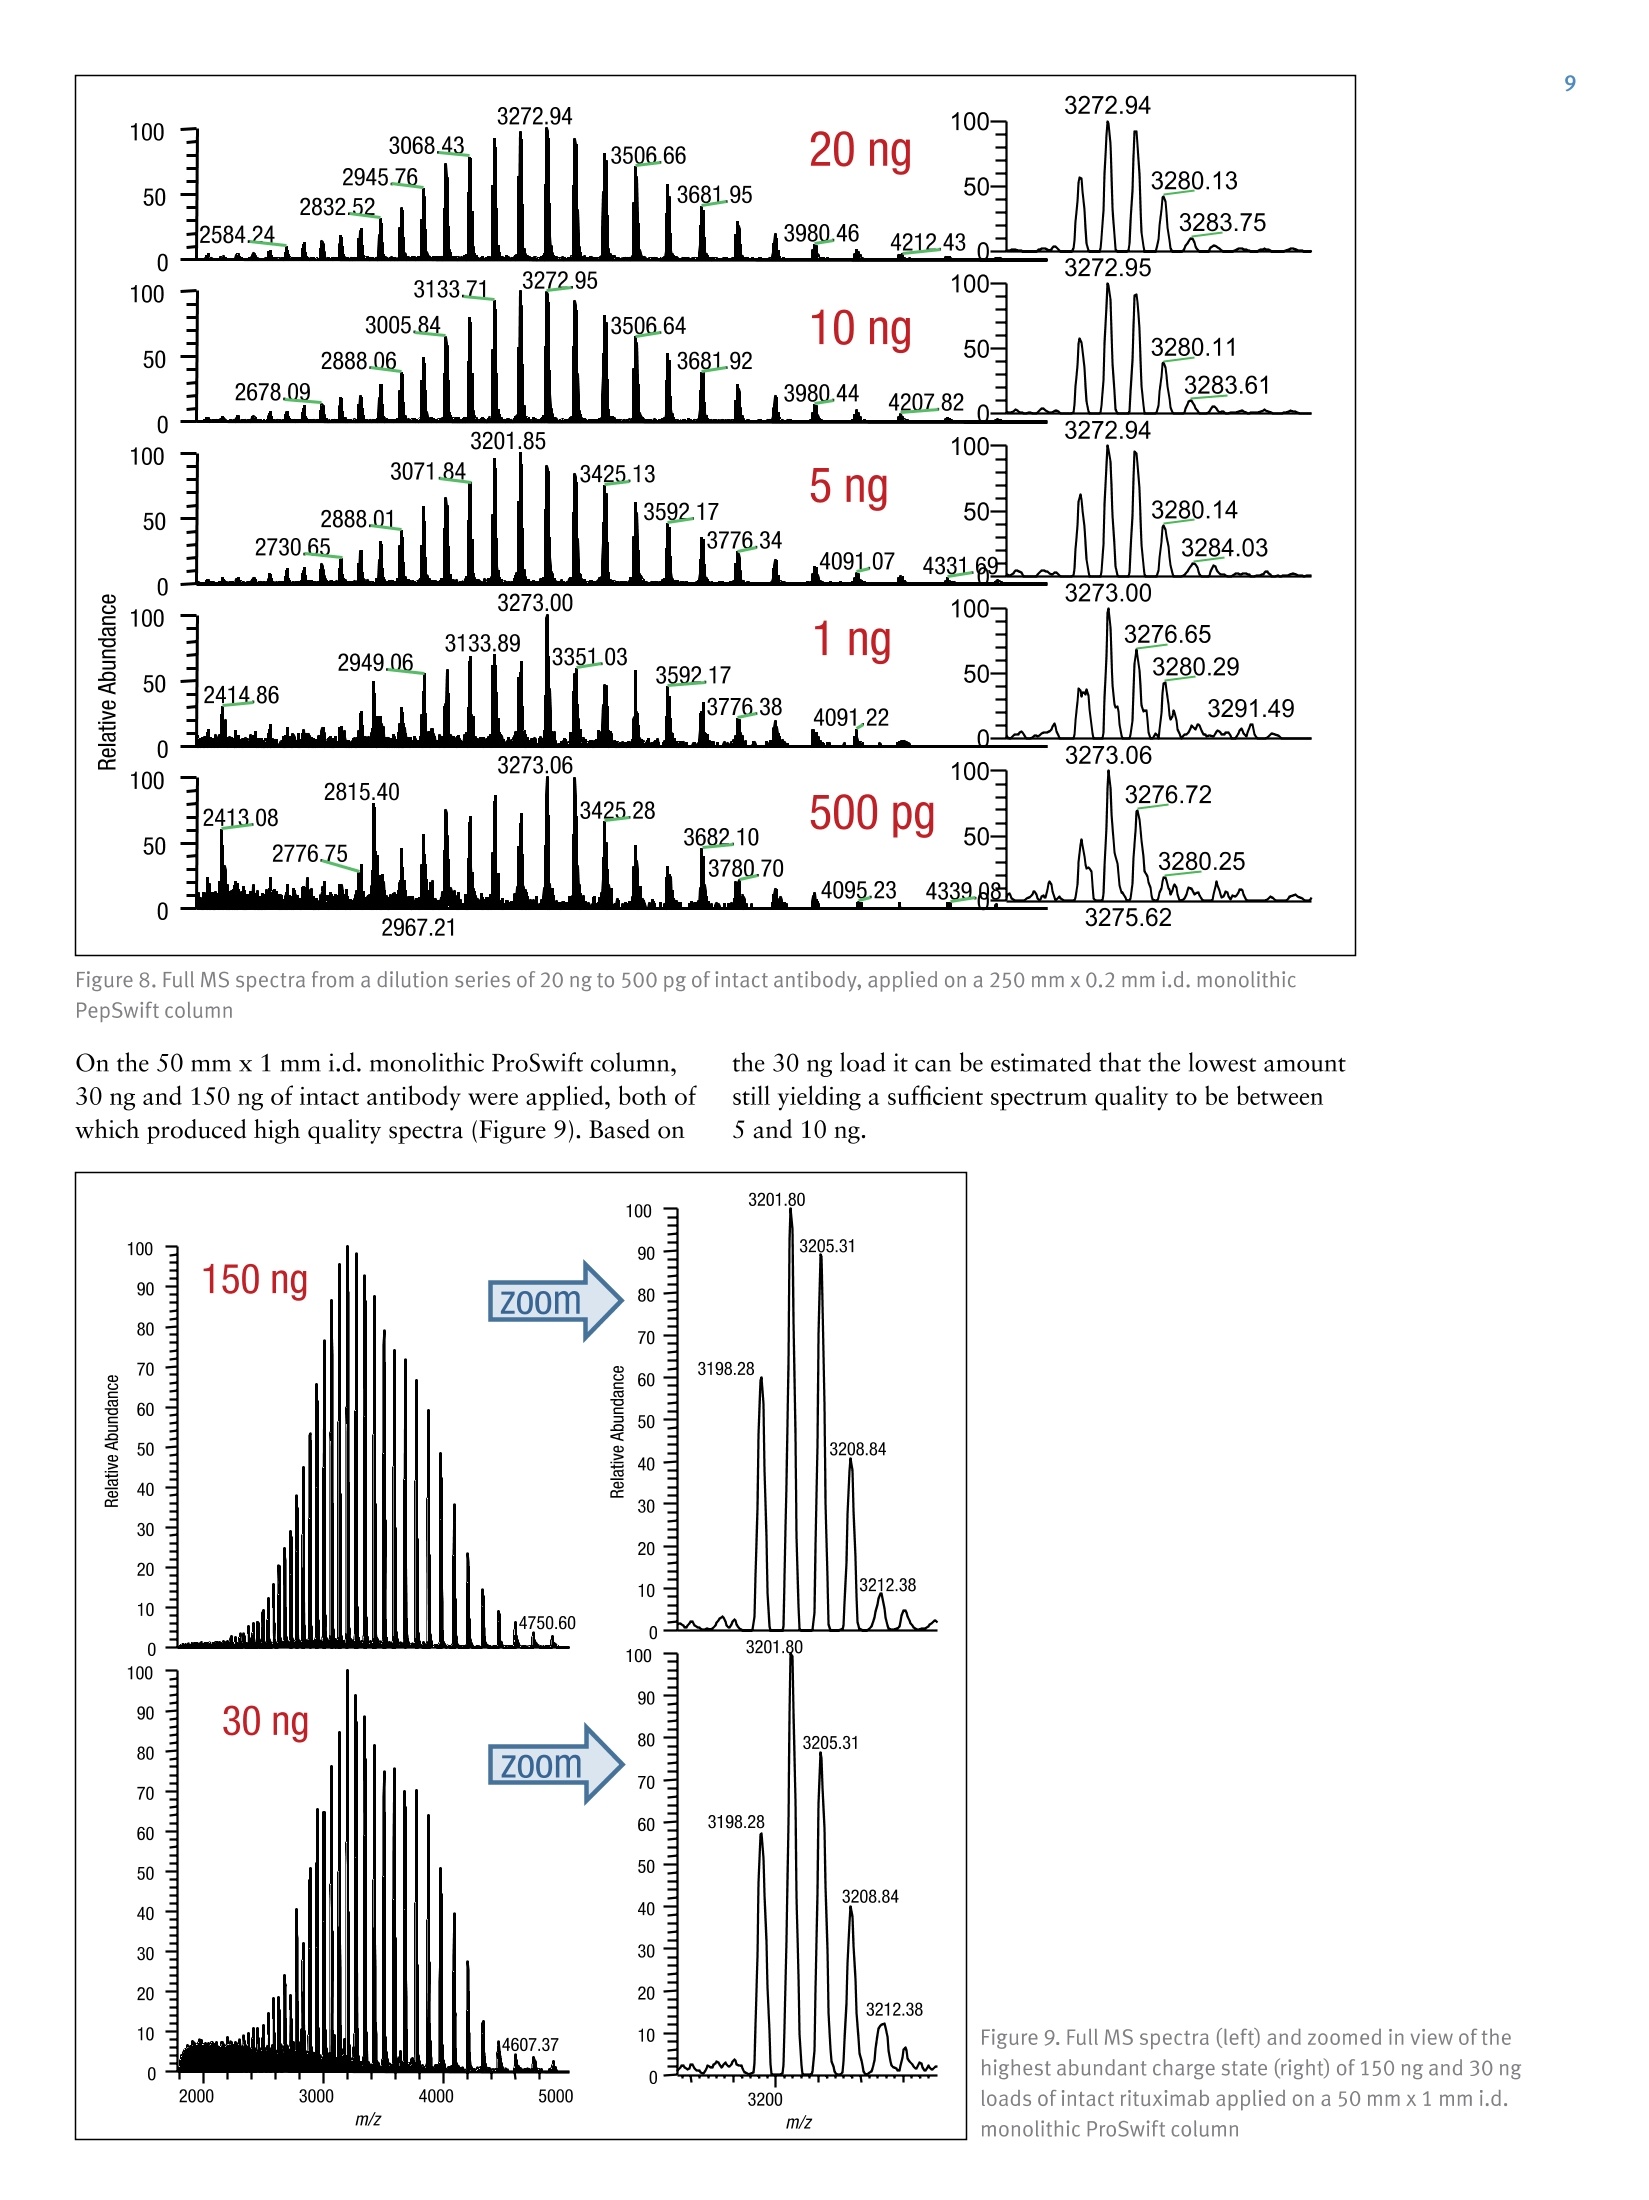
In this study, a workflow is presented that combines fast chromatography, using two sizes of monolithic columns,and high resolution Orbitrap mass spectrometry of intact,as well as reduced, rituximab, sequence verification by AIF,and multiplexed HCD top-down fragmentation,supplemented by a bottom-up approach.
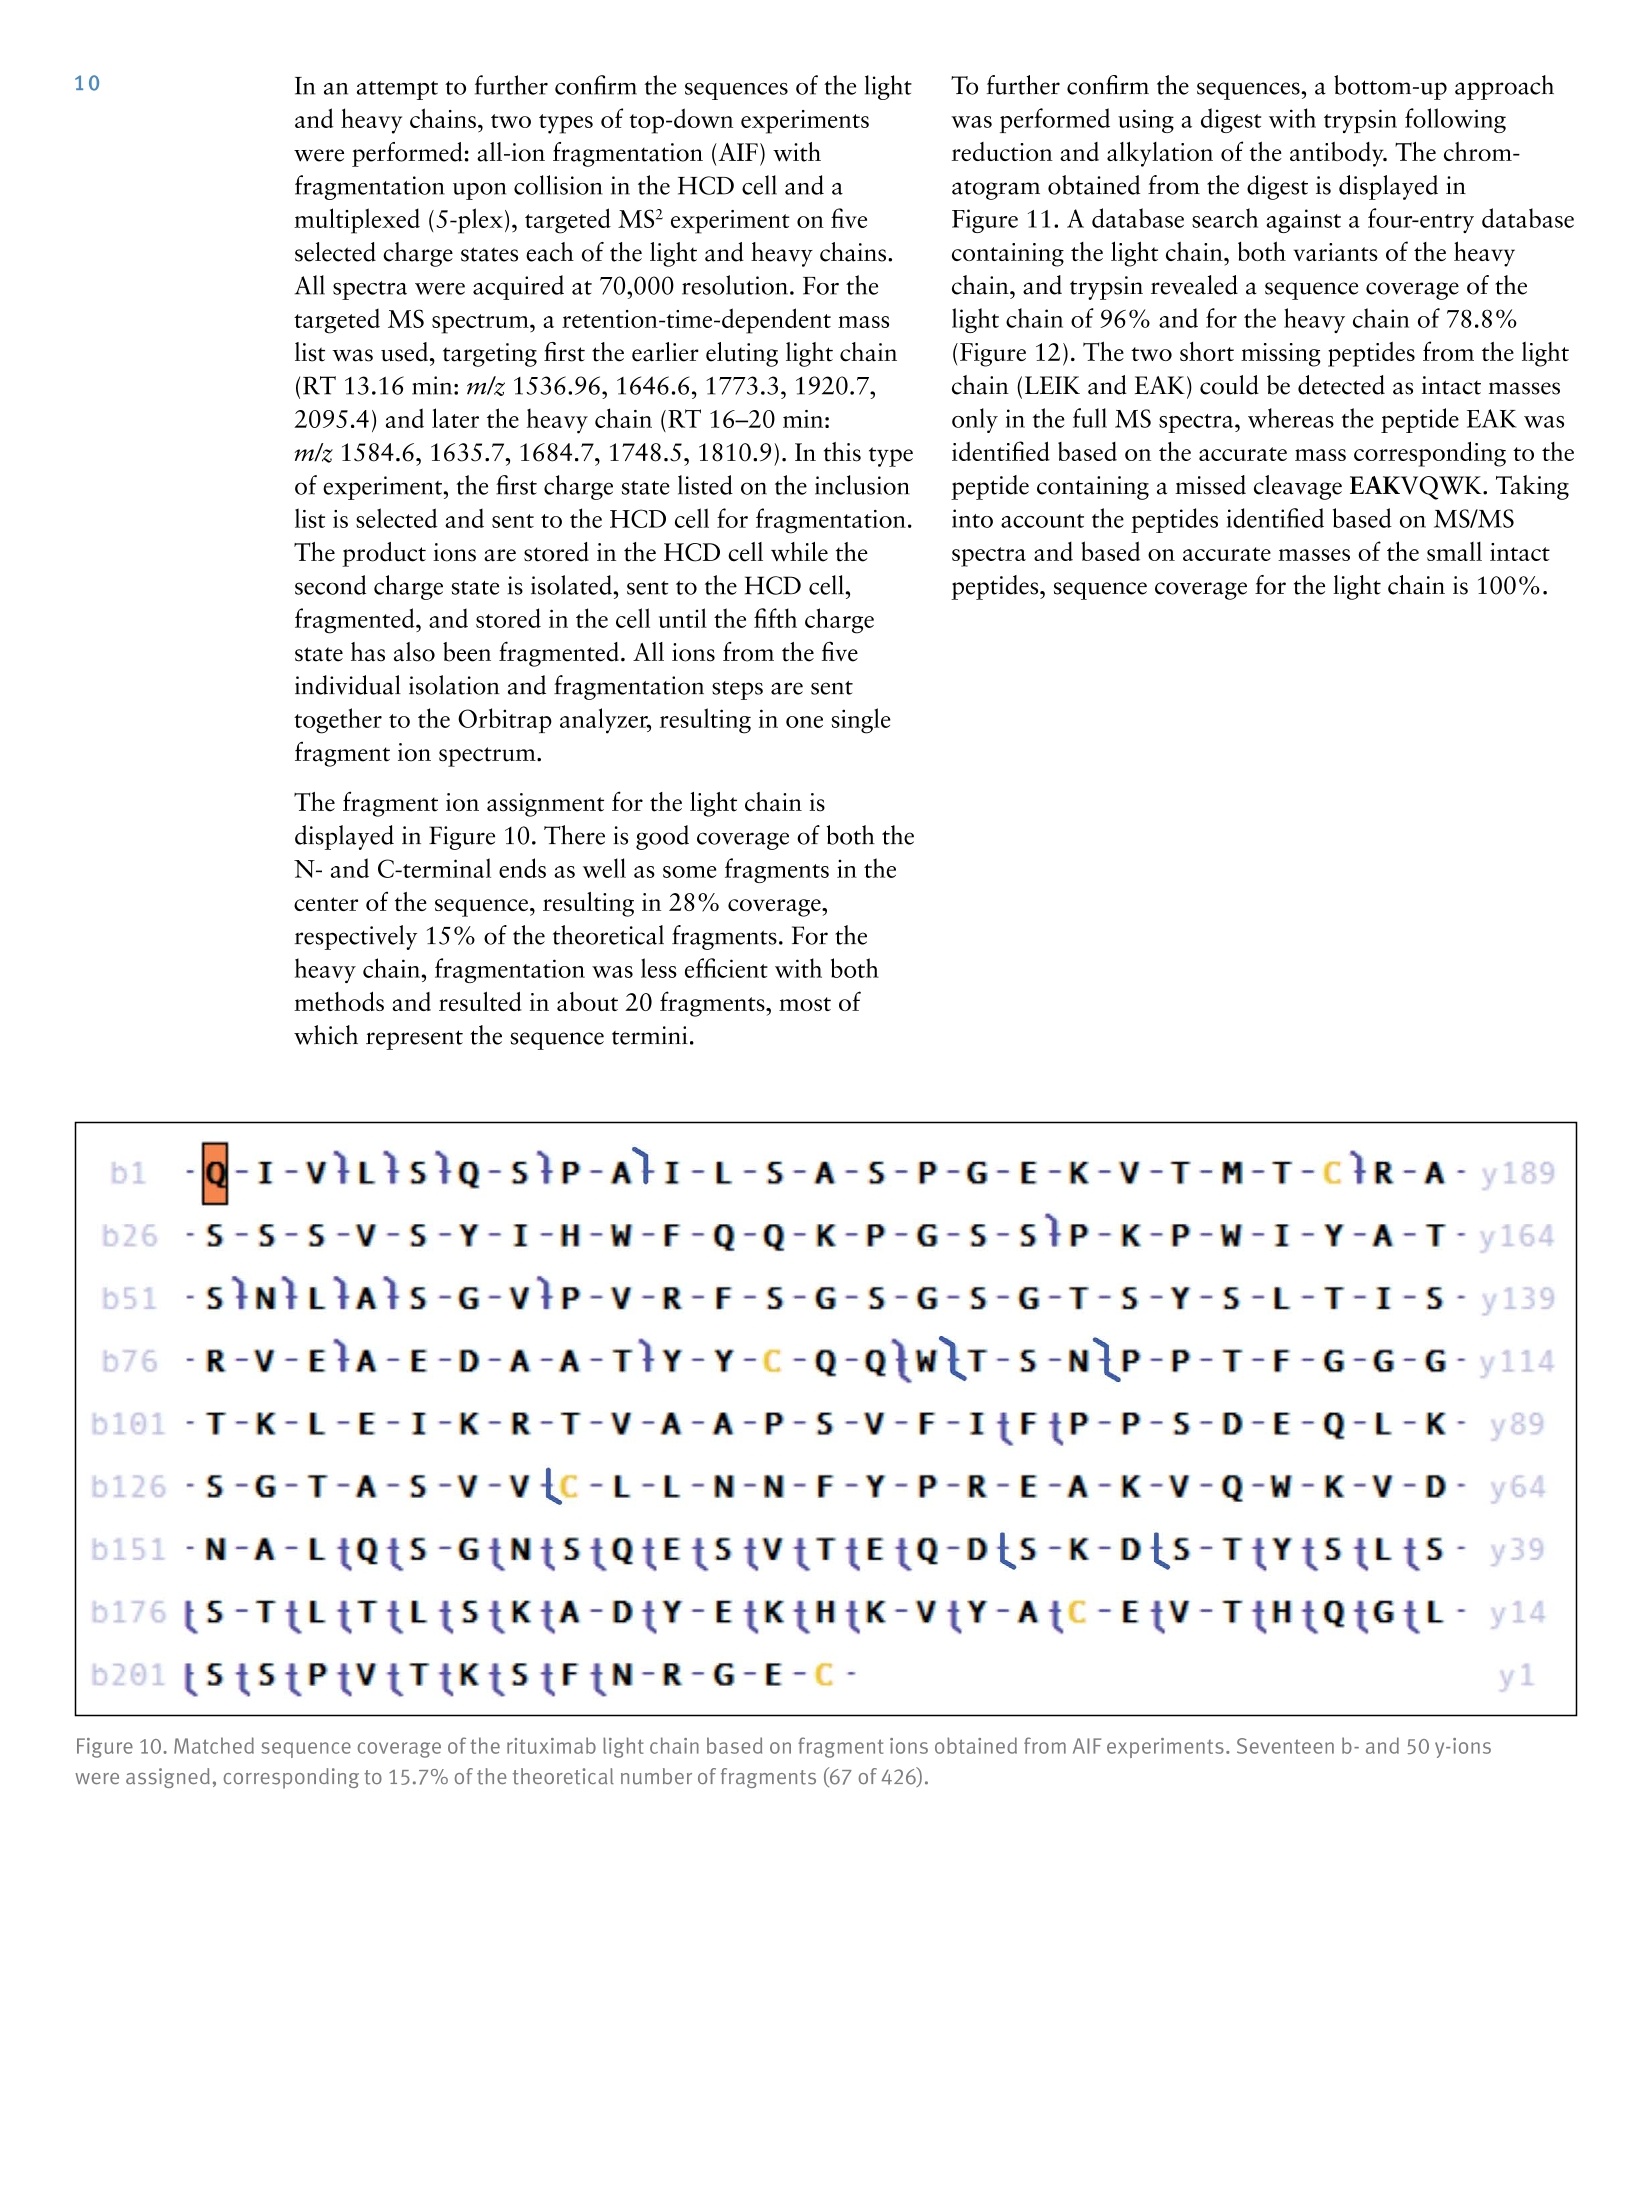
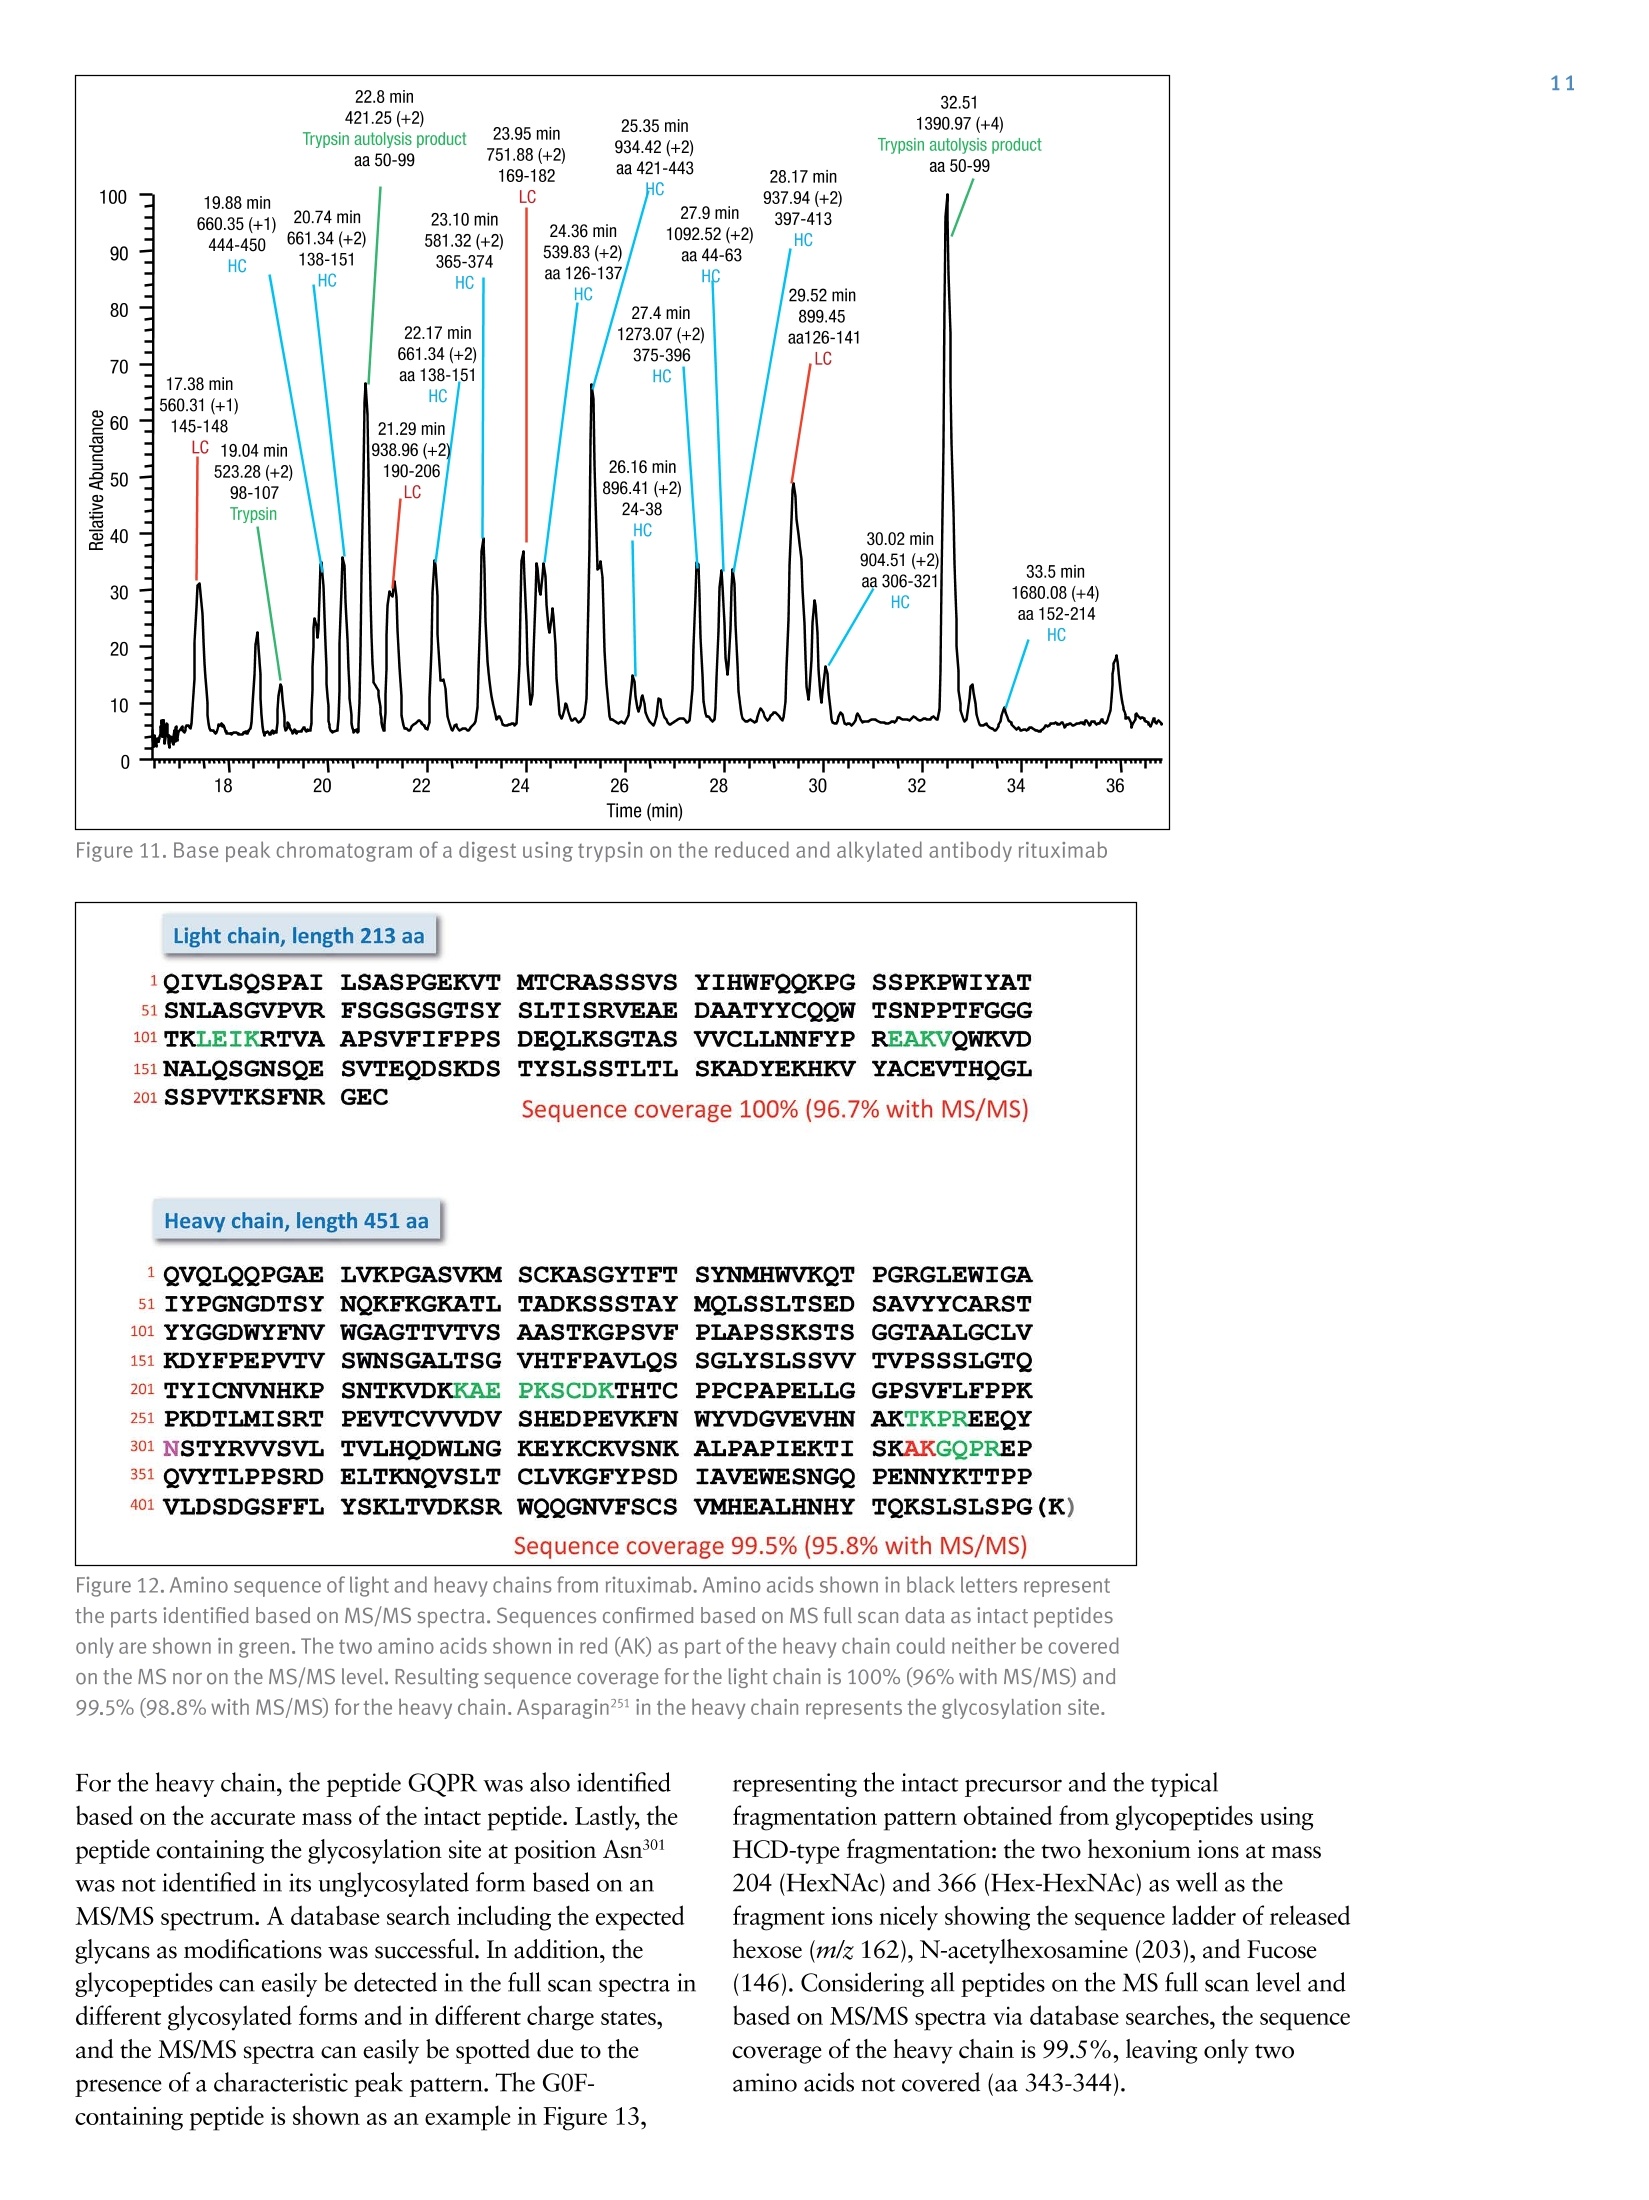
方案详情

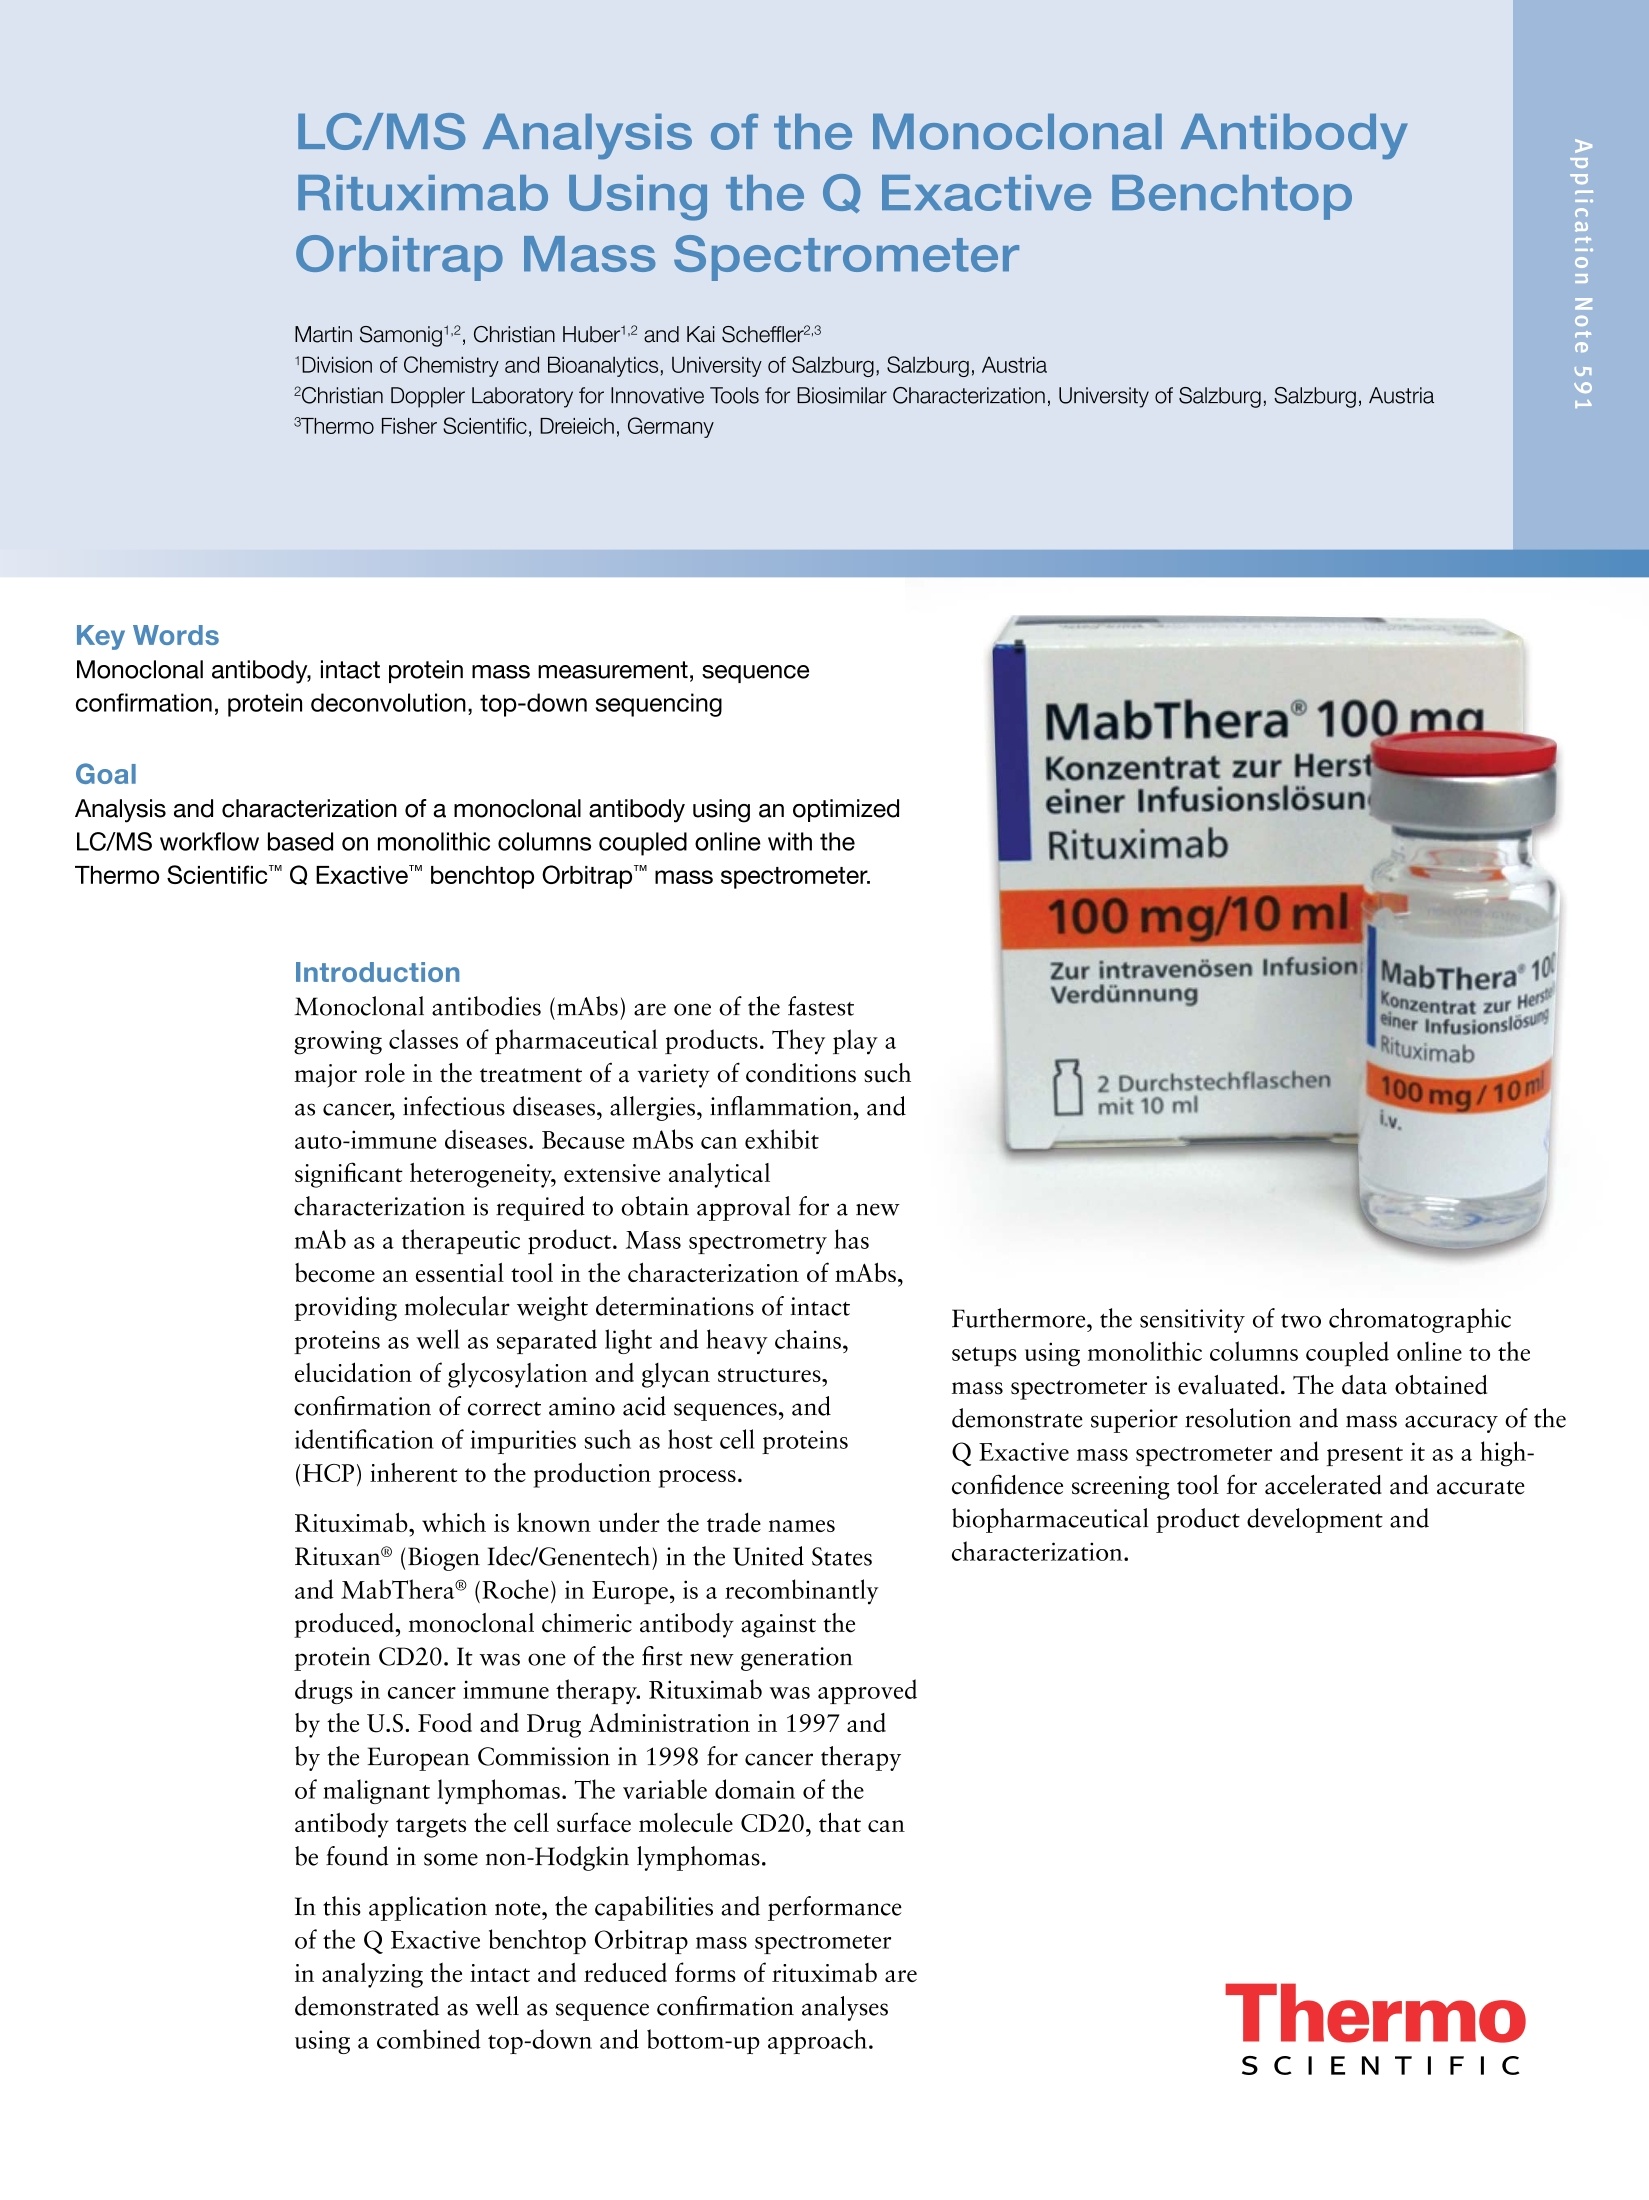
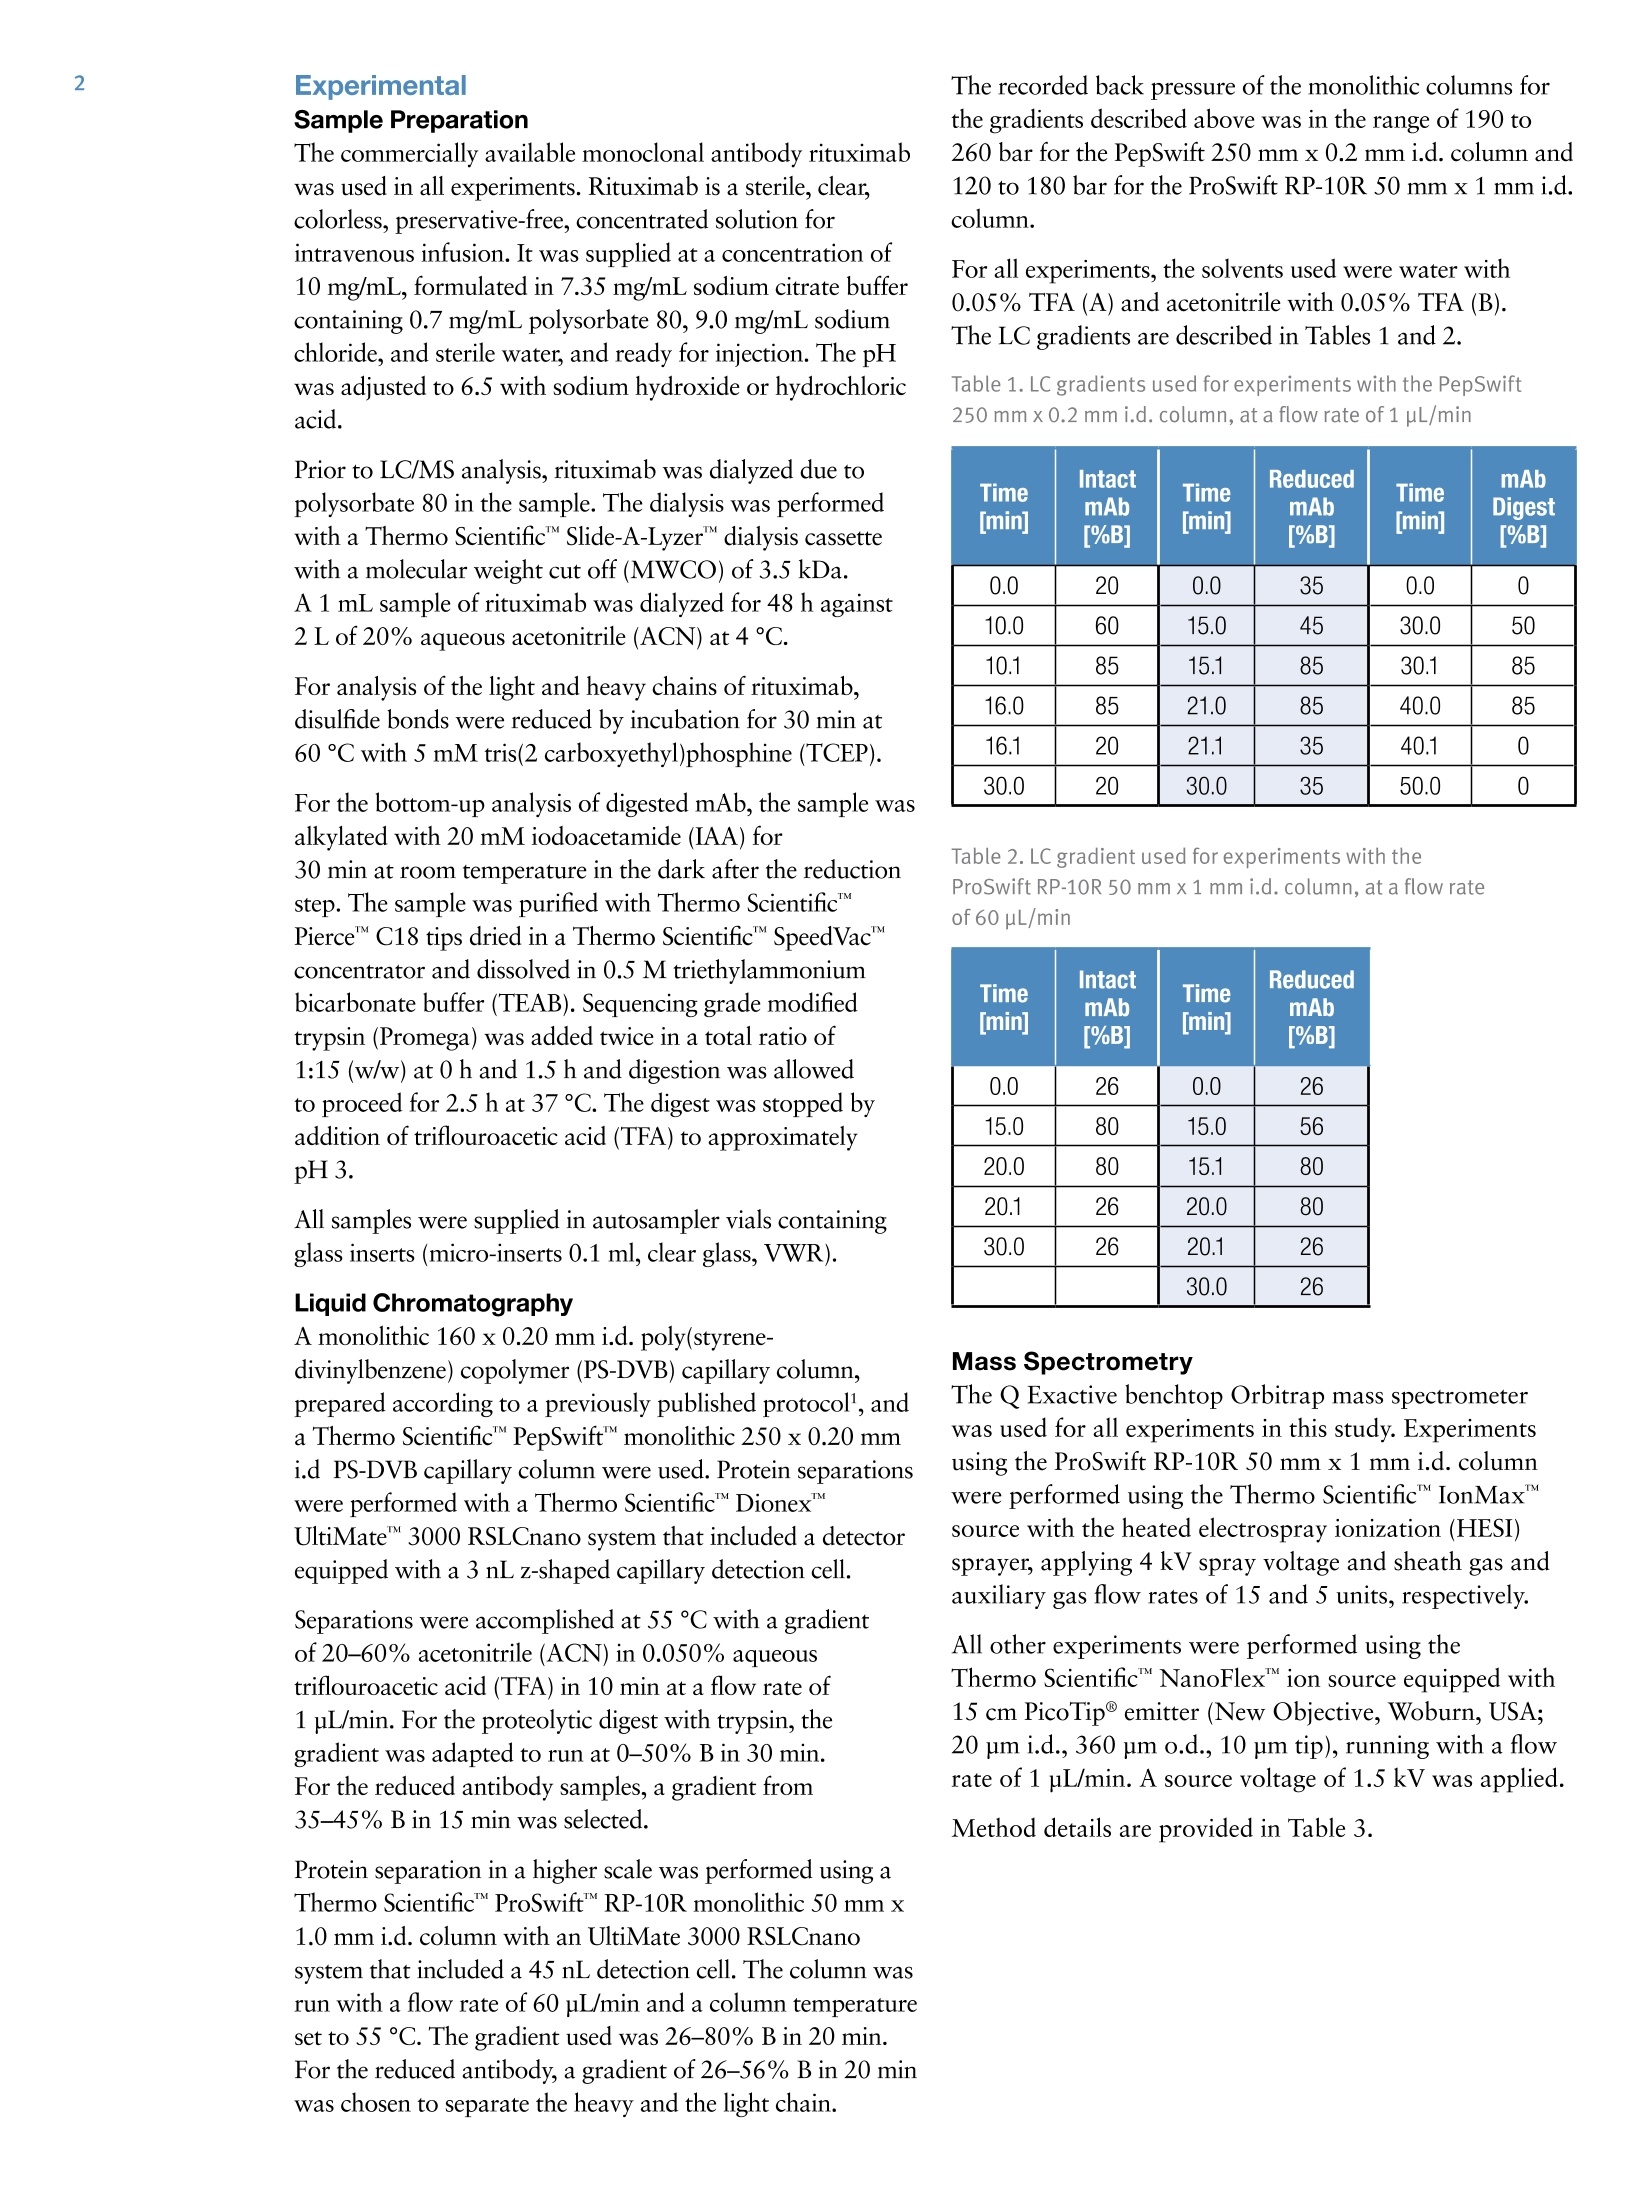
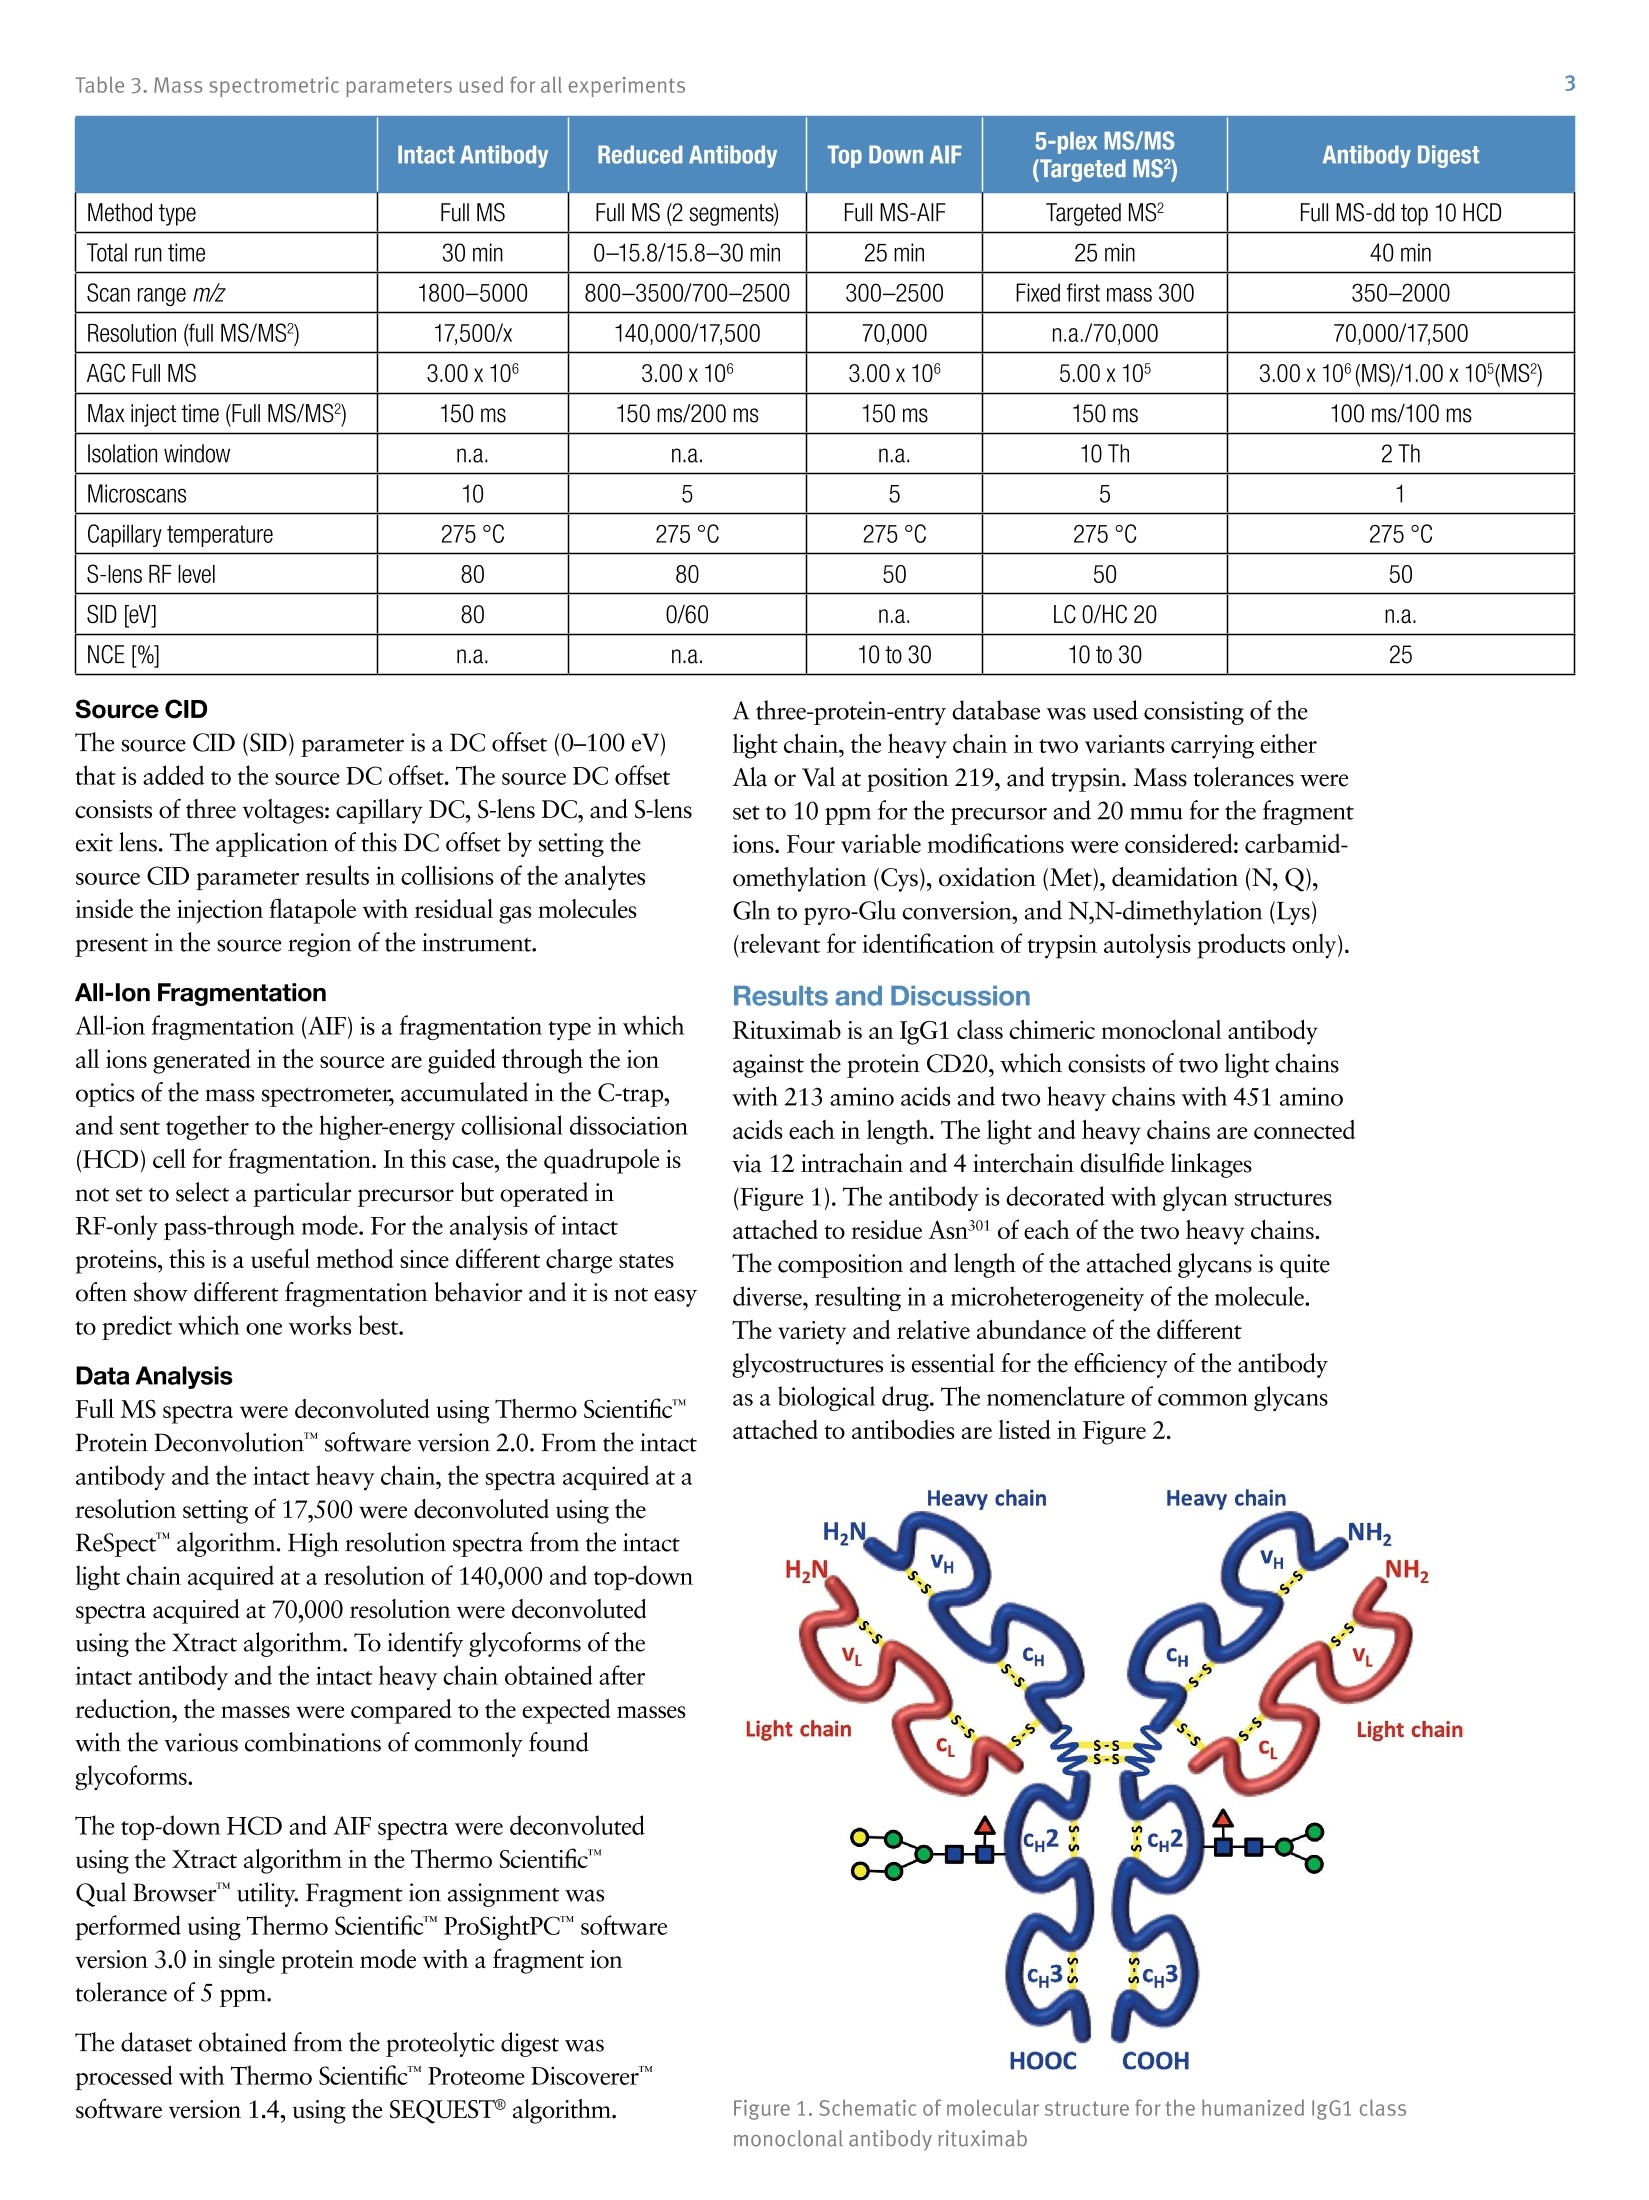
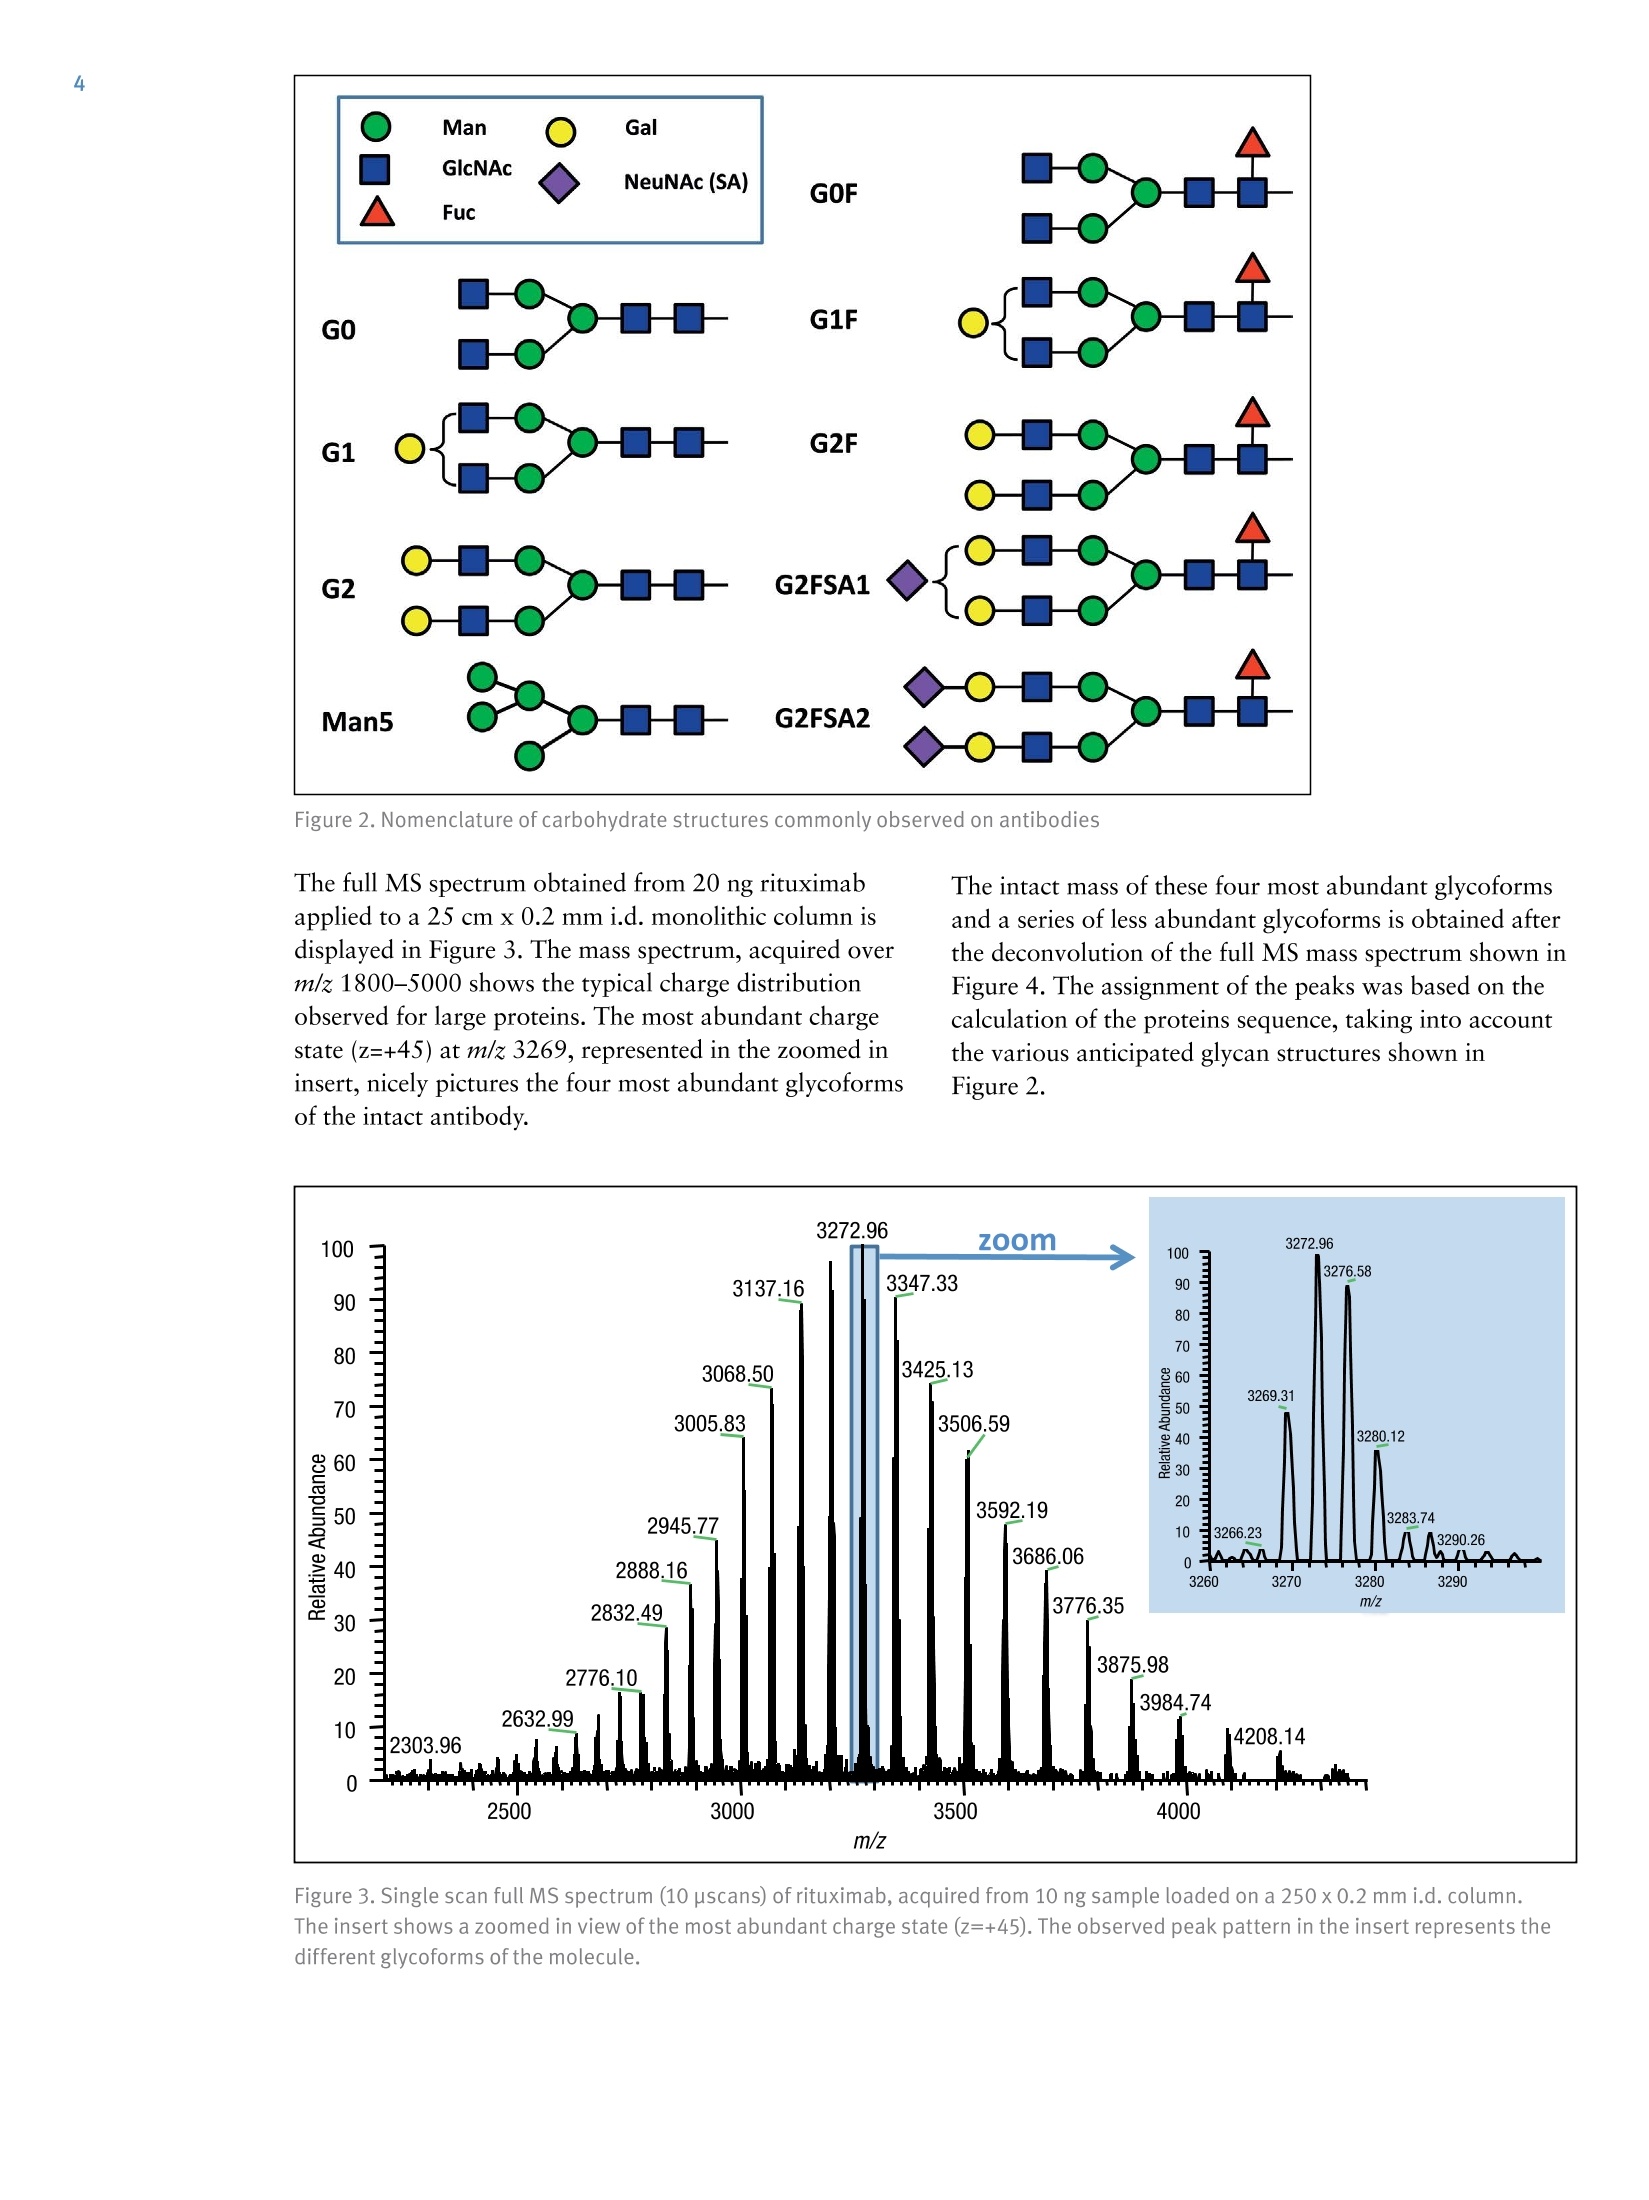
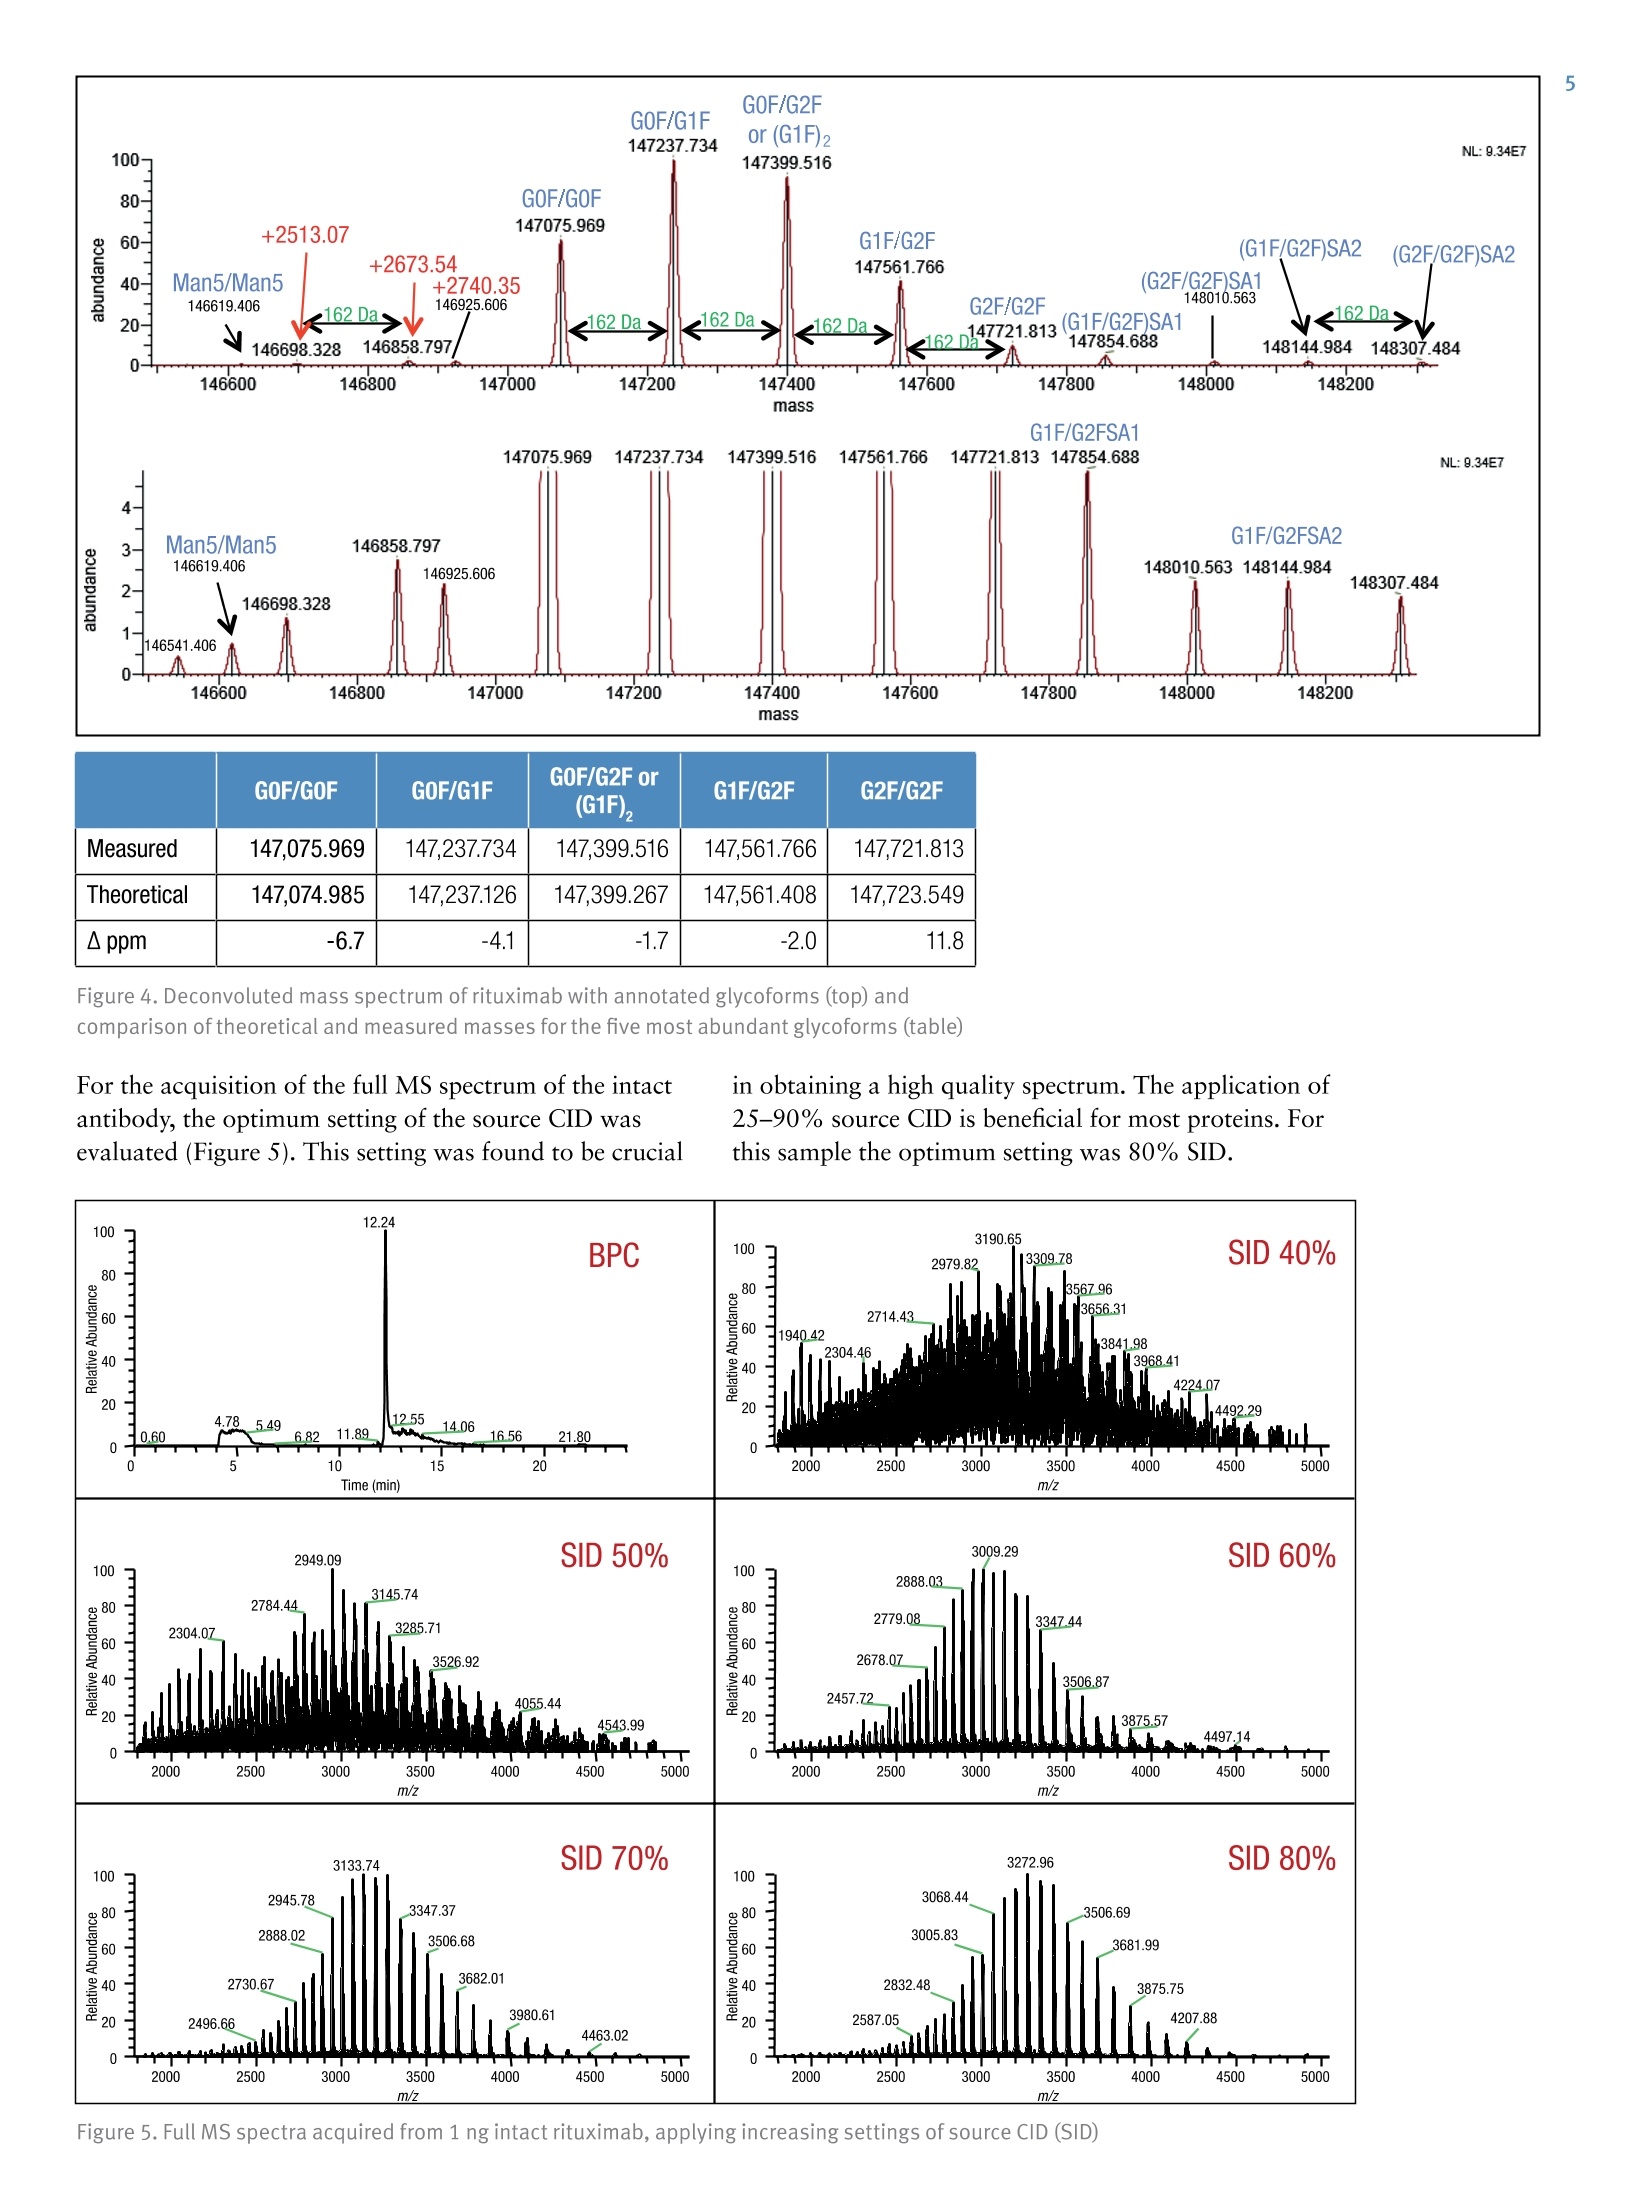
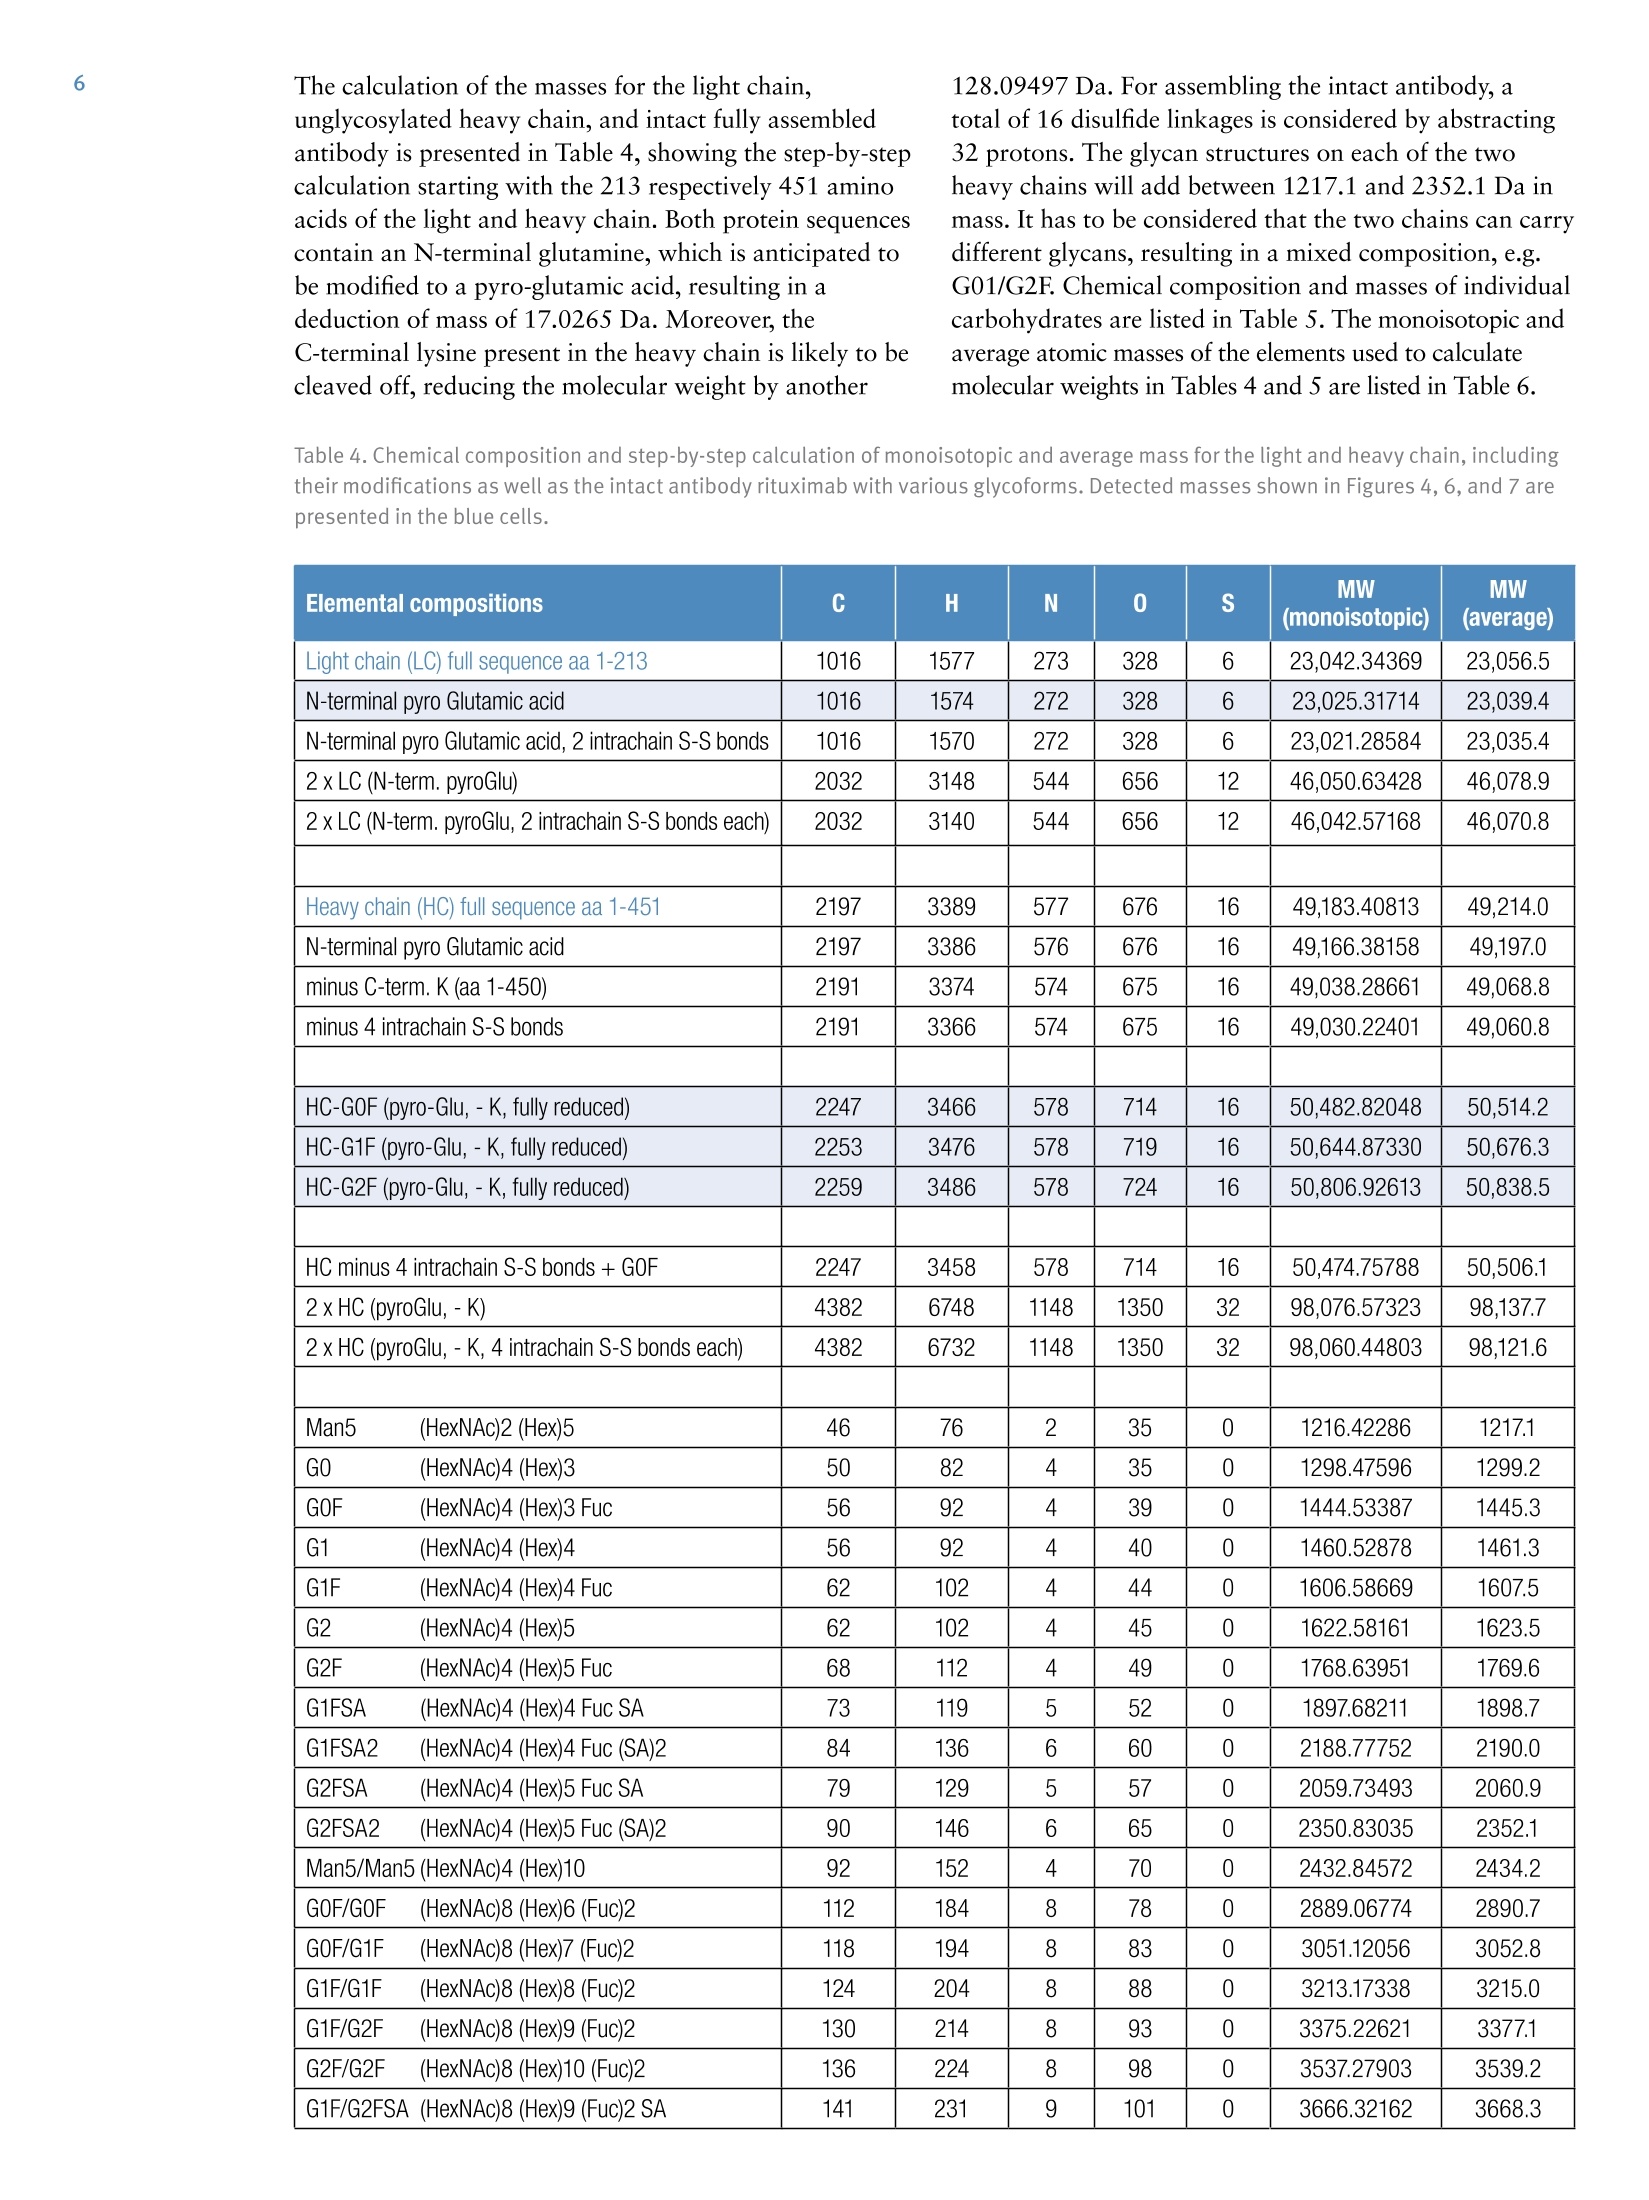
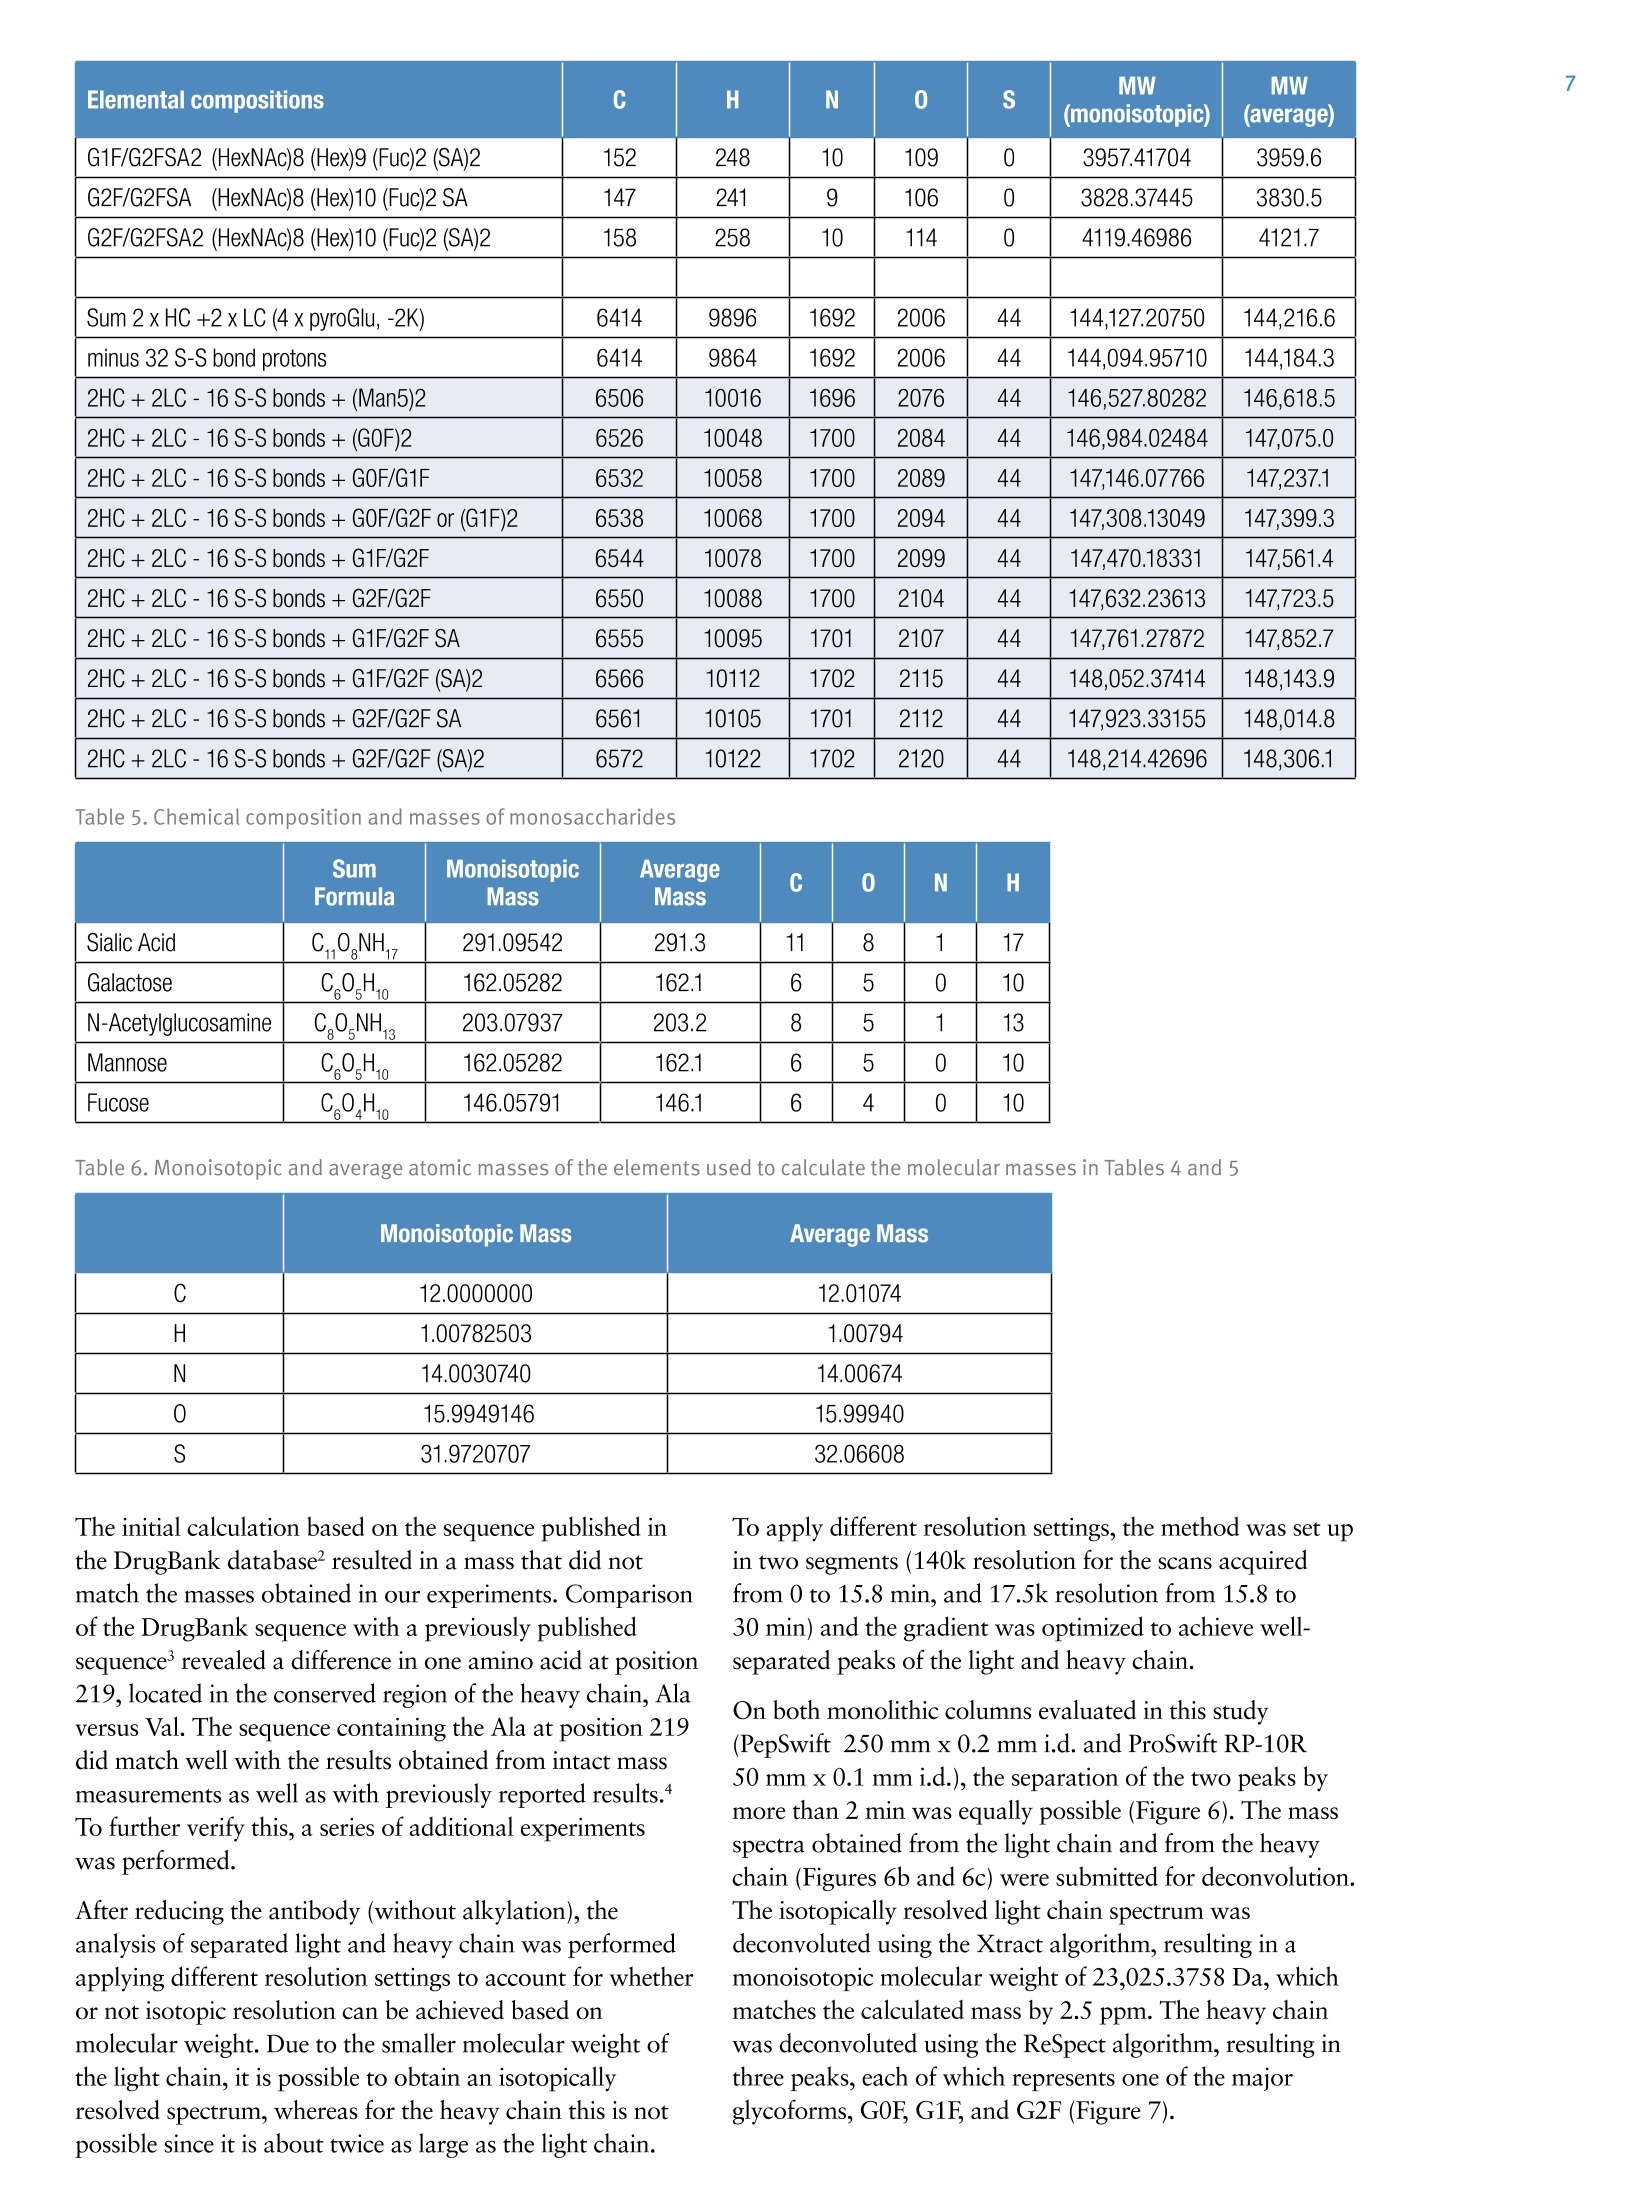
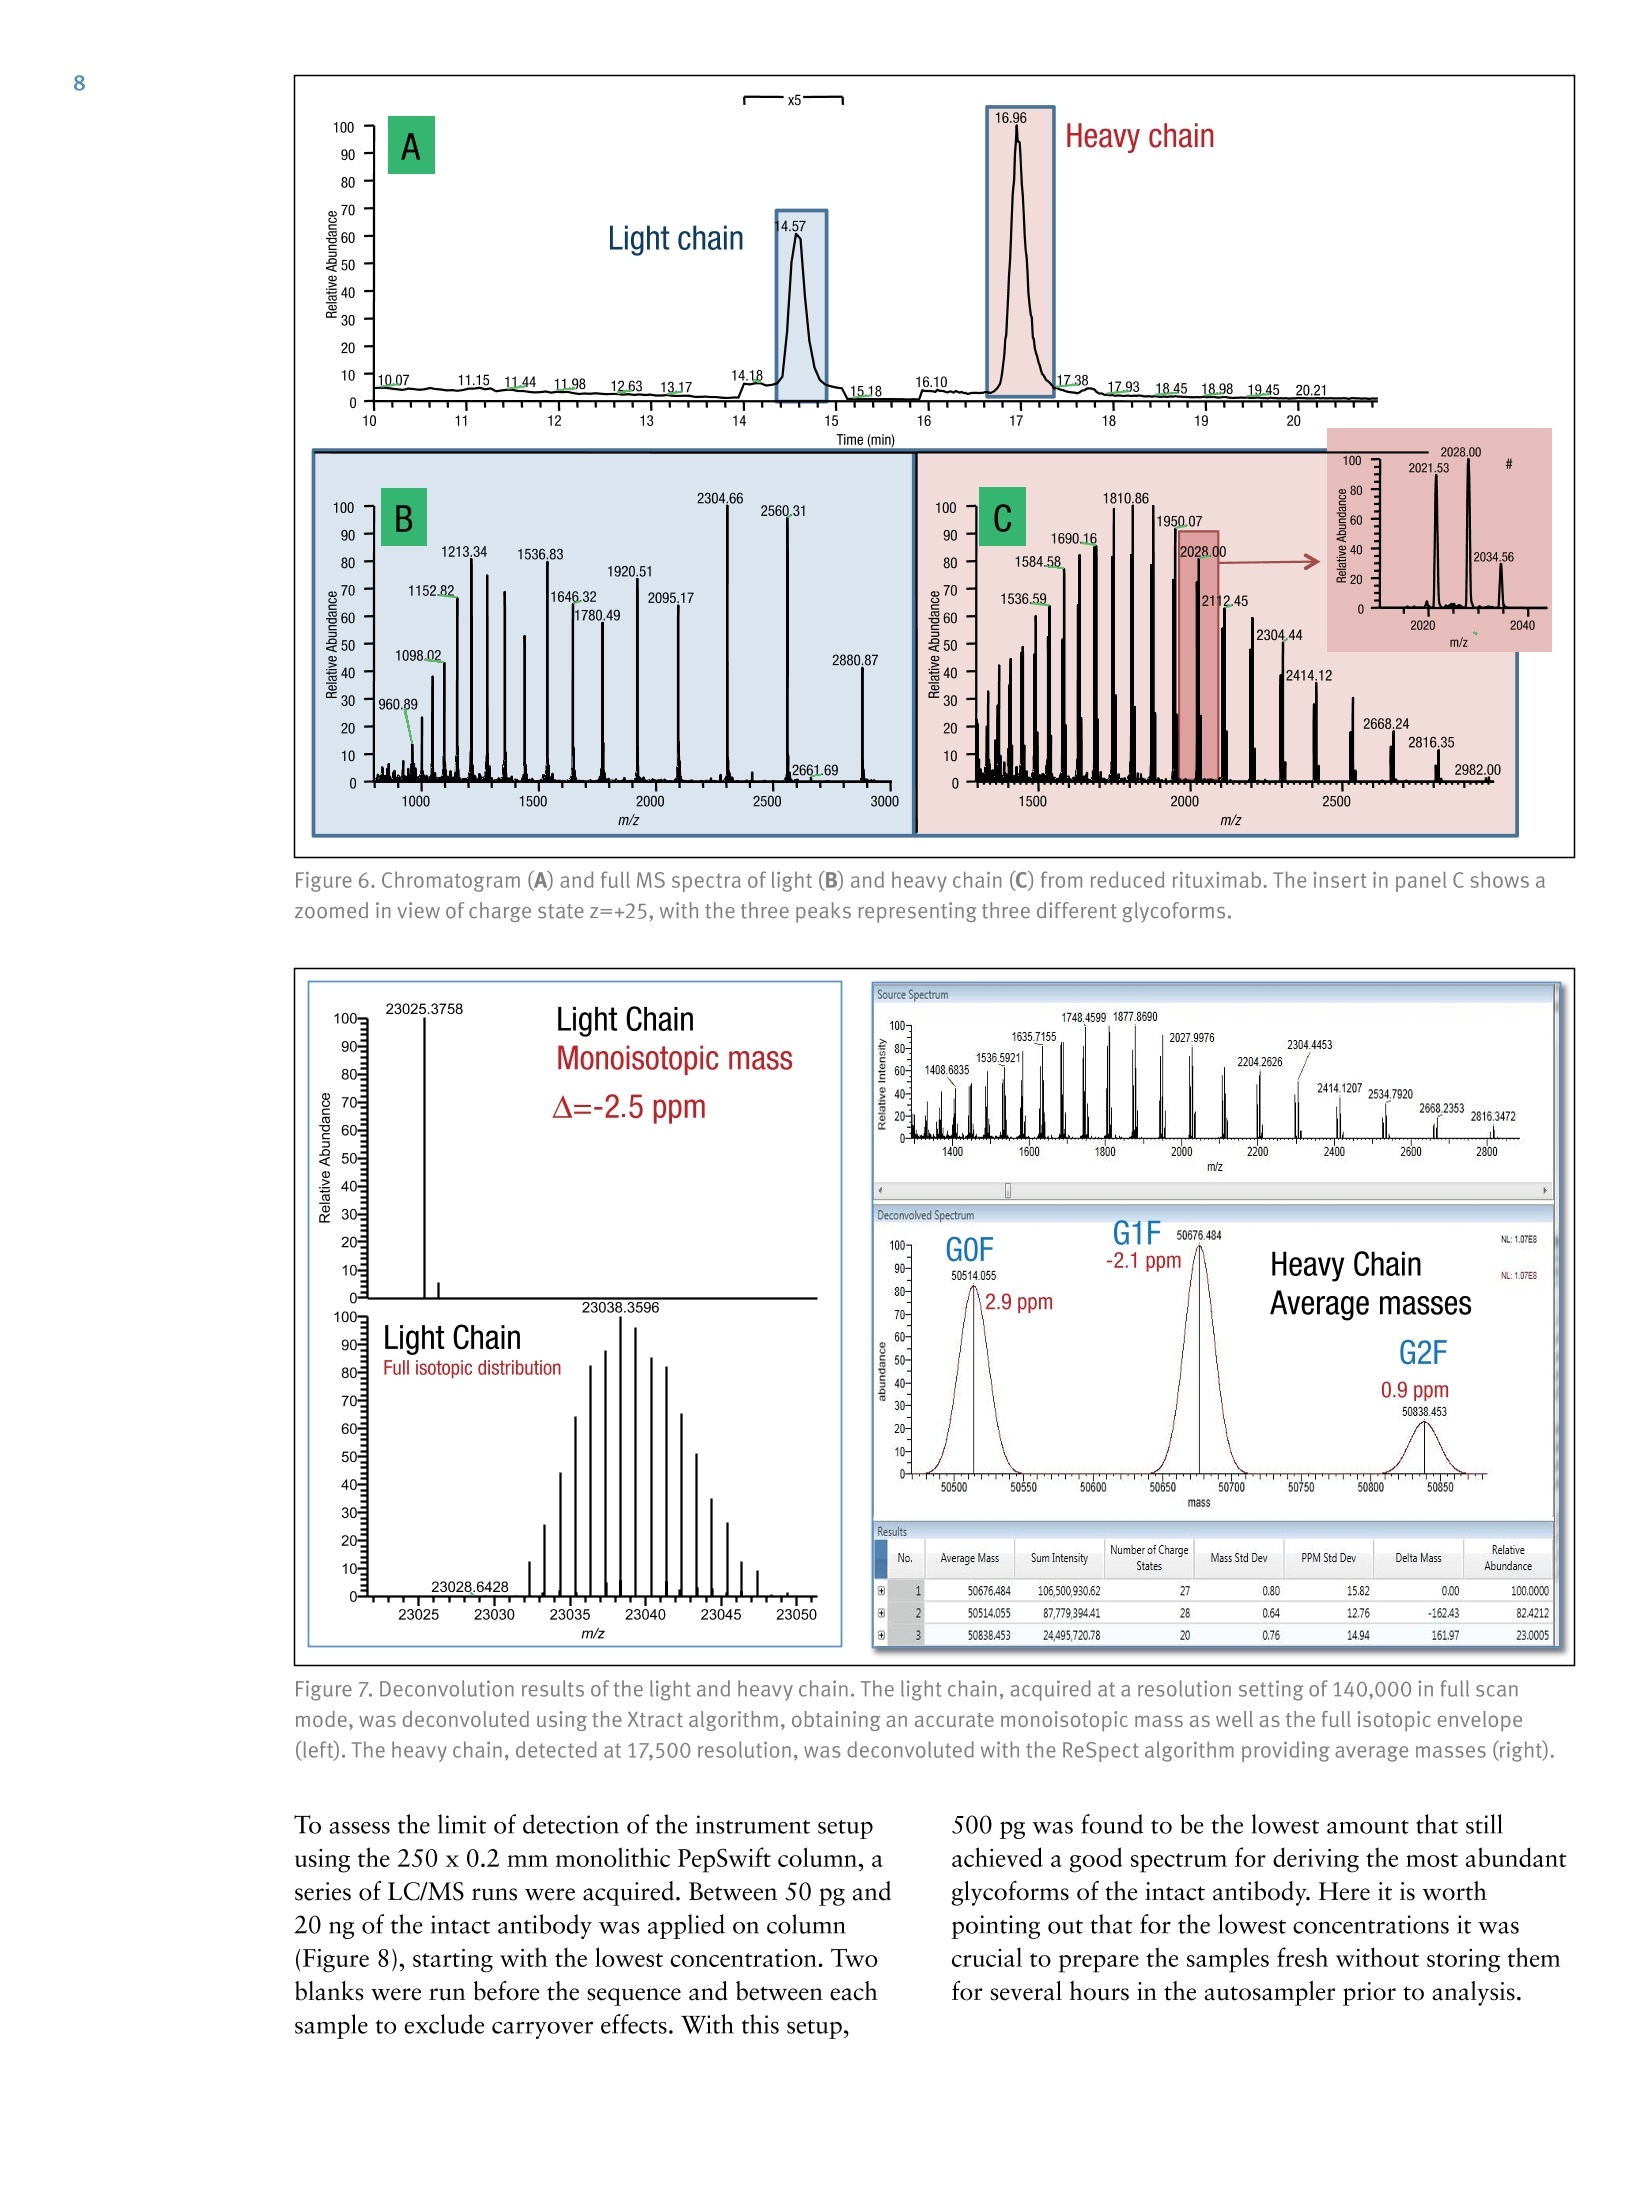
ExperimentalSample Preparation2 Table 3. Mass spectrometric parameters used for all experiments3 S CIENTIFICPart of Thermo Fisher ScientificAN63918_E 08/16S LC/MS Analysis of the Monoclonal AntibodyRituximab Using the Q Exactive BenchtopOrbitrap Mass Spectrometer Martin Samonig12, Christian Huber12 and Kai Scheffler2.3 1Division of Chemistry and Bioanalytics,University of Salzburg, Salzburg, Austria 2Christian Doppler Laboratory for Innovative Tools for Biosimilar Characterization, University of Salzburg, Salzburg, AustriasThermo Fisher Scientific, Dreieich, Germany Analysis and characterization of a monoclonal antibody using an optimizedLC/MS workflow based on monolithic columns coupled online with theThermo ScientificQ Exactivebenchtop Orbitrapmass spectrometer. Introduction Monoclonal antibodies (mAbs) are one of the fastestgrowing classes of pharmaceutical products. They play amajor role in the treatment of a variety of conditions suchas cancer, infectious diseases, allergies, inflammation, andauto-immune diseases. Because mAbs can exhibitsignificant heterogeneity, extensive analyticalcharacterization is required to obtain approval for a newmAb as a therapeutic product. Mass spectrometry hasbecome an essential tool in the characterization of mAbs,providing molecular weight determinations of intactproteins as well as separated light and heavy chains,elucidation of glycosylation and glycan structures,confirmation of correct amino acid sequences, andidentification of impurities such as host cell proteins(HCP) inherent to the production process. Rituximab, which is known under the trade namesRituxan (Biogen Idec/Genentech) in the United Statesand MabThera(Roche) in Europe, is a recombinantlyproduced, monoclonal chimeric antibody against theprotein CD20. It was one of the first new generationdrugs in cancer immune therapy. Rituximab was approvedby the U.S. Food and Drug Administration in 1997 andby the European Commission in 1998 for cancer therapyof malignant lymphomas. The variable domain of theantibody targets the cell surface molecule CD20, that canbe found in some non-Hodgkin lymphomas. In this application note, the capabilities and performanceof the Q Exactive benchtop Orbitrap mass spectrometerin analyzing the intact and reduced forms of rituximab aredemonstrated as well as sequence confirmation analysesusing a combined top-down and bottom-up approach. Furthermore, the sensitivity of two chromatographicsetups using monolithic columns coupled online to themass spectrometer is evaluated. The data obtaineddemonstrate superior resolution and mass accuracy of theQ Exactive mass spectrometer and present it as a high-confidence screening tool for accelerated and accuratebiopharmaceutical product development andcharacterization. The commercially available monoclonal antibody rituximabwas used in all experiments. Rituximab is a sterile, clear,colorless,preservative-free, concentrated solution forintravenous infusion. It was supplied at a concentration of10 mg/mL, formulated in 7.35 mg/mL sodium citrate buffercontaining 0.7 mg/mL polysorbate 80, 9.0 mg/mL sodiumchloride, and sterile water, and ready for injection. The pHwas adjusted to 6.5 with sodium hydroxide or hydrochloricacid. Prior to LC/MS analysis, rituximab was dialyzed due topolysorbate 80 in the sample. The dialysis was performedwith a Thermo Scientific"Slide-A-Lyzerdialysis cassettewith a molecular weight cut off (MWCO) of 3.5 kDa.A 1 mL sample of rituximab was dialyzed for 48 h against 2 L of 20% aqueous acetonitrile (ACN) at 4°C. For analysis of the light and heavy chains of rituximab,disulfide bonds were reduced by incubation for 30 min at60°℃ with 5 mM tris(2 carboxyethyl)phosphine (TCEP). For the bottom-up analysis of digested mAb, the sample wasalkylated with 20 mM iodoacetamide (IAA) for30 min at room temperature in the dark after the reductionstep. The sample was purified with Thermo ScientificPierce" C18 tips dried in a Thermo Scientific"" SpeedVac"concentrator and dissolved in 0.5 M triethylammoniumbicarbonate buffer (TEAB). Sequencing grade modifiedtrypsin (Promega) was added twice in a total ratio of1:15 (w/w) at O h and 1.5 h and digestion was allowedto proceed for 2.5 h at 37C. The digest was stopped byaddition of triflouroacetic acid (TFA) to approximatelypH 3. All samples were supplied in autosampler vials containingglass inserts (micro-inserts 0.1 ml, clear glass, VWR). Liquid Chromatography A monolithic 160 x0.20 mm i.d. poly(styrene- divinylbenzene) copolymer (PS-DVB) capillary column,prepared according to a previously published protocol,anda Thermo Scientific"PepSwiftmonolithic 250x0.20 mmi.d PS-DVB capillary column were used. Protein separationswere performed with a Thermo ScientificDionexUltiMate" 3000 RSLCnano system that included a detectorequipped with a 3 nL z-shaped capillary detection cell. Separations were accomplished at 55 ℃ with a gradientof 20-60% acetonitrile (ACN) in 0.050% aqueoustriflouroacetic acid (TFA) in 10 min at a flow rate of1 pL/min. For the proteolytic digest with trypsin, thegradient was adapted to run at 0-50% B in 30 min.For the reduced antibody samples, a gradient from35-45% B in 15 min was selected. Protein separation in a higher scale was performed using aThermo ScientificM ProSwift"MRP-10R monolithic 50 mm x1.0 mm i.d. column with an UltiMate 3000 RSLCnanosystem that included a 45 nL detection cell. The column wasrun with a flow rate of 60 pL/min and a column temperatureset to 55 C. The gradient used was 26-80% B in 20 min.For the reduced antibody, a gradient of 26-56% B in 20 minwas chosen to separate the heavy and the light chain. The recorded back pressure of the monolithic columns forthe gradients described above was in the range of 190 to260 bar for the PepSwift 250 mm x 0.2 mm i.d. column and120 to 180 bar for the ProSwift RP-10R 50 mm x 1 mm i.d.column. For all experiments, the solvents used were water with0.05% TFA (A) and acetonitrile with 0.05% TFA (B).The LC gradients are described in Tables 1 and 2. Table 1. LC gradients used for experiments with the PepSwift250 mm x 0.2 mmi.d. column, at a flow rate of 1 uL/min Time[min] intactmAb[%B] Time[min] ReducedmAb[%B] Time[min] mAbDigest[%B] 0.0 20 0.0 35 0.0 0 10.0 60 15.0 45 30.0 50 10.1 85 15.1 85 30.1 85 16.0 85 21.0 85 40.0 85 16.1 20 21.1 35 40.1 0 30.0 20 30.0 35 50.0 0 Table 2. LC gradient used for experiments with theProSwift RP-10R 50 mm x1 mm i.d. column, at a flow rateof 60 uL/min Time[min] IntactmAb[%B] Time[min] ReducedmAb[%B] 0.0 26 0.0 26 15.0 80 15.0 56 20.0 80 15.1 80 20.1 26 20.0 80 30.0 26 20.1 26 30.0 26 Mass Spectrometry The Q Exactive benchtop Orbitrap mass spectrometerwas used for all experiments in this study. Experimentsusing the ProSwift RP-10R 50 mm x1 mm i.d. columnwere performed using the Thermo Scientific"IonMax"source with the heated electrospray ionization (HESI)sprayer, applying 4 kV spray voltage and sheath gas andauxiliary gas flow rates of 15 and 5 units, respectively. All other experiments were performed using theThermo ScientificNanoFlex"ion source equipped with15 cm PicoTipemitter (New Objective, Woburn, USA;20 pm i.d., 360 um o.d., 10 um tip), running with a flowrate of 1 pL/min. A source voltage of 1.5 kV was applied. Method details are provided in Table 3. Intact Antibody Reduced Antibody Top Down AIF 5-plex MS/MS(Targeted MS) Antibody Digest Method type Full MS Full MS (2 segments) Full MS-AIF Targeted MS2 Full MS-dd top 10 HCD Total run time 30 min 0-15.8/15.8-30 min 25 min 25 min 40 min Scan range m/z 1800-5000 800-3500/700-2500 300-2500 Fixed first mass 300 350-2000 Resolution (full MS/MS) 17,500/x 140,000/17,500 70,000 n.a./70,000 70,000/17,500 AGC Full MS 3.00x10⁶ 3.00x10⁶ 3.00x10⁶ 5.00x10⁵ 3.00x10⁶(MS)/1.00x105(MS2) Max inject time (Full MS/MS2) 150 ms 150 ms/200 ms 150 ms 150 ms 100 ms/100 ms Isolation window n.a. n.a. n.a. 10 Th 2 Th Microscans 10 5 5 5 1 Capillary temperature 275°C 275°℃ 275°℃ 275°℃ 275°C S-lens RF level 80 80 50 50 50 SID [eV] 80 0/60 n.a. LC O/HC 20 n.a. NCE [%] n.a. n.a. 10 to 30 10 to 30 25 Source CID The source CID (SID) parameter is a DC offset (0-100 eV)that is added to the source DC offset. The source DC offsetconsists of three voltages: capillary DC, S-lens DC, and S-lensexit lens. The application of this DC offset by setting thesource CID parameter results in collisions of the analytesinside the injection flatapole with residual gas moleculespresent in the source region of the instrument. All-Ion Fragmentation All-ion fragmentation (AIF) is a fragmentation type in whichall ions generated in the source are guided through the ionoptics of the mass spectrometer, accumulated in the C-trap,and sent together to the higher-energy collisional dissociation(HCD) cell for fragmentation. In this case, the quadrupole isnot set to select a particular precursor but operated inRF-only pass-through mode. For the analysis of intactproteins, this is a useful method since different charge statesoften show different fragmentation behavior and it is not easyto predict which one works best. Data Analysis Full MS spectra were deconvoluted using Thermo Scientific"Protein Deconvolutionsoftware version 2.0. From the intactantibody and the intact heavy chain, the spectra acquired at aresolution setting of 17,500 were deconvoluted using theReSpect" algorithm. High resolution spectra from the intactlight chain acquired at a resolution of 140,000 and top-downspectra acquired at 70,000 resolution were deconvolutedusing the Xtract algorithm. To identify glycoforms of theintact antibody and the intact heavy chain obtained afterreduction, the masses were compared to the expected massesiC with the various combinations of commonly foundglycoforms. The top-down HCD and AIF spectra were deconvolutedusing the Xtract algorithm in the Thermo ScientificQual Browserutility. Fragment ion assignment wasperformed using Thermo ScientificProSightPC"softwareversion 3.0 in single protein mode with a fragment iontolerance of 5 ppm. The dataset obtained from the proteolytic digest wasprocessed with Thermo Scientific" Proteome Discoverersoftware version 1.4, using the SEQUESTalgorithm. A three-protein-entry database was used consisting of thelight chain, the heavy chain in two variants carrying eitherAla or Val at position 219, and trypsin. Mass tolerances wereset to 10 ppm for the precursor and 20 mmu for the fragmentions. Four variable modifications were considered: carbamid-omethylation (Cys), oxidation (Met), deamidation (N,Q),Gln to pyro-Glu conversion, and N,N-dimethylation (Lys)(relevant for identification of trypsin autolysis products only). Results and Discussion Rituximab is an IgG1 class chimeric monoclonal antibodyagainst the protein CD20, which consists of two light chainswith 213 amino acids and two heavy chains with 451 aminoacids each in length. The light and heavy chains are connectedvia 12 intrachain and 4 interchain disulfide linkages(Figure 1). The antibody is decorated with glycan structuresattached to residue Asn301 of each of the two heavy chains.The composition and length of the attached glycans is quitediverse, resulting in a microheterogeneity of the molecule.The variety and relative abundance of the differentglycostructures is essential for the efficiency of the antibodyas a biological drug. The nomenclature of common glycansattached to antibodies are listed in Figure 2. Figure 1. Schematic of molecular structure for the humanized IgG1 classmonoclonal antibody rituximab The full MS spectrum obtained from 20 ng rituximabapplied to a 25 cm x 0.2 mm i.d. monolithic column isdisplayed in Figure 3. The mass spectrum, acquired overm/z 1800-5000 shows the typical charge distributionobserved for large proteins. The most abundant chargestate (z=+45) at m/z 3269, represented in the zoomed ininsert, nicely pictures the four most abundant glycoformsof the intact antibody. The intact mass of these four most abundant glycoformsand a series of less abundant glycoforms is obtained afterthe deconvolution of the full MS mass spectrum shown inFigure 4. The assignment of the peaks was based on thecalculation of the proteins sequence, taking into accountthe various anticipated glycan structures shown inFigure 2. Figure 3. Single scan full MS spectrum (10 pscans) of rituximab, acquired from 10 ng sample loaded on a 250x 0.2 mm i.d. column.The insert shows a zoomed in view of the most abundant charge state (Z=+45). The observed peak pattern in the insert represents thedifferent glycoforms of the molecule. GOF/GOF GOF/G1F GOF/G2F or(G1F), G1F/G2F G2F/G2F Measured 147,075.969 147,237.734 147,399.516 147,561.766 147,721.813 Theoretical 147,074.985 147,237.126 147,399.267 147,561.408 147,723.549 A ppm -6.7 -4.1 -1.7 -2.0 11.8 Figure 4. Deconvoluted mass spectrum of rituximab with annotated glycoforms (top) andcomparison of theoretical and measured masses for the five most abundant glycoforms (table) For the acquisition of the full MS spectrum of the intactantibody, the optimum setting of the source CID wasevaluated (Figure 5). This setting was found to be crucial in obtaining a high quality spectrum. The application of25-90% source CID is beneficial for most proteins. Forthis sample the optimum setting was 80% SID. The calculation of the masses for the light chain,unglycosylated heavy chain, and intact fully assembledantibody is presented in Table 4, showing the step-by-stepcalculation starting with the 213 respectively 451 aminoacids of the light and heavy chain. Both protein sequencescontain an N-terminal glutamine, which is anticipated tobe modified to a pyro-glutamic acid, resulting in adeduction of mass of 17.0265 Da. Moreover, theC-terminal lysine present in the heavy chain is likely to becleaved off, reducing the molecular weight by another 128.09497 Da. For assembling the intact antibody, atotal of 16 disulfide linkages is considered by abstracting32 protons. The glycan structures on each of the twoheavy chains will add between 1217.1 and 2352.1 Da inmass. It has to be considered that the two chains can carrydifferent glycans, resulting in a mixed composition, e.g.G01/G2F. Chemical composition and masses of individualcarbohydrates are listed in Table 5. The monoisotopic andaverage atomic masses of the elements used to calculatemolecular weights in Tables 4 and 5 are listed in Table 6. Table 4. Chemical composition and step-by-step calculation of monoisotopic and average mass for the light and heavy chain, includingtheir modifications as well as the intact antibody rituximab with various glycoforms. Detected masses shown in Figures 4, 6, and 7 arepresented in the blue cells. Elemental compositions C H N 0 S MW(monoisotopic) MW (average) G1F/G2FSA2 (HexNAc)8 (Hex)9 (Fuc)2 (SA)2 152 248 10 109 0 3957.41704 3959.6 G2F/G2FSA(HexNAc)8 (Hex)10 (Fuc)2 SA 147 241 9 106 0 3828.37445 3830.5 G2F/G2FSA2 (HexNAc)8 (Hex)10 (Fuc)2 (SA)2 158 258 10 114 0 4119.46986 4121.7 Sum 2 x HC +2 x LC (4 x pyroGlu,-2K) 6414 9896 1692 2006 44 144,127.20750 144,216.6 minus 32 S-S bond protons 6414 9864 1692 2006 44 144,094.95710 144,184.3 2HC+2LC-16 S-S bonds+(Man5)2 6506 10016 1696 2076 44 146,527.80282 146,618.5 2HC+ 2LC - 16 S-S bonds +(GOF)2 6526 10048 1700 2084 44 146,984.02484 147,075.0 2HC+2LC-16 S-S bonds + GOF/G1F 6532 10058 1700 2089 44 147,146.07766 147,237.1 2HC+2LC-16 S-S bonds +GOF/G2F or (G1F)2 6538 10068 1700 2094 44 147,308.13049 147,399.3 2HC+2LC- 16 S-S bonds +G1F/G2F 6544 10078 1700 2099 44 147,470.18331 147,561.4 2HC +2LC-16 S-S bonds + G2F/G2F 6550 10088 1700 2104 44 147,632.23613 147,723.5 2HC+2LC-16 S-S bonds + G1F/G2F SA 6555 10095 1701 2107 44 147,761.27872 147,852.7 2HC+2LC-16S-S bonds + G1F/G2F (SA)2 6566 10112 1702 2115 44 148,052.37414 148,143.9 2HC+2LC-16S-S bonds+ G2F/G2F SA 6561 10105 1701 2112 44 147,923.33155 148,014.8 2HC+2LC-16 S-S bonds +G2F/G2F (SA)2 6572 10122 1702 2120 44 148,214.42696 148,306.1 Table 5. Chemical composition and masses of monosaccharides SumFormula Monoisotopic Mass AverageMass C N H Sialic Acid C..0.NH, 291.09542 291.3 11 8 1 17 Galactose CO.H 162.05282 162.1 6 5 0 10 N-Acetylglucosamine C,0NH, 203.07937 203.2 8 5 1 13 Mannose C.0H 162.05282 162.1 6 5 0 10 Fucose C0H, 146.05791 146.1 6 4 0 10 Table 6. Monoisotopic and average atomic masses of the elements used to calculate the molecular masses in Tables 4 and 5 Monoisotopic Mass Average Mass C 12.0000000 12.01074 H 1.00782503 1.00794 N 14.0030740 14.00674 15.9949146 15.99940 S 31.9720707 32.06608 The initial calculation based on the sequence published inthe DrugBank database resulted in a mass that did notmatch the masses obtained in our experiments. Comparisonof the DrugBank sequence with a previously publishedsequence’ revealed a difference in one amino acid at position219, located in the conserved region of the heavy chain, Alaversus Val. The sequence containing the Ala at position 219did match well with the results obtained from intact massmeasurements as well as with previously reported results.To further verify this, a series of additional experimentswas performed. After reducing the antibody (without alkylation), theanalysis of separated light and heavy chain was performedapplying different resolution settings to account for whetheror not isotopic resolution can be achieved based onmolecular weight. Due to the smaller molecular weight ofthe light chain, it is possible to obtain an isotopicallyresolved spectrum, whereas for the heavy chain this is notpossible since it is about twice as large as the light chain. To apply different resolution settings, the method was set upin two segments (140k resolution for the scans acquiredfrom 0 to 15.8 min, and 17.5k resolution from 15.8 to30 min) and the gradient was optimized to achieve well-separated peaks of the light and heavy chain. On both monolithic columns evaluated in this study(PepSwift 250 mm x 0.2 mm i.d. and ProSwift RP-10R50 mm x 0.1 mm i.d.), the separation of the two peaks bymore than 2 min was equally possible (Figure 6). The massspectra obtained from the light chain and from the heavychain (Figures 6b and 6c) were submitted for deconvolution.The isotopically resolved light chain spectrum wasdeconvoluted using the Xtract algorithm, resulting in amonoisotopic molecular weight of 23,025.3758 Da, whichmatches the calculated mass by 2.5 ppm. The heavy chainwas deconvoluted using the ReSpect algorithm, resulting inthree peaks, each of which represents one of the majorglycoforms, G0F, G1F, and G2F (Figure 7). Figure 6. Chromatogram (A) and full MS spectra of light (B) and heavy chain (C) from reduced rituximab. The insert in panel C shows azoomed in view of charge state z=+25, with the three peaks representing three different glycoforms. Figure 7.Deconvolution results of the light and heavy chain. The light chain, acquired at a resolution setting of 140,000 in full scanmode, was deconvoluted using the Xtract algorithm, obtaining an accurate monoisotopic mass as well as the full isotopic envelope(left). The heavy chain, detected at 17,500 resolution, was deconvoluted with the ReSpect algorithm providing average masses (right). To assess the limit of detection of the instrument setupusing the 250 x 0.2 mm monolithic PepSwift column, aseries of LC/MS runs were acquired. Between 50 pg and20 ng of the intact antibody was applied on column(Figure 8), starting with the lowest concentration. Twoblanks were run before the sequence and between eachsample to exclude carryover effects. With this setup, 500 pg was found to be the lowest amount that stillachieved a good spectrum for deriving the most abundantglycoforms of the intact antibody. Here it is worthpointing out that for the lowest concentrations it wascrucial to prepare the samples fresh without storing themfor several hours in the autosampler prior to analysis. Figure 8. Full MS spectra from a dilution series of 20 ng to 500 pg of intact antibody, applied on a 250 mm x 0.2 mm i.d. monolithicPepSwift column On the 50 mm x 1mm i.d. monolithic ProSwift column,30 ng and 150 ng of intact antibody were applied, both ofwhich produced high quality spectra (Figure 9). Based on the 30 ng load it can be estimated that the lowest amountstill yielding a sufficient spectrum quality to be between5 and 10 ng. ( F igure 9. Full MS spectra ( left) and zoomed in view o f the h ighest abundant charge state (right) of 1 5 0 ng and 30 ng loads of intact rituximab a ppli ed on a 50 mm x 1 mmi.d. monolithic ProSwift column ) In an attempt to further confirm the sequences of the lightand heavy chains, two types of top-down experimentswere performed: all-ion fragmentation (AIF) withfragmentation upon collision in the HCD cell and amultiplexed (5-plex), targeted MS? experiment on fiveselected charge states each of the light and heavy chains.All spectra were acquired at 70,000 resolution. For thetargeted MS spectrum, a retention-time-dependent masslist was used, targeting first the earlier eluting light chain(RT 13.16 min: m/z 1536.96,1646.6,1773.3,1920.7,2095.4) and later the heavy chain (RT 16-20 min:m/z 1584.6,1635.7,1684.7,1748.5,1810.9). In this typeof experiment, the first charge state listed on the inclusionlist is selected and sent to the HCD cell for fragmentation.The product ions are stored in the HCD cell while thesecond charge state is isolated, sent to the HCD cell,fragmented, and stored in the cell until the fifth chargestate has also been fragmented. All ions from the fiveindividual isolation and fragmentation steps are senttogether to the Orbitrap analyzer, resulting in one singlefragment ion spectrum. To further confirm the sequences, a bottom-up approachwas performed using a digest with trypsin followingreduction and alkylation of the antibody. The chrom-atogram obtained from the digest is displayed inFigure 11. A database search against a four-entry databasecontaining the light chain, both variants of the heavychain, and trypsin revealed a sequence coverage of thelight chain of 96% and for the heavy chain of 78.8%(Figure 12). The two short missing peptides from the lightchain (LEIK and EAK) could be detected as intact massesonly in the full MS spectra, whereas the peptide EAK wasidentified based on the accurate mass corresponding to thepeptide containing a missed cleavage EAKVQWK. Takinginto account the peptides identified based on MS/MSspectra and based on accurate masses of the small intactpeptides, sequence coverage for the light chain is 100%. The fragment ion assignment for the light chain isdisplayed in Figure 10. There is good coverage of both theN-andC-terminal ends as well as some fragments in thecenter of the sequence, resulting in 28% coverage,respectively 15%of the theoretical fragments. For theheavy chain, fragmentation was less efficient with bothmethods and resulted in about 20 fragments, most ofwhich represent the sequence termini. bl -I-V+L+S+Q-S+P-A+I-L-S-A-S-P-G-E-K-V-T-M-T-C+R-A-y189b26--S-S-S-V-S-Y-I-H-W-F-Q-Q-K-P-G-S-S+P-K-P-W-I-Y-A-T-y164b51-S+N+L+A+S-G-V+P-V-R-F-S-G-S-G-S-G-T-S-Y-S-L-T-I-S-y139b76-R-V-E+A-E-D-A-A-T+Y-Y-C-Q-QtWtT-S-NP-P-T-F G-G-y114b101 -T-K-L-E-I-K-R-T-V-A-A-P-S-V-F-ItFtP-P-S-D-E-Q-L-K- y89b126 -S-G-T-A-S-V-VtC-L-L-N-N-F-Y-P-R-E-A-K-V-Q-W-K-V-D- y64b151-N-A-LtQtS-GtNtStQtEtStVtTtEtQ-DtS-K-DLS-TtYtStLtS-y39b176tS-TtLtTtLtStKtA-DtY-EtKtHtK-VtY-AtC-EtV-TtHtQtGtL-y14b201tStStPtVtTtKtStFtN-R-G-E-C- y1 ( Figure 10. Matched sequence coverage of the rituximab light chain based on fragment ions ob t ained from AlF experiments. Sev e nteen b- a n d 50 y - ionswere assigned, corresponding t o 15.7% o f the theoretical number of frag m ents (67 of 426). ) Figure 11. Base peak chromatogram of a digest using trypsin on the reduced and alkylated antibody rituximab Figure 12. Amino sequence of light and heavy chains from rituximab. Amino acids shown in black letters representthe parts identified based on MS/MS spectra. Sequences confirmed based on MS full scan data as intact peptidesonly are shown in green. The two amino acids shown in red (AK) as part ofthe heavy chain could neither be coveredon the MS nor on the MS/MS level. Resulting sequence coverage for the light chain is 100% (96% with MS/MS) and99.5%(98.8% with MS/MS) for the heavy chain. Asparagin251 in the heavy chain represents the glycosylation site. For the heavy chain, the peptide GQPR was also identifiedbased on the accurate mass of the intact peptide. Lastly, thepeptide containing the glycosylation site at position Asn301was not identified in its unglycosylated form based on anMS/MS spectrum. A database search including the expectedglycans as modifications was successful. In addition, theglycopeptides can easily be detected in the full scan spectra indifferent glycosylated forms and in different charge states,and the MS/MS spectra can easily be spotted due to thepresence of a characteristic peak pattern. The G0F-containing peptide is shown as an example in Figure 13, representing the intact precursor and the typicalfragmentation pattern obtained from glycopeptides usingHCD-type fragmentation: the two hexonium ions at mass204 (HexNAc) and 366 (Hex-HexNAc) as well as thefragment ions nicely showing the sequence ladder of releasedhexose (m/z 162),N-acetylhexosamine (203), and Fucose(146). Considering all peptides on the MS full scan level andbased on MS/MS spectra via database searches, the sequencecoverage of the heavy chain is 99.5%, leaving only twoamino acids not covered (aa 343-344). 879.0214z=3 Intact glycopeptideT181600· T precursor MH 2+/MH3+:140r878.687480 Z==3 879.35551201318.0284z=2 Dppm=0.47 m Dppm=0.67008081317.5272m1318.5300 879.6898z=28z=2 z=m31319.031440 =2880.m02251319.5328 20z=3 20 · 881.2059 z=2 10 Z= 0 0 1318 1320 879 880 881 m/z m/z HexNAocxonium EEQYNSTYR1392.5940 z=1 EEQYNSTYR EEQYNSTYR Hex-HexNAcoxonium 1-FUC538.6495 366.1400563.3297 1189.5182十 z=1 z=1 -HexNAc1595.6632 Th wT mT+4 1200 1400 1600 1800 -GOF - EEQYNSTYREEQYNSTYR EEQYNSTYR EEQYNSTYR EEQYNSTYR 口- HexNAc 19197865 --FucHex EEQYNSTYR2066.5.8406-FucCD--HHexex mm4.. Figure 13. MS/MS spectrum of the glycopeptide aa 297-305 (EEQYN*STYR,*=G0F) obtained from the triply chargedglycopeptide precursor. Inserts show the isotope patterns of doubly and triply charged intact precursors detected in the fullscan spectrum. Conclusion In this study, a workflow is presented that combines fastchromatography, using two sizes of monolithic columns,and high resolution Orbitrap mass spectrometry of intact,as well as reduced, rituximab, sequence verification by AIF,and multiplexed HCD top-down fragmentation,supplemented by a bottom-up approach. The data presented here also demonstrate the sensitivity ofthe applied LC-MS instrument setup, still obtaining a goodquality MS spectrum from as low as 500 pg of the intactantibody loaded on column. Furthermore, for the analysisof the reduced mAb, a chromatographic separation of thelight and heavy chains was achieved allowing for theirdetection at different resolution settings. The data obtained from this workflow allow thedetermination of the molecular weight of the intactantibody, the confirmation/verification of the amino acidsequence of light and heavy chain, and the identification andevaluation of the relative abundance of various glycoformsof rituximab. Acknowledgements The authors would like to thank Daniel Purstinger for hishelp in sample preparation and Remco Swart for providingthe PepSwift and ProSwift monolithic columns used in this study. The financial support by the Austrian FederalMinistry of Economy, Family, and Youth and the NationalFoundation of Research, Technology,and Development isgratefully acknowledged. References 1. Premstaller, A.; Oberacher, H. and Huber, C.G.High-Performance Liquid Chromatography-Electrospray Ionization Mass Spectrometry ofSingle- and Double Stranded Nucleic Acids UsingMonolithic Capillary Columns. Anal. Chem. 2000, 72,4386-4393. 2. http://www.drugbank.ca/drugs/DB00073 ( 3.Nebija, D.; Kopelent-Frank,H.; Urban, E.; No e , C. R. and L achmann, B. Comparison of tw o -dimensional gel electrophoresi s patter n s a n d MALDI-TOF MS analysis of therapeutic recombinant monoclonal antibodiestrastuzumab and rituximab. J ournal of Pharmaceuticaland Biomedical Analysis, 2011, 56, 684-91. ) 4.Kuribayashi, R.; Hashii, N.; Harazono, A. andKawasaki, N. Rapid evaluation for heterogeneities inmonoclonal antibodies by liquid chromatography/massspectrometry with a column-switching system. Journalof Pharmaceutical and Biomedical Analysis, 2012,67-68, 1-9. www.thermofisher.com 2016 Thermo Fisher Scientific Inc. All rights reserved. Rituxan is a registered trademark of Biogen Idec, Inc. USA. MabThera is a registeredtrademark of F. Hoffmann-La Roche Ltd. PicoTip is a registered trademark of New Objective, Inc. SEQUEST is a registered trademark of theUniversity of Washington. All other trademarks are the property of Thermo Fisher Scientific and its subsidiaries. This information is presented asan example of the capabilities of Thermo Fisher Scientific products. It is not intended to encourage use of these products in any manners thatmight infringe the intellectual property rights of others. Specifications, terms and pricing are subject to change.Not all products are available in allcountries. Please consult your local sales representative for details. Africa +43 1 333 50 34 0 Denmark +45 70 23 62 60 Japan +81 45 453 9100 Singapore +65 6289 1190Australia +61 39757 4300 Europe-Other +43 1333 50 34 0 Latin America +15616888700Spain +34 914 845 965Austria +43 810 282 206 Finland +358 9 3291 0200 Middle East +43 1 333 50 34 0 Sweden +468556 46800Belgium +32 53 73 42 41 France +33 1 60 92 4800 Netherlands +31 76 579 55 55 Switzerland +41 61 71677 00Canada +1 800 530 8447 Germany +49 6103 408 1014 New Zealand +64 9 980 6700 UK +44 1442 233555China 800 810 5118 (free call domestic) India +91 22 67429494 Norway +46 8 556 46800 USA +1 800 532 4752400 650 5118 Italy +39 02 950 591 Russia/CIS +43 1 333 50 34 0 In this study, a workflow is presented that combines fast chromatography, using two sizes of monolithic columns,and high resolution Orbitrap mass spectrometry of intact,as well as reduced, rituximab, sequence verification by AIF,and multiplexed HCD top-down fragmentation,supplemented by a bottom-up approach.
确定

还剩10页未读,是否继续阅读?

赛默飞色谱与质谱为您提供《单克隆抗体(Monoclonal Antibody)中利妥昔单抗(Rituximab)检测方案(液相色谱仪)》,该方案主要用于预防类生物药品中含量测定检测,参考标准--,《单克隆抗体(Monoclonal Antibody)中利妥昔单抗(Rituximab)检测方案(液相色谱仪)》用到的仪器有
相关方案
更多
该厂商其他方案
更多