


方案详情
文
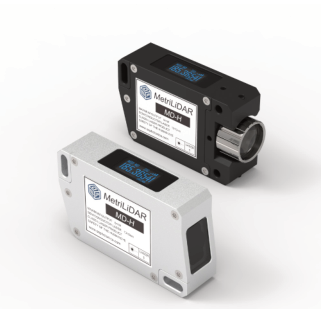
采用美国Artium公司的PDI-200MD型相位多普勒粒子干涉仪(PDI)对多横流角喷流羽流的液滴的粒径和速度进行了测量,并和CFD计算结果进行了对比分析。
方案详情

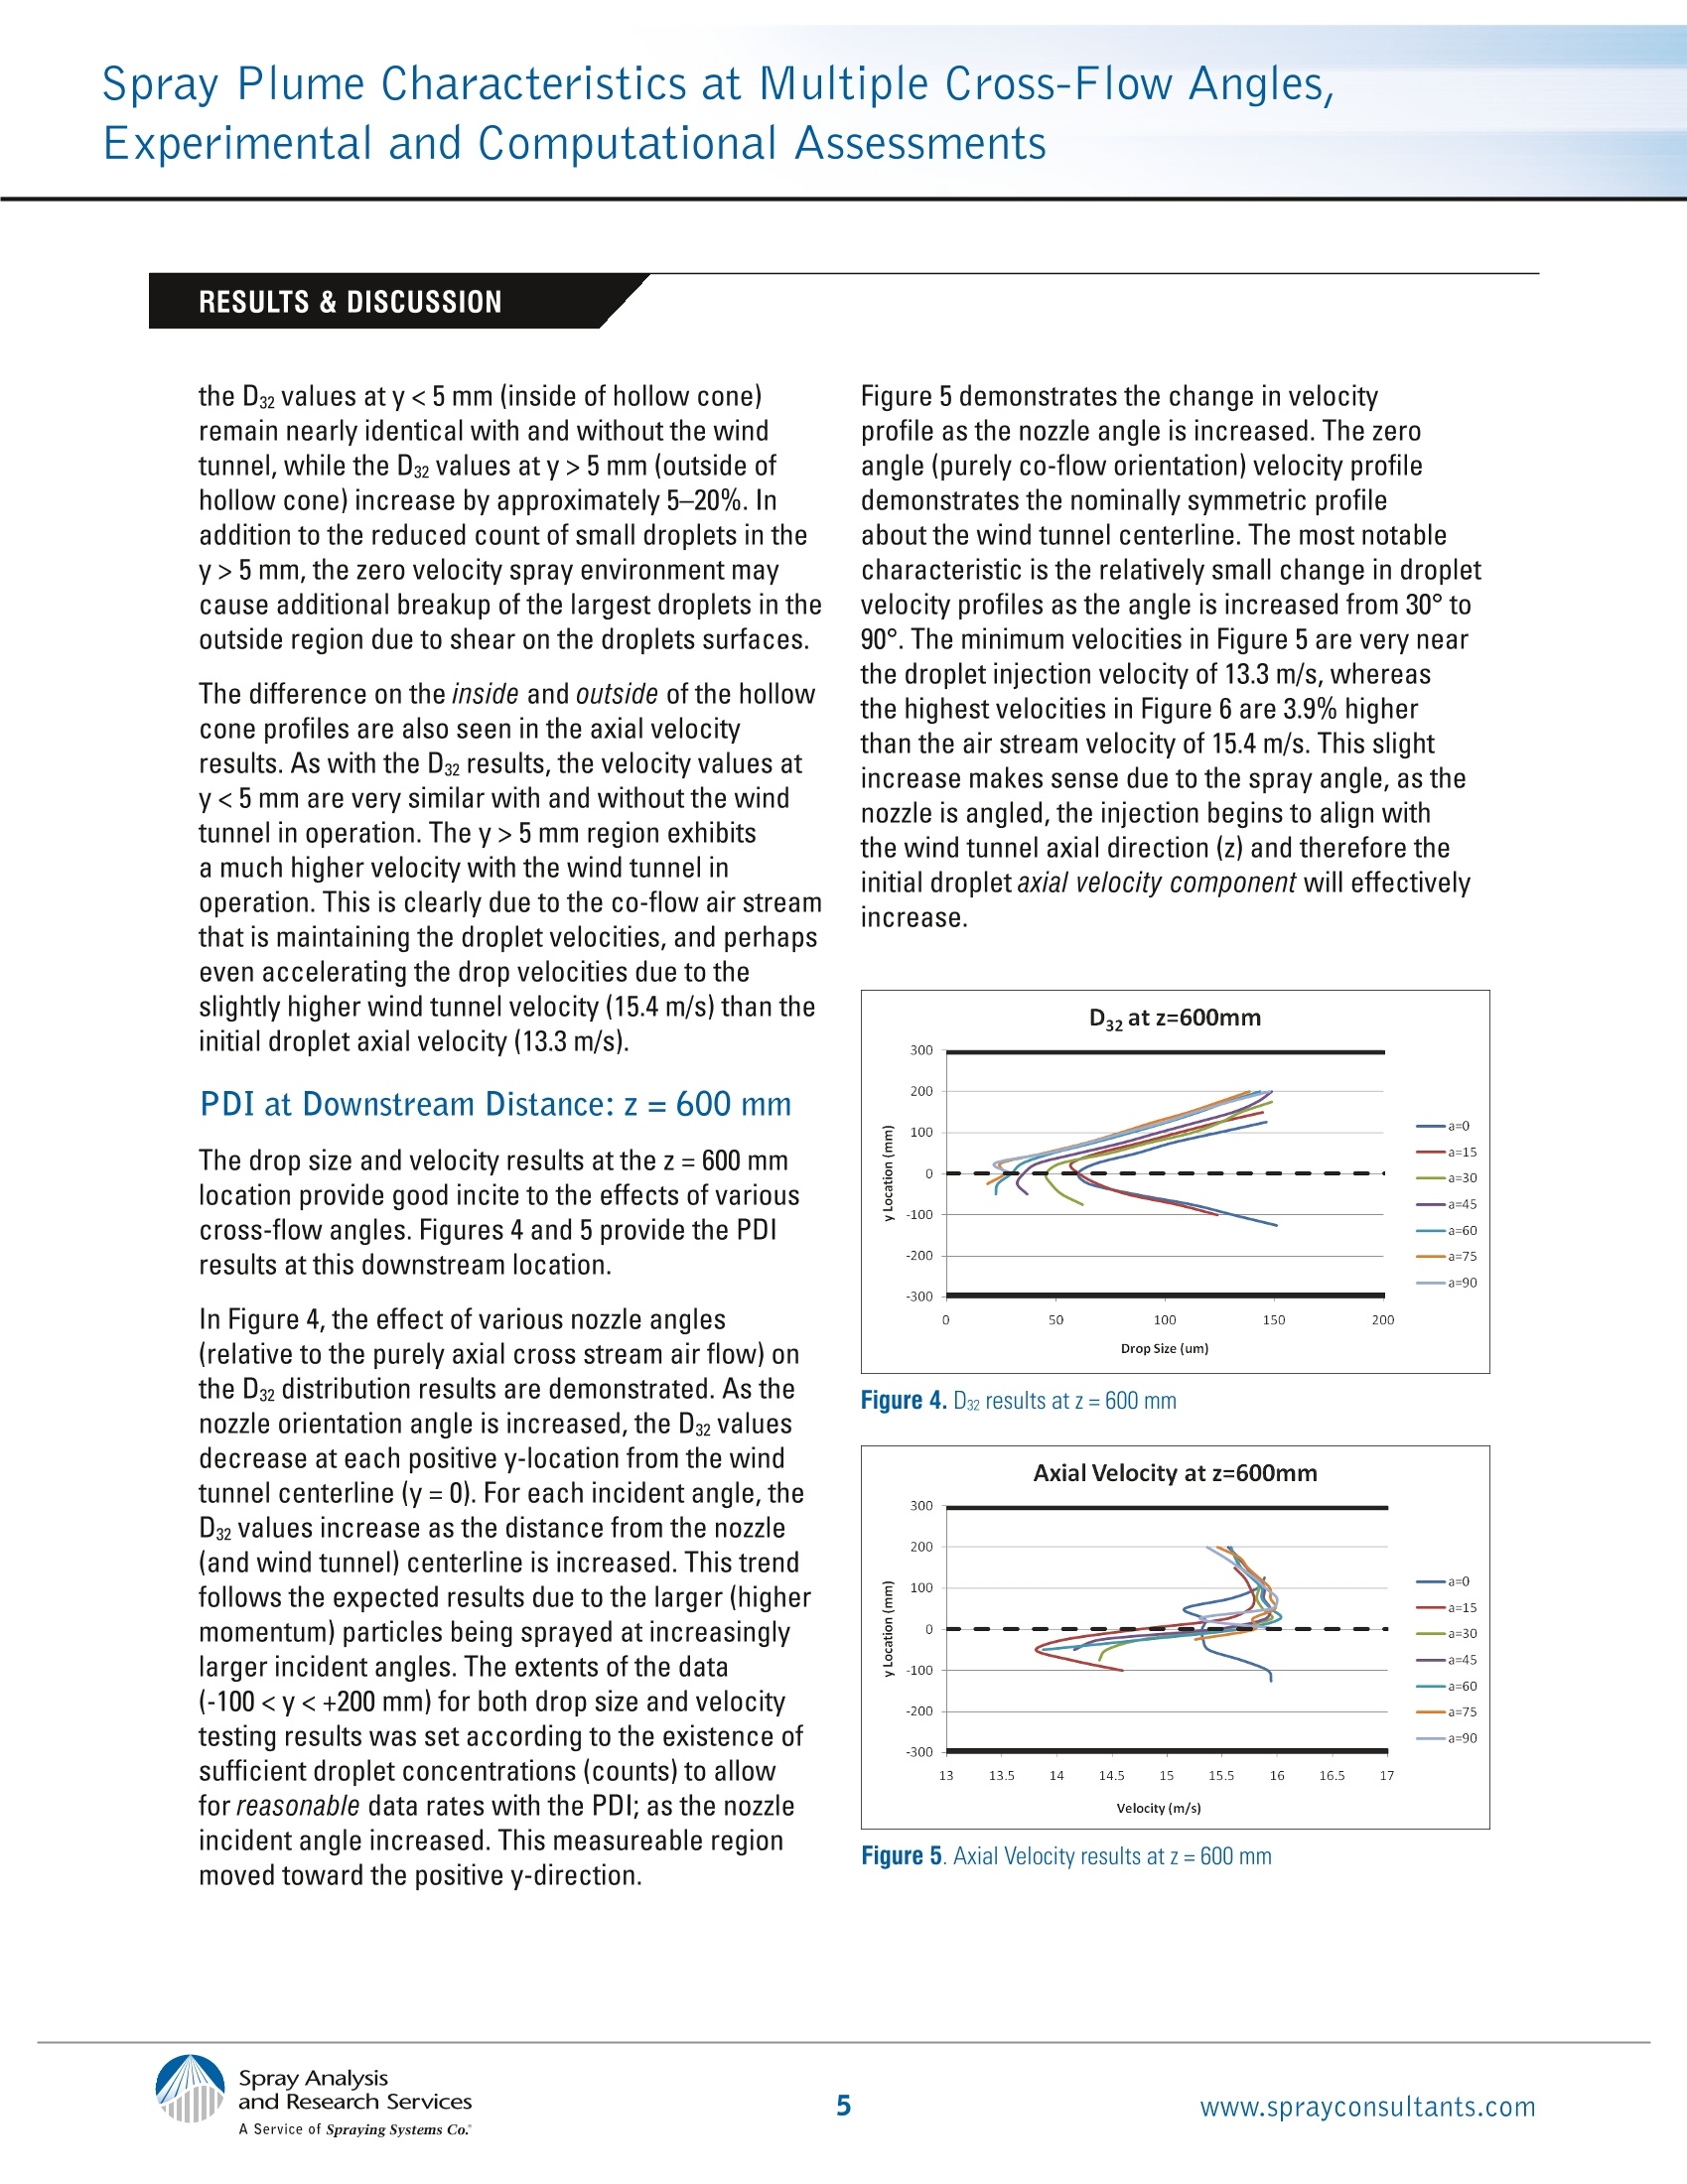
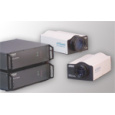
Spray Analysisand Research ServicesA Service of Spraying Systems Co. Experimental and Computational Assessments Spray Plume Characteristics atMultiple Cross-Flow Angles,Experimentaland Computational Assessments As presented at: ICLASS 2009,11th Triennial International Conference on Liquid Atomization and Spray Systems, Vail,Colorado, USA, July 2009 The interaction of a spray plume within a confined cross-flow environment occurs often in spray applications, mostnotably in gas conditioning applications. Characterizationand modeling of the drop size and velocity distributions, aswell as spray shape,was conducted within a controlledwind tunnel environment. The primary focus of this studyis the effect of various incident angle cross-flows on thecharacteristics of a spray nozzle. While the spray characteristics immediately downstreamof the nozzle will govern the significance of the effect ofthe cross-flow, this study aims to provide a reference casein order to guide and compare future work. A low flowrate, hydraulic, hollow cone spray was investigated with anominally uniform cross-flow air speed of 15.4 m/s. These results demonstrate the trajectory change as well as thechange in spray plume characteristics over a range ofspray angles defined relative to a co-flow air stream. The experimental results were acquired with an ArtiumPhase Doppler Interferometer (PDI). The computationalmodel and simulations were conducted using the AnsysFluent modeling software package in conjunctionwith methods developed at Spraying Systems Co. Thecomputational model's agreement, and disagreement,withthe experimentally acquired results provides insight forthe appropriate considerations when constructing cross-flow models. Spray Plume Characteristics at Multiple Cross-Flow Angles,Experimental and Computational Assessments Process improvement and optimization in the gasconditioning industry is a constantly ongoing effort.The improvements made in nozzle design and liquidatomization in recent years have provided thepossibility of process optimization like never before.While on-site experimental testing provides the mostdirect assessment of a spray's characteristics in agas conditioning tower, often the cost and availabilityof these tests is limited or impossible. Therefore,computational fluid dynamics (CFD) projects for thistype of application have become very useful. WithCFD, gas conditioning process engineers are able to,for the first time, assess the spray quality within theactual spray process region. The increased use of CFDto model these processes requires in-depth validation EQUIPMENT & METHODS Experimental Setup and Methods The experimental setup consisted of a spray nozzle,wind tunnel, and Artium Technologies Phase DopplerInterferometry system (PDI). All tests were carriedout with the cross-flow air and spray liquid at ambienttemperature ~68F. The nozzle was operated with asteady 3.8 bar (55 psi) clean water supply for all tests. Wind Tunnel The wind tunnel utilized in these experiments wascapable of producing nominally uniform air flow at avelocity range from 2.5 m/s to greater than 50 m/s; theactual co/cross-flow velocity generated during thesetests was 15.4 m/s. This wind speed was chosen as itallowed for a reasonable amount of deflection of thespray plume within the first 600 mm (location of windtunnel optical access) of the spray injection. Phase Doppler Interferometry The phase Doppler Interferometry system used inthis study was the Artium PDI 2D MD instrument withthe integrated AIMS software used for automatedprocessor setup. This technique measures thesize, velocity, angle of trajectory, and time ofarrival of each particle passing through an opticalmeasurement volume formed by pairs of intersecting of the methods used to model these applications andthe results provided by these types of models. Spraying Systems Co. has the unique combinationof testing and modeling expertise that allowed for arigorous validation of these modeling techniques oftenused to simulate un-testable situations. This validationof computation fluid dynamics (CFD) results is widereaching in applicable variables; the focus of thepresent study was on the relative angle of the spraynozzle to a steady, nominally uniform co/cross-flowair stream. Orientation angles of the spray nozzle axis(a.) varied from 0° (in-line with the co-flow air) to 90°;at 15° intervals for testing; and at 45° intervals formodeling. laser beams. The technical explanation of the PhaseDoppler technique can be reviewed in a numberof publications including Bachalo and Houser[1] and Bachalo 1985 [2]. The ability to measureaccurately requires the reliable characterization ofthe size, velocity, and transit time of each droplet.The PDI system is a validated method for dropletsize and velocity measurement; in addition, sprayconcentration measurements are possible, seeBade [3]. The Artium PDI system utilizes a unique digitalsignal burst detection method which reliably detectsdroplets, even in complex environments. This is anadvance over the earlier Fourier transform burstdetection method invented by Ibrahim and Bachalo(U.S. Patent 5,289,391). This detection system is alsocritical to the in situ approach for measuring theeffective diameter of the sample volume as a functionof drop size. The Fourier transform based signalprocessor uses quadrature down-mixing to positionthe signals in an optimum range for processing.The real and imaginary (shifted by 90 degrees)components of the signals are sampled and a fullcomplex Fourier transform is used to obtain the signalfrequencyand phase. Each of the three signals forthe phase measurements is sampled in this mannerand the phase differences computed at the same Spray Plume Characteristics at Multiple Cross-Flow Angles,Experimental and Computational Assessments frequency for each signal. Three phase differencesare computed,AB, AC, and BC for detectors A,B, and C from the Channel1 velocity component.These three phase differences are compared forconsistency as one of the validations for each dropletsignal detected. The approach has proven to be veryeffective in detecting and eliminating sizing errors dueto the well-known trajectory problem. The Artium AIMS software incorporates an auto-setup feature that serves to optimize the frequencyand phase shift processing. The auto-setup featureacquires a small number of signals produced bydroplets passing through the measurement volumeand is discussed in detail in Bachalo,et al. [patent pending].User-to-user setup differences that havebeen known to produce varying results and accuracyin PDI data results, often relying upon the operator’sindividual experience and understanding of the PDIprincipals, have been significantly minimized with thisapproach. The laser transmitting lens focal lengthwas 1000 mm for all tests; the receiving unit focallength was 500 mm for all tests and was oriented atthe 40°off-axis forward scatter position. This providedan effective measureable drop size range of 2.3 to282 pm. Figure 1A demonstrates the wind tunnelexperimental setup with a PDPA setup mountedaround the wind tunnel test section, for these tests, anArtium PDI was setup in a similar manner. A. B. Figure 1. A. PDPA mounted with wind tunnel| BB. Wind tunnel geometry Computational Setup and Methods CFD simulations were performed with ANSYS FLUENTversion 6.3. Generally, the CFD model was reproducedaccording to the wind tunnel geometry. The mostsignificant alteration in the modeled geometry wasthe spray lance which was simplified to reducethe upstream mesh size. Meshing was performedwithin GAMBIT 2.4. Dense mesh was incorporatedin the near vicinity of the spray injection locations.Size functions were used to further reduce meshsize. The 3D mesh consisted of mixed elements withapproximately 1.3 million cells. Figure 1B provides atwo-dimensional schematic of the CFD model setupand defines the coordinate system referenced in boththe computational and experimental results. The CFD model was set up with a uniform velocity inlet boundary condition (BC) while varying therelative spray injection incident angle, relative to theaxial air flow direction (a=0°[co-flow],45°,and 90°[cross-flow]). The outlet side of the duct was definedwith a constant pressure boundary condition. TheTunnel duct and lance walls were specified as rigidwith no-slip and adiabatic conditions. Throughout allsimulations the following models were included: k-Realizable Turbulence Model,DPM for LaGrangiantracking of water droplets, and Species TransportModel to include mixing of air and water vapor due toevaporation. The air phase and particle tracking wereperformed in steady state. Spray Plume Characteristics at Multiple Cross-Flow Angles, The drop size distributions, velocity (13.3 m/s),and spray plume angle (90°) were obtained whileconducting the PDI measurements and used todefine the CFD model spray injection parameters. Theinjection velocity was based on volume flux and areaweighted averaged velocity at 10 mm downstreamfrom the nozzle exit orifice, these weighing techniquesare discussed in Bade [4]. These initial spraycharacteristics were acquired with the wind tunnel inoperation using the PDI system described previously.The drop size range that was used to specify sprayinjections in FLUENT was derived from a combinationof the x=10 mm and x=600 mm locations. Theminimum diameter (22 pm) input for CFD was specifiedbased on volume flux and area weighted averageof Dvo.01 [5] and [6] from the profile at 10 mm frominjection. The maximum diameter (220 um) for the CFDmodel was specified based on volume flux and areaweighted average of Dvo.gg at the z = 600 mm RESULTS & DISCUSSION The experimental results are presented for twodownstream distances. First, the spray characteristicsare examined at 10 mm downstream from the nozzleexit orifice (z=10 mm). At this distance, all resultswere acquired with the nozzle spraying in a purelyco-flow orientation (angle=0°). Downstream Distance: 10 mm The results at the downstream location z= 10 mm areprovided in order to show the initial characteristicsof the spray plume upon exiting the nozzle. Figures2 and 3 provide the D32 and Axial Velocity profiles,respectively, with the wind tunnel in operation(15.4 m/s) and also when not in operation. As expected,the drop size is similar with and withoutthe co-flow air in operation. However, with theco-flow air on, many of the smaller particles do notpossess sufficient momentum, after exiting the nozzle,to maintain their initial trajectory (and overcome thedrag caused by the co-flow air stream) and continueto move outward from the nozzle centerline.Thus, downstream location. This process of combiningthe initial drop size characteristics and downstreamcharacteristics was necessary in order to accountfor the lack of droplet collision and coalescence inthe model. The injection volumetric mean diameter(108 pm) for CFD was determined based on volumeflux and area weighted averages of Dvo.5 from bothlocations. The FLUENT input for drop size distributionwas specified using the Rosin-Rammler distributionfunction, see Equation 1, to account for the 20,000particles that were tracked at each iteration of theDPM model [6]. Q is the fraction of total volumeof drops with diameter less than D. X and q areconstants inherent to the Rosin-Rammler functionassociated with the distribution center and width,respectively. The user-defined function was used tocalculate SMD [5] while running 50 iterations afterresolving the flow field. Figure 2. D32 results at z = 10 mm Figure 3. Axial Velocity results at z= 10 mm Spray Plume Characteristics at Multiple Cross-Flow Angles, the D32 values at y<5 mm (inside of hollow cone)remain nearly identical with and without the windtunnel, while the D32 values at y>5 mm (outside ofhollow cone) increase by approximately 5-20%. Inaddition to the reduced count of small droplets in they>5 mm, the zero velocity spray environment maycause additional breakup of the largest droplets in theoutside region due to shear on the droplets surfaces. The difference on the inside and outside of the hollowcone profiles are also seen in the axial velocityresults. As with the D32 results, the velocity values aty <5 mm are very similar with and without the windtunnel in operation. The y>5 mm region exhibitsa much higher velocity with the wind tunnel inoperation. This is clearly due to the co-flow air streamthat is maintaining the droplet velocities, and perhapseven accelerating the drop velocities due to theslightly higher wind tunnel velocity (15.4 m/s) than theinitial droplet axial velocity (13.3 m/s). PDI at Downstream Distance: z= 600 mm The drop size and velocity results at the z = 600 mmlocation provide good incite to the effects of variouscross-flow angles. Figures 4 and 5 provide the PDIresults at this downstream location. In Figure 4, the effect of various nozzle angles(relative to the purely axial cross stream air flow)onthe D32 distribution results are demonstrated. As thenozzle orientation angle is increased, the D32 valuesdecrease at each positive y-location from the windtunnel centerline (y=0). For each incident angle, theD32 values increase as the distance from the nozzle(and wind tunnel) centerline is increased. This trendfollows the expected results due to the larger (highermomentum) particles being sprayed at increasinglylarger incident angles. The extents of the data(-100
确定


还剩6页未读,是否继续阅读?

产品配置单
北京欧兰科技发展有限公司为您提供《多横流角喷流羽流中喷射液滴粒径和速度检测方案(激光干涉仪)》,该方案主要用于其他中喷射液滴粒径和速度检测,参考标准--,《多横流角喷流羽流中喷射液滴粒径和速度检测方案(激光干涉仪)》用到的仪器有激光相位多普勒干涉仪LDV,PDI,PDPA,PDA

相关方案
更多
该厂商其他方案
更多