


方案详情
文
通过激光烧蚀定量映射在组织金属 - 电感耦合等离子体 - 质谱(LA-ICP-MS)是一个灵敏的分析技术,可以提供新的见解金属如何参与正常功能和疾病过程。在这里,我们描述了在小鼠神经组织的超薄切片定量成像金属的协议。
金属在整个生物体中无所不在,用自己的特定解剖区域内的两种化学活性和数量决定的生物学作用。内的脑,金属有一个高度条块分配,这取决于它们对中枢神经系统中发挥主要作用。成像金属的空间分布提供了独特的见解入脑的生化结构,允许神经解剖学区域及其对于金属依赖性过程的已知功能之间的直接相关性。此外,若干与年龄相关的神经障碍功能部件打乱金属动态平衡,这通常限于那些否则难以分析大脑的小区域。在这里,我们描述了一个全面的方法在小鼠大脑成像定量金属,使用激光烧蚀 - 电感耦合等离子体 - 质谱(LA-ICP-MS)和特别设计的图像处理软件。着眼于铁,铜和锌,这三种大脑内的最丰富和疾病相关的金属,我们描述了样品制备,分析,定量测量和图像处理的基本步骤,以低微米内产生金属分布图分辨率范围。这种技术,适用于任何切割组织切片,能够表现出一个器官或系统内的金属的高度可变分布的,并且可以用于识别在金属体内平衡和优良的解剖结构内的变化的绝对水平。
方案详情

Journal of Visualized Experimentswww.jove.com Video Article Imaging Metals in Brain Tissue by Laser Ablation-Inductively CoupledPlasma -Mass Spectrometry (LA-ICP-MS) Dominic J. Hare12, Kai Kysenius, Bence Paul, Beate Knauer5, Robert W. Hutchinson’,Ciaran O'Connor’, Fred Fryer, Tom P. Hennessey,Ashley l. Bush², Peter J. Crouch, Philip A. Doble 'Elemental Bio-imaging Facility, University of Technology Sydney “Florey Institute of Neuroscience and Mental Health, The University of Melbourne Department of Pathology, The University of Melbourne School of Earth Sciences, The University of Melbourne Research School, Ruhr University Department of Physiology, Monash University'ESI Ltd., Bozeman Agilent Technologies, Mulgrave Correspondence to: Dominic J. Hare at dominic.hare@uts.edu.au URL: https://www.jove.com/video/55042DOI: doi:10.3791/55042 Keywords: Medicine, Issue 119, imaging, laser ablation, inductively coupled plasma-mass spectrometry, metals, metallomics, neuroscience Date Published: 1/22/2017 Citation: Hare, D.J., Kysenius,K., Paul, B., Knauer, B., Hutchinson, R.W., O'Connor, C., Fryer, F., Hennessey,T.P., Bush, A.l., Crouch, P.J.,Doble, P.A. Imaging Metals in Brain Tissue by Laser Ablation-Inductively Coupled Plasma - Mass Spectrometry (LA-ICP-MS). J. Vis. Exp. (119),e55042, doi:10.3791/55042(2017). Abstract Metals are found ubiquitously throughout an organism, with their biological role dictated by both their chemical reactivity and abundance withina specific anatomical region. Within the brain, metals have a highly compartmentalized distribution, depending on the primary function they playwithin the central nervous system. Imaging the spatial distribution of metals has provided unique insight into the biochemical architecture ofthe brain, allowing direct correlation between neuroanatomical regions and their known function with regard to metal-dependent processes. Inaddition, several age-related neurological disorders feature disrupted metal homeostasis, which is often confined to small regions of the brainthat are otherwise difficult to analyze. Here, we describe a comprehensive method for quantitatively imaging metals in the mouse brain, usinglaser ablation- inductively coupled plasma- mass spectrometry (LA-ICP-MS) and specially designed image processing software. Focusing oniron, copper and zinc, which are three of the most abundant and disease-relevant metals within the brain, we describe the essential steps insample preparation, analysis, quantitative measurements and image processing to produce maps of metal distribution within the low micrometerresolution range. This technique, applicable to any cut tissue section, is capable of demonstrating the highly variable distribution of metals withinan organ or system, and can be used to identify changes in metal homeostasis and absolute levels within fine anatomical structures. Video Link The video component of this article can be found at https://www.jove.com/video/55042/ Introduction The unique redox chemistry of metals facilitates a range of neurological functions, including signal transduction, energy production andneurotransmitter synthesis. In a number of major neurodegenerative diseases, dyshomeostasis of these metals have been both implicatedin disease pathogenesis and identified as potential novel targets for therapeutic intervention. To better understand how metals are involvedin conditions such as Alzheimer’s and Parkinson’s disease (AD and PD,respectively), it is imperative to be able to measure how metaldistribution and levels change within regions adversely affected by the disease process. These changes are often indicative of subtle shifts inthe biochemical reactions that may be intimately linked to the processes that initiate cell death, such as our recently proposed mechanism of ironand dopamine neurotoxicity in PD. Traditionally, metal levels within defined anatomical regions has been achieved through careful excision,digestion and analysis using a rangeof analytical techniques. However, such an approach loses spatial information, which can be critical when disease states being investigatedinvolve small, well-defined regions or specific cell types. A number of analytical methods are available for visualizing metals in biologicalsystems, from intact samples to tissue sections and in two and three dimensions, using emission spectroscopy, fluorescent probes and massspectrometry". Each technique has advantages and disadvantages regarding sensitivity, selectivity of chemical species, and the spatialresolution that can be achieved. For a comprehensive overview of the range of techniques available, see the review by Hare et al.. Mass spectrometry (MS)-based methods are the most sensitive of these techniques, capable of measuring most biologically relevant metals attheir native concentration°. Laser ablation- inductively coupled plasma-mass spectrometry (LA-ICP-MS) imaging employs a focused ultraviolet laser beam ranging in size from 1 to >100 pm in diameter (or width,when a quadrilateral beam shape is used), under which the sample ispassed. Quantitative information can be achieved through the representative ablation of standard reference materials, which can be producedusing a variety of differing approaches, each with varying degrees of technical difficulty and analytical practicality. The most common approachuses matrix-matching, where a standard with a predominant chemical makeup comparable to that of the sample is prepared by spiking withthe target analyte and accurately assessed for homogeneity and absolute metal concentration by independent analytical means.Ablationof prepared standards can then be used for external calibration purposes, allowing concentration data from the resultant sample image to beextracted per pixel. Image resolution is determined by both the beam size and speed at which the sample is scanned. The standard quadrupole-design ICP-MS(which account for over 90% of all installed ICP-MS systems worldwide) is a sequential mass analyzer, in that the mass detector cycles throughall selected mass-to-charge ratio (m/z) rather than collecting data simultaneously. Thus, the acquisition time for each cycle of masses mustequate to the time taken for the sample to traverse one width of the laser beam to ensure a pixel representative of the desired resolution isacquired. Laser beam size selection is a crucial parameter that has significant effects on both sensitivity and total analysis time. As laserablation physically removes material that is swept to the ICP-MS by an argon carrier gas, the amount of matter that can be physically detectedby the mass analyzer follows the inverse square law. For example, reducing the laser beam diameter from 50-25 pm results in a reductionof ablated material by a factor of four. Additionally, as a scanning method, smaller beam diameters increase the total time required to ablate aselected area. Therefore, experimental design is essential to balance the necessary spatial resolution with sensitivity needs and time constraints. Imaging by LA-ICP-MS has been applied to a range of samples, matrices and disease states, including animal models of neurological13disorders 1314, traumatic brain injury, distribution of metal-containing anticancer drugs, toxicant exposure in the placenta and metaldistribution in teeth as a biomarker of early-life dietary transitions.In this protocol we describe a general method for imaging iron, copper andzinc in the WT mouse brain at a resolution of 30 pm, though it can be easily adapted to a range of sample types and experimental outcomes,based on the needs of the analyst. Protocol Procedures described herein have been approved by the Howard Florey Animal Ethics Committee and adhere to the National Health andMedical Research Council standards of animal care. 1. Preparation of Sample for Analysis NOTE: This step varies depending on the sample matrix to be analyzed. 1.Sample preparation and sectioning NOTE: Fixation using 4% paraformaldehyde (PFA) and cryoprotection in 30% sucrose in 0.1 M PBS will result in varying amounts of leachingof metals from tissue. See Hare et alfor specific details. Ensure all samples have undergone identical fixation and cryoprotection steps.1.Transcardially perfuse the euthanized animal with ice-cold 0.1 M PBS, pH 7.4 (see the Methods section in Dodt et al.for details) andremove the brain. 2Place the brain in 4% PFA O/N to fix the tissue.3456 Cryoprotect the brain by placing it in 30% sucrose in 0.1 M PBS for 24 h, and then change to fresh 30% sucrose for another 24 h. Freeze the brain in a cryostat at -20 °C for at least 1 h. Mount the brain on a chuck using a suitable mounting medium. Section the brain on a cryostat using a metal-free disposable blade (e.g., polytetrafluoroethylene [PTFE]-coated knives) and mount ona standard microscope slide. The optimal thickness for the section should be approximately 30 pm. 2. If using paraffin-embedded samples, section at the desired thickness, float the ribbon onto a warm water bath and mount on standardmicroscope slides. NOTE: Precise effects of long-term fixation and paraffin-embedding of biological samples are not known. As described in 1.1, ensure allsamples have undergone identical sample preparation procedures if comparative analysis is intended. 1.Dewax paraffin-embedded samples by dipping the slide in 3 changes of xylene, 1 change each of: 100% ethanol, 95% ethanol,70%ethanol and a minimum of 3 changes in ISO 3696 or equivalent purified water (hereafter, referred to as 'water; see Hare et al.for adetailed method). 3.Allow samples to air-dry for approximately 1 h in a dust-free environment, such as a slide box with the samples placed vertically in racks andthe lid left ajar. 2. Preparation of Matrix-matched Standards NOTE: The following is a summarized protocol previously published. Please consult the original paper for detailed steps for preparing matrix-matched tissue standards. 1. Obtain commercial lamb brains (or similar) and rinse in water, removing all blood and connective tiss 2.Using a scalpel, carefully dissect approximately 50 g of cortical tissue and partially homogenize using a hand-held tissue homogenizer with a polycarbonate disposable probe on low power. Divide into 5 g aliquots, with the number depending on the calibration range and number ofcalibration points desired. 3.Prepare solutions of metals to spike each standard by dissolving a soluble salt of each analyte(e.g.,FeSO4H2O) in 1% nitric acid to produce0.1, 1 and 100 mg metal mLstocks. 4. Add a pre-calculated volume of the stock solution to the 5 g aliquoted tissue(e.g., 5 pL of 10 mg mL"for an approximate final concentrationof 10 pgg wet tissue)to achieve a range of spiked metal levels in each standard. 1.Ddepending on the desired final concentration of each standard, use a combination of each metal stock solution to ensure the minimalamount of solutions are added to the standard. Add a final spike of water to each standard to ensure equivalent volumes of addedliquid is present in each standard. 2.FHomogenize the spiked standards on low power for approximately 30 s. If not to be used immediately, keep frozen at -20°C in cappedpolypropylene tubes sealed with Parafilm. 5. Determine the accurate concentration and homogeneity of each standard using either of the following procedures: 1. MNicrowave digestion 1. Place 6 accurately weighed (approximately 50 mg) aliquots of a standard in a washed PTFE digestion vessel and add 4 mL ofconcentrated (65%) nitric acid and 1 mL of 30% hydrogen peroxide. Seal and digest at 500 W for 30 min. 2.After cooling the digestion vessel, open in a fume hood and quantitatively transfer the digested solution to an acid-washed 50 mLtube using 10 mL aliquots of water. Make to approximately 50 mL, and accurately weigh the mass of the final solution. 3. Repeat steps 2.5.1.1 -2.5.1.2 for each standard. 2. Use the following procedure if microwave digestion equipment is not available: 1. Place six accurately measured (between 25-200 mg) aliquots of standard into acid-washed/metal-free polypropylene tube andlyophilize O/N. 2.Add 40 pL of concentrated nitric acid and heat, uncapped,on a heating block to 70 °℃ for 5 min, and then add 10 pL of 30%hydrogen peroxide. Heat for a further 5 min, and then accurately make to 1 mL total volume using 950 pL of 1% nitric acid.NOTE: It is advisable to digest a certified reference material using the method of choice to ensure digestion procedures areaccurate. 6.).Determine the metal concentration in each digest solution by solution nebulization ICP-MS using a standard protocol. Assess homogeneityof each standard by determining the relative standard deviation (%RSD) between each aliquot. Ensure %RSDs all fall within 15%.Using themeasured mass of each aliquot, calculate the precise metal concentration of each homogenized tissue standard. 7. Returning to the homogenized tissue standard, pack a 5x5 mm plastic disposable histology mold and freeze in iso-pentane cooled in liquidnitrogen. Remove the frozen standard tissue block from the mold and section on a cryostat at the same thickness as the sample.Note: It is advisable to prepare a number of sections at varying thicknesses for future experiments. Air-dried standards can be storedindefinitely in an air-tight and dust-free container. 3. Preparation of LA-ICP-MS for Analysis 1.Place standards and sample in the ablation chamber, ensuring that they are within the depth of field of the CCD camera fitted to the LA unit.If tuning of the instrument is necessary, include a suitable reference material (e.g., NIST 612 Trace Elements in Glass). Finger-tighten the twoscrews on the chamber door to seal the ablation chamber. 2. In the ICP-MS software, select open the argon gas valve in the 'Maintenance' or similar panel and set the carrier gas flow to 1.2 L min in theappropriate dialogue box. NOTE: In this protocol argon is used as the carrier gas. Several examples use either helium or a mixture of helium and argon as a carriergas. See Gunther and Heinrich"for technical details for using helium and argon mixtures as aerosol carrier gases. 3. In the LA software, click the 'purge' button to flush the cell with argon gas for a minimum of 30 min. NOTE: Purge time can be altered by clicking a 'purge time' or similar button. When using an ablation system with a two-volume ablationcell, periodically move the stage to each corner and diagonally traverse the cell to ensure as much residual air is removed from the cell aspossible. This can be achieved by selecting the 'home stages' or equivalent function. 4. Turn on the ICP-MS by clicking 'plasma on' and allow to warm up for two h, during which steps 3.5- 4.4 can be carried out. Instrumentsettings vary between manufacturers, though an example of appropriate LA-ICP-MS operating conditions can be found in Hare et al..5. Representative ablation of tissue standards 1.SSelect the line tool and draw a single line of ablation approximately 3 mm long across the tissue surface. 2..S.et the parameters as follows by right-clicking the line of ablation in the experiment list and changing the following: beam diameter(selected as appropriate by the user; a 30 pm square beam is used here), scan speed (4 times the beam diameter per second; 120pums) and energy fluence(0.3 -0.5 J cmfor soft tissue; optimize if necessary for harder matrices). At 30 pm tissue thickness thelaser beam does not penetrate the full thickness of this tissue, eliminating any potential contaminant from the microscope support.Normalizing to carboncan be used to correct for variation in the amount of tissue ablated. Set these parameters as the default foreach subsequent line by selecting the 'default' radio button. 3.Duplicate this line six times by selecting the initial line, right-clicking and selecting 'duplicate scans’. Make sure lines are offset in either the x-or y-axis by the beam diameter. This gives a total of seven lines per standard, spaced apart according to the beam diameter. 4.Repeat steps 3.5.1 -3.5.3 for each standard, ensuring the line of identical length. 6.To draw the ablation area over the sample, follow one of the two following methods: NOTE: Ensure the same scan parameters (beam diameter, scan speed, energy fluence) are used for sample lines. 1. If the LA system is equipped with a wide-field of view, select the line tool and draw a line from the top left corner of the sample longenough to cover the sample at its widest point using the same laser parameters outlined in 3.5. Duplicate this scan as outlined in 3.5.3with lines spaced according to the beam diameter as many times as necessary to ensure complete coverage of the sample. 2.If a wide field view is not available, determine and record the x and y coordinates (typically shown on the main screen as 'stageposition' or similar) corresponding to the corners of a rectanglecovering the entire sample. Use these coordinates to position parallellines of ablation covering the entire sample area as described in 3.7.1. 3.Draw lines for intermittent scanning of standards at the latest after ~20 h of scanning the sample by repeating the process described in3.5. Depending on the scan duration of the sample this may be required multiple times. End the experiment with an additional scan ofthe standards. NOTE: When determining the x and y coordinates while the cell is being purged, selecting home positions and the associatedcalibration of the axis will change the previously acquired specifics for the x and y coordinates whereas the difference (i.e. the length ofthe line) will be unaffected. 4. Setting Up Data Acquisition Methods for the ICP-MS 1.For the standard line of ablation, divide the length of the line by the laser scan speed to determine the total analysis time for a single line.Repeat this for the sample line. 2. In the ICP-MS software, create a new method (shown here as a 'batch') and ensure that 'time resolved analysis' or equivalent is selected.Select the m/z values to be detected, and then adjust the integration time for each m/z so the total integration time for one cycle equals 0.25s. Click 'Save Batch As' and name accordingly (e.g., Std1). NOTE: As the sample will traverse the laser beam at four times the beam diameter, this ensures a data point for each mass is recordedequivalent to the beam diameter . For instance, using a 100 pm spot size, a scan speed of 400 pm swith an integration time of 0.25 s willproduce images with true pixel sizes. Integration time can be adjusted to improve sensitivity; when increasing integration time to 0.33 s scanspeed should be slowed to three times the beam diameter. 3. For standards,enter the analysis time for each line scan in the appropriate box, plus an additional 15 s to account for laser warm-up andwashout times. Enter a sample run list (i.e. the order in which scans are run) with the same number of acquisitions (typically numberedsequentially; i.e. 001, 002,etc.) as the total number of standard lines. 4. For the sample, duplicate the method used for the standards by saving the current method or batch with an alternative file name, and adjustthe total acquisition time (including the additional 15 s) and total number of acquisitions to match the number of lines that will ablate thesample. NOTE: As most LA-ICP-MS systems use a one-way trigger (LA triggers ICP-MS), it is essential that the ICP-MS software is awaiting thetrigger from the LA before the subsequent line of ablation commences. The ICP-MS acquisition window will read 'waiting for start'. 5. Running the Experiment 1Start the ICP-MS queue by adding the first method or batch to the queue and ensure the software is awaiting the trigger from the LA system.2In the LA software, enable the laser power supply by clicking 'emission', click 'run' and set the laser warmup time to 10 s and washout time to20 s in the appropriate boxes. Note: This overrun will ensure the ICP-MS is ready to start acquiring new data when the laser commences each subsequent line of ablation.3. Start the laser sequence by clicking 'start'. If using a two-volume cell, ensure the sample cup is in position. 6. Calculating Quantitation Standards NOTE: There are multiple variations for converting ICP-MS data into images. These include the use of home-made software tools written inopen-source languages1724.25, commercial macros2 and data analysis software. Here, use the recently developed software plugin (described in2Paul et al."), based on a specialized LA-ICP-MS data analysis suite28 1.Transfer all the batch folders containing the run data (001.d, 002.d, etc.) on to a separate computer with the analysis software installed.Extract the *.csv data files for each line of the batch into a separate folder. NOTE: Using a script to automatically transfer *.csv files into a new folder is highly recommended. See attached Python code for moredetails. This script has been written to suit either an Agilent 7700 or 8800 Series ICP-MS, but can be edited to suit the output file from othermanufacturers. 2.Open the software platform and follow the tabs sequentially to import and analyze the standards to produce quantitative images as describedbelow. 3. To import the data from the first standard batch, select 'Agilent .csv' for 'File Type', 'Entire folder' for 'lmport type and check that the'Dateformat' is identical with the computer format. Click 'lmport', select the folder containing the .csv-files for the first set of standards, and move tothe 'Baselines' tab. 4. Baseline subtraction 1. Use the 'Automatic Selections' tab (command 2) from the main application dropdown menu in the toolbar, select 'lnformation fromimport' and click 'Continue'. Click 'Select All' and select 'Baseline_1'for integration. 23To select the first 10 s of each scan line (corresponding to the laser warm-up time), crop the data by entering second values '0' and'(duration of line - 10 s)' and click 'Add integrations' (e.g., for a 35 s scan line, enter values '0' and'25'). 5.To select the sample data, use the 'Automatic Selections' tab as described in 6.4, but choose 'Output_1' as the integration. Crop data from thebeginning and end of each standard line to exclude the background signal (e.g. for a 35 s scan line, enter values '13' and '4'). 6. To exclude drops in the signal caused by possible holes in the standards, in the 'Samples'tab, click 'Channels' on the top left of graph area toselect a channel with a high signal to noise ratio (e.g.,C13 or P31). Make a note of any sharp drops in the signal and select a CPS value low enough that is below the normal variation within the samples, but high enough to pick out the sharp drops in the signal.7. Click the 'DRS' tab and select 'Baseline_Subtract' for the 'Current Data Reduction Scheme'. Choose the channel from 6.6 for 'Index Channel' and the CPS value for 'Threshold to use when masking low signals'. Insert a value <0.5 s for 'Seconds to trim before/after low signals' toaccount for the delay in signal transfer from the laser to the ICP-MS. 8.To confirm adequate masking of the low signal areas, click back to the 'Samples' tab and select a processed (e.g.,Fe56_CPS) channel trace.Repeat and refine the CPS and 'Seconds to trim before/after low signals' values as in 6.7 if necessary. 9. ' Click the 'Results' tab and choose 'Export data' from the main application dropdown menu. Enter a file name to generate a spreadsheet datafile of the results (e.g., Std1 calculations, Std2...). 10. Open the data file in a suitable spreadsheet program and calculate the CPS values for each individual channel to be quantitated. Use thepredetermined metal concentrations from the solution nebulization ICP-MS to calculate the conversion factor from CPS values to ppm (ugg)for each quantifiable element. 11. Repeat steps 6.3 - 6.10 for all the sets of standards in the run. 7. Constructing Quantitative Images Write'Biolite()' in the command prompt to open up the software. Import the sample data by clicking "Load Images' and selecting the folder containing the .csv-files for the sample image. Background correction 1.GClick the 'Baselines' tab to apply background correction for the sample. On the phosphorus (P31) image prompted on the screen,select areas of the background using the rectangle draw tool. Selecting as many regions as possible creates an image-wide map ofsignal/plasma drift to ensure adequate compensation from these confounding factors. 2. To make the background signal more visible, select the graph edit tool (top left of the displayed image) and right click the image. Select'Modify Image Appearance' and change the 'First Color at Z=' to a large negative value (e.g.-100,000). Proceed by clicking 'Done'. 4.Click 'Standards' tab to bring up a table for CPS/ppm correction factors. Enter values calculated from the standards in step 6.10 for each ofthe elements. This step will help to correct for the sensitivity drift in the ICP-MS. Click 'Go!' 5Open 'Data Browser' from the 'Data' tab, which holds the images for each element and each step. To finalize an image for export, select the desired image in the 'StdCorrlmages'folder, right-click the image name (*_ppm) and click'Newlmage'. Right-click the image to open 'Modify Image Appearance' to choose a desired color table and color scale. Add a color scale tothe image by right-clicking the image and selecting 'Add Annotation'. Select 'ColorScale' from the top-left dropdown menu and use the tabs tomodify the desired color scale. 7.To export an image, make sure that the image in question is selected and navigate to the 'File' tab and click 'Save graphics...'. Select thedesired format and save the image. Alternatively, the selected image can be transferred using the copy and paste tools. Repeat steps 7.6 and 7.7 for all the images of interest. Quantifying discrete regions 1.To activate the ROl tools, navigate to 'Analysis' tab, 'Packages' and select 'lmage Processing'. 2.SSelect the desired image and navigate to the 'lmage' tab and click 'ROl.... Click 'Start ROl draw' and use a drawing tool to select aregion of interest in the sample. To finish drawing, click 'Finish ROI. To acquire the statistics for the selected ROl, navigate to 'lmage' tab and click 'Stats...'. Copy and paste the results to a separate spreadsheet. Repeat ROI selection (7.9.2) for all regions and elements of interest. Representative Results To demonstrate the capabilities of this LA-ICP-MS imaging approach, a simple experiment using a single section of a WT C57BL/6 mouse brain,bisected at the corpus callosum and sectioned in the coronal plane, is presented. A workflow for the analysis of data using Biolite (Figure 1),as described in Sections 6 and 7, as well as for providing a representative image of metal distribution in the section analyzed (Figure 2) is alsodescribed. As can be seen, metal distribution in the mouse brain is variable according to anatomical region. This can be attributed to the variable rolesmetals, and more specifically the proteins to which they are bound, play in each brain region". For instance, iron tends to have higherconcentrations in the midbrain and along the dentate gyrus, whereas zinc is most abundant in the cortical areas. Carbon, which is a commonlyused internal standard, is homogenously distributed. Elemental maps (Figure 2) can be particularly useful when used in conjunction withexisting anatomical and functional reference atlases, where information on the colocalization of metals can the expression of specific metal-binding proteins can provide insight into the function of metals within a brain region, or changes in metal levels in line with an identified disease-related biomolecule. Using the approach described, which is optimized for a broader range of analytes, does preclude sensitivity for lowabundance elements such as manganese, and methods can be adapted to focus primarily on this analyte by increasing dwell times at theexpense of other measured masses. The major advantage in using imaging by LA-ICP-MS is observing relative differences in metal concentration and distribution betweenexperimental groups. We have previously used such a technique to demonstrate increased iron following a neurotoxin insult mimicking PD210,and changes in cortical iron levels in human Alzheimer’s disease tissue . Such a protocol as described here can be easily adapted to any othertissue type with minimal amendments to the listed methods. Figure 1: Workflow for Image Processing. Workflow complementary to Sections 6 and 7, depicting conversion of raw time resolved data fromthe ICP-MS to quantitative images of metal distribution in the mouse brain. Please click here to view a larger version of this figure. Figure 2: Typical Elemental Distribution of Biometals within a Mouse Brain. Representative element maps of a 30 pm-thick coronal sectionof a single mouse brain hemisphere analyzed with LA-ICP-MS. Images for carbon-13 (C13), magnesium-24(Mg24) and phosphorus-31 (P31)displayed in Gold color scales (counts per second; CPS) (top row). Quantitative images (bottom row) for manganese-55(Mn55), copper-63(Cu63), iron-56 (Fe56) and zinc-66 (Zn66)displayed with corresponding BlueHot color scales (pg g). Total analysis time for the brain sectionwas approximately 5 h. Scale bar=2 mm. Please click here to view a larger version of this figure. Supplementary Code File 1.Open-source Python code described in 6.1, which can be modified using an appropriate Python editor according toICP-MS manufacturer's method of data output. Please click here to download this file. Discussion Imaging metals in neurological tissue is just one example of how this protocol can provide useful information on the distribution and amounts ofmetals in any biological matrix. Although preparation of standard reference materials can be arduous, it is an experiment that can be performedonce and archived for later use. LA-ICP-MS has certain advantages over alternative methods, such as synchrotron-based X-ray fluorescence microscopy, mostly in terms ofaccessibility and sensitivity. However, there are certain disadvantages that should be considered when preparing an experiment using LA-ICP-MS, and as such it is often a useful complementary technique for chemical imaging that includes alternative metal analysis techniques, as wellas comparative histochemistry. Alignment with known anatomical features of the mouse brain can provide useful information on the possible functional relationship betweenmetal levels and spatial distribution. Previously, we have used the Allen Brain Atlas online resource,which is an open-access repository of bothanatomical and gene expression data in the C57BL/6 mouse brain to examine spatial correlation of both metal-dependent enzyme expression"and neuroanatomy30.Other resources, such as the Rodent Brain WorkBench’are also available to assist with registration and alignment ofmetal images to assist in correct identification of metal distribution in often small anatomical regions. Applications of this technique are useful in assessing how metal levels and distribution change at the microscale throughout both normal lifeevents (e.g., aging) and in disease states; as well as studying the effects of both metal-containing compounds and drugs designed to target metal metabolism. The current major limitations of LA-ICP-MS as an imaging technique for spatially assessing metal distribution are throughputand sensitivity. There is a tradeoff between speed of analysis and spatial resolution, with higher resolution images requiring longer analysistimes. The technique is well suited to biological elements at higher concentrations, though elements such as manganese, cobalt and seleniumare restricted due to their low abundance in normal tissue and/or limitations in their detection by conventional ICP-MS. New advances in ICP-MStechnology,such as the introduction of triple-quadrupole mass analyzers, allow for targeted detection of difficult analytes, such as seleniumathigher sensitivities. As a technology-driven procedure, advances in both laser and mass spectrometry design will see this imaging techniquecontinue to evolve, increasing the speed of analysis and sensitivity" Disclosures RWH and COC are paid employees of ESI Ltd. FF and TPH are paid employees of Agilent Technologies Australia. Acknowledgements DJH and PAD are supported by an Australian Research Council Linkage Project (LP120200081) with Agilent Technologies and ESI Ltd. Thecontribution of BK was supported by the Ruhr University Research School PLUS, funded by Germany's Excellence Initiative [DFG GSC 98/3].DJH was partially supported by the Ramaciotti Foundation. KK is supported by the Sigrid Juselius Foundation. References 1. Barnham, K.J., & Bush, A.I. Biological metals and metal-targeting compounds in major neurodegenerative diseases. Chem Soc Rev. 43 (19)6727-6749(2014). 2c.Hare, D.J., & Double, K.L. Iron and dopamine: a toxic couple. Brain. 139 (4), 1026-1035(2016).3 Savory, J., & Herman, M.M. Advances in instrumental methods for the measurement and speciation of trace metals. Ann Clin Lab Sci. 29(2),118-126(1999). 4New, E.J. Tools to study distinct metal pools in biology. Dalton Trans. 42 (9),3210-3219(2013).5 Hare, D.J., New, E.J., de Jonge, M.D., & McColl, G. Imaging metals in biology: balancing sensitivity, selectivity and spatial resolution. ChemSoc Rev. 44 (17),5941-5958(2015). 6. Pozebon, D., Scheffler, G.L., Dressler, V.L., & Nunes, M.A.G. Review of the applications of laser ablation inductively coupled plasma massspectrometry (LA-ICP-MS) to the analysis of biological samples. J Anal At Spectrom. 29 (12),2204-2228 (2014). 7.Becker, J.S., Zoriy, M.V., Dehnhardt, M., Pickhardt, C., & Zilles, K. Copper,zinc, phosphorus and sulfur distribution in thin section of rat brain tissues measured by laser ablation inductively coupled plasma mass spectrometry: possibility for small-size tumor analysis. J Anal AtSpectrom. 20 (9),912 (2005). ( 8. H are, D . J., Austin, C., & Doble, P. Q u antification strategies for elemental imaging of biological samples using laser ablation-inductivelycoupled p lasma-mass spectrometry.The Analyst. 13 7 (7), 1 5 27-1537 (2012). ) ( 9. Hare, D.J., Lear, J., Bishop, D., Beavis, A . , & Doble, P.A. P r otocol for production of mat r ix-matched brain tissue standards for imaging bylaser ablation-inductively coupled plasma-mass s p ectrometry. A n al Meth. 5 (8), 1915-1921 (2 0 13). ) ( 10. Hare, D.J., et al. Quantitative elemental bio-imaging of Mn, Fe , Cu and Zn in 6-hydroxydopamine induced Parkinsonism mouse models.Metallomics. 1 ( 1),53 (2009). ) ( 11. Potter, D. A commercial perspective on the growth and development of the quadrupole ICP-MS market. J Anal At Spectrom.23 (5),690 (2008). ) ( 12. Lear, J., Hare, D.J., Adlard, P., Finkelstein, D., & Doble, P . Improving acquisition times of elemental bio-imaging for quadrupole-based LA- I CP-MS. J Anal At Spectrom. 27 (1),159 (2012). ) ( 13. Matusch, A., et al. Cerebral b ioimaging o f Cu, F e , Zn, a n d Mn in the MPTP mouse model o f Parkinson's disease using laser ablation ) inductively coupled plasma mass spectrometry (LA-ICP-MS). J Am Soc MAss Spectrom.21 (1), 161-171(2010). 14. Hare,D.J., et al. An iron-dopamine index predicts risk of parkinsonian neurodegeneration in the substantia nigra pars compacta. Chem Sci. 5(6),2160-2169 (2014). ( 15. Portbury, S.D., Hare, D . J.,Sgambelloni, C., Finkelstein, D.I., & Adlard, P.A . A t i me-course analysis of changes in cere b ral metal levels f ollowing a controlled cortical i mpact. Metallomics. 8 ( 2), 1 9 3-200(201 6 ). ) 16. Theiner, S., et al. LA-ICP-MS imaging in multicellular tumor spheroids-a novel tool in the preclinical development of metal-based anticancerdrugs. Metallomics. 8, 398-402(2016). 17. Niedzwiecki, M.M., et al. A multimodal imaging workflow to visualize metal mixtures in the human placenta and explore colocalization withbiological response markers. Metallomics. 8, 444-452 (2016). 18. Austin, C., et al. Barium distributions in teeth reveal early-life dietary transitions in primates. Nature. 498 (7453), 216-219 (2013). 19. Hare, D.J., et al. The effect of paraformaldehyde fixation and sucrose cryoprotection on metal concentration in murine neurological tissue. JAnal At Spectrom. 29, 565-570 (2014). 20. Dodt, H.-U., etal.Ultramicroscopy: three-dimensional visualization of neuronal networks in the whole mouse brain. Nat Meth. 4(4),331-336(2007). 21. Hare, D.J., et al. Laser ablation-inductively coupled plasma-mass spectrometry imaging of white and gray matter iron distribution inAlzheimer’s disease frontal cortex. Neurolmage. 137, 124-131(2016). 22. Gunther, D., & Heinrich, C. Enhanced sensitivity in laser ablation-ICP mass spectrometry using helium-argon mixtures as aerosol carrier. JAnal At Spectrom. 14(9), 1363-1368 (1999). 23. Austin, C.A., et al. Factors affecting internal standard selection for quantitative elemental bio-imaging of soft tissues by LA-ICP-MS. J Anal AtSpectrom. 26 (7), 1494-1501(2011). 24. Hare, D.J., et al. Three-dimensional elemental bio-imaging of Fe, Zn, Cu, Mn and P in a 6-hydroxydopamine lesioned mouse brain.Metallomics. 2 (11),745-753(2010). 25. Osterholt, T., Salber, D., Matusch, A., Becker, J.S., & Palm,C. IMAGENA: Image Generation and Analysis - An interactive software toolhandling LA-ICP-MS data. Int J Mass Spectrom. 307 (1-3),232-239(2011). 26. Uerlings, R., Matusch, A., & Weiskirchen, R. Reconstruction of Laser Ablation Inductively Coupled Plasma Mass Spectrometry (LA-ICP-MS)Spatial Distribution Images in Microsoft Excel 2007. Int J Mass Spectrom. 395,27-35(2015). 27. Paul, B., et al. Visualising mouse neuroanatomy and function by metal distribution using laser ablation-inductively coupled plasma-massspectrometry imaging. Chem Sci. 6 (10), 5383-5393 (2015). 28. Paton, C., Hellstrom, J., Paul, B., Woodhead, J., & Hergt, J. lolite: Freeware for the visualisation and processing of mass spectrometric data.J Anal At Spectrom. 26(12),2508(2011). 29. Lein, E.S., et al. Genome-wide atlas of gene expression in the adult mouse brain. Nature. 445 (7124), 168-176(2007). 30. Hare, D.J., et al.Three-dimensional atlas of iron, copper, and zinc in the mouse cerebrum and brainstem. Anal Chem.84 (9), 3990-3997(2012). 31. Hjornevik, T., et al. Three-dimensional atlas system for mouse and rat brain imaging data. Frontiers Neuroinform. 1, 4(2007). 32. Bishop, D.P., et al. Elemental bio-imaging using laser ablation-triple quadrupole-ICP-MS.J Anal At Spectrom. 31 (1), 197-202(2016). 33. Balcaen,L., Bolea-Fernandez,E., Resano, M., & Vanhaecke, F. Inductively coupled plasma-tandem mass spectrometry (ICP-MS/MS): apowerful and universal tool for the interference-free determination of (ultra)trace elements -a tutorial review. Analytica Chimica Acta. 894,7-19 (2015). ( 34. Van Malderen, S . J.M., Managh, A. J ., Sharp, B.L. , & V a nhaecke, F.Rec e nt developments in the design of ra p id response cells for laserablation-inductively coupled plasma-mass spectrometry and their impact on bi o imaging applications. J Anal At Spectrom. 31, 423-439(2016). ) Copyright C Creative Commons Attribution-NonCommercial-NoDerivs . UnportedLicenseJanuary ePage of January e Page of Copyright C Creative Commons Attribution-NonCommercial-NoDerivs . UnportedLicense 通过激光烧蚀定量映射在组织金属 - 电感耦合等离子体 - 质谱(LA-ICP-MS)是一个灵敏的分析技术,可以提供新的见解金属如何参与正常功能和疾病过程。在这里,我们描述了在小鼠神经组织的超薄切片定量成像金属的协议。金属在整个生物体中无所不在,用自己的特定解剖区域内的两种化学活性和数量决定的生物学作用。内的脑,金属有一个高度条块分配,这取决于它们对中枢神经系统中发挥主要作用。成像金属的空间分布提供了独特的见解入脑的生化结构,允许神经解剖学区域及其对于金属依赖性过程的已知功能之间的直接相关性。此外,若干与年龄相关的神经障碍功能部件打乱金属动态平衡,这通常限于那些否则难以分析大脑的小区域。在这里,我们描述了一个全面的方法在小鼠大脑成像定量金属,使用激光烧蚀 - 电感耦合等离子体 - 质谱(LA-ICP-MS)和特别设计的图像处理软件。着眼于铁,铜和锌,这三种大脑内的最丰富和疾病相关的金属,我们描述了样品制备,分析,定量测量和图像处理的基本步骤,以低微米内产生金属分布图分辨率范围。这种技术,适用于任何切割组织切片,能够表现出一个器官或系统内的金属的高度可变分布的,并且可以用于识别在金属体内平衡和优良的解剖结构内的变化的绝对水平。
确定


还剩6页未读,是否继续阅读?

产品配置单
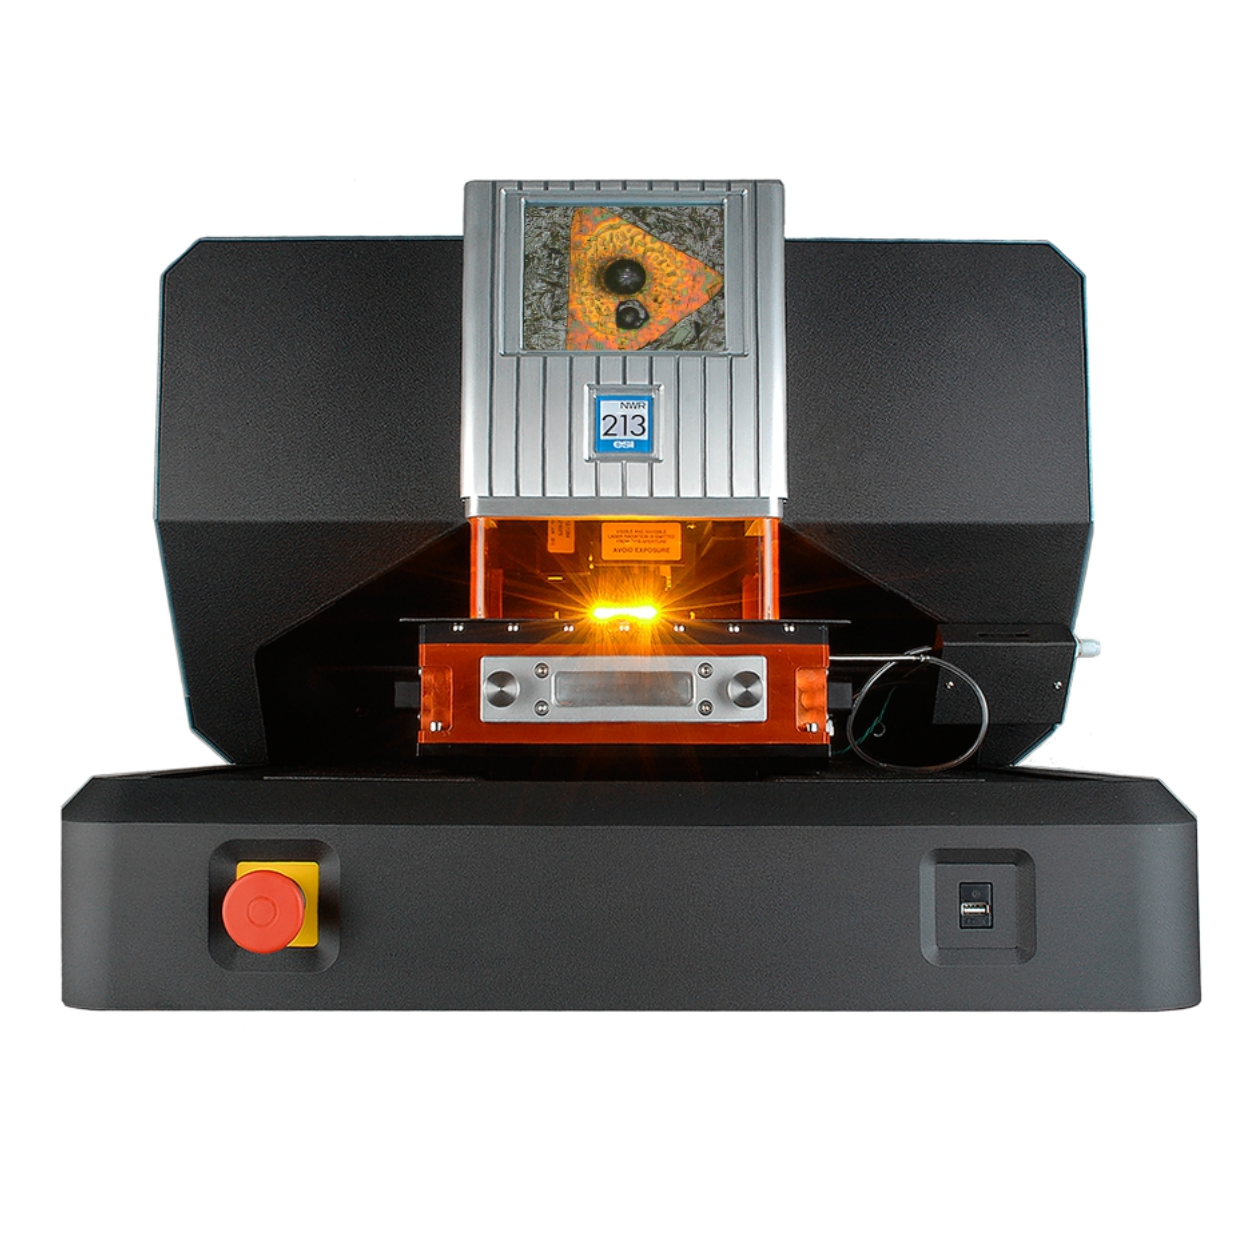
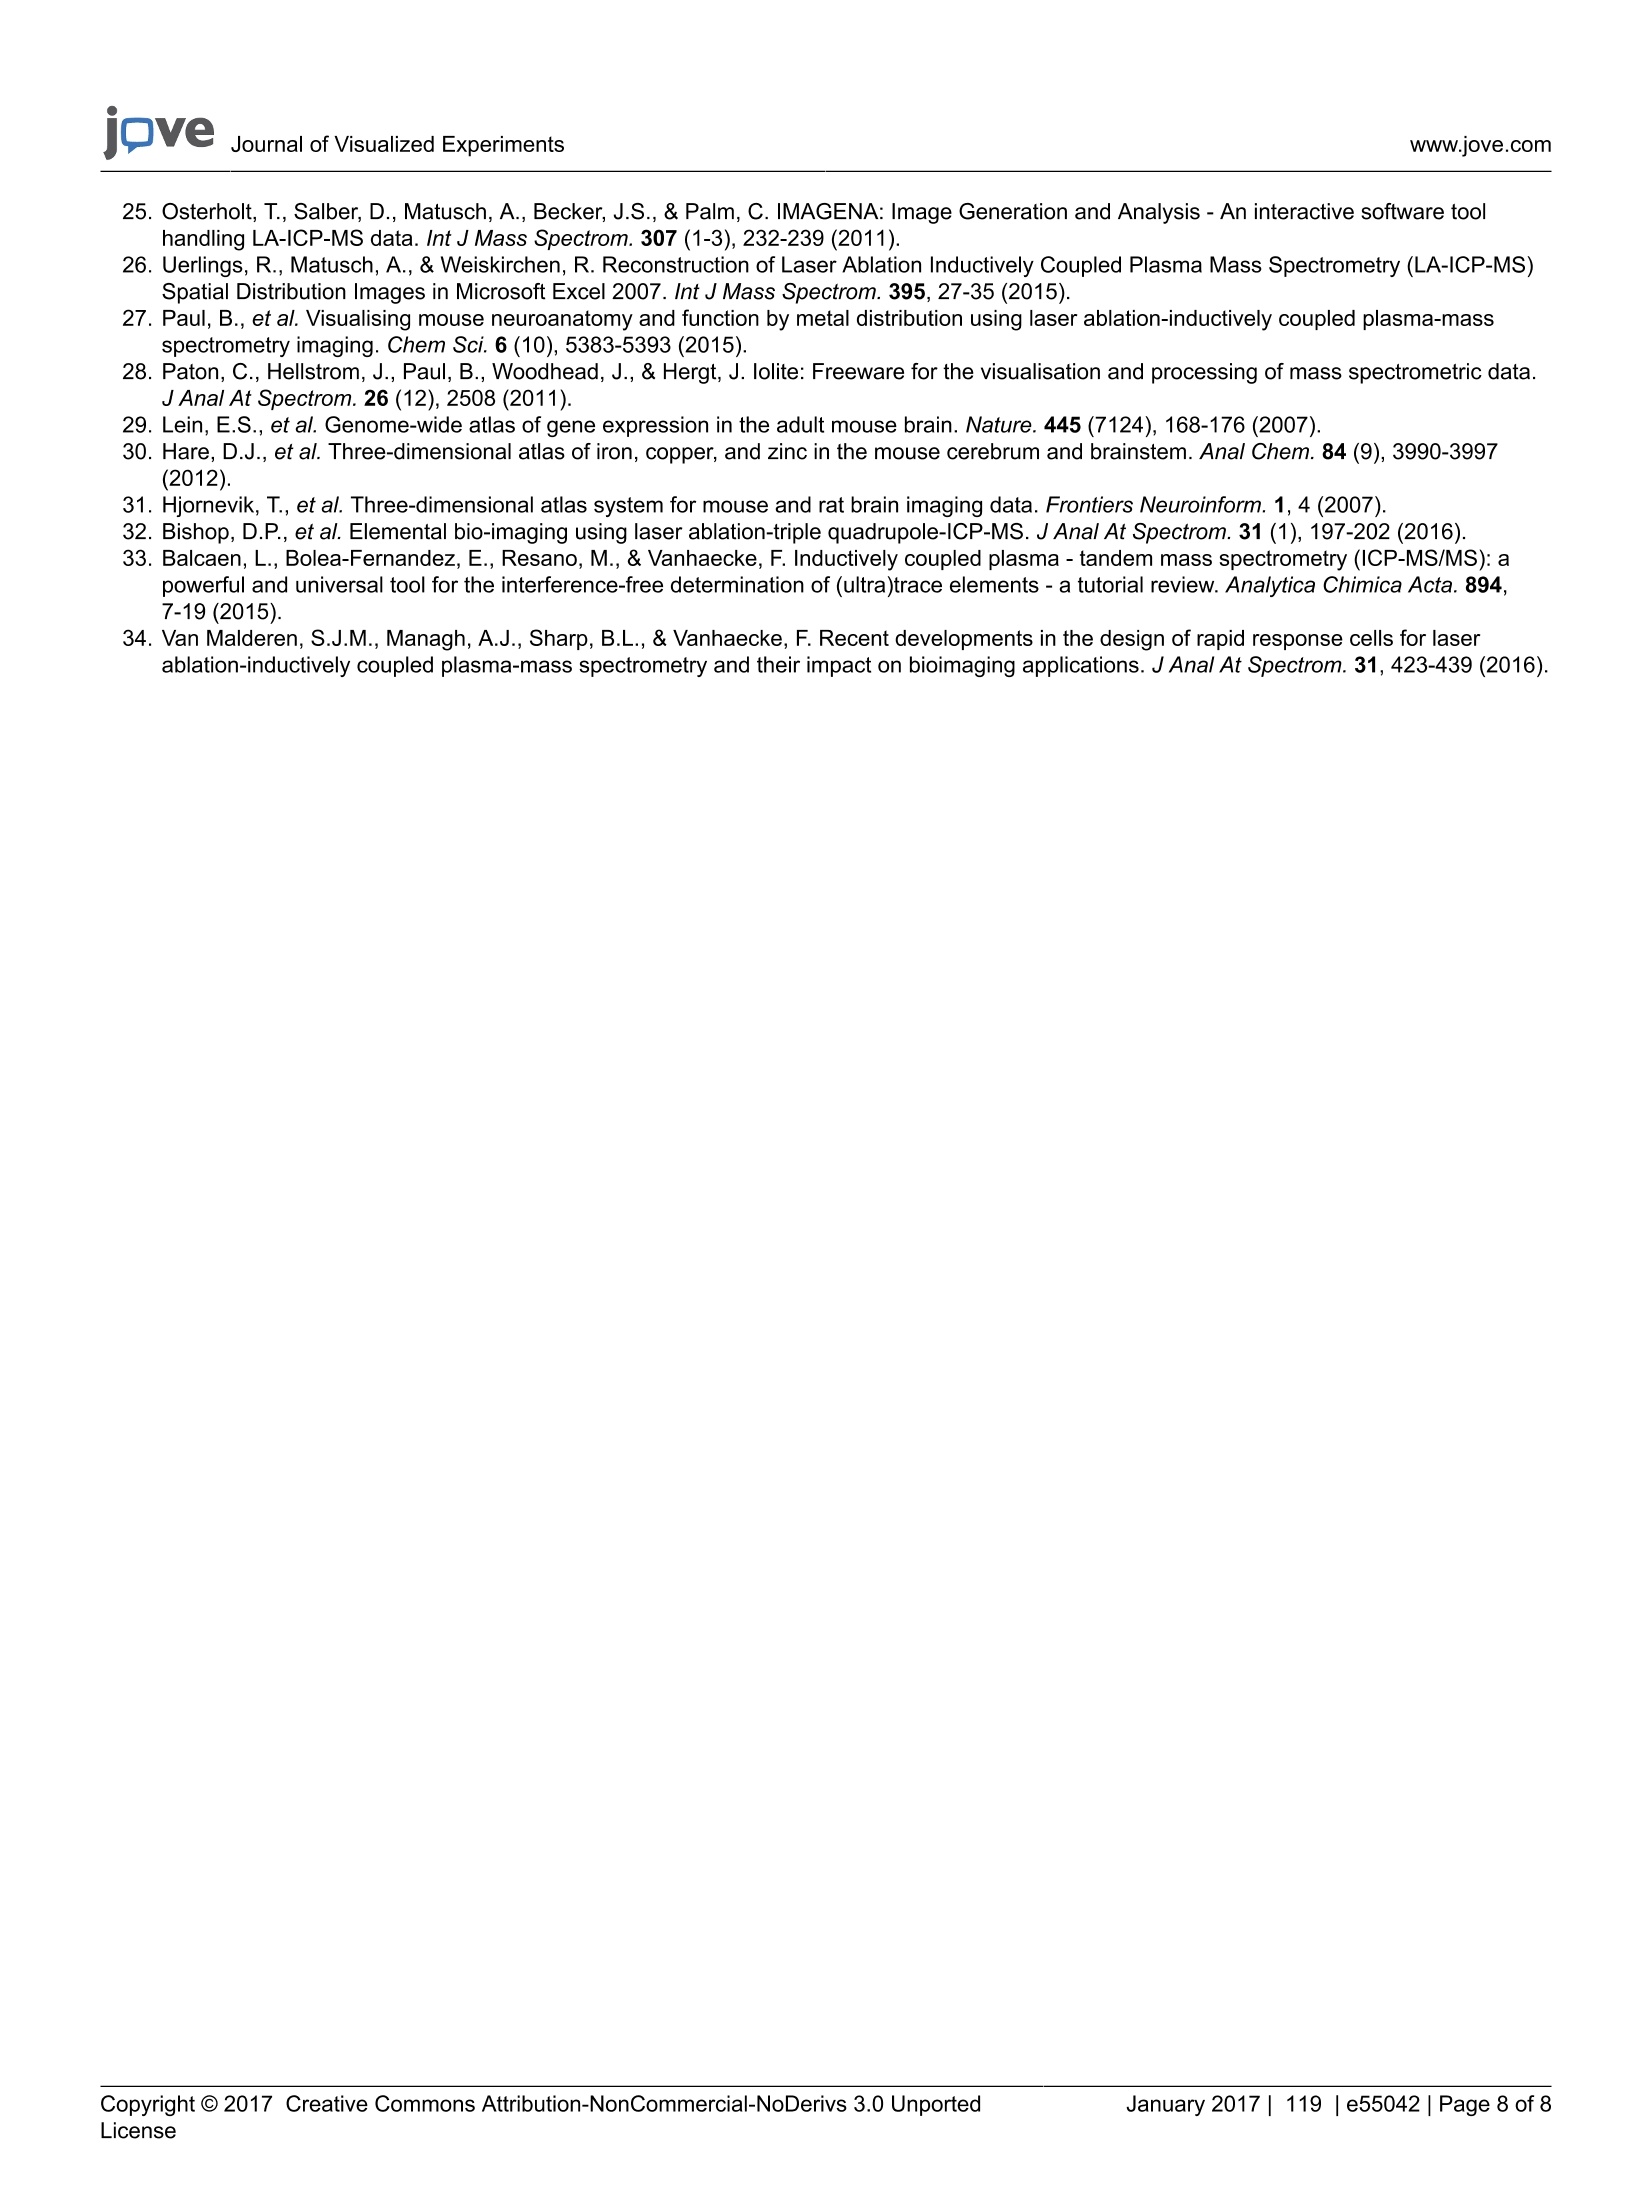
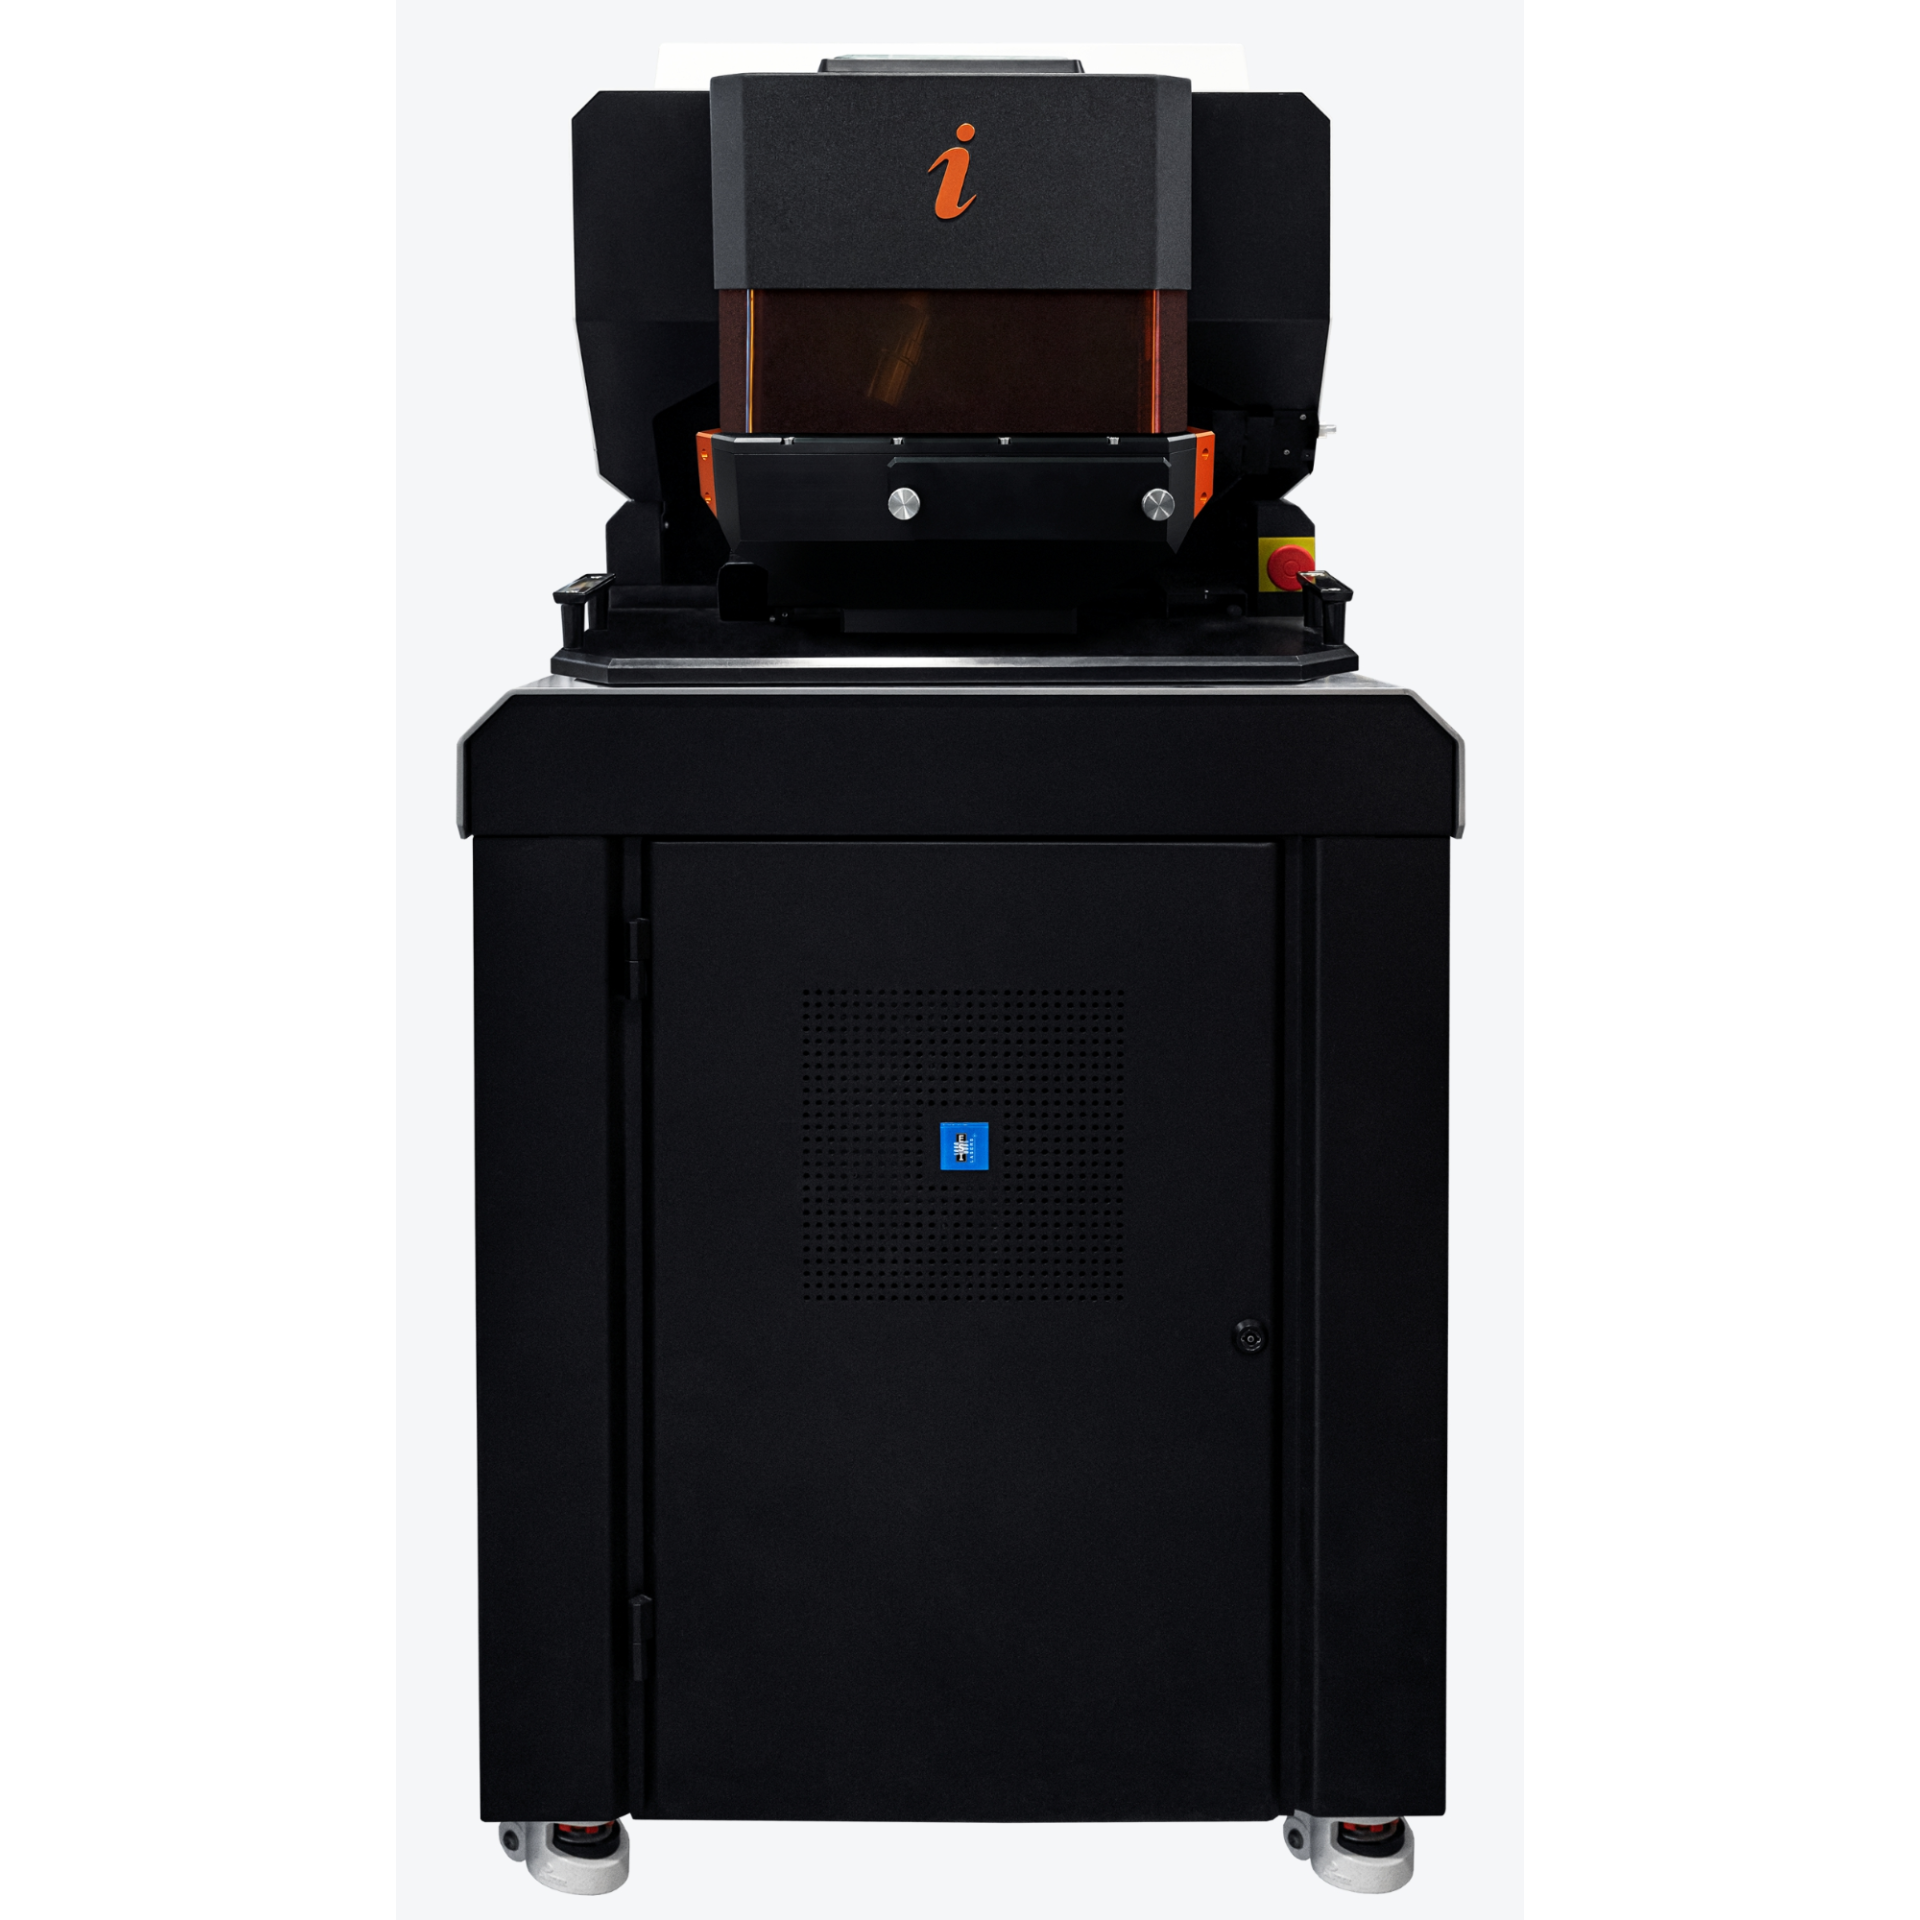
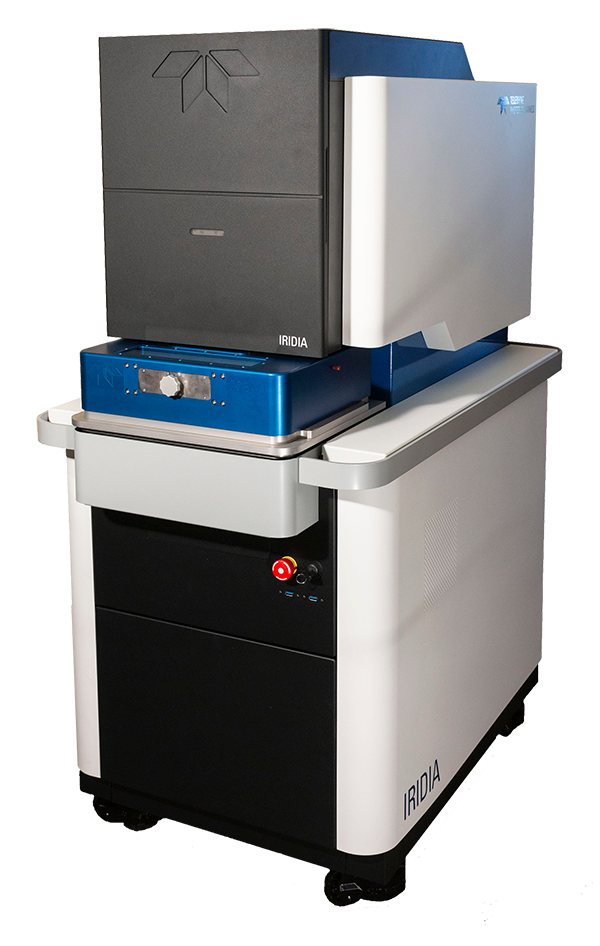
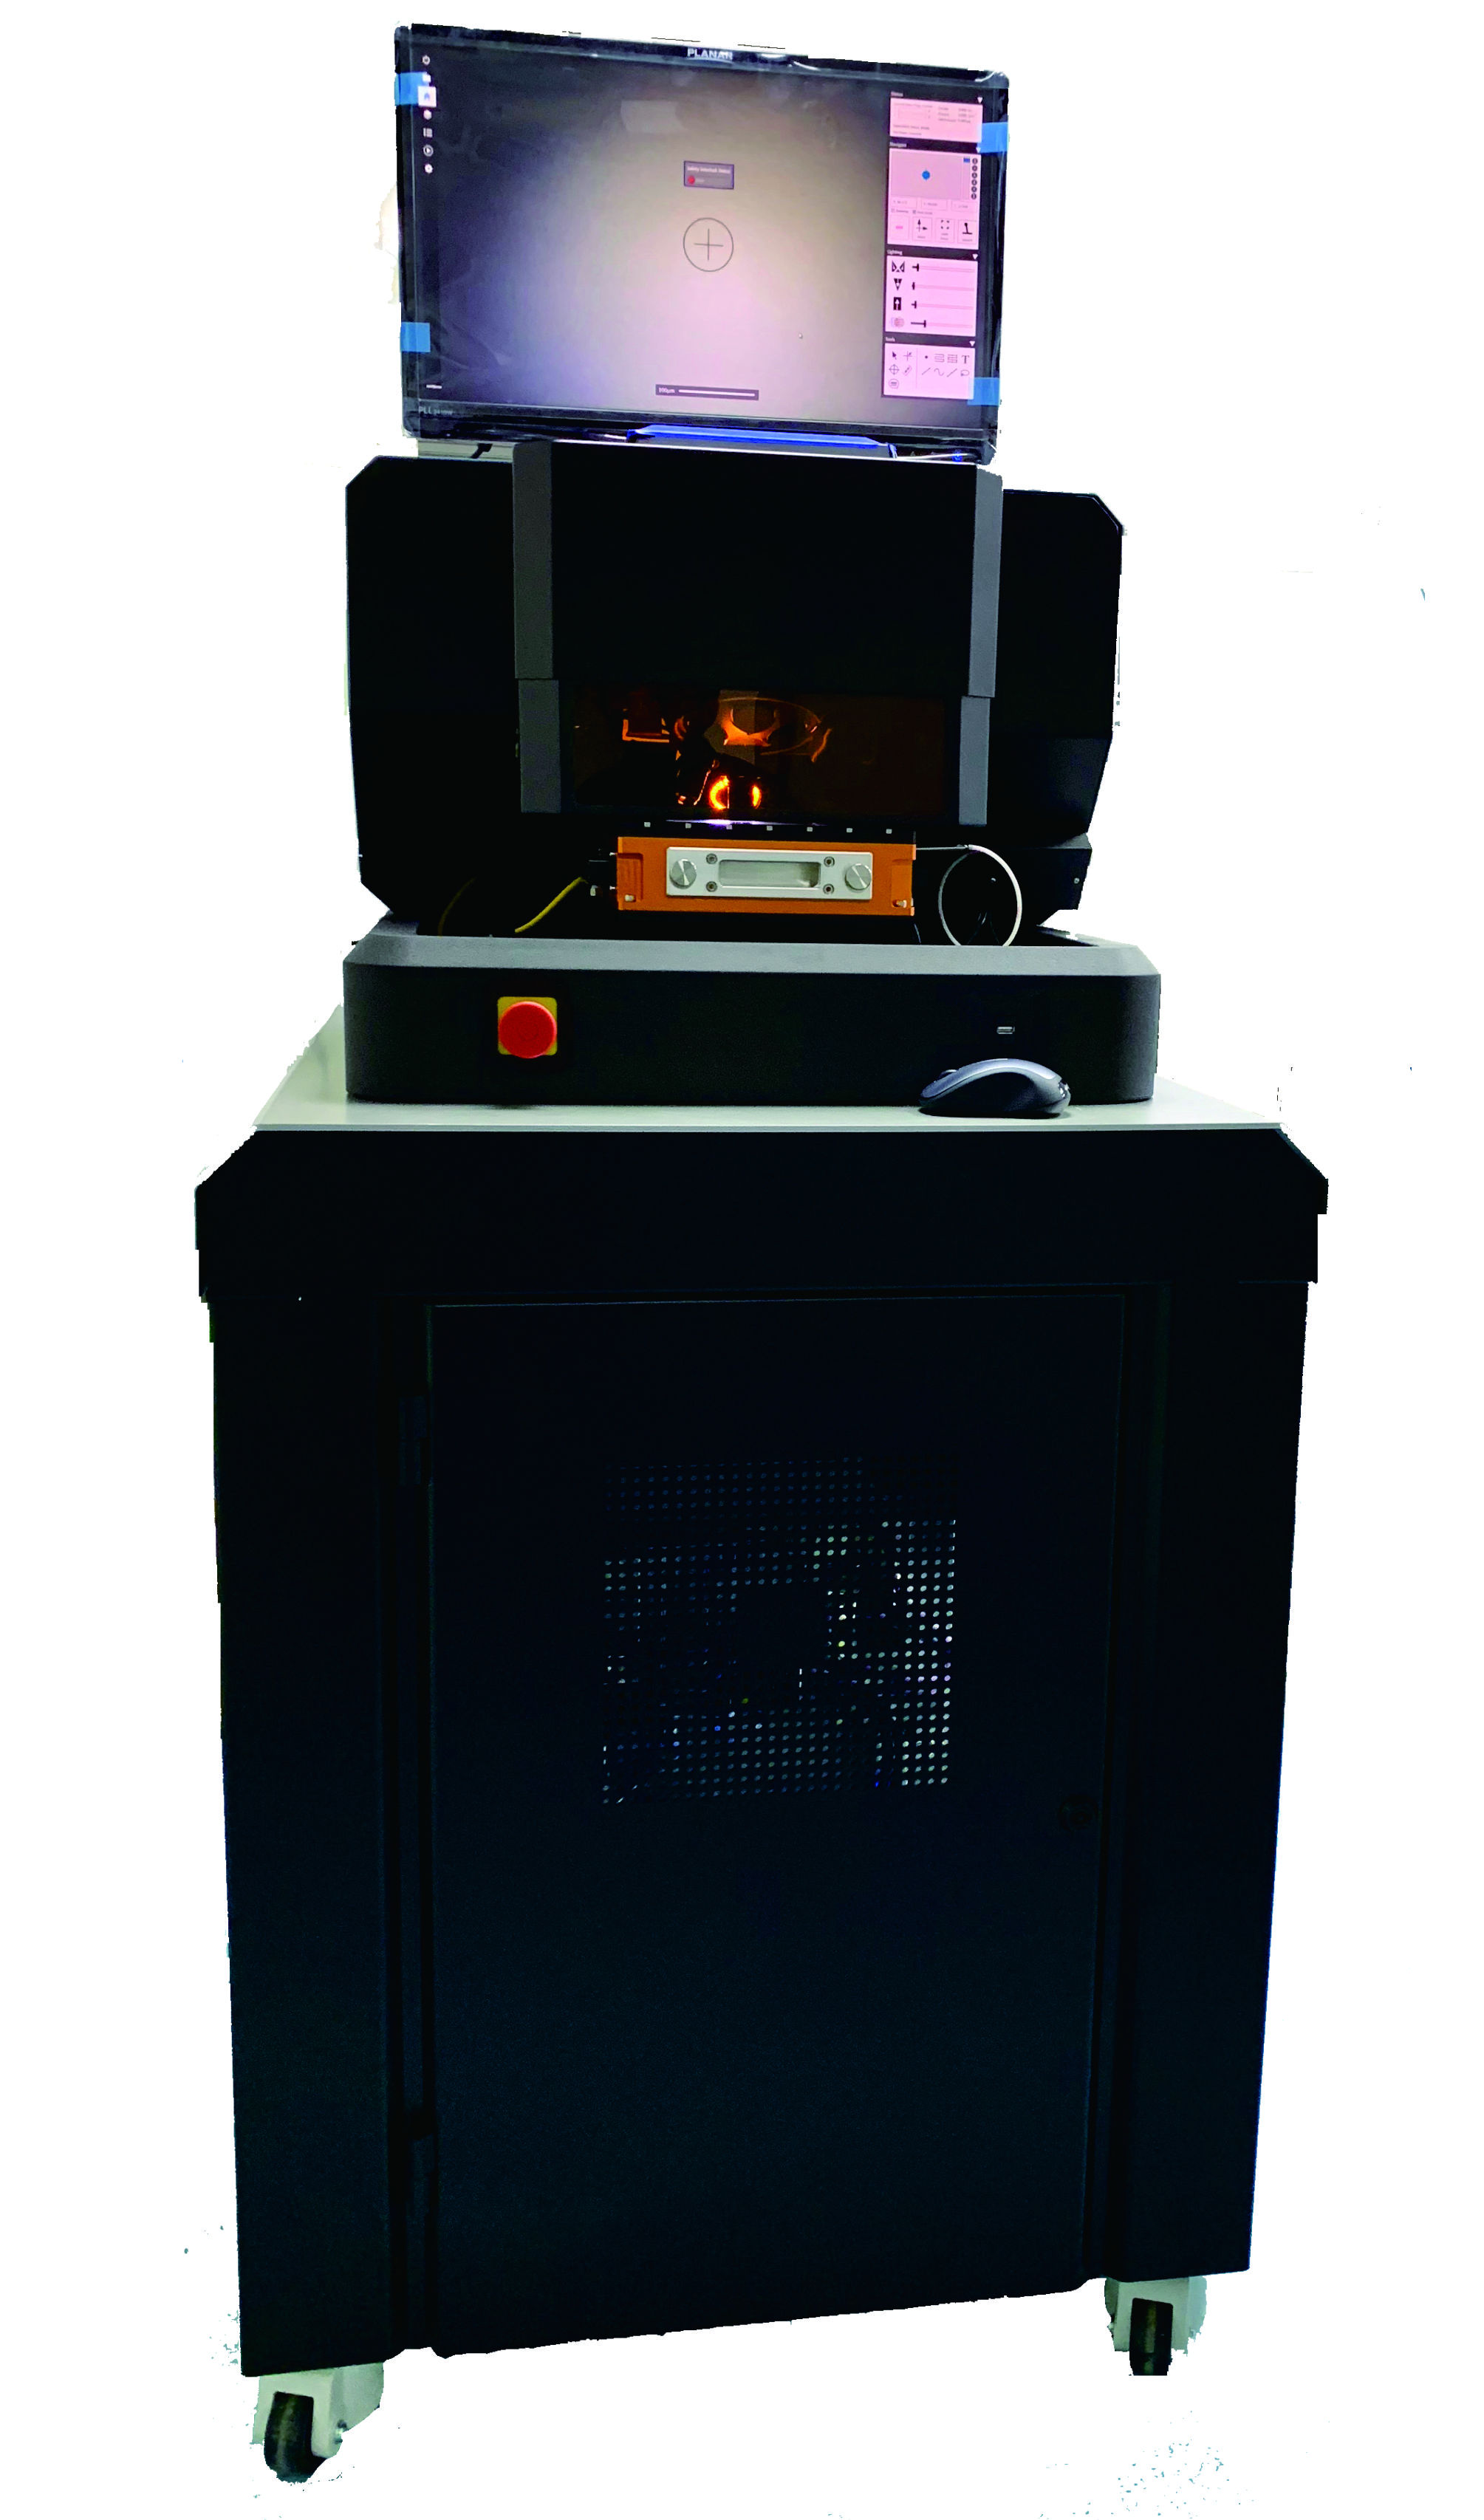
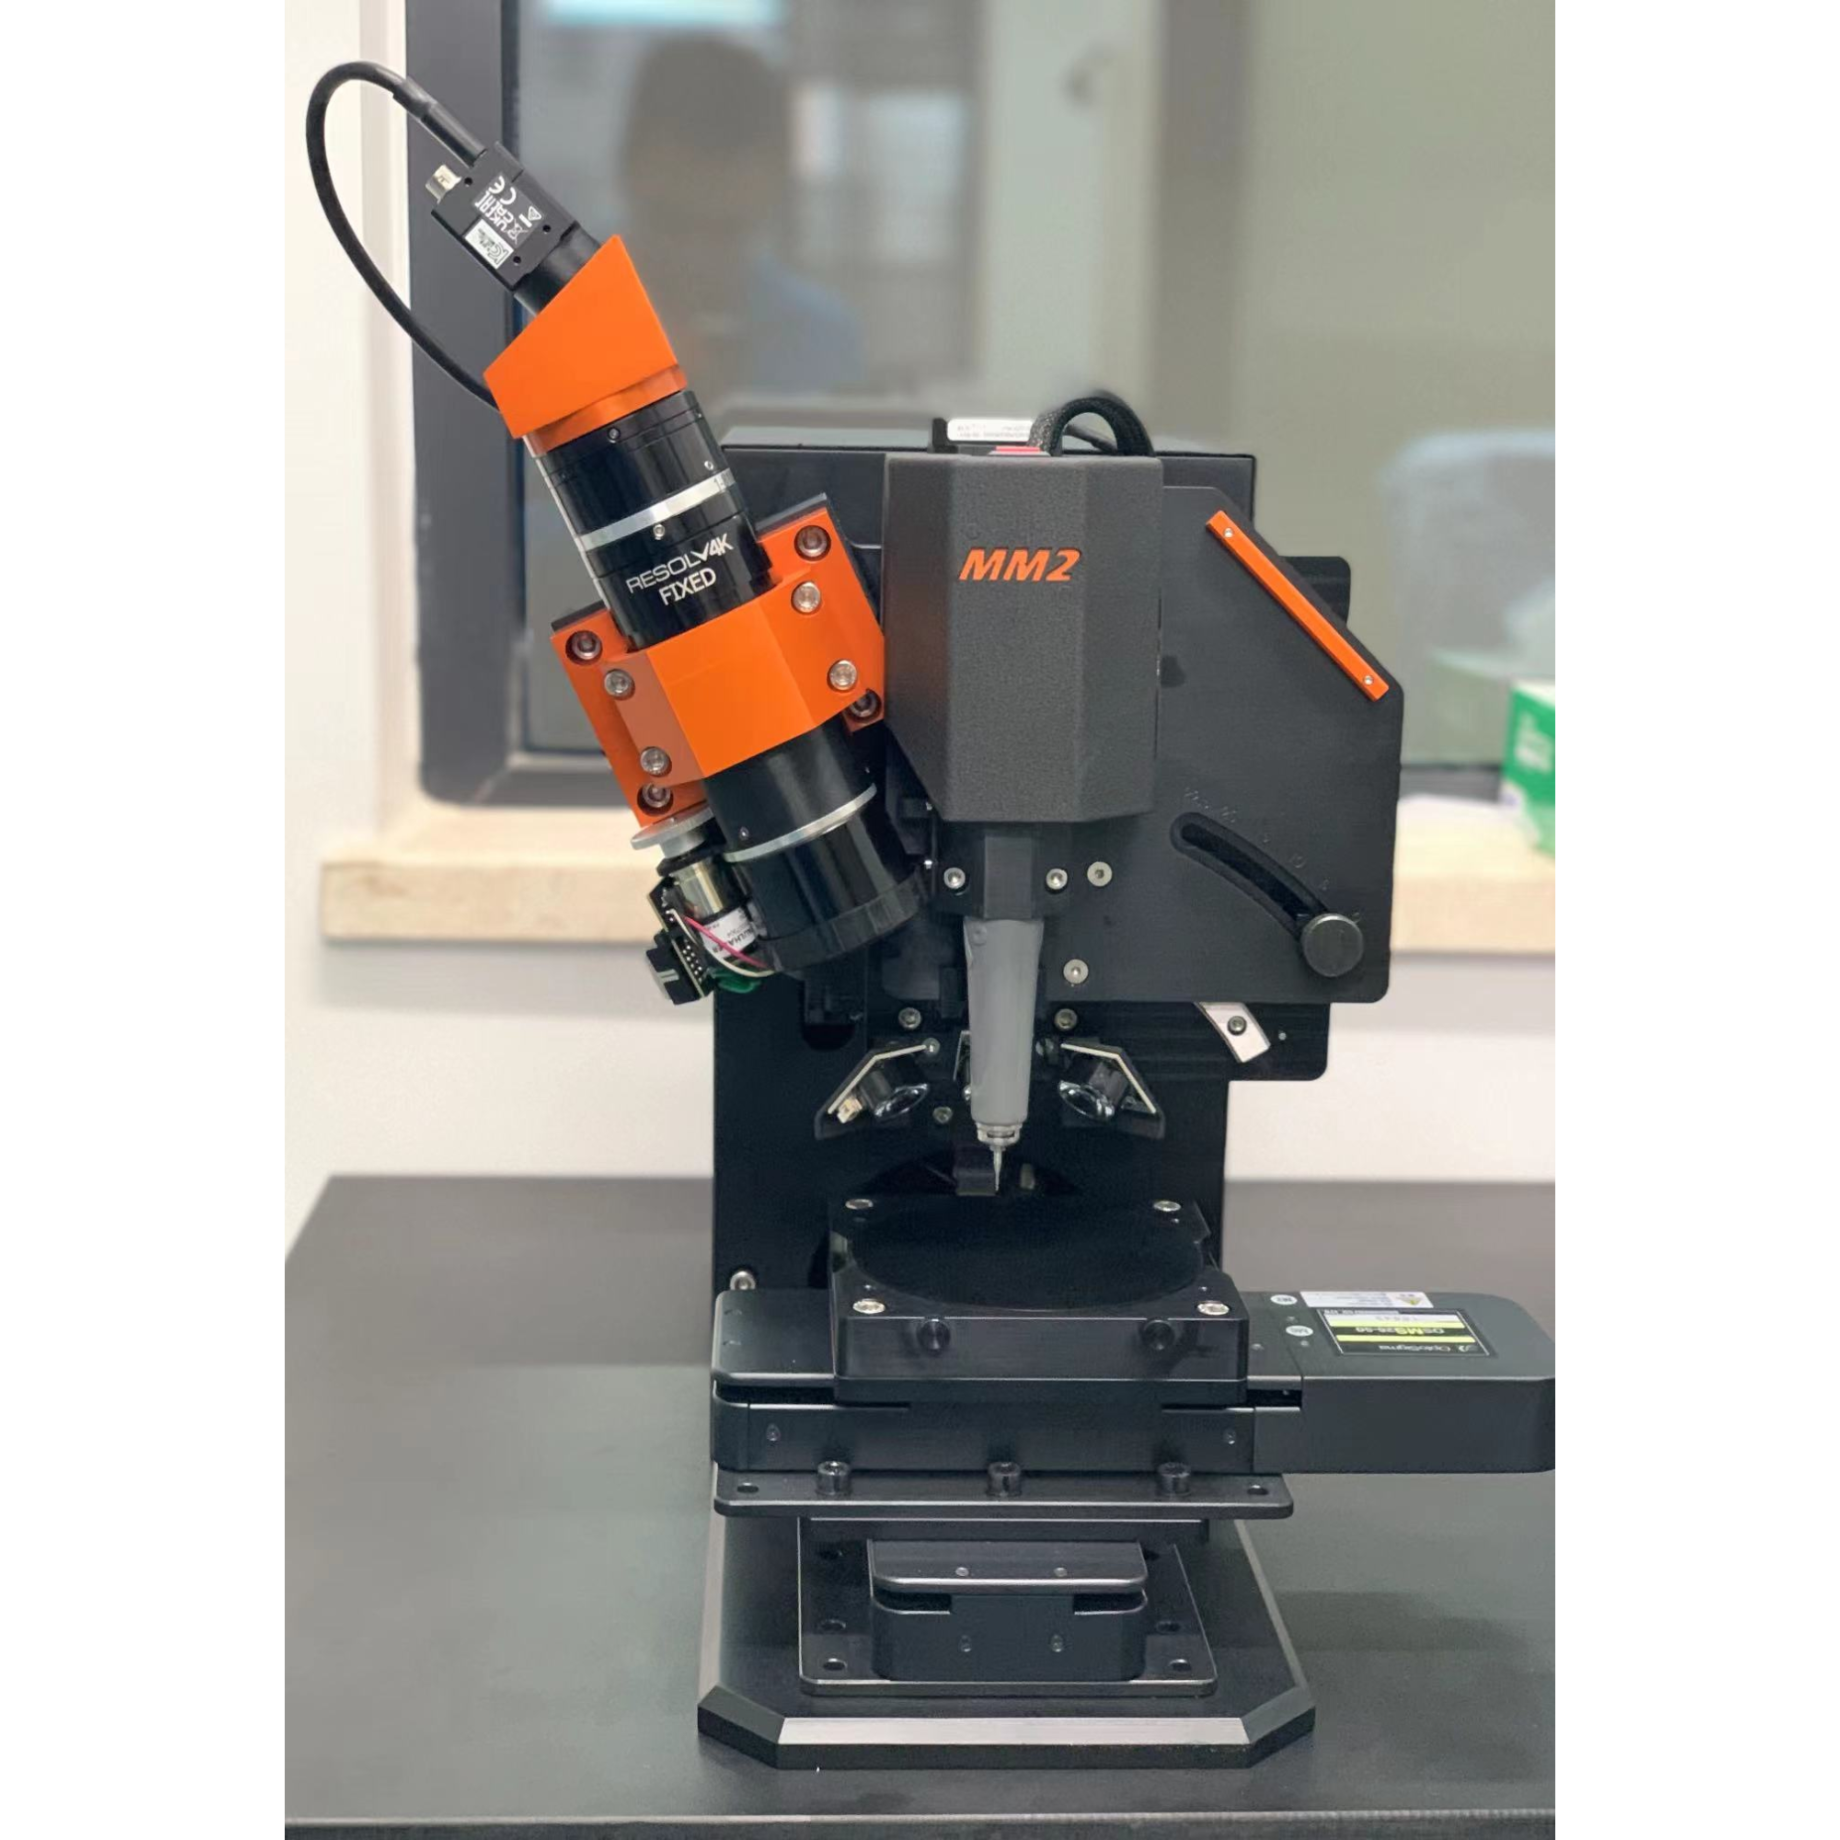
上海凯来仪器有限公司为您提供《脑组织中金属元素成像检测方案(激光剥蚀进样)》,该方案主要用于其他中金属元素成像检测,参考标准--,《脑组织中金属元素成像检测方案(激光剥蚀进样)》用到的仪器有ESL213 灵活的激光剥蚀系统
推荐专场
相关方案
更多
该厂商其他方案
更多