


方案详情
文
细胞对暴露的纳米颗粒反应在各种环境中都是必不可少的,尤其是在纳米毒性和纳米医学中。这里,14纳米金纳米粒子在3T3成纤维细胞在一系列脉冲追踪实验研究了30分钟孵化脉冲和追逐时间从15分钟到48小时。里面的金纳米粒子及其聚合量化细胞超微结构的激光烧蚀电感耦合等离子体质谱法,可以用于评估表面增强拉曼散射(SERS)信号。通过这种方法,可以分别获得它们在微米尺度上的定位信息和它们的分子纳米环境,并且可以将它们联系起来。因此,纳米颗粒从细胞内摄取、细胞内加工到细胞分裂的路径是可以遵循的。结果表明,细胞内纳米粒子及其积聚和聚集支持高SERS信号的能力与纳米粒子的数量和高局部纳米粒子密度没有直接关系。SERS数据表明,细胞内聚集的几何形状和粒间距离必须在内体成熟过程中发生变化,并对特定的金纳米粒子类型起关键作用,才能成为高效的SERS纳米探针。这一发现得到了TEM图像的支持,它只显示了一小部分具有小颗粒间距的团聚体。经过不同的捕集时间后得到的SERS光谱显示,金纳米粒子内体加工后,其生物分子电晕的组成和/或结构发生了变化。
方案详情

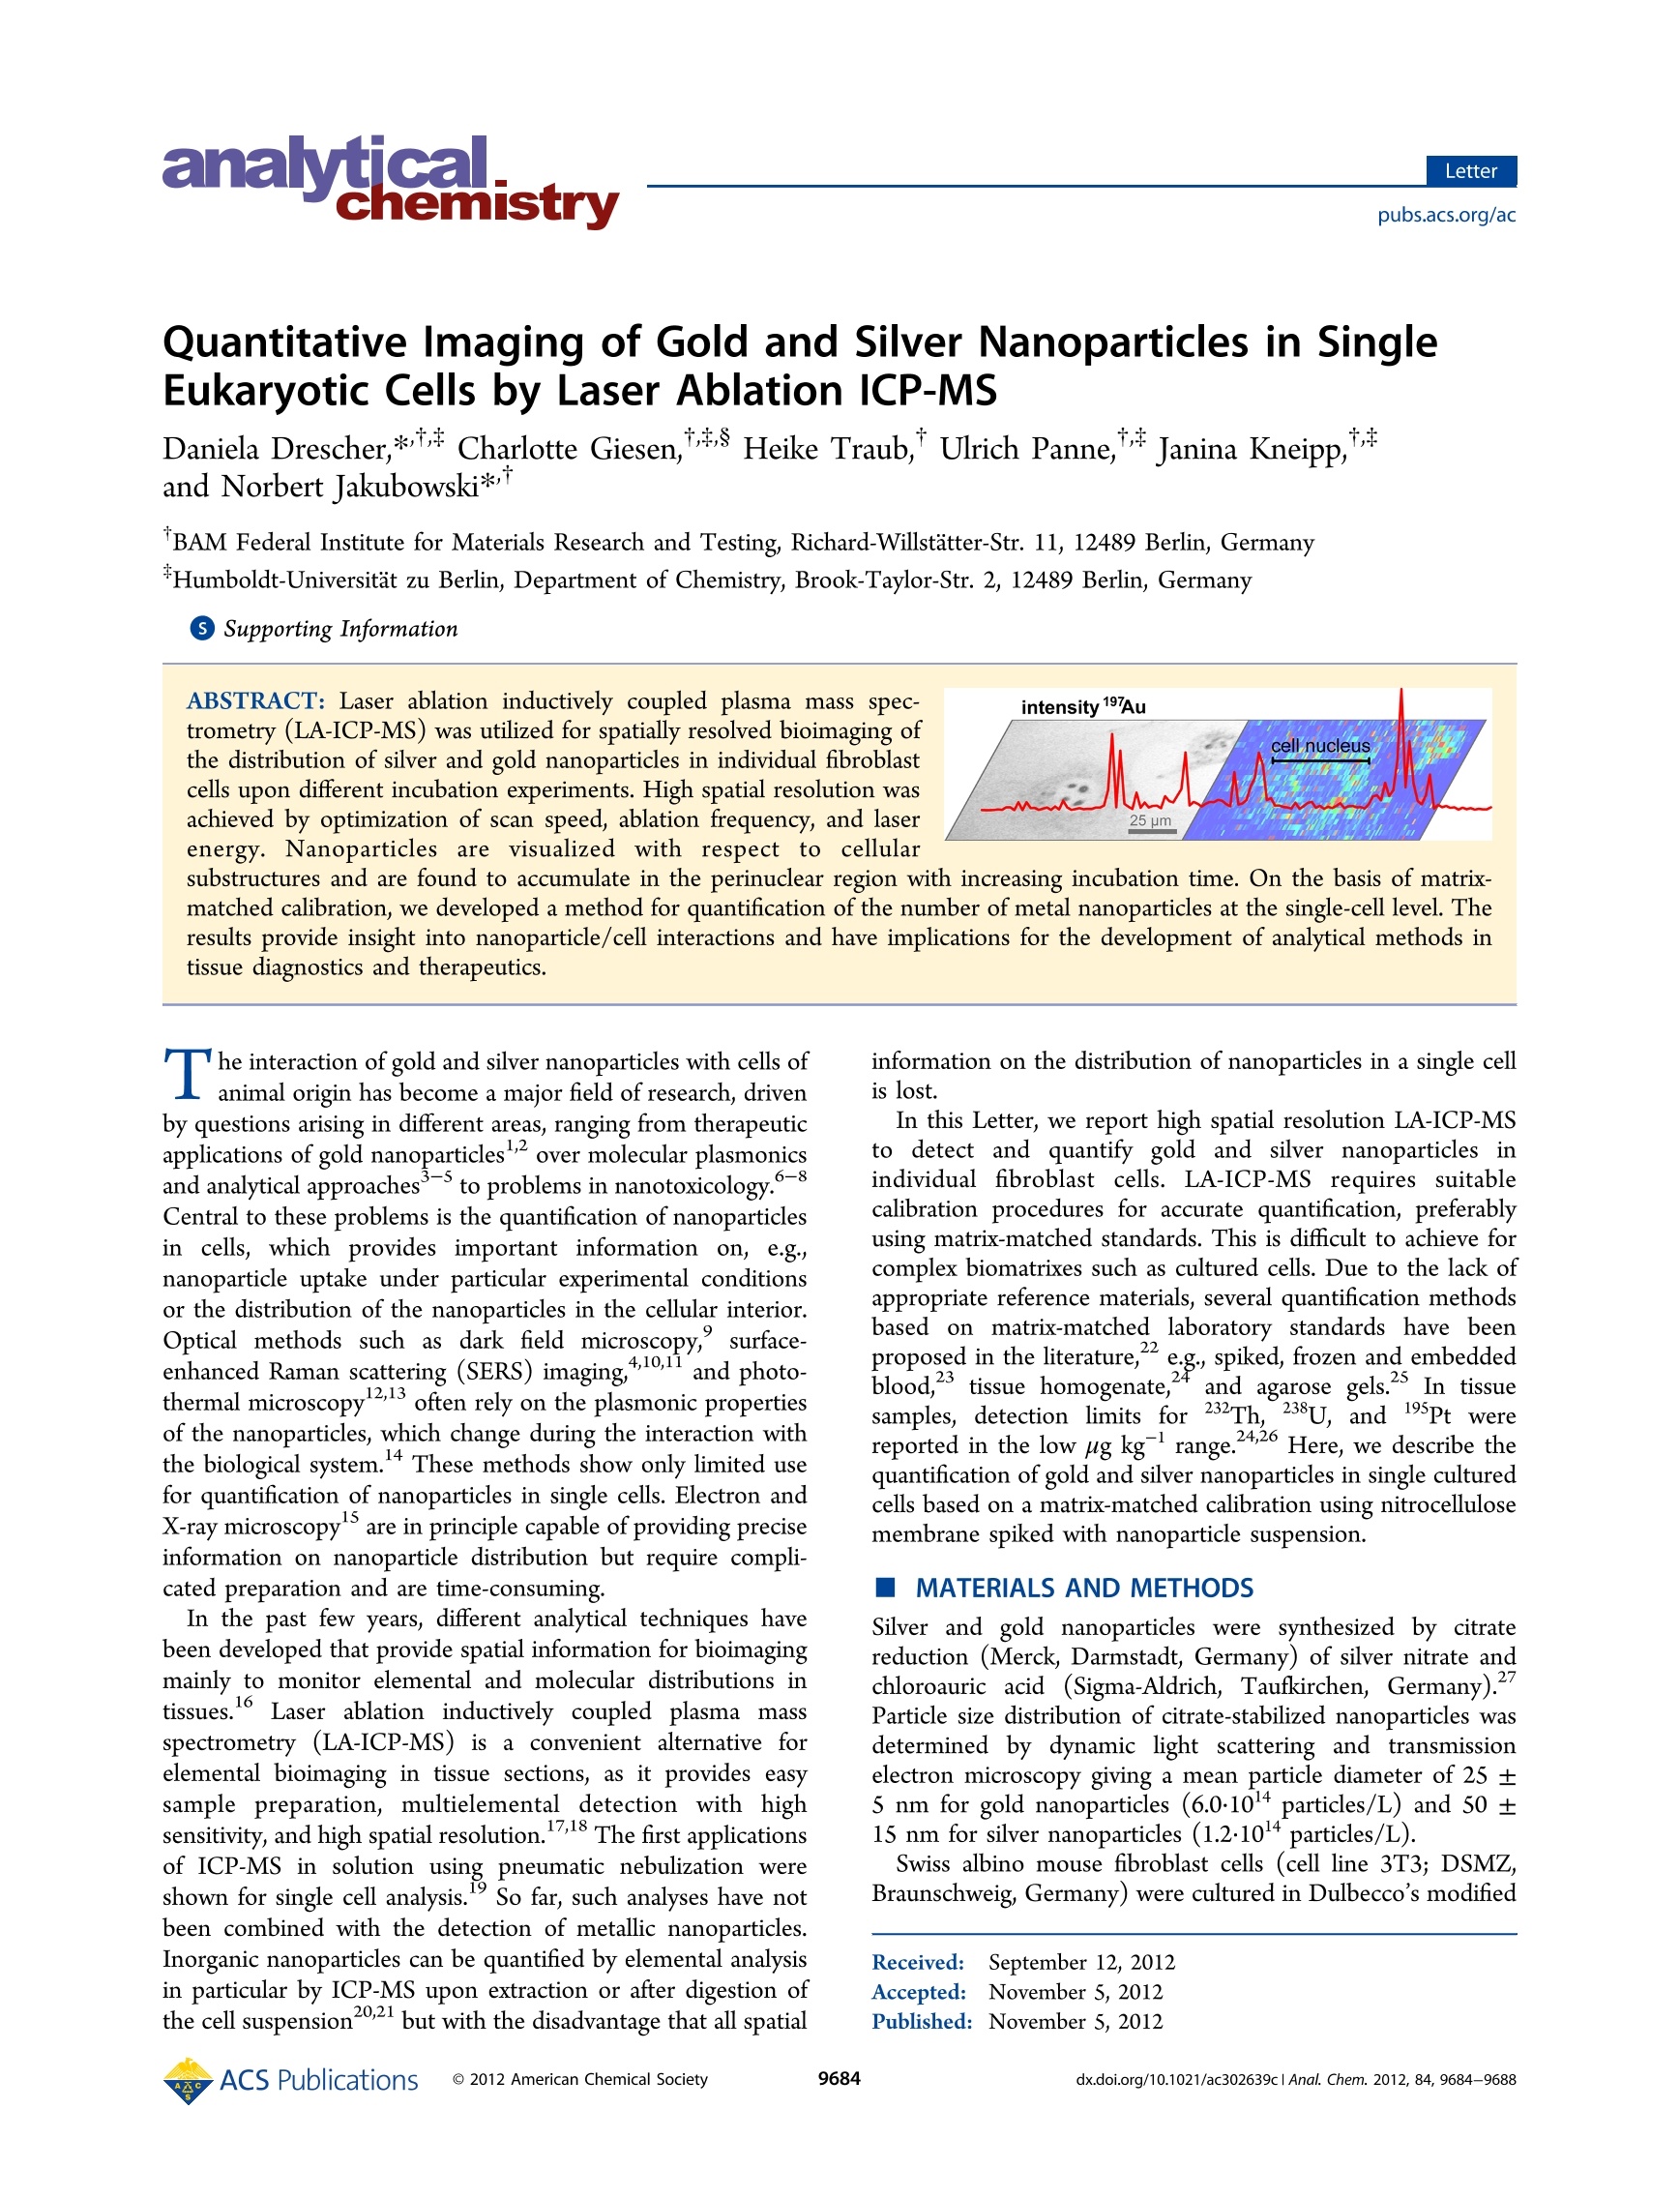
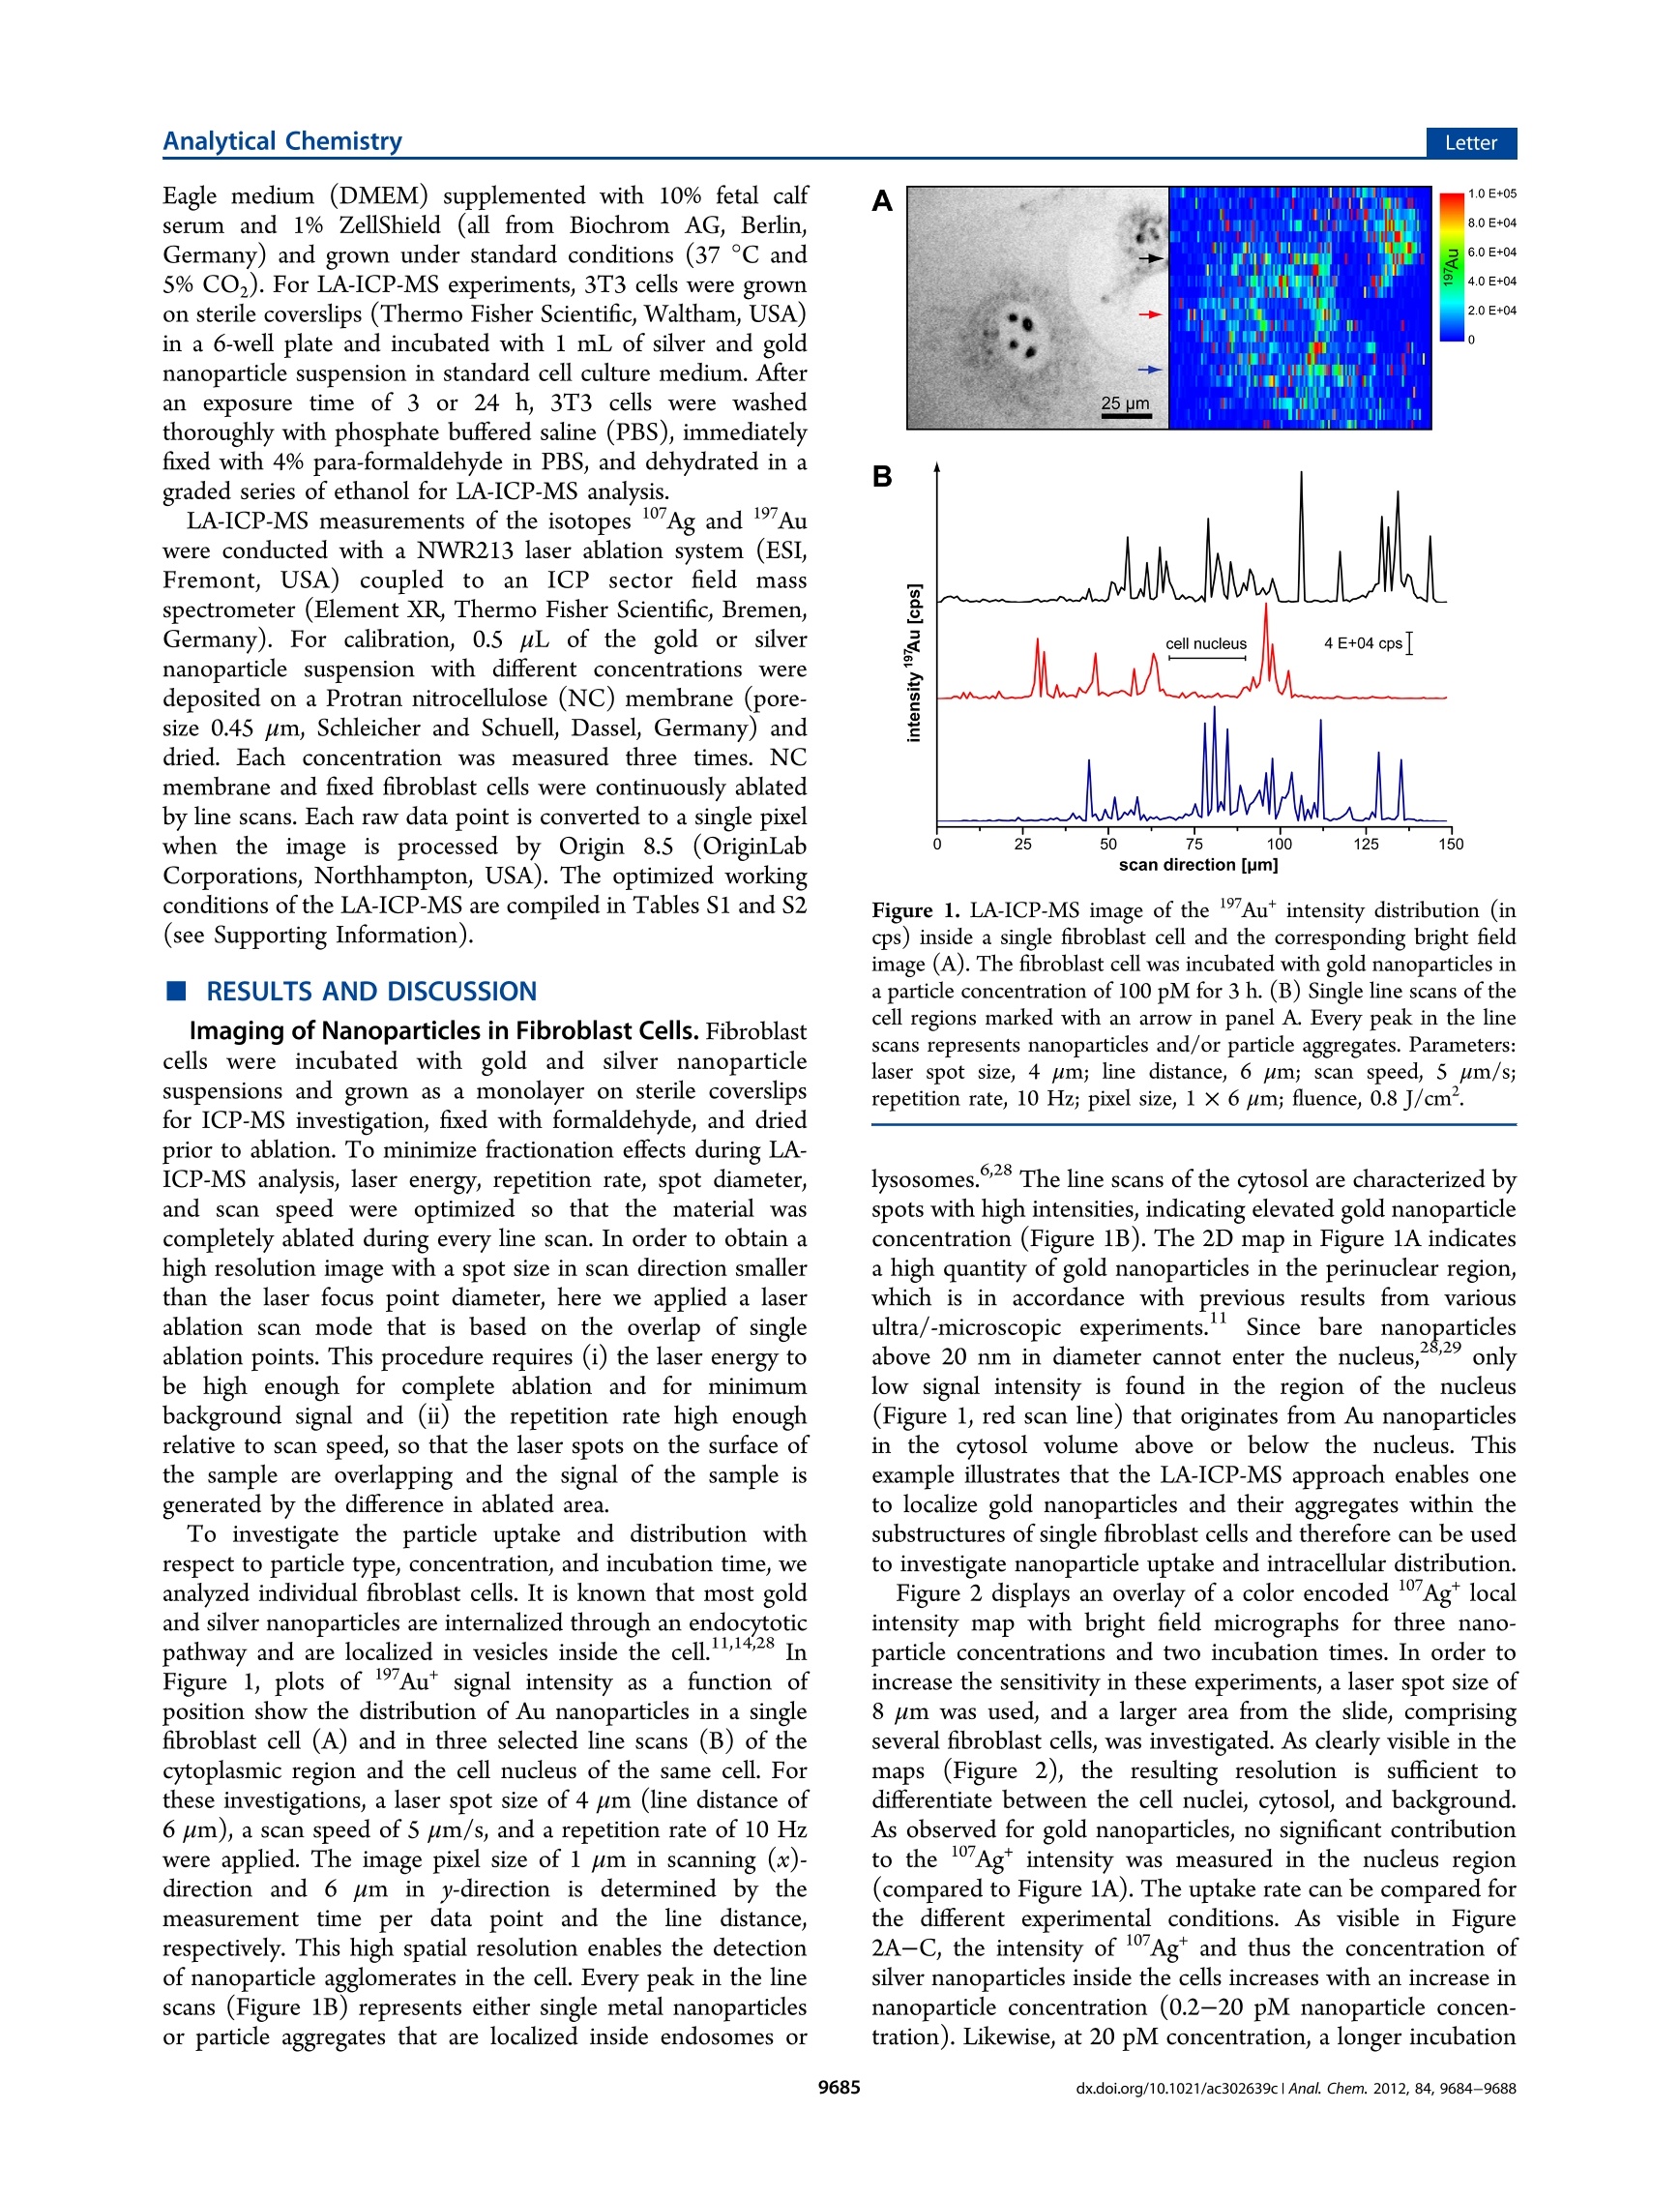
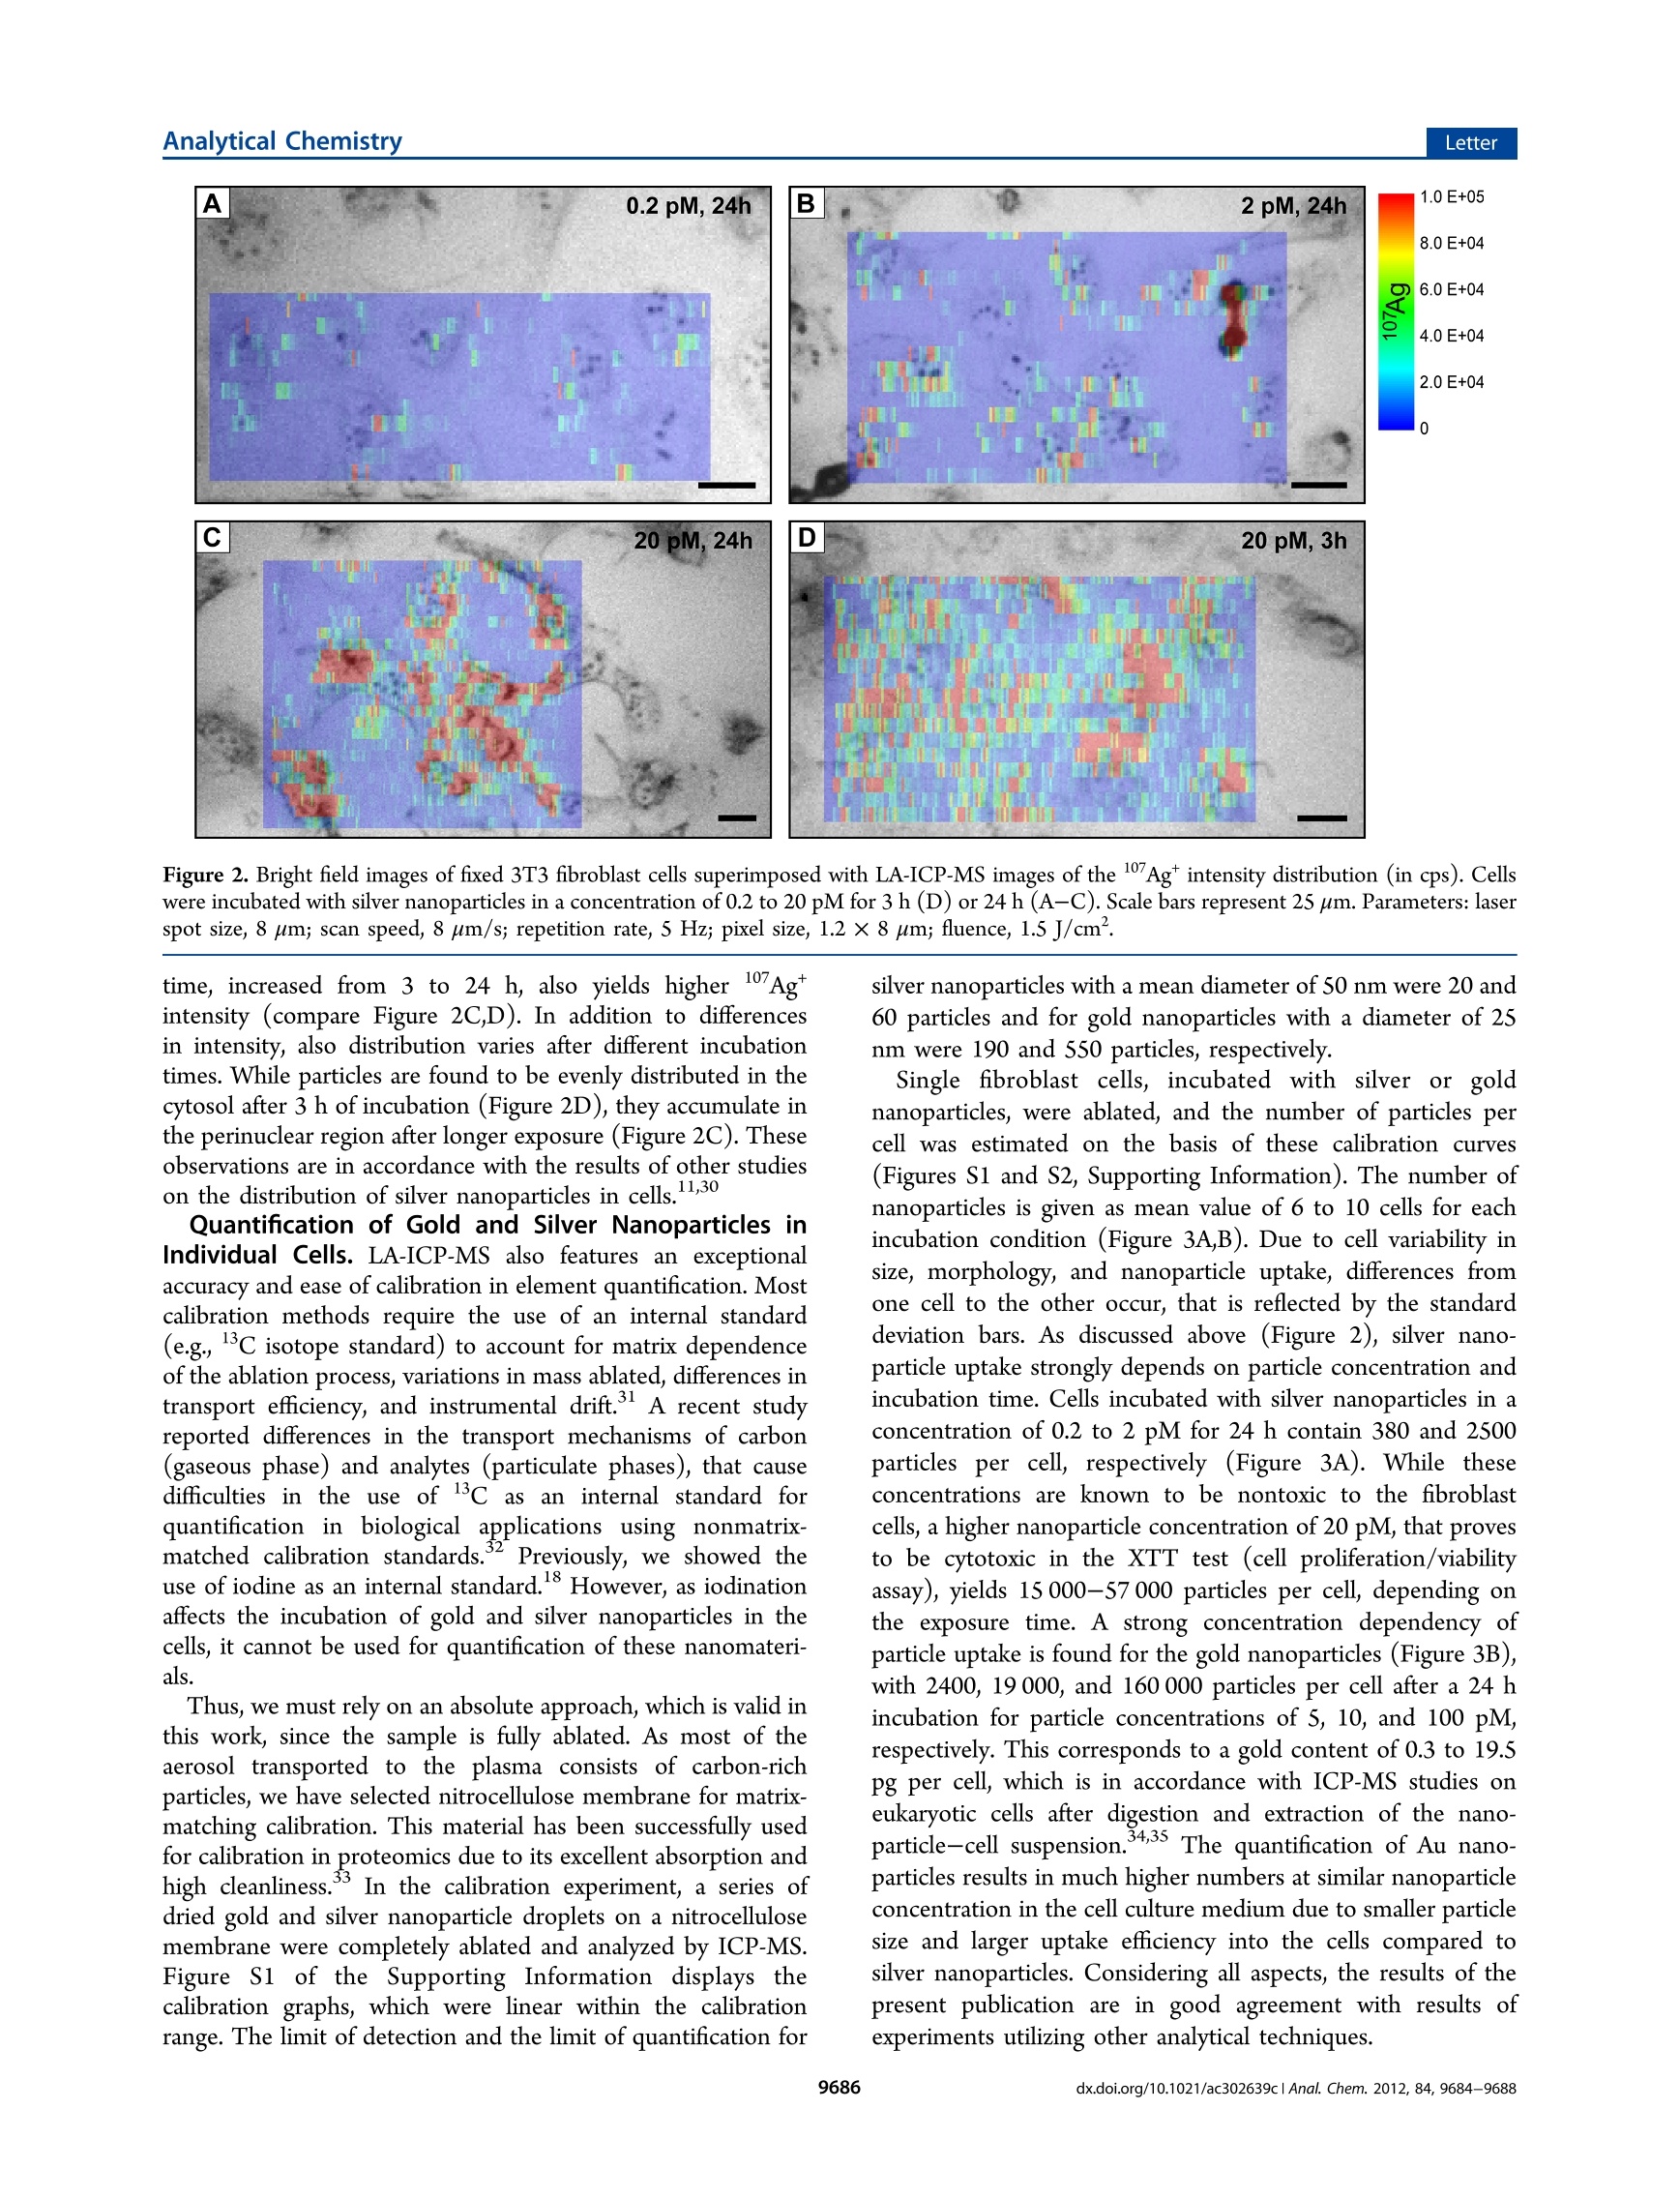
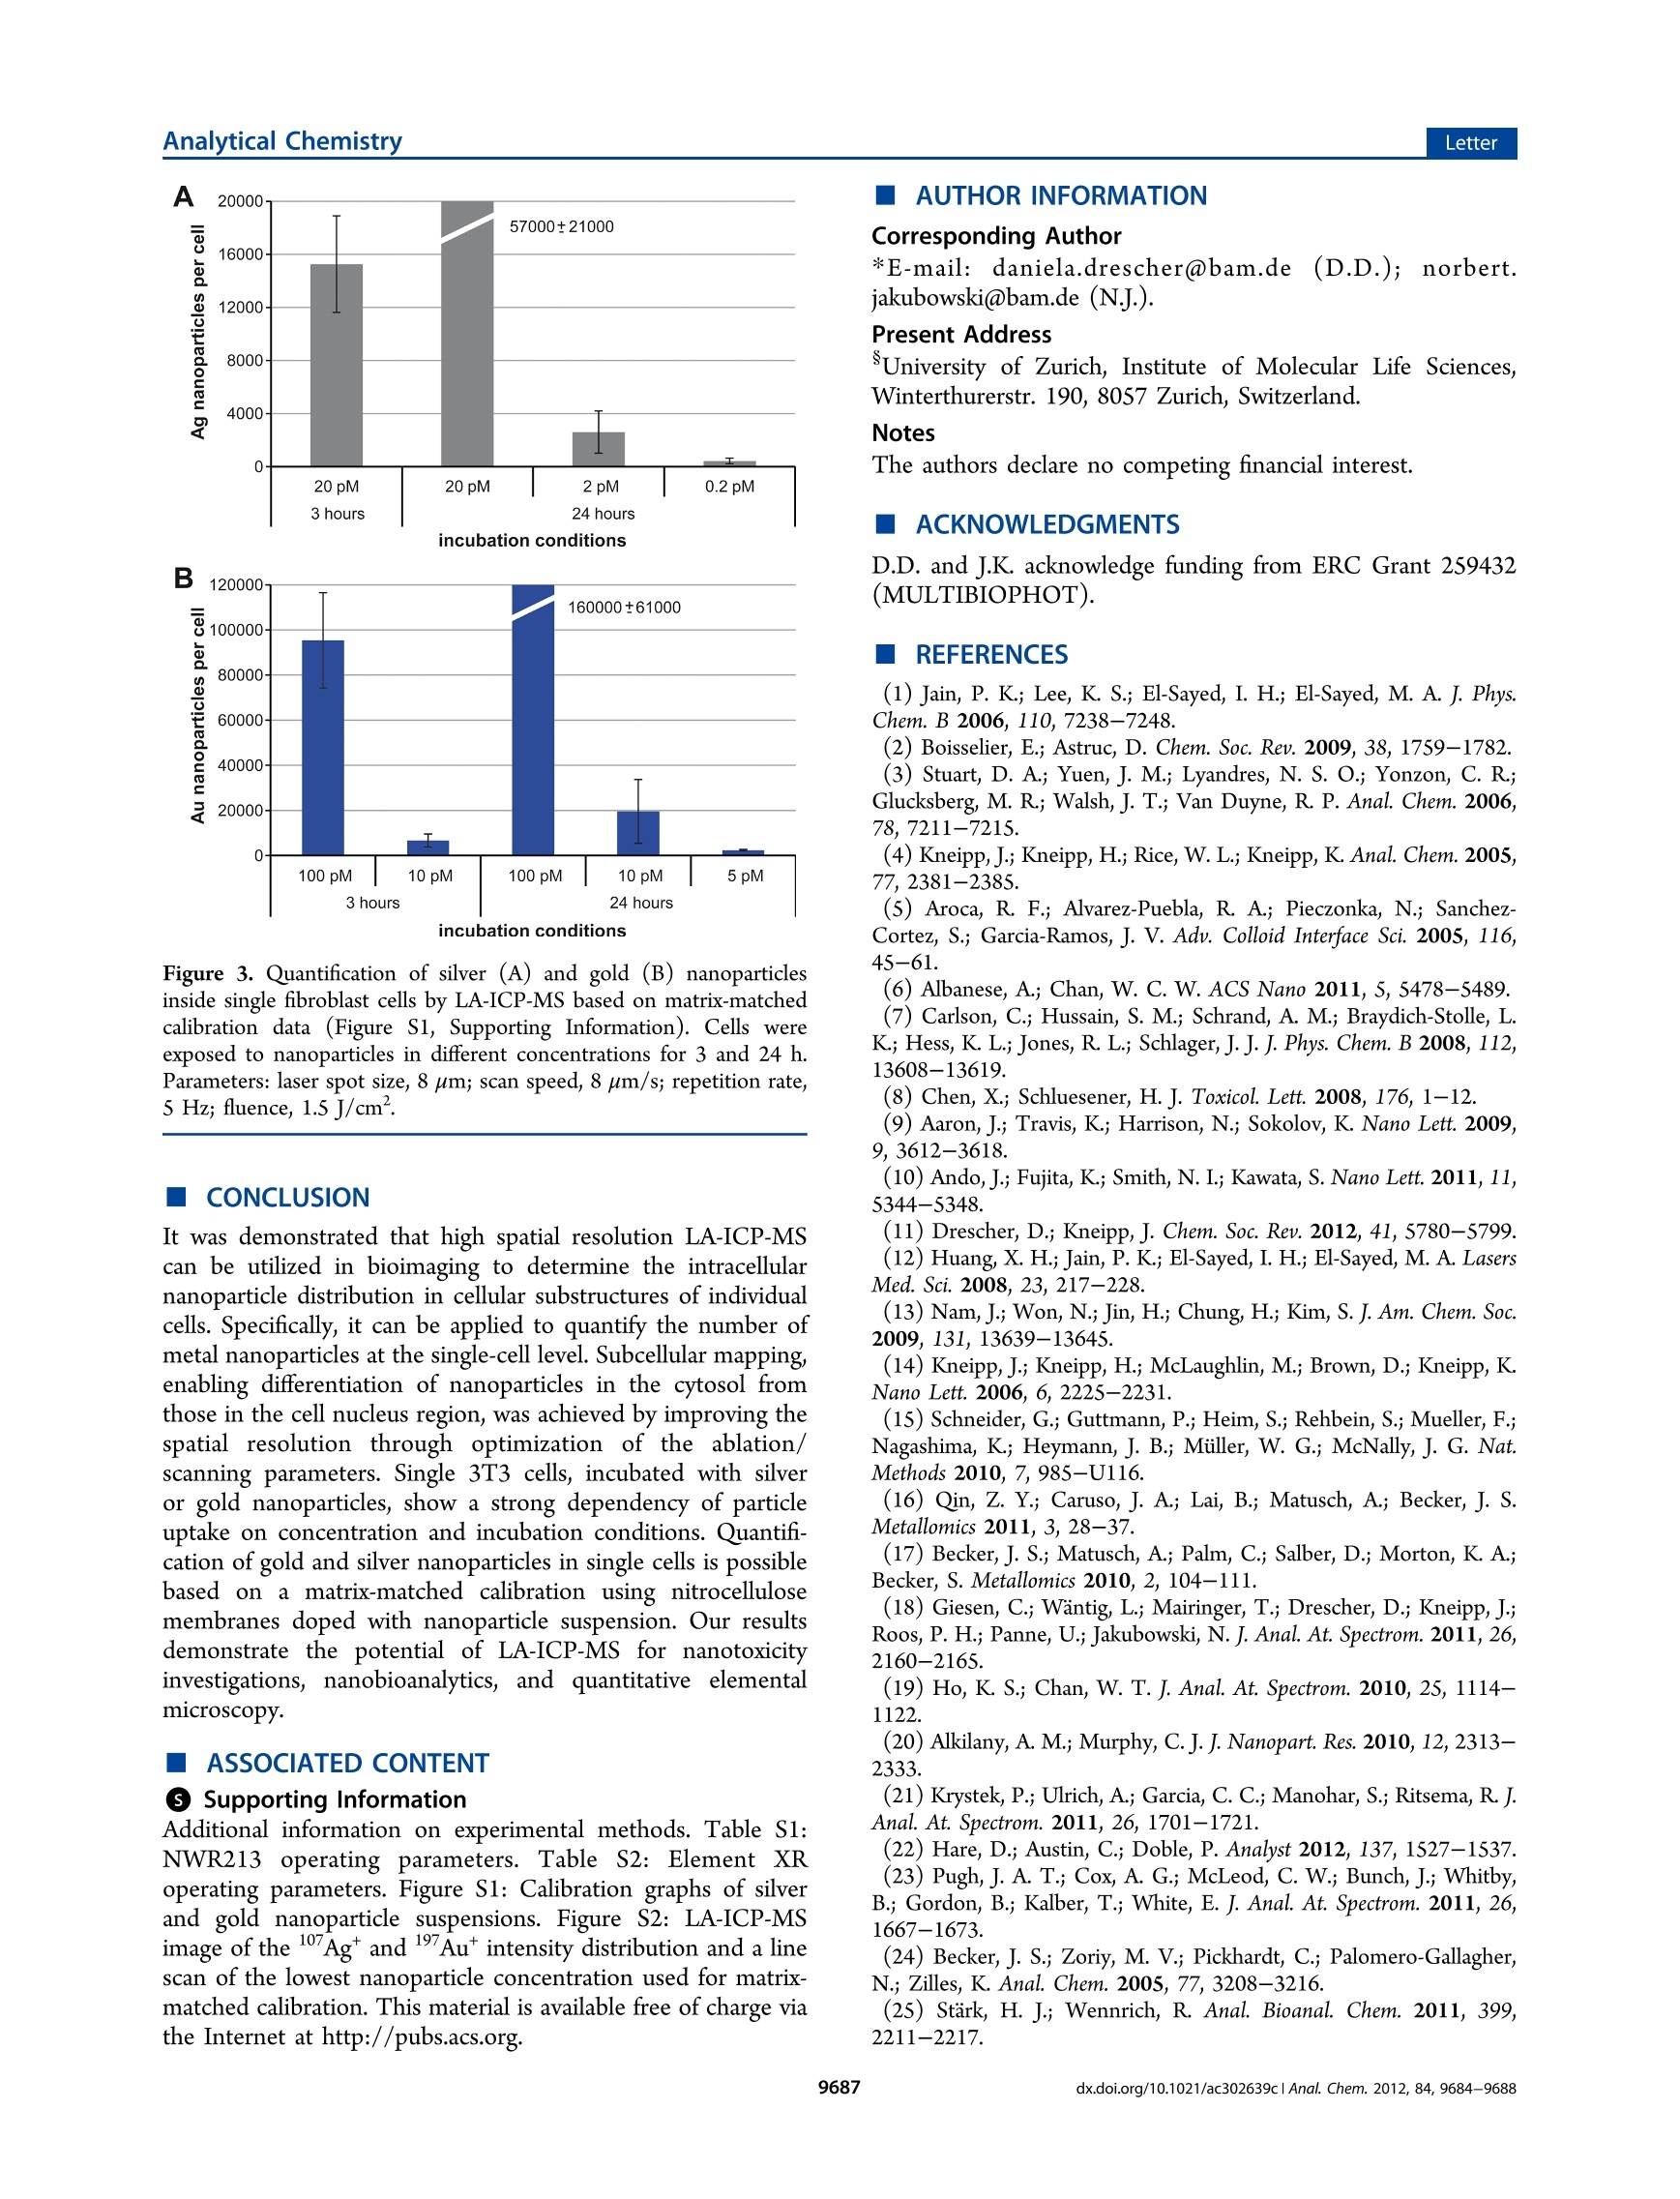
analyticaistryLetterpubs.acs.org/ac Analytical ChemistryLetter Quantitative Imaging of Gold and Silver Nanoparticles in SingleEukaryotic Cells by Laser Ablation ICP-MS Daniela Drescher,*# Charlotte Giesen, Heike Traub, Ulrich Panne, Janina Kneipp,and Norbert Jakubowski* 'BAM Federal Institute for Materials Research and Testing, Richard-Willstatter-Str. 11, 12489 Berlin, Germany*Humboldt-Universitat zu Berlin, Department of Chemistry, Brook-Taylor-Str. 2, 12489 Berlin, Germany Supporting Information ABSTRACT: Laser ablation inductively coupled plasma massspec-trometry (LA-ICP-MS) was utilized for spatially resolved bioimaging ofthe distribution of silver and gold nanoparticles in individual fibroblastcells upon different incubation experiments. High spatial resolution wasachieved by optimization of scan speed, ablation frequency, and laser energy. Nanoparticles are visualized with respect to cellular substructures and are found to accumulate in the perinuclear region with increasing incubation time. On the basis of matrix-matched calibration, we developed a method for quantification of the number of metal nanoparticles at the single-cell level. Theresults provide insight into nanoparticle/cell interactions and have implications for the development of analytical methods intissue diagnostics and therapeutics. he interaction Tof gold and silver nanoparticles with cells ofanimal origin has become a major field of research, drivenby questions arising in different areas, ranging from therapeuticapplications of gold nanoparticles2 over molecular plasmonicsand analytical approaches-s to problems in nanotoxicology.o-8Central to these problems is the quantification of nanoparticlesin cells, which provides important information on, e.g.,nanoparticle uptake under particular experimental conditionsor the distribution of the nanoparticles in the cellular interior.Optical methods such as dark field microscopy,’ surface-enhanced Raman scattering (SERS) imaging,4,10,11 and photo-thermal microscopy213 often rely on the plasmonic propertiesof the nanoparticles, which change during the interaction withthe biological system. These methods show only limited usefor quantification of nanoparticles in single cells. Electron andX-ray microscopys are in principle capable of providing preciseinformation on nanoparticle distribution but require compli-cated preparation and are time-consuming. In the past few years, different analytical techniques havebeen developed that provide spatial information for bioimagingmainly to monitor elemental and molecular distributions intissues.16Laser ablation inductively coupled plasma massspectrometry (LA-ICP-MS) is a convenient alternative forelemental bioimaging in tissue sections, as it provides easysample preparation, multielemental detection with highsensitivity, and high spatial resolution.17,18 The first applicationsof ICP-MS in solution using pneumatic nebulization wereshown for single cell analysis. So far, such analyses have notbeen combined with the detection of metallic nanoparticles.Inorganic nanoparticles can be quantified by elemental analysisin particular by ICP-MS upon extraction or after digestion ofthe cell suspension20.21 but with the disadvantage that all spatial information on the distribution of nanoparticles in a single cellis lost. In this Letter, we report high spatial resolution LA-ICP-MSto detect and quantify gold and silver nanoparticles inindividual fibroblast cells. LA-ICP-MS requires suitablecalibration procedures for accurate quantification, preferablyusing matrix-matched standards. This is difficult to achieve forcomplex biomatrixes such as cultured cells. Due to the lack ofappropriate reference materials, several quantification methodsbased on matrix-matched laboratory standards have beenproposed in the literature,"’ e.g., spiked, frozen and embeddedblood,23 tissue homogenate,eand agarose gels.25 In tissuesamples, detection limits for 232Th, 238U, and 195Pt werereported in the low ug kg- range.24,26 Here, we describe thequantification of gold and silver nanoparticles in single culturedcells based on a matrix-matched calibration using nitrocellulosemembrane spiked with nanoparticle suspension. MATERIALS AND METHODS Silver and gold nanoparticles were synthesized by citratereduction (Merck, Darmstadt, Germany) of silver nitrate andchloroauric acid (Sigma-Aldrich, Taufkirchen, Germany).Particle size distribution of citrate-stabilized nanoparticles wasdetermined by dynamic light scattering and transmissionelectron microscopy giving a mean particle diameter of 25 ±5 nm for gold nanoparticles (6.0-104 particles/L) and 50 +15 nm for silver nanoparticles (1.2.104 particles/L). Swiss albino mouse fibroblast cells (cell line 3T3; DSMZ,Braunschweig, Germany) were cultured in Dulbecco's modified ( Received: September 12, 2012 ) ( Accepted: N ovember 5, 2012 ) ( Published: N ovember 5, 2012 ) Eagle medium (DMEM) supplemented with 10% fetal calfserum and 1% ZellShield (all from Biochrom AG, Berlin,Germany) and grown under standard conditions (37 ℃ and5% CO2). For LA-ICP-MS experiments, 3T3 cells were grownon sterile coverslips (Thermo Fisher Scientific, Waltham, USA)in a 6-well plate and incubated with 1 mL of silver and goldnanoparticle suspension in standard cell culture medium. Afteran exposure time of 3 or 24 h, 3T3 cells were washedthoroughly with phosphate buffered saline (PBS), immediatelyfixed with 4% para-formaldehyde in PBS, and dehydrated in agraded series of ethanol for LA-ICP-MS analysis. LA-ICP-MS measurements of the isotopes 17Ag and Auwere conducted with a NWR213 laser ablation system (ESI,Fremont, USA) coupled to an ICP sector field massspectrometer (Element XR, Thermo Fisher Scientific, Bremen,Germany). For calibration, 0.5 uL of the gold or silvernanoparticle suspension with different concentrations weredeposited on a Protran nitrocellulose (NC) membrane (pore-size 0.45 um, Schleicher and Schuell, Dassel, Germany) anddried. Each concentration was measured three times. NCmembrane and fixed fibroblast cells were continuously ablatedby line scans. Each raw data point is converted to a single pixelwhen the image is processed by Origin 8.5 (OriginLabCorporations, Northhampton, USA). The optimized workingconditions of the LA-ICP-MS are compiled in Tables S1 and S2(see Supporting Information). RESULTS AND DISCUSSION Imaging of Nanoparticles in Fibroblast Cells.Fibroblastcells were incubated with gold and silver nanoparticlesuspensions and grown as a monolayer on sterile coverslipsfor ICP-MS investigation, fixed with formaldehyde, and driedprior to ablation. To minimize fractionation effects during LA-ICP-MS analysis, laser energy, repetition rate, spot diameter,and scan speed were optimized so that the material wascompletely ablated during every line scan. In order to obtain ahigh resolution image with a spot size in scan direction smallerthan the laser focus point diameter, here we applied a laserablation scan mode that is based on the overlap of singleablation points. This procedure requires (i) the laser energy tobe high enough for complete ablation and for minimumbackground signal and (ii) the repetition rate high enoughrelative to scan speed, so that the laser spots on the surface ofthe sample are overlapping and the signal of the sample isgenerated by the difference in ablated area. To investigate the particle uptake and distribution withrespect to particle type, concentration, and incubation time, weanalyzed individual fibroblast cells. It is known that most goldand silver nanoparticles are internalized through an endocytoticpathway and are localized in vesicles inside the cell.1,14,28 InFigure 1, plots of 197Au* signal intensity as a function ofposition show the distribution of Au nanoparticles in a singlefibroblast cell (A) and in three selected line scans (B) of thecytoplasmic region and the cell nucleus of the same cell. Forthese investigations, a laser spot size of 4 um (line distance of6 um), a scan speed of 5 um/s, and a repetition rate of 10 Hzwere applied. The image pixel size of 1 um in scanning (x)-direction and 6 um in y-direction is determined by themeasurement time per data point and the line distance,respectively. This high spatial resolution enables the detectionof nanoparticle agglomerates in the cell. Every peak in the linescans (Figure 1B) represents either single metal nanoparticlesor particle aggregates that are localized inside endosomes or B Figure 1. LA-ICP-MS image of the 197Au* intensity distribution (incps) inside a single fibroblast cell and the corresponding bright fieldimage (A). The fibroblast cell was incubated with gold nanoparticles ina particle concentration of 100 pM for 3 h. (B) Single line scans of thecell regions marked with an arrow in panel A. Every peak in the linescans represents nanoparticles and/or particle aggregates. Parameters:laser spot size, 4 um; line distance, 6 um; scan speed, 5 um/s;repetition rate, 10 Hz; pixel size, 1×6 um; fluence, 0.8 J/cm. lysosomes.6,28 The line scans of the cytosol are characterized byspots with high intensities, indicating elevated gold nanoparticleconcentration (Figure 1B). The 2D map in Figure 1A indicatesa high quantity of gold nanoparticles in the perinuclear region,which is in accordance with previous results from various11ultra/-microscopic experiments.. Since bare nanoparticlesabove 20 nm in diameter cannot enter the nucleus,28,29 onlylow signal intensity is found in the region of the nucleus(Figure 1, red scan line) that originates from Au nanoparticlesin the cytosol volume above or below the nucleus. Thisexample illustrates that the LA-ICP-MS approach enables oneto localize gold nanoparticles and their aggregates within thesubstructures of single fibroblast cells and therefore can be usedto investigate nanoparticle uptake and intracellular distribution. Figure 2 displays an overlay of a color encoded 107Ag*localintensity map with bright field micrographs for three nano-particle concentrations and two incubation times. In order toincrease the sensitivity in these experiments, a laser spot size of8 um was used, and a larger area from the slide, comprisingseveral fibroblast cells, was investigated. As clearly visible in themaps (Figure 2), the resulting resolution is sufficient todifferentiate between the cell nuclei, cytosol, and background.As observed for gold nanoparticles, no significant contributionto the 17Agt intensity was measured in the nucleus region(compared to Figure 1A). The uptake rate can be compared forthe different experimental conditions. As visible in Figuree107+2A-C, the intensity of 17Ag* and thus the concentration ofsilver nanoparticles inside the cells increases with an increase innanoparticle concentration (0.2-20 pM nanoparticle concen-tration). Likewise, at 20 pM concentration, a longer incubation D 20 pM, 3h Figure 2. Bright field images of fixed 3T3 fibroblast cells superimposed with LA-ICP-MS images of the 107Ag* intensity distribution (in cps). Cellswere incubated with silver nanoparticles in a concentration of 0.2 to 20 pM for3 h (D) or 24 h (A-C). Scale bars represent 25 um. Parameters: laserspot size, 8 um; scan speed, 8 um/s; repetition rate, 5 Hz; pixel size, 1.2 ×8 um; fluence, 1.5J/cm . time, increased from 3 to 24 h, also yields higher 107Agtintensity (compare Figure 2C,D). In addition to differencesin intensity, also distribution varies after different incubationtimes. While particles are found to be evenly distributed in thecytosol after 3 h of incubation (Figure 2D), they accumulate inthe perinuclear region after longer exposure (Figure 2C). Theseobservations are in accordance with the results of other studieson the distribution of silver nanoparticles in cells. 30 Quantification of Gold and Silver Nanoparticles inIndividual Cells. LA-ICP-MS also features an exceptionalaccuracy and ease of calibration in element quantification. Mostcalibration methods require the use of an internal standard(e.g., C isotope standard) to account for matrix dependenceof the ablation process, variations in mass ablated, differences intransport efficiency, and instrumental drift.A recent studyreported differences in the transport mechanisms of carbon(gaseous phase) and analytes (particulate phases), that causedifficulties in the use of3c as an internal standard forquantification in biological applications using nonmatrix-matched calibration standards. Previously, we showed theuse of iodine as an internal standard. 8 However, as iodinationaffects the incubation of gold and silver nanoparticles in thecells, it cannot be used for quantification of these nanomateri-als. Thus, we must rely on an absolute approach, which is valid inthis work, since the sample is fully ablated. As most of theaerosol transported to the plasma consists of carbon-richparticles, we have selected nitrocellulose membrane for matrix-matching calibration. This material has been successfully usedfor calibration in proteomics due to its excellent absorption andhigh cleanliness. In the calibration experiment, a series ofdried gold and silver nanoparticle droplets on a nitrocellulosemembrane were completely ablated and analyzed by ICP-MS.Figure S11 of the Supporting Information displays thecalibration graphs, which were linear within the calibrationrange. The limit of detection and the limit of quantification for silver nanoparticles with a mean diameter of 50 nm were 20 and60 particles and for gold nanoparticles with a diameter of 25nm were 190 and 550 particles, respectively. Single fibroblast cells, incubated with silver or goldnanoparticles, were ablated, and the number of particles percell was estimated on the basis of these calibration curves(Figures S1 and S2, Supporting Information). The number ofnanoparticles is given as mean value of 6 to 10 cells for eachincubation condition (Figure 3A,B). Due to cell variability insize, morphology, and nanoparticle uptake, differences fromone cell to the other occur, that is reflected by the standarddeviation bars. As discussed above (Figure 2), silver nano-particle uptake strongly depends on particle concentration andincubation time. Cells incubated with silver nanoparticles in aconcentration of 0.2 to 2 pM for 24 h contain 380 and 2500particles per cell, respectively (Figure 3A). While theseconcentrations are known to be nontoxic to the fibroblastcells, a higher nanoparticle concentration of 20 pM, that provesto be cytotoxic in the XTT test (cell proliferation/viabilityassay), yields 15 000-57000 particles per cell, depending onthe exposure time. A strong concentration dependency ofparticle uptake is found for the gold nanoparticles (Figure 3B),with 2400, 19 000, and 160 000 particles per cell after a 24 hincubation for particle concentrations of S, 10, and 100 pM,respectively. This corresponds to a gold content of 0.3 to 19.5pg per cell, which is in accordance with ICP-MS studies oneukaryotic cells after digestion and extraction of the nano-particle-cell suspension.34,35 The quantification of Au nano-particles results in much higher numbers at similar nanoparticleconcentration in the cell culture medium due to smaller particlesize and larger uptake efficiency into the cells compared tosilver nanoparticles. Considering all aspects, the results of thepresent publication are in good agreement with results ofexperiments utilizing other analytical techniques. Figure 3. Quantification of silver (A) and gold (B) nanoparticlesinside single fibroblast cells by LA-ICP-MS based on matrix-matchedcalibration data (Figure S1, Supporting Information). Cells wereexposed to nanoparticles in different concentrations for 3 and 24 h.Parameters: laser spot size, 8 um; scan speed, 8 um/s; repetition rate,5 Hz; fluence, 1.5 J/cm. (CONCLUSION It was demonstrated that high spatial resolution LA-ICP-MScan be utilized in bioimaging to determine the intracellularnanoparticle distribution in cellular substructures of individualcells. Specifically, it can be applied to quantify the number ofmetal nanoparticles at the single-cell level. Subcellular mapping,enabling differentiation of nanoparticles in the cytosol fromthose in the cell nucleus region, was achieved by improving thespatial resolution through optimization of the ablation/scanning parameters. Single 3T3 cells, incubated with silveror gold nanoparticles, show a strong dependency of particleuptake on concentration and incubation conditions. Quantifi-cation of gold and silver nanoparticles in single cells is possiblebased on a matrix-matched calibration using nitrocellulosemembranes doped with nanoparticle suspension. Our resultsdemonstrate the potential of LA-ICP-MS for nanotoxicityinvestigations, nanobioanalytics,and quantitative elementalmicroscopy. ASSOCIATED CONTENT S Supporting Information Additional information on experimental methods. Table S1:NWR213 oopteratingg parameters. Table S2: Element XRoperating parameters. Figure S1: Calibration graphs of silverand gold nanoparticle suspensions. Figure S2: LA-ICP-MSimage of the 17Agt and 19Au intensity distribution and a linescan of the lowest nanoparticle concentration used for matrix-matched calibration. This material is available free of charge viathe Internet at http://pubs.acs.org. AUTHOR INFORMATION Corresponding Author *E-mail: daniela.drescher@bam.dee(D.D.));; norbert.jakubowski@bam.de (NJ.). Present Address University of Zurich, Institute of Molecular Life Sciences,Winterthurerstr. 190, 8057 Zurich, Switzerland. Notes The authors declare no competing financial interest. ACKNOWLEDGMENTS D.D. and J.K. acknowledge funding from ERC Grant 259432(MULTIBIOPHOT). REFERENCES (1) Jain, P. K.; Lee, K. S.; El-Sayed, I. H.; El-Sayed, M. A. J. Phys.Chem. B 2006, 110,7238-7248. (2) Boisselier, E.; Astruc, D. Chem. Soc. Rev. 2009, 38, 1759-1782. (3) Stuart, D. A.; Yuen, J. M.; Lyandres, N. S.O.; Yonzon, C. R.;Glucksberg, M. R; Walsh,J. T.;Van Duyne, R. P. Anal. Chem. 2006,78,7211-7215. (4) Kneipp, J; Kneipp, H.; Rice, W. L.; Kneipp, K. Anal. Chem. 2005,77,2381-2385. (5) Aroca, R. F.; Alvarez-Puebla, R. A.; Pieczonka, N.; Sanchez-Cortez, S.; Garcia-Ramos, J. V. Adv. Colloid Interface Sci. 2005, 116,45-61. (6) Albanese, A.; Chan, W. C. W. ACS Nano 2011, S, 5478-5489. (7) Carlson, C.; Hussain, S. M.; Schrand, A. M.; Braydich-Stolle, L. K.; Hess, K. L.; Jones, R. L.; Schlager,JJ.J. Phys. Chem. B 2008, 112,13608-13619. (8) Chen, X.; Schluesener, H. J. Toxicol. Lett. 2008, 176,1-12. (9) Aaron,J.; Travis, K.; Harrison, N.; Sokolov, K. Nano Lett. 2009,9,3612-3618. (10) Ando, J.; Fujita, K.; Smith, N. I.; Kawata, S. Nano Lett. 2011,11,5344-5348. (11) Drescher, D.; Kneipp, J. Chem. Soc. Rev. 2012, 41, S780-5799. (12) Huang, X. H.; Jain, P. K.; El-Sayed, I. H.; El-Sayed, M. A. LasersMed. Sci.2008,23,217-228. (13)Nam, J.; Won, N.; Jin, H.; Chung, H.; Kim, S. J. Am. Chem. Soc.2009, 131,13639-13645. (14) Kneipp, J.; Kneipp, H.;McLaughlin, M.; Brown, D.; Kneipp, K.Nano Lett. 2006, 6, 2225-2231. (15) Schneider, G.; Guttmann, P.; Heim, S.; Rehbein, S.; Mueller, F.;Nagashima, K.; Heymann, J. B.; Muller, W. G.; McNally, J. G. Nat.Methods 2010, 7,985-U116. (16) Qin, Z. Y.; Caruso, J. A.; Lai, B.; Matusch, A.; Becker, J. S.Metallomics 2011, 3, 28-37. (17) Becker, J. S.; Matusch, A.; Palm, C.; Salber, D.; Morton, K. A.;Becker, S. Metallomics 2010, 2, 104-111. (18) Giesen, C.; Wantig, L.; Mairinger, T.; Drescher, D.; Kneipp, J.;Roos, P. H.; Panne, U.; Jakubowski, N. J. Anal. At. Spectrom. 2011, 26,2160-2165. (19) Ho, K. S.; Chan, W. T. J. Anal. At. Spectrom.2010, 25,1114-1122. (20) Alkilany, A. M.; Murphy, C. J. J. Nanopart. Res. 2010, 12,2313-2333. (21) Krystek, P.; Ulrich, A.; Garcia, C. C.; Manohar, S.; Ritsema, R. J.Anal. At. Spectrom. 2011, 26,1701-1721. ( (22) H are, D.; Austin, C .; Doble, P. Analyst 2012, 137,1527-1537. ) ( (23) P ugh, J. A . T.; Cox, A . G .; M cLeod, C. W.; Bunch, J.; Whitby,B.; Gordon, B.; K alber, T .; W hite, E. J. Anal. At. Spectrom. 2011, 26, 1667-1673. ) ( (24) Becker, J. S . ; Z o riy, M . V.; Pi c khardt, C. ; Palomero-Gallagher, N.; Zilles , K. Anal. Chem. 2005, 7 7, 3208-3216. ) ( ( 25) S tark, H. J .; Wennrich, R . A nal. B ioanal. Chem. 2 011, 399, 2211-2217. ) ( (26) Moreno-Gordaliza, E.; Giesen, C . ; L az aro, A. ; Es t eban-Fernandez, D.; Humanes, B . ; Canas, B . ; Panne, U.; Tejedor, A.; J akubowski, N.; Gomez-Gomez, M. M . A n al. Chem. 2011, 83, 7 933- 7940. ) (27) Lee, P. C.; Meisel, D. J. Phys. Chem. 1982, 86, 3391-3395. ( (28) C hithrani, B . D.; Ghazani, A . A .; Chan, W . C . W . Nano Let t . 2006, 6, 662-668. ) ( (29) B randenberger, C.; M u hlfeld, C.; Ali, Z.; Lenz, A. G.; Schmid,O.; Parak, W. J.; Gehr, P.; Rothen-Rutishauser, B. Small 2010, 6 , 1669-1678. ) ( (30) G reulich, C .; D iendorf, J.; Simon, T .; Eggeler, G.; Epple, M.; Koller, M. Acta Biomater. 2011, 7 , 347-354. ) ( (31) A u stin, C.; Fryer, F. ; Lear, J.; Bishop, D . ; Hare, D.; Rawling, T.; Kirkup, L.; McDonagh, A.; Doble, P . J. A nal. At. Spectrom. 2011, 26,1494-1501. ) ( (32) Frick, D. A.; Giinther, D . J. Anal. At. Spectrom. 2 0 12, 27, 12 9 4- 1303. ) ( (33) Wantig, L.; Jakubowski, N.; Hayen, H.; Roo s , P. H. J . Anal. At. Spectrom.2011,26,1610-1618. ) ( (34) M u khopadhyay, A.; G rabinski, C.; A fro o z, A. R. M. N . ; Saleh, N. B.; Hussain, S. Appl. B iochem. B iotechnol.2012, 167, 327-337. ) ( (35) C ai, X. Q.; Chen, H. H.; Wang, C. L.; C h en, S. T; La i , S. F . ;Chien, C . C .; C hen, Y . Y.; K empson, I. M . ; H w u, Y. ; Ya n g, C. S. ; Margaritondo, G. Anal. Bioanal. Chem. 2 011, 401, 809-816. ) x.doi.org/aclAnal. Chem. CS Publications @ American Chemical Society x.doi.org/aclAnal. Chem. 细胞对暴露的纳米颗粒反应在各种环境中都是必不可少的,尤其是在纳米毒性和纳米医学中。这里,14纳米金纳米粒子在3T3成纤维细胞在一系列脉冲追踪实验研究了30分钟孵化脉冲和追逐时间从15分钟到48小时。里面的金纳米粒子及其聚合量化细胞超微结构的激光烧蚀电感耦合等离子体质谱法,可以用于评估表面增强拉曼散射(SERS)信号。通过这种方法,可以分别获得它们在微米尺度上的定位信息和它们的分子纳米环境,并且可以将它们联系起来。因此,纳米颗粒从细胞内摄取、细胞内加工到细胞分裂的路径是可以遵循的。结果表明,细胞内纳米粒子及其积聚和聚集支持高SERS信号的能力与纳米粒子的数量和高局部纳米粒子密度没有直接关系。SERS数据表明,细胞内聚集的几何形状和粒间距离必须在内体成熟过程中发生变化,并对特定的金纳米粒子类型起关键作用,才能成为高效的SERS纳米探针。这一发现得到了TEM图像的支持,它只显示了一小部分具有小颗粒间距的团聚体。经过不同的捕集时间后得到的SERS光谱显示,金纳米粒子内体加工后,其生物分子电晕的组成和/或结构发生了变化。
确定
还剩3页未读,是否继续阅读?

产品配置单
上海凯来仪器有限公司为您提供《细胞表面增强拉曼散射信号中金纳米粒子聚集检测方案(激光剥蚀进样)》,该方案主要用于其他中金纳米粒子聚集检测,参考标准--,《细胞表面增强拉曼散射信号中金纳米粒子聚集检测方案(激光剥蚀进样)》用到的仪器有ESL213 灵活的激光剥蚀系统
推荐专场
相关方案
更多
该厂商其他方案
更多