


方案详情
文
激光剥蚀ICP-MS是用于检测、量化并对生物组织切片上的金属离子分布进行成像的最实用、灵敏度高的一种检测技术。而且,随着单克隆抗体的重金属标记的应用发展,它可以同时用于测量蛋白的分布。这项技术上基于组织上的多线扫描的定位。
方案详情

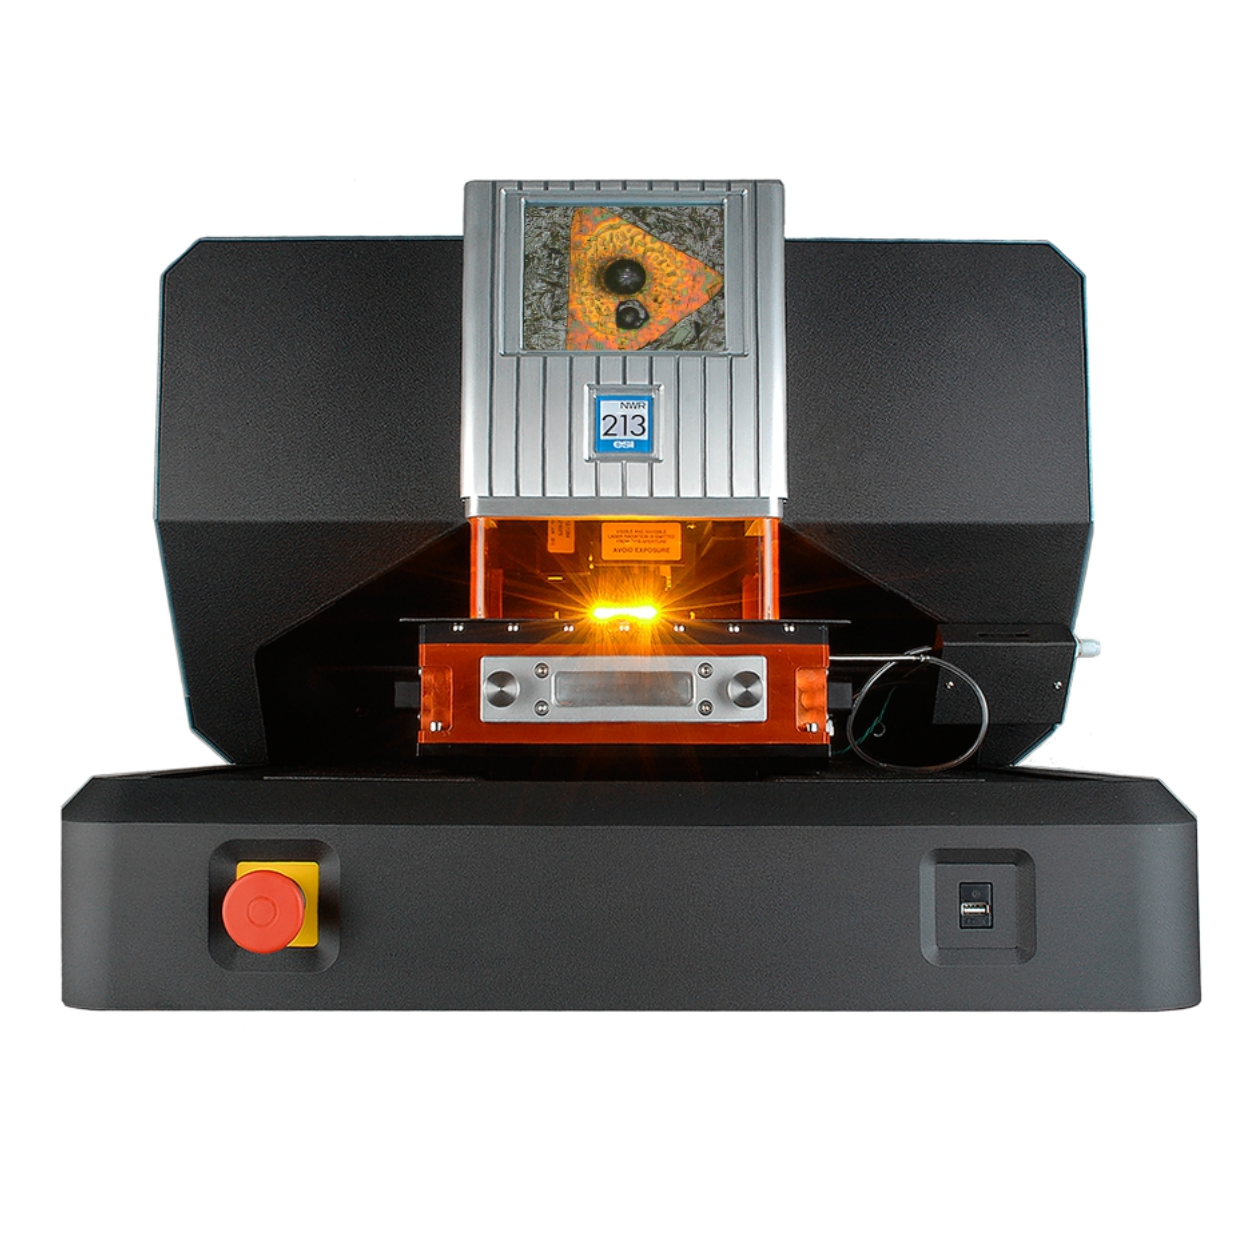
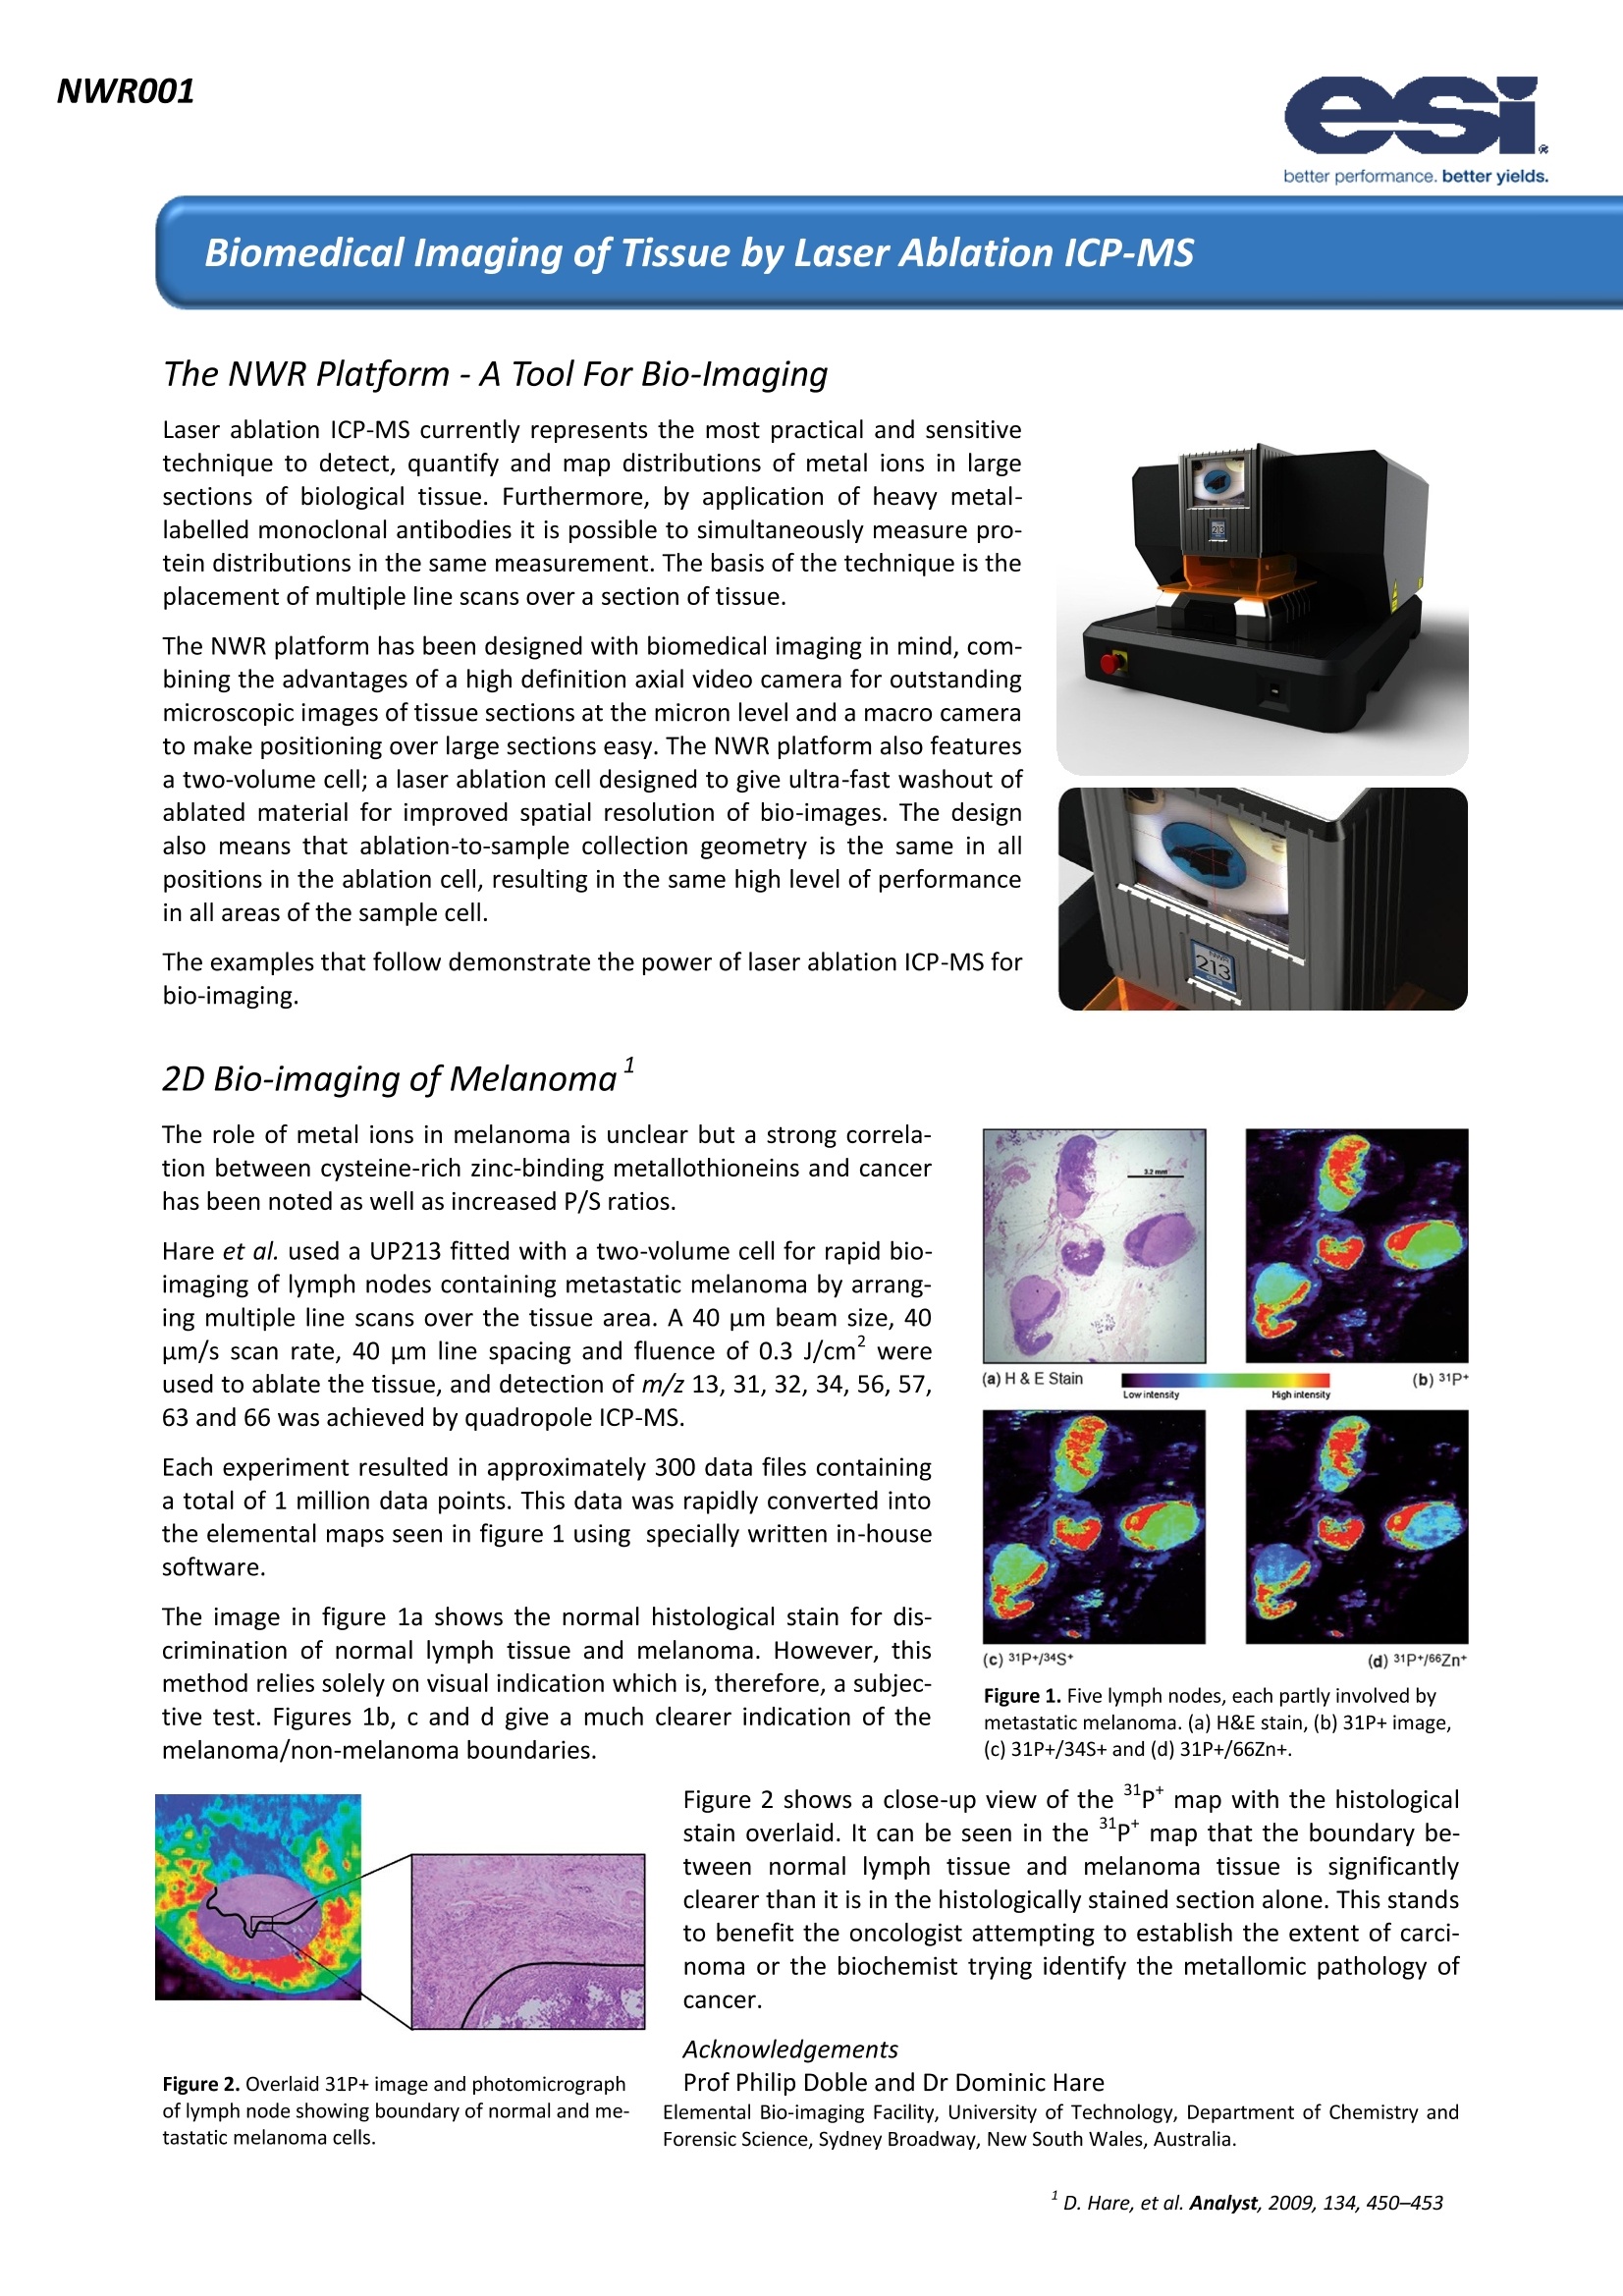
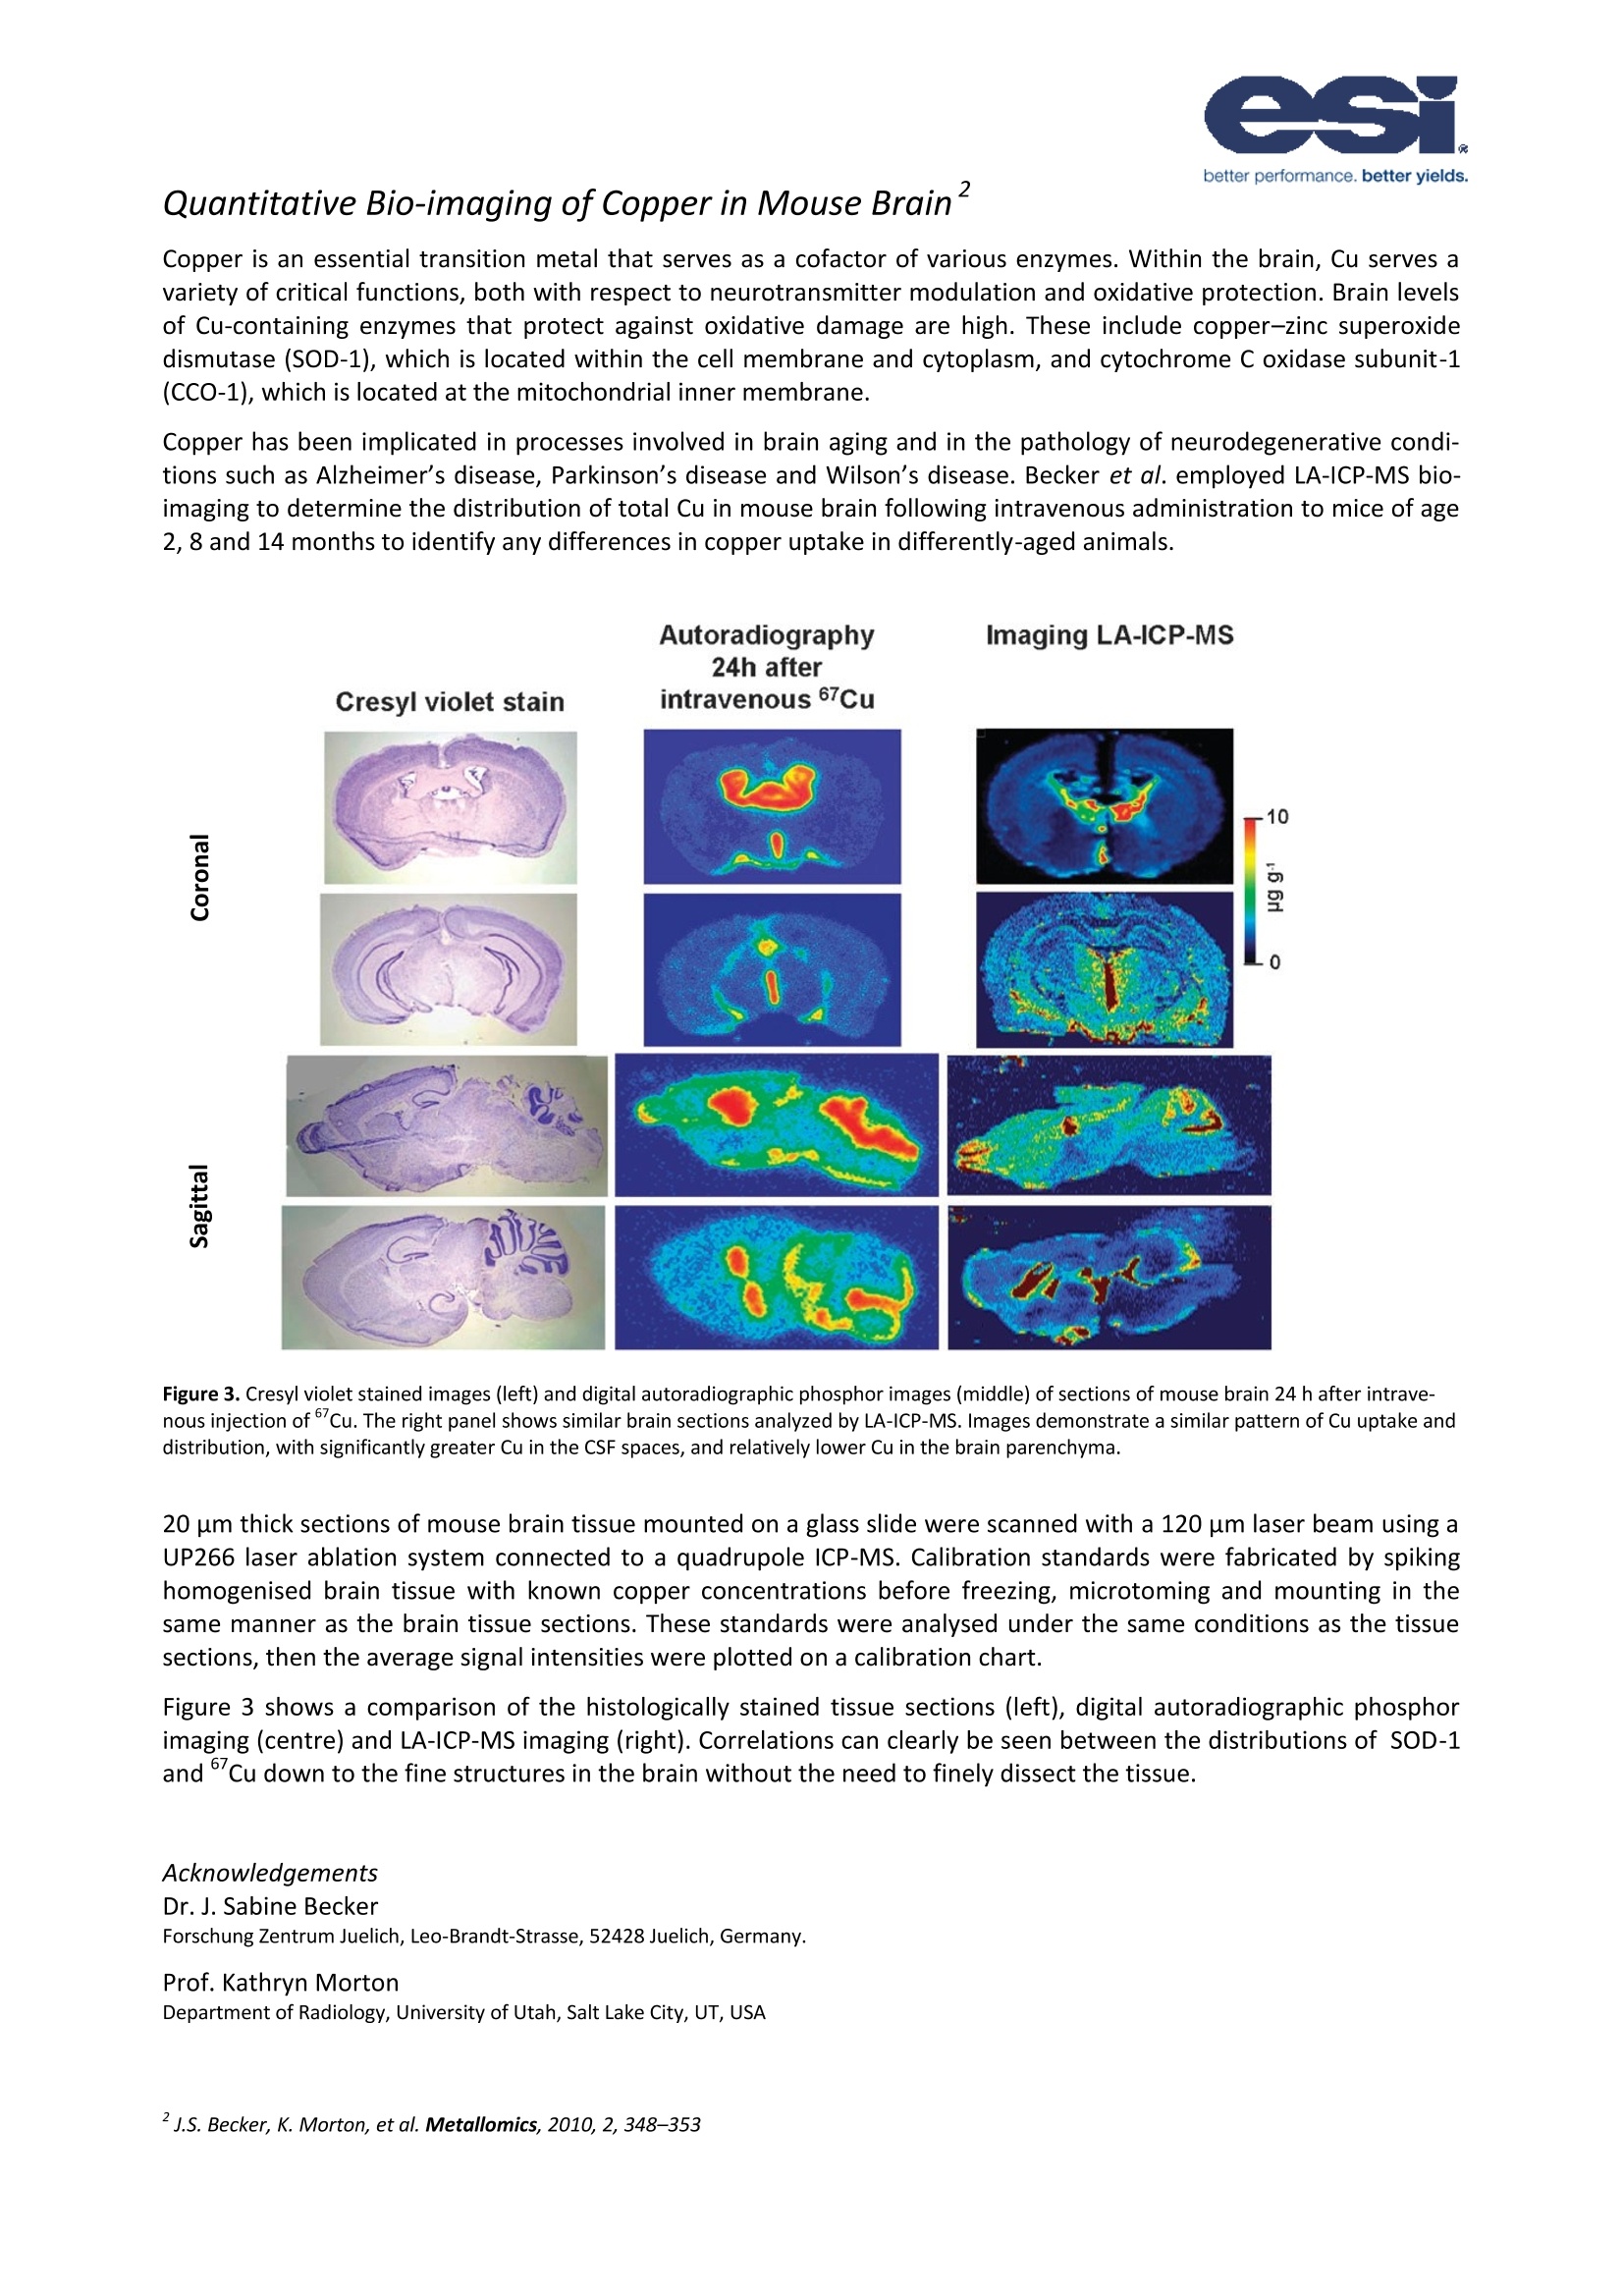
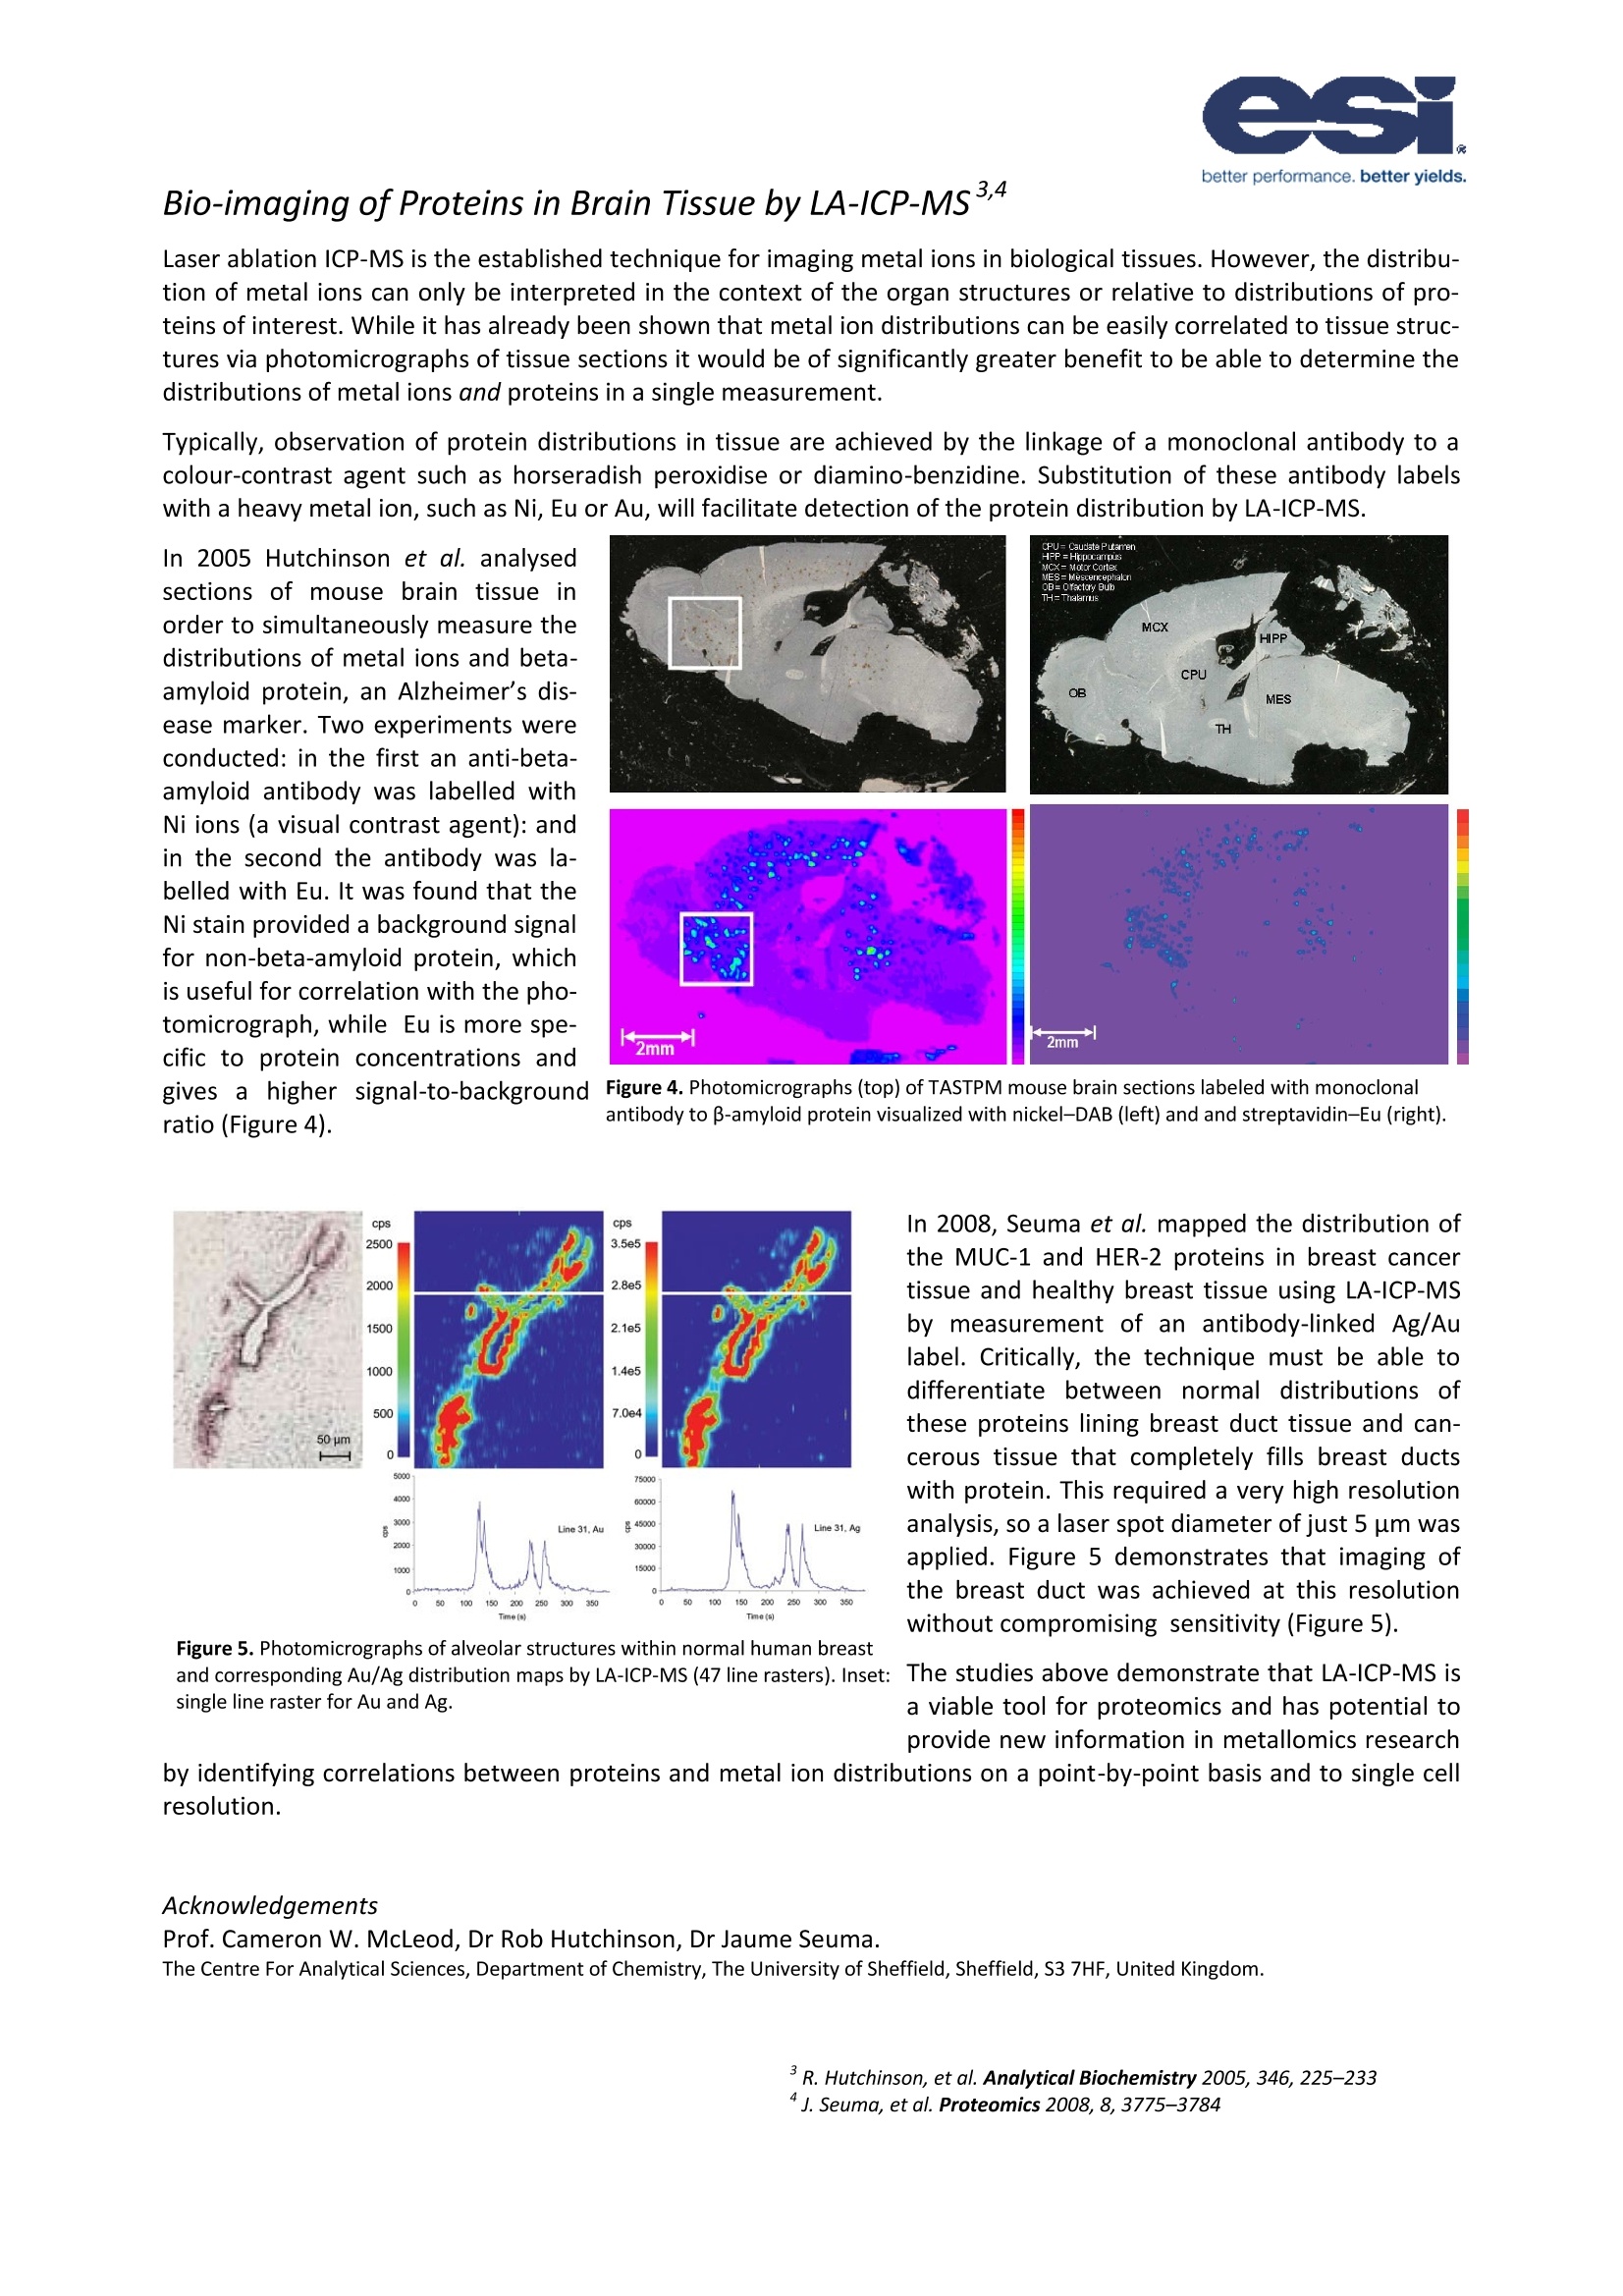
NWR001 better performance. better yields. Biomedical Imaging of Tissue by Laser Ablation ICP-MS The NWR Platform-A Tool For Bio-Imaging Laser ablation ICP-MS currently represents the most practical and sensitivetechnique to detect, quantify and map distributions of metal ions in largesections of biological tissue. Furthermore, by application of heavy metal-labelled monoclonal antibodies it is possible to simultaneously measure pro-tein distributions in the same measurement. The basis of the technique is theplacement of multiple line scans over a section of tissue. The NWR platform has been designed with biomedical imaging in mind, com-bining the advantages of a high definition axial video camera for outstandingmicroscopic images of tissue sections at the micron level and a macro camerato make positioning over large sections easy.The NWR platform also featuresa two-volume cell; a laser ablation cell designed to give ultra-fast washout ofablated material for improved spatial resolution of bio-images. The designalso means that ablation-to-sample collection geometry is the same in allpositions in the ablation cell, resulting in the same high level of performancein all areas of the sample cell. The examples that follow demonstrate the power of laser ablation ICP-MS forbio-imaging. 2D Bio-imaging of Melanoma (a) H & E Stain (b)31P Low intensity High intensity (c) 31P+/34S+ (d) 31P+/66Zn* Figure 1. Five lymph nodes, each partly involved bymetastatic melanoma.(a) H&E stain, (b) 31P+ image,(c)31P+/34S+and (d)31P+/66Zn+. Figure 2. Overlaid 31P+image and photomicrographof lymph node showing boundary of normal and me-tastatic melanoma cells. Figure 2 shows a close-upview of the 31p* map with the histologicalstain overlaid. It can be seen in the 31p* map that the boundary be-tween normal lymph tissue and melanoma tissue is significantlyclearer than it is in the histologically stained section alone. This standsto benefit the oncologist attempting to establish the extent of carci-noma or the biochemist trying identify the metallomic pathology ofcancer. Acknowledgements Prof Philip Doble and Dr Dominic Hare Elemental Bio-imaging Facility, University of Technology, Department of Chemistry andForensic Science, Sydney Broadway, New South Wales, Australia. Quantitative Bio-imaging of Copper in Mouse Brain" Copper is an essential transition metal that serves as a cofactor of various enzymes. Within the brain, Cu serves avariety of critical functions, both with respect to neurotransmitter modulation and oxidative protection. Brain levelsof Cu-containing enzymes that protect against oxidative damage are high. These include copper-zinc superoxidedismutase (SOD-1), which is located within the cell membrane and cytoplasm, and cytochrome C oxidase subunit-1(CCO-1), which is located at the mitochondrial inner membrane. Copper has been implicated in processes involved in brain aging and in the pathology of neurodegenerative condi-tions such as Alzheimer's disease, Parkinson’s disease and Wilson’s disease. Becker et al. employed LA-ICP-MS bio-imaging to determine the distribution of total Cu in mouse brain following intravenous administration to mice of age2, 8 and 14 months to identify any differences in copper uptake in differently-aged animals. Figure 3. Cresyl violet stained images (left) and digital autoradiographic phosphor images (middle) of sections of mouse brain 24 h after intrave-nous injection of Cu. The right panel shows similar brain sections analyzed by LA-ICP-MS. Images demonstrate a similar pattern of Cu uptake anddistribution, with significantly greater Cu in the CSF spaces, and relatively lower Cu in the brain parenchyma. 20 um thick sections of mouse brain tissue mounted on a glass slide were scanned with a 120 um laser beam using aUP266 laser ablation system connected to a quadrupole ICP-MS. Calibration standards were fabricated by spikinghomogenised brain tissue with known copper concentrations before freezing, microtoming and mounting in thesame manner as the brain tissue sections. These standards were analysed under the same conditions as the tissuesections, then the average signal intensities were plotted on a calibration chart. Figure 3 shows a comparison of the histologically stained tissue sections (left), digital autoradiographic phosphorimaging (centre) and LA-ICP-MS imaging (right). Correlations can clearly be seen between the distributions of SOD-1and ’Cu down to the fine structures in the brain without the need to finely dissect the tissue. Acknowledgements Dr. J. Sabine Becker Forschung Zentrum Juelich, Leo-Brandt-Strasse, 52428 Juelich, Germany. Prof. Kathryn Morton Department of Radiology, University of Utah, Salt Lake City, UT, USA Typically, observation of protein distributions in tissue are achieved by the linkage of a monoclonal antibody to acolour-contrast agent such as horseradish peroxidise or diamino-benzidine. Substitution of these antibody labelswith a heavy metal ion, such as Ni, Eu or Au, will facilitate detection of the protein distribution by LA-ICP-MS. In 2005 Hutchinson et al. analysedsections of mouse brain tissue inorder to simultaneously measure thedistributions of metal ions and beta-amyloid protein, an Alzheimer's dis-ease marker. Two experiments wereconducted: in the first an anti-beta-amyloid antibody was labelled withNi ions (a visual contrast agent): andin the second the antibody was la-belled with Eu. It was found that theNi stain provided a background signalfor non-beta-amyloid protein, whichis useful for correlation with the pho-tomicrograph, while Eu is more spe-cific to protein concentrations andgives a higher signal-to-backgroundratio (Figure 4). Figure 4. Photomicrographs (top) of TASTPM mouse brain sections labeled with monoclonalantibody to B-amyloid protein visualized with nickel-DAB (left) and and streptavidin-Eu (right). In 2008, Seuma et al. mapped the distribution ofthe MUC-1 and HER-2 proteins in breast cancertissue and healthy breast tissue using LA-ICP-MSby measurement of an antibody-linked Ag/Aulabel. Critically, the technique must be able todifferentiate between normal distributions ofthese proteins lining breast duct tissue and can-cerous tissue that completely fills breast ductswith protein. This required a very high resolutionanalysis,so a laser spot diameter of just 5 um wasapplied. Figure 5 demonstrates that imaging ofthe breast duct was achieved at this resolutionwithout compromising sensitivity (Figure5). Figure 5. Photomicrographs of alveolar structures within normal human breastand corresponding Au/Ag distribution maps by LA-ICP-MS (47 line rasters). Inset: The studies above demonstrate that LA-ICP-MS issingle line raster for Au and Ag. a viable tool for proteomics and has potential toprovide new information in metallomics research by identifying correlations between proteins and metal ion distributions on a point-by-point basis and to single cellresolution. Acknowledgements Prof. Cameron W. McLeod, Dr Rob Hutchinson, Dr Jaume Seuma. The Centre For Analytical Sciences, Department of Chemistry, The University of Sheffield, Sheffield, S3 7HF, United Kingdom. Methods For Bidmaging By Laser Ablation HVP5 Bio-imaging by laser ablation ICP-MS has the capability to extract complex data on metal and protein distributions inbiological tissue and produce images that are strikingly simple yet highly informative. However, the methods for cre-ating such images are not complicated and a little preparation can make both the acquisition and data reduction forsuch experiments relatively straightforward. Laser Ablation Methodology The first parameters to establish are those that affect resolution of the image: spot diameter, scan spacing, scan rateand acquisition cycle. Acquisition Cycle (TAcg): the length of time for all masses in the method to be measured once. This is typi-cally 10-100 ms per mass. (For this example 8 masses with an integration time of 50 ms per mass, a total of400 ms). Spot Diameter (Dspot): Individual cell size is typically between 5 um and 30 um, while features in tissue aregenerally between 30 um and 200 um, so a spot size in this range is recommended. (For this examplesPot=50区m). Scan Spacing (Dspace): In thin tissue sections that are well fixed the scan spacing can be the same as the spotsize. In thicker or more fragile tissues scan spacing may need to be increased. (For this examplespace= 50区m). Scan Rate (Rscan): The scan rate is the speed at which the sample is moved underneath the laser. Too slowand the experiment takes a long time; too fast and resolution is compromised. In addition, Rscan X TAcg mustbe
确定
还剩2页未读,是否继续阅读?

产品配置单
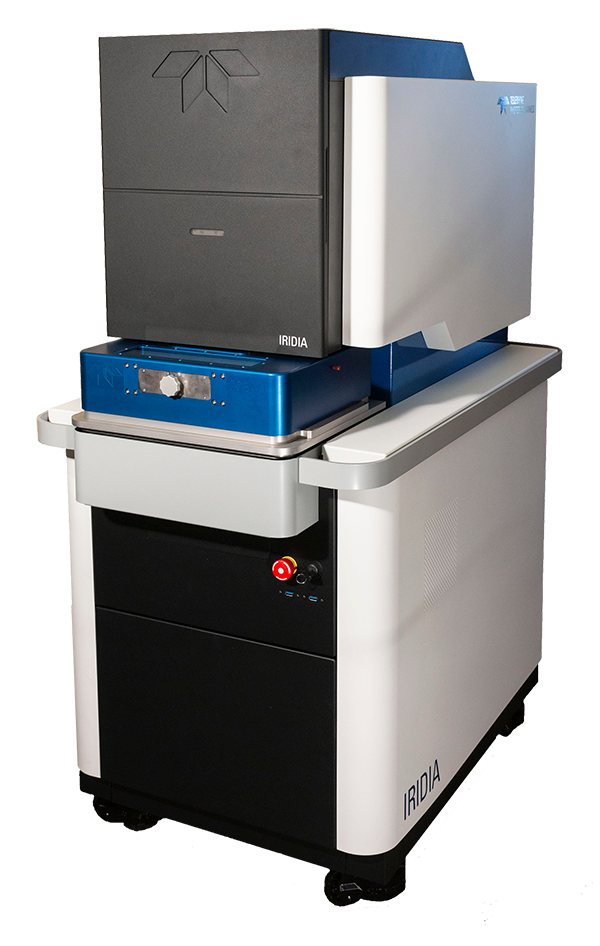
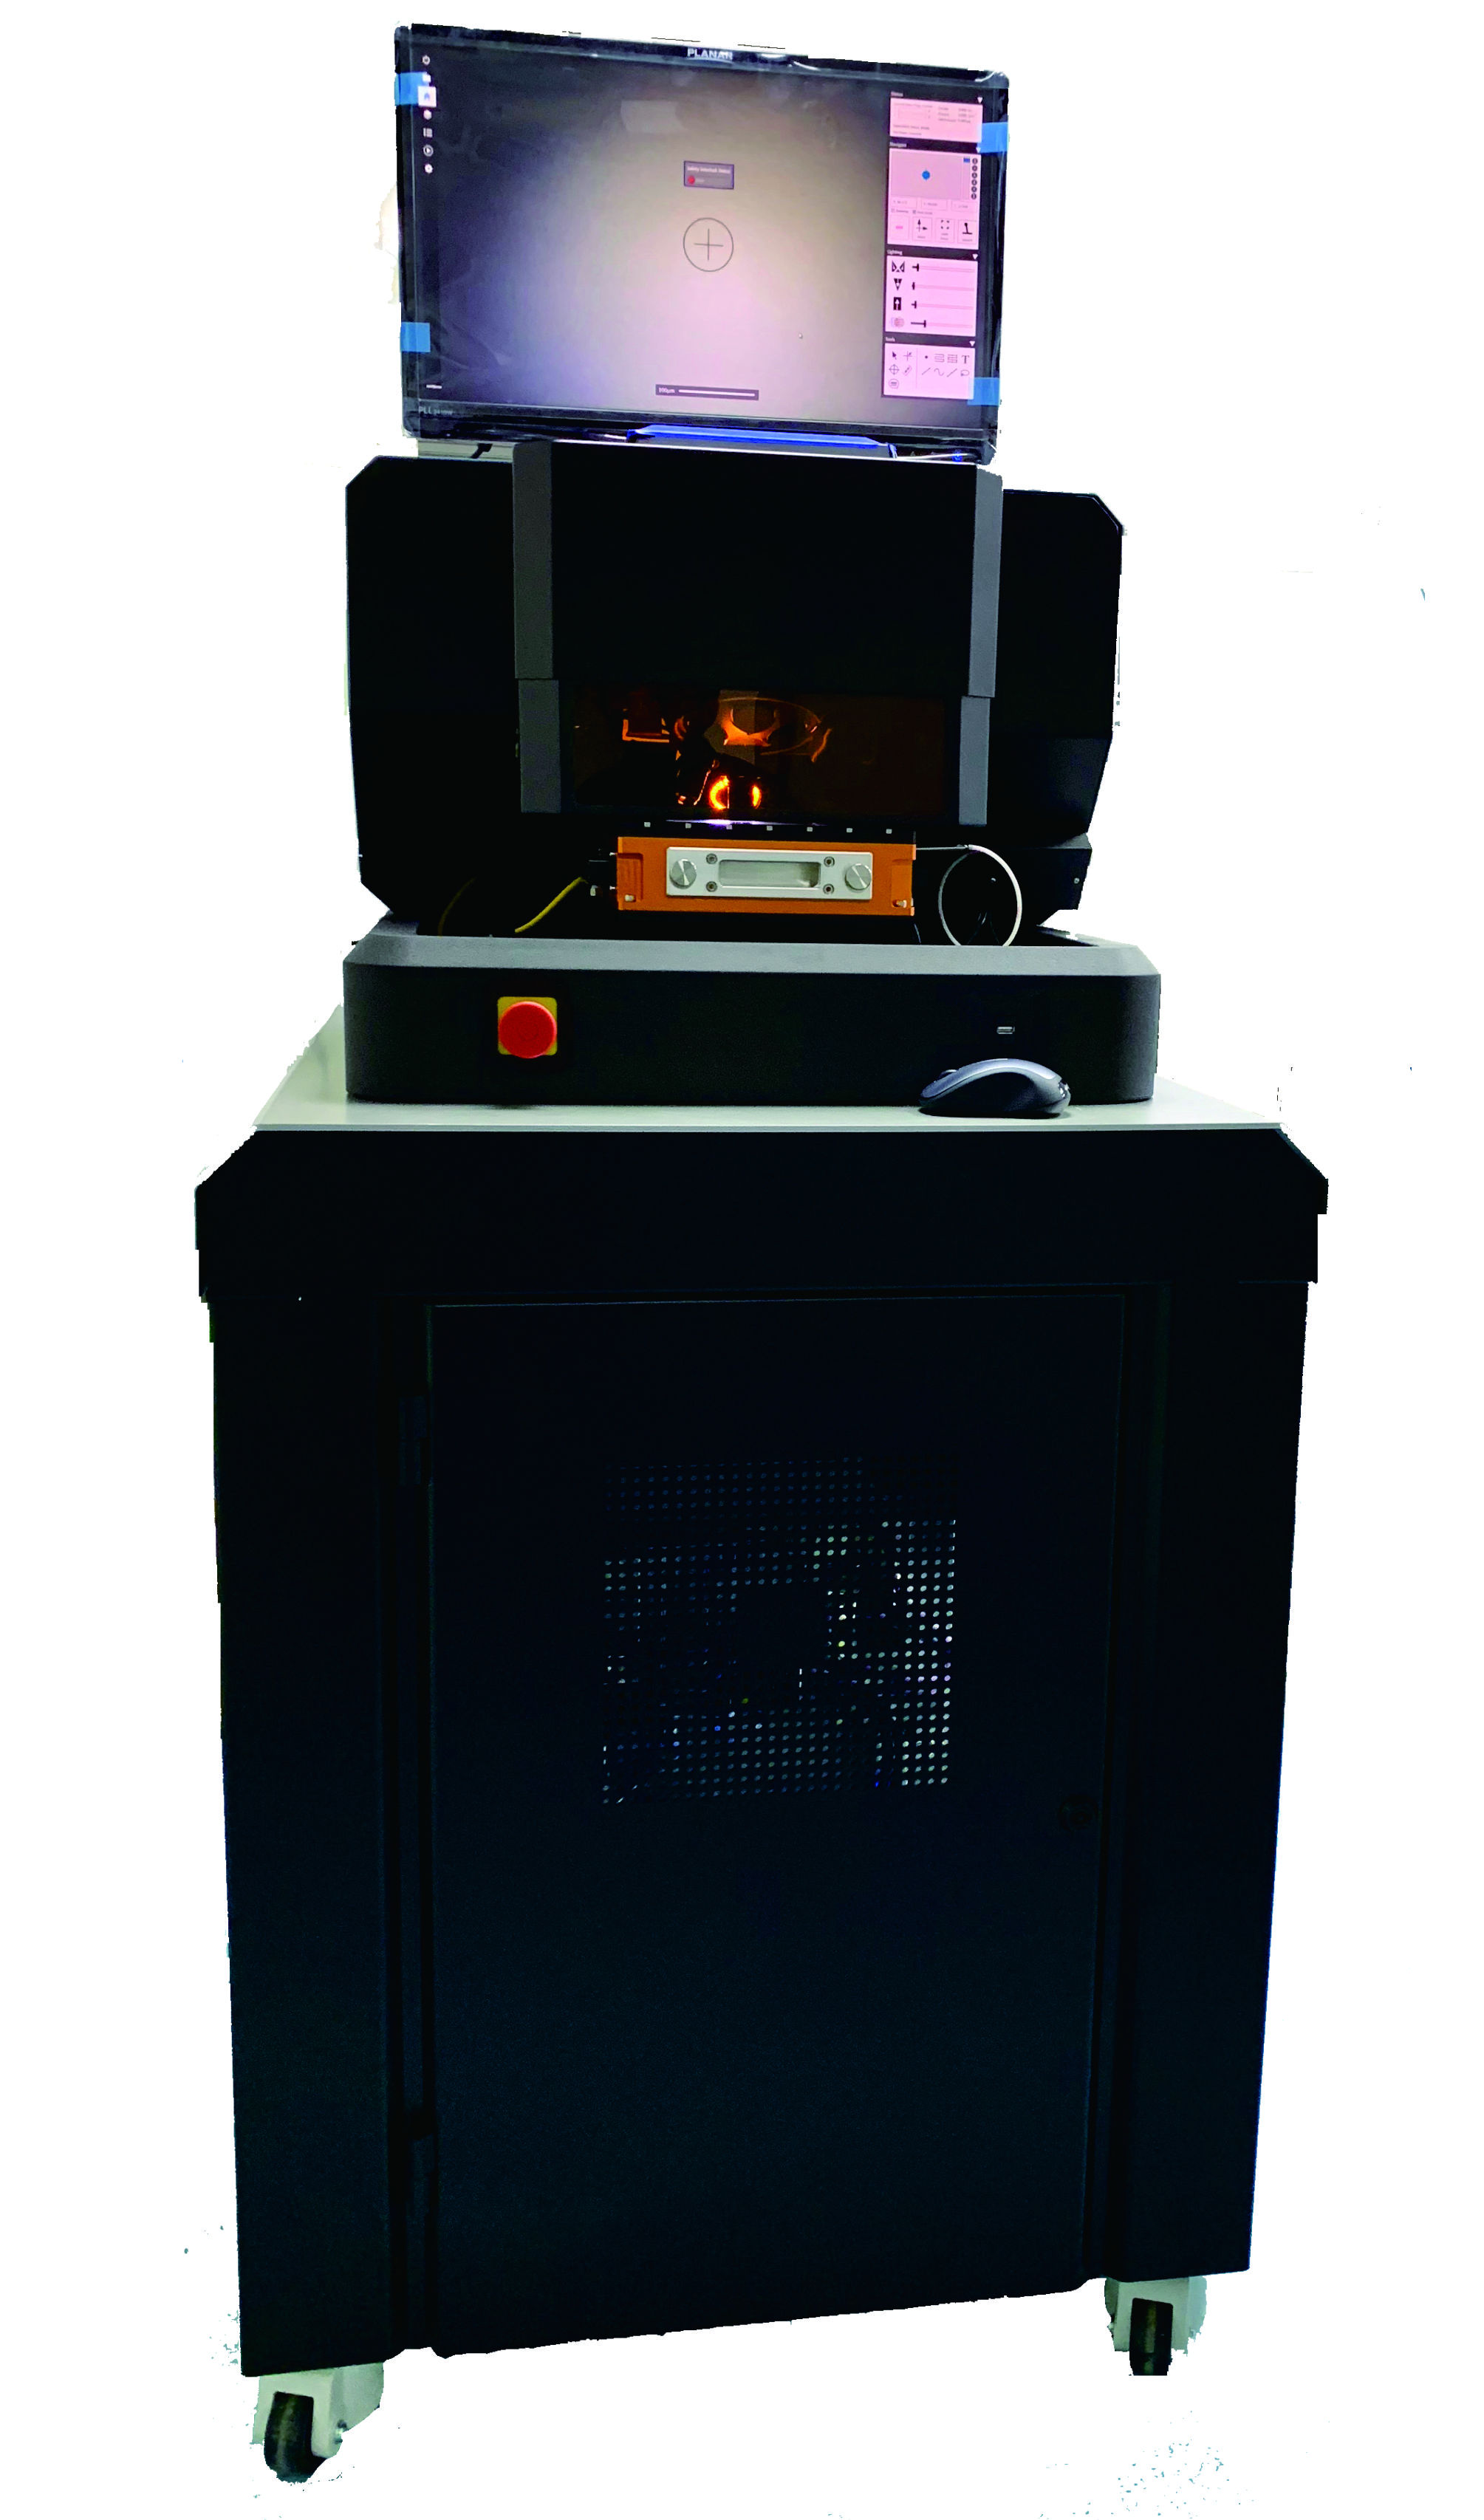
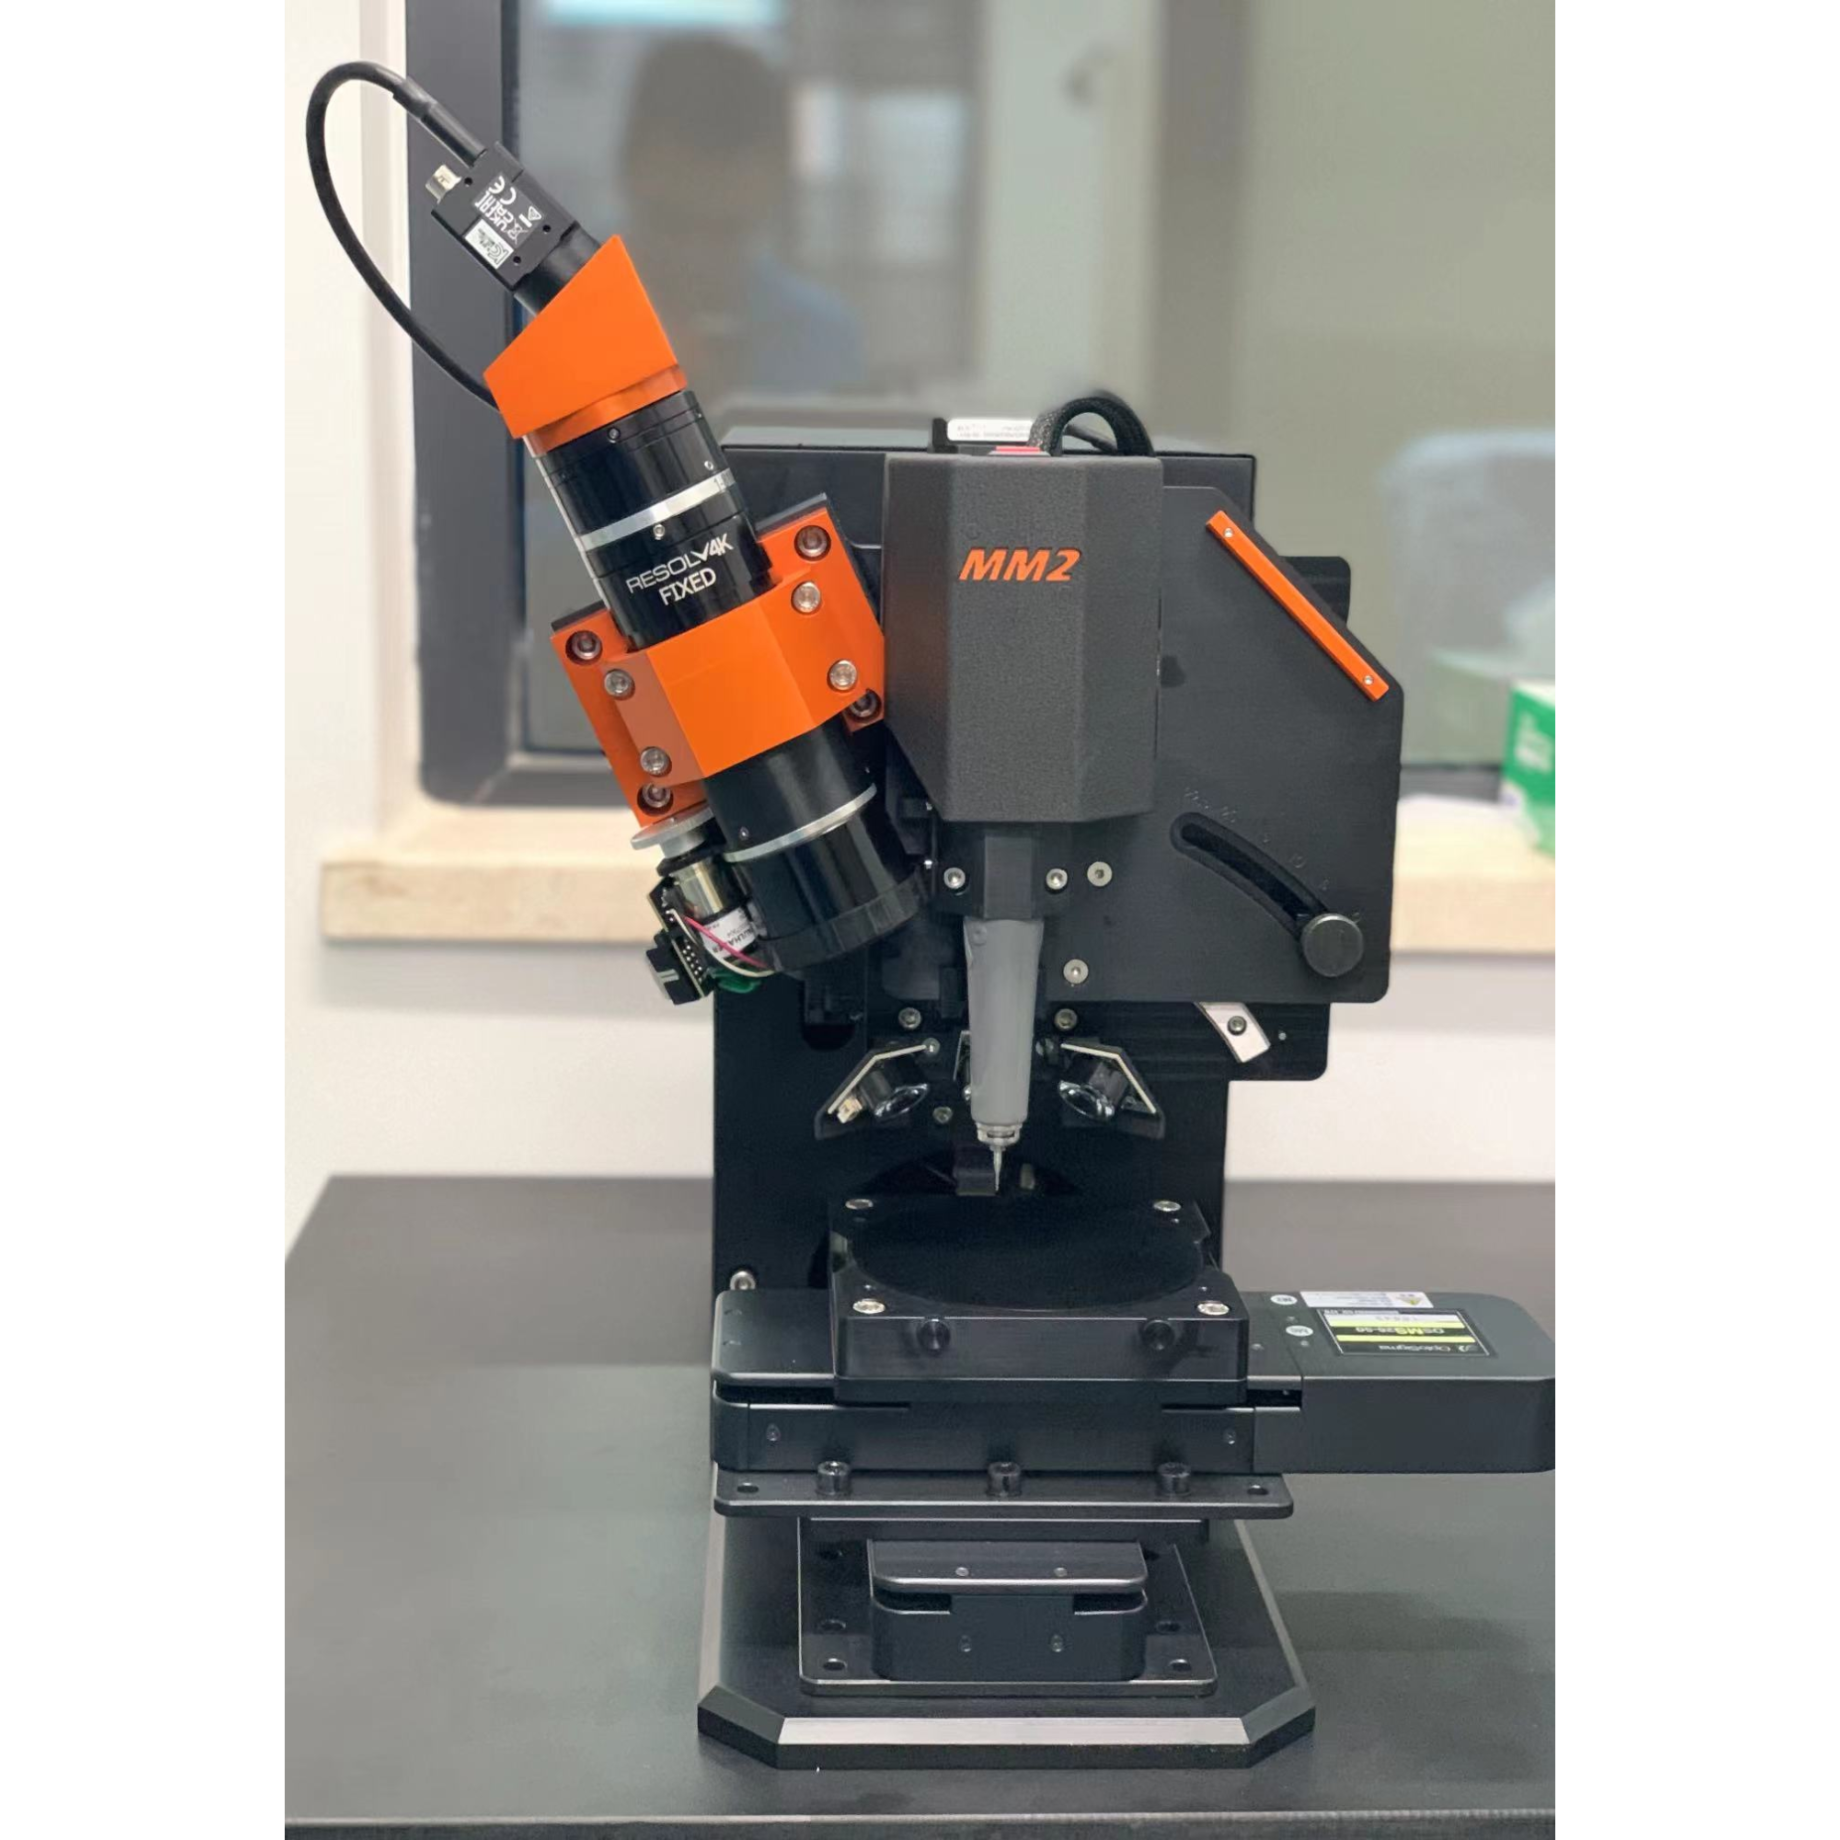
上海凯来仪器有限公司为您提供《生物样品,生物切片中金属离子检测方案(激光剥蚀进样)》,该方案主要用于其他中金属离子检测,参考标准--,《生物样品,生物切片中金属离子检测方案(激光剥蚀进样)》用到的仪器有ESL213 灵活的激光剥蚀系统
推荐专场
相关方案
更多
该厂商其他方案
更多