


方案详情
文
我们提出了一种利用激光剥蚀(LA)质谱(MS)对生物组织中元素进行成像的方法,并与激光剥蚀电感耦合等离子体(LA-ICP)质谱(MS)进行了比较。利用激光的质谱成像(MSI)提供定量数据,将组织中钠的信号丰度与应用于相邻对照组织切片的目标元素的成像定量校准标准所获得的信号丰度进行比较。LA-ICP MSI采用干滴法提供了脑组织和肾脏组织切片中几个基本元素的定量数据。采用两种方法对大鼠外伤性脑损伤模型进行成像,显示撞击区及其周围区域钠、钙的含量。LA MSI被证明是生物组织切片中特定元素定量成像的可行性选择。
方案详情

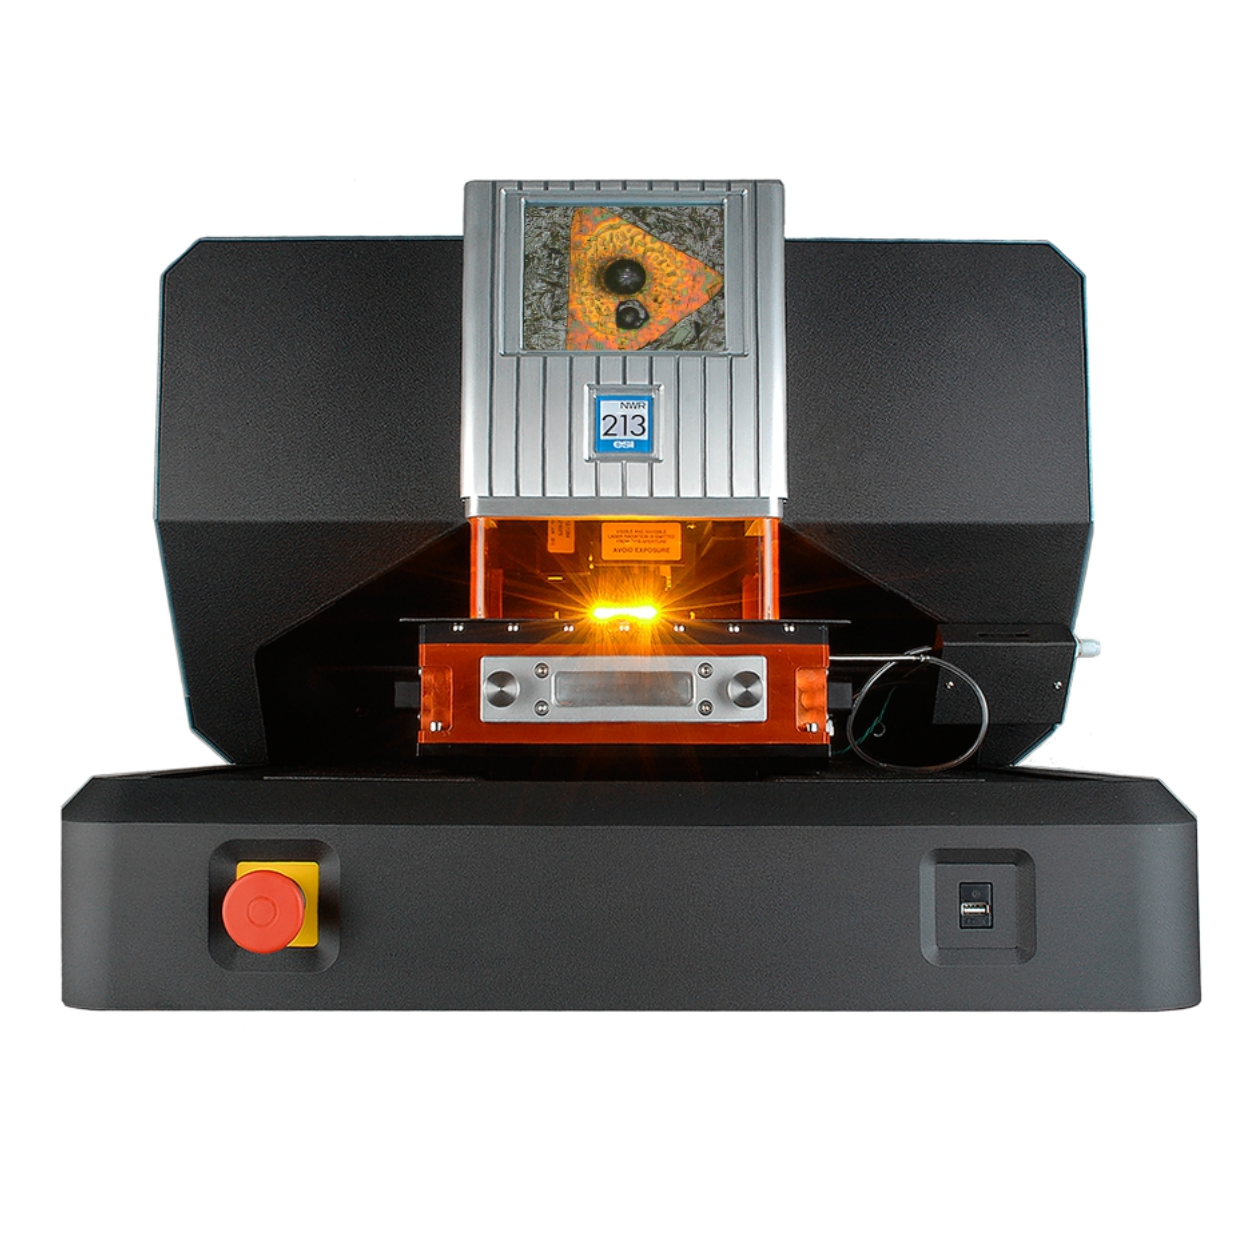
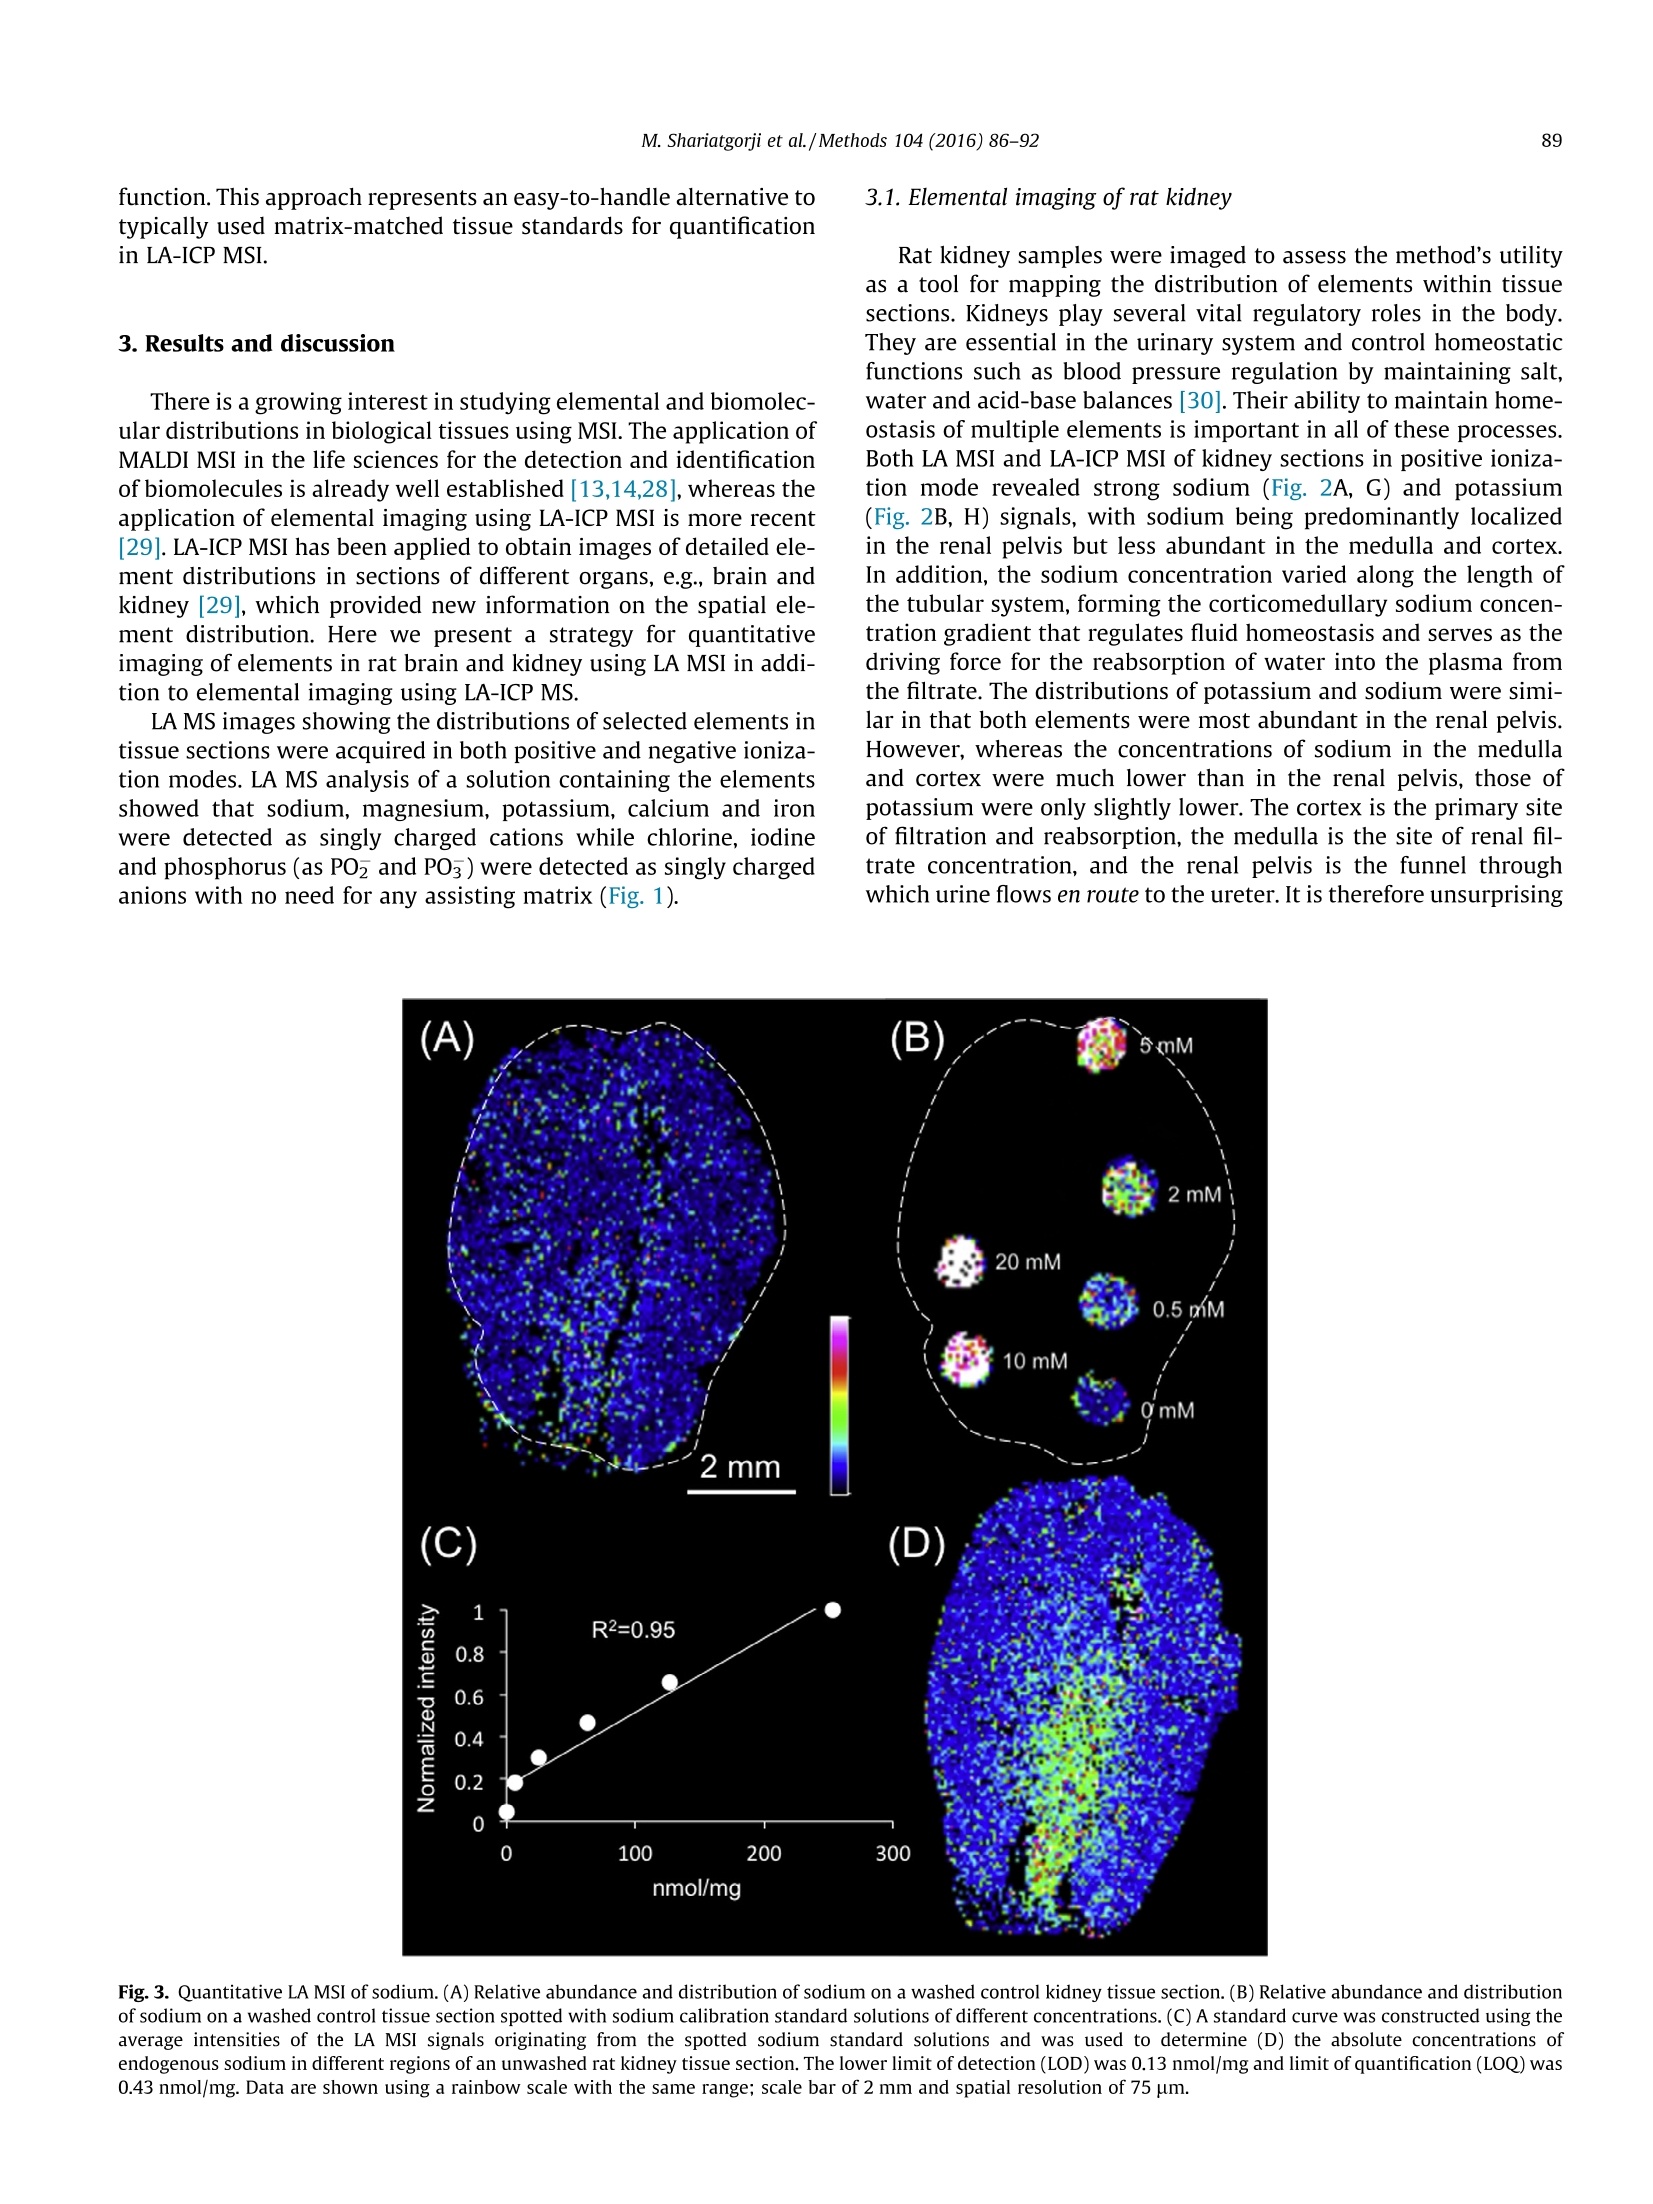
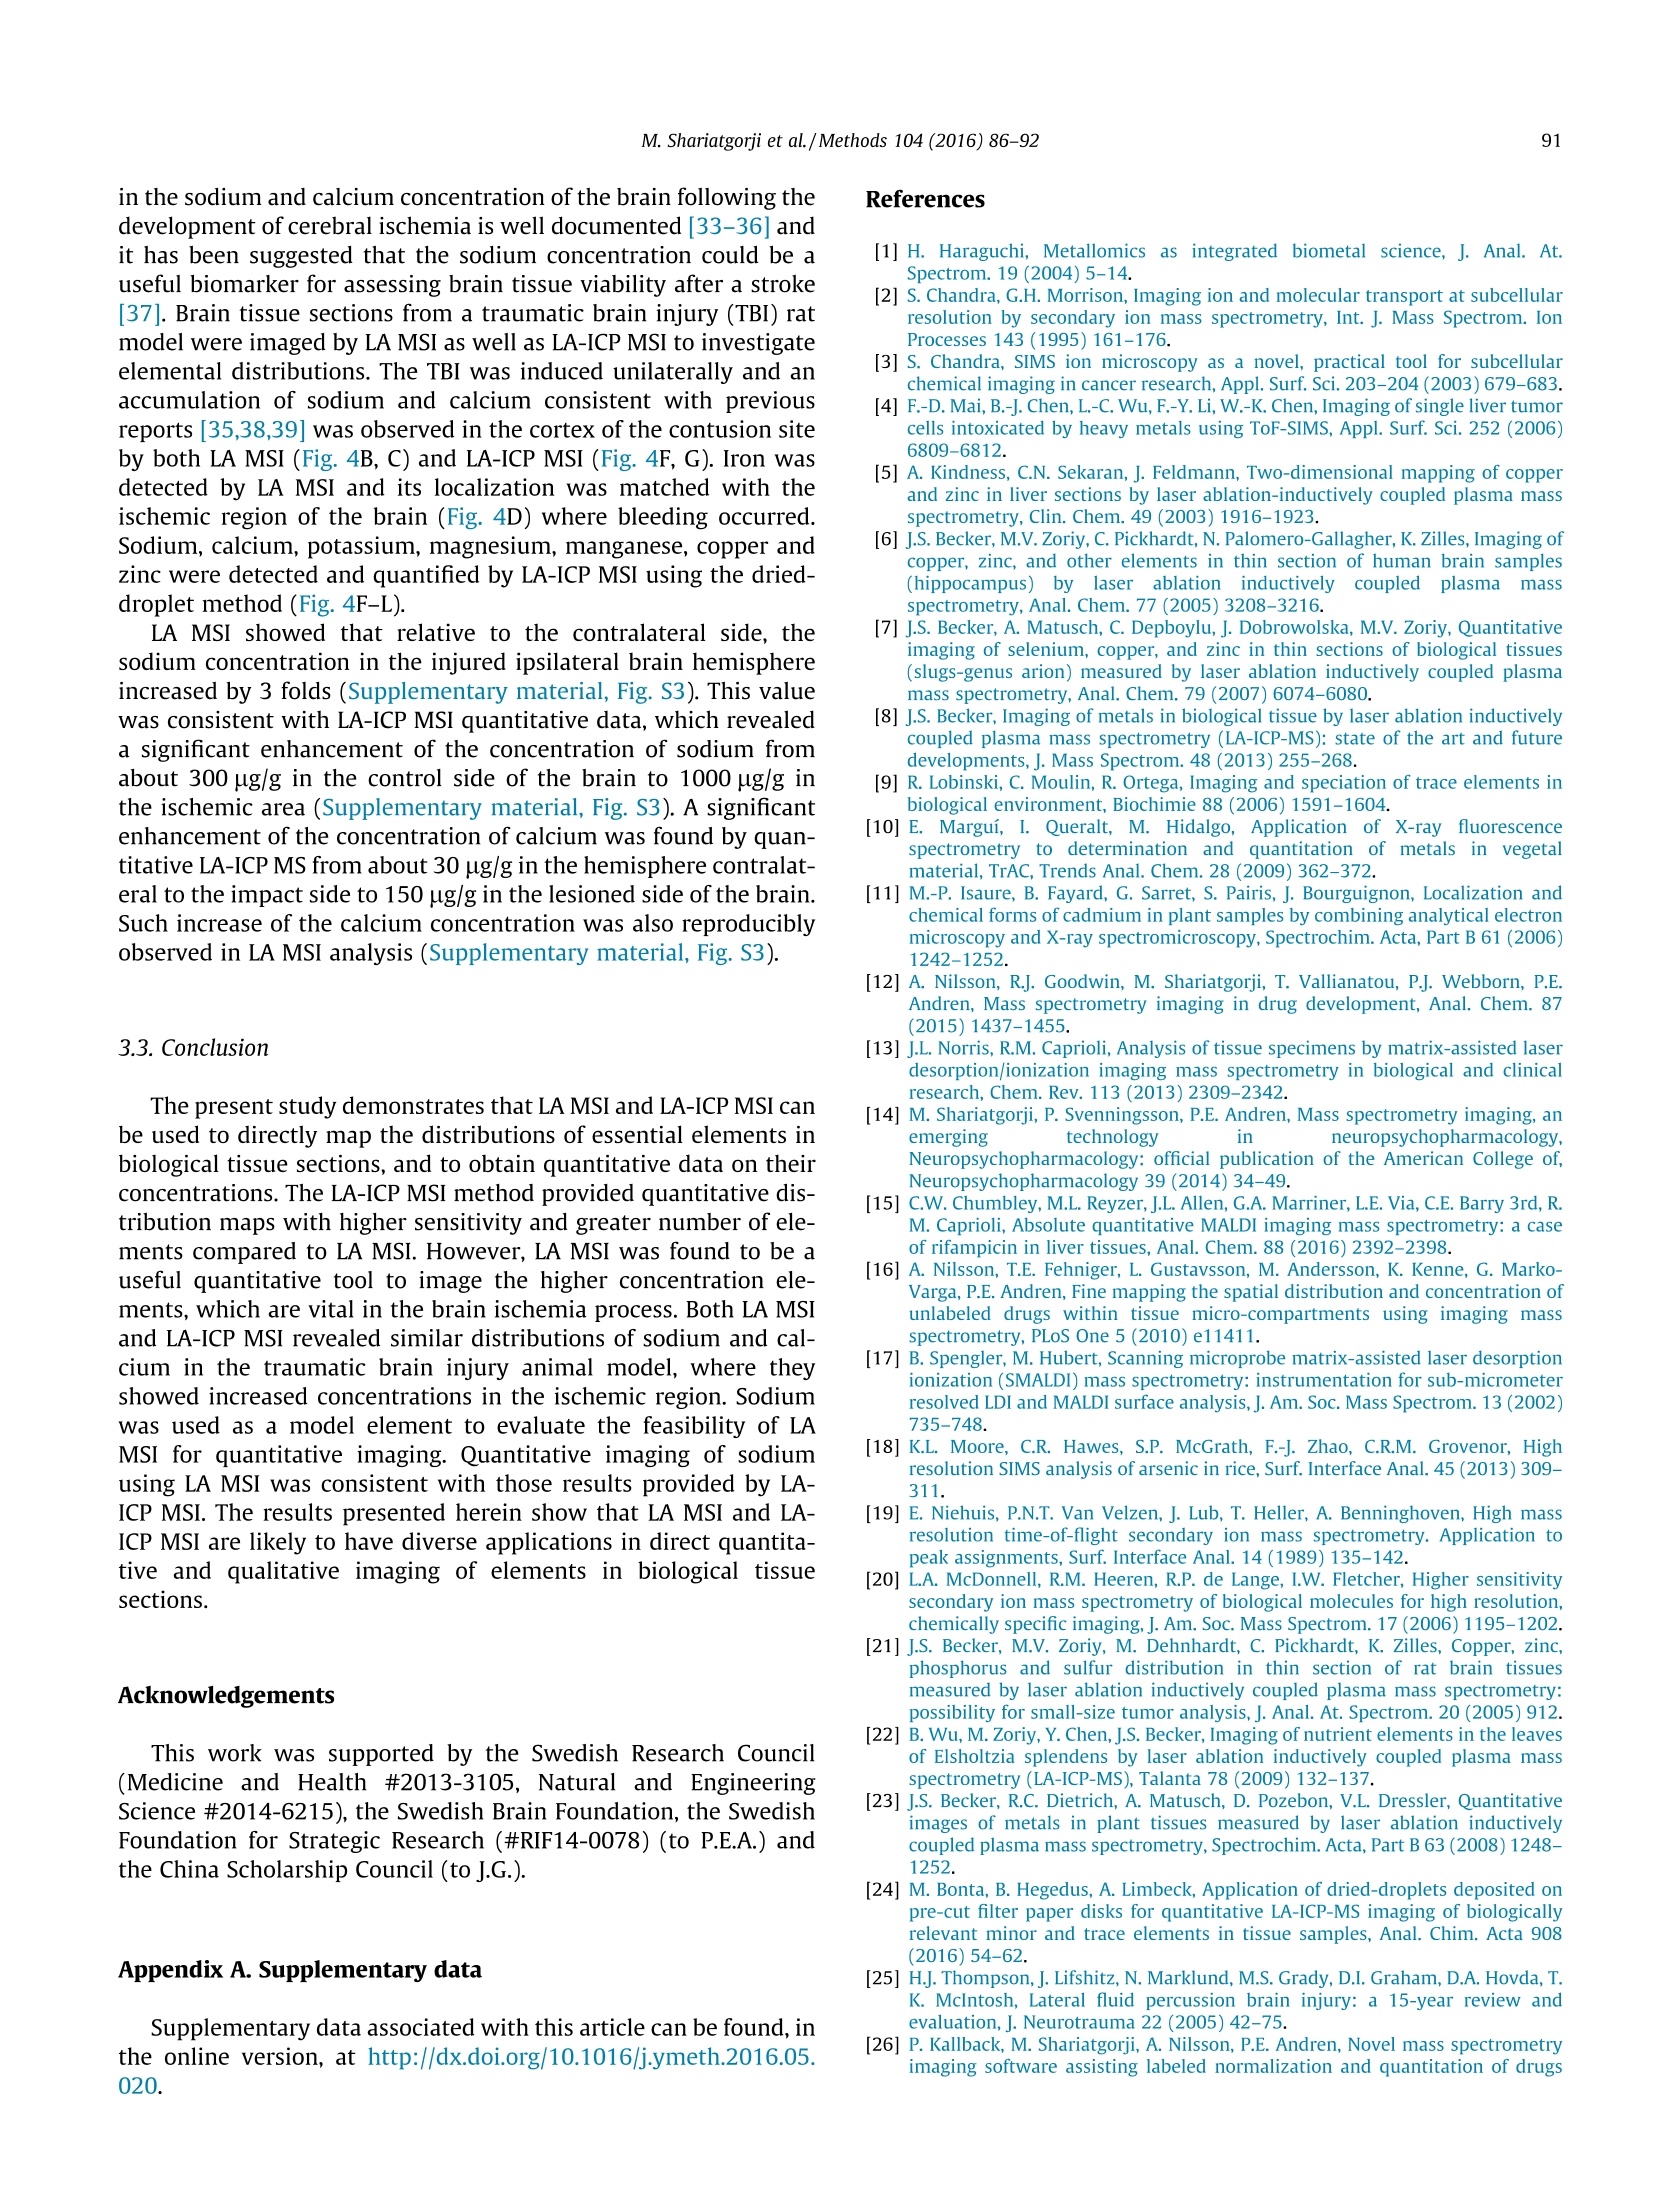
Methods 104 (2016)86-92 87M. Shariatgorji et al./Methods 104 (2016) 86-92 http://dx.doi.org/10.1016/j.ymeth.2016.05.021 Methods ELSEVI ER journalhomepage: www.elsevier.com/locate/ymeth Direct imaging of elemental distributions in tissue sections by laserablation mass spectrometry CrossMark Mohammadreza Shariatgorji , Anna Nilsson, Maximilian Bonta", Jinrui Gan·, Niklas Marklund,Fredrik Clausen", Patrik Kallback, Henrik Loden, Andreas Limbeck, Per E. Andrenina.* Biomolecular Imaging and Proteomics, Dept. of Pharmaceutical Biosciences, Uppsala University, Box 591 BMC, SE-75124 Uppsala, Sweden TU Wien, Institute of Chemical Technologies and Analytics, Vienna, Austria Department of Chemistry, Institute of Biomedical Sciences and State Key Lab of Molecular Engineering of Polymers, Fudan University, Shanghai, China“Department of Neuroscience, Neurosurgery, Uppsala University Hospital, Uppsala University, Uppsala, Sweden ARTICLEsINFO ABSTRACT Article history: We present a strategy for imaging of elements in biological tissues using laser ablation (LA) mass spec- Received 3 February 2016 trometry (MS), which was compared to laser ablation inductively coupled plasma (LA-ICP) MS. Both Received in revised form 26 May 2016 methods were adopted for quantitative imaging of elements in mouse kidney, as well as traumatic brain Accepted 31 May 2016 Available online 2 June 2016 injury model tissue sections. MS imaging (MSI) employing LA provides quantitative data by comparing signal abundances of sodium from tissues to those obtained by imaging quantitation calibration stan- Keywords: dards of the target element applied to adjacent control tissue sections. LA-ICP MSI provided quantitative data for several essential elements in both brain and kidney tissue sections using a dried-droplet approach. Both methods were used to image a rat model of traumatic brain injury, revealing accumula- Elemental imaging tions of sodium and calcium in the impact area and its peripheral regions. LA MSI is shown to be a viable Mass spectrometry option for quantitative imaging of specific elements in biological tissue sections. Laser ablation @ 2016 Elsevier Inc. All rights reserved. 1. Introduction Essential elements are involved in innumerable physiologicalprocesses in biological systems, often functioning as structuralcomponents of larger molecules and biocatalysts in diverse biolog-ical reactions. The maintenance of essential element homeostasis isvery important for the correct functioning of biological systems;deficits of these elements in tissues can cause a range of disordersand excessive levels can lead to toxic reactions [1]. It is thereforevital to understand their distribution and abundance in tissues. Essential elements are in general heterogeneously distributedin biological tissue structures. The quantitative imaging of essen-tial elements in tissue sections therefore requires the use ofanalyt-ical techniques with good spatial resolution and high sensitivity.Several techniques have been developed to investigate the distri-butions of specific elements in biological samples, includingtime-of-flight secondary ion mass spectrometry (TOF SIMS)[2-4], laser ablation inductively coupled plasma (LA-ICP) [5-8]mass spectrometry (MS), ion beam and synchrotron radiation X-ray fluorescence (XRF) microprobes [9,10] and scanning electronmicroscopy with energy disperse X-ray analysis (SEM-EDX) [11]. In recent years, matrix-assisted laser desorption/ionization(MALDI) mass spectrometry imaging (MSI) has become well estab-lished as a leading imaging technique for directly mapping the spa-tial distributions of biomolecules in tissue sections. Its ongoingbiomolecular imaging development has opened up new frontiersin metabolomics, cancer research,neuroscience and drug discovery[12-14]. Since the intensity of the MALDI MSI signal can beaffected by various analyte-specific properties such as extractionand ionization efficiencies, quantitative analysis by MALDI MSIremains challenging. Despite this limitation, it has been shownthat MALDI MSI can be used to directly and quantitatively deter-mine the absolute concentrations of target compounds in specificregions of tissue sections by comparing the signal intensities forthe regions of interest in dosed tissue samples to those for quanti-tation control spots adjacent to the regions of interest [15,16]. MALDI MSI and matrix-free laser ablation (LA)MSI have beenreported to be useful in mapping the distributions of elements[17], but quantitative elemental imaging using LA MSI has notyet been reported. Currently, the two most widely used techniquesfor analysis of biological tissue sections that exhibit good sensitiv-ity and enable multiplex data acquisition in a single analysis are The present study describes a strategy for quantitative imagingof biologically relevant elements in tissue sections by LA MSI usinga standard ionization source on a MALDI-TOF instrument. Kidneytissue sections and brain tissue sections from a traumatic braininjury rodent model were imaged by both LA MSI and LA-ICPMSI to compare and contrast, as well as to demonstrate the feasi-bility of the LA MSI method. Elements such as sodium were quan-tified by depositing quantitation calibration standards on vehiclecontrol tissue sections and then comparing the intensities of theirsignals to those observed in the regions of interest. 2. Materials and methods 2.1. Chemicals All chemicals were purchased from Fluka Chemie (Buchs,Switzerland). Deionized water (18.4MQcm) was used in all exper-iments (Millipore, Bedford, MA, USA). High purity silicon waferswere obtained from Infineon (Villach, Austria). 2.2. Tissue preparation Animal experiments were conducted in accordance with theEuropean Communities Council Directive of 24 November 1986(86/609/EEC) and approved by the ethical Committees on AnimalExperiments (No. M84-05,N351/08, C17/13,Sweden). For elemen-tal imaging of kidney samples, adult RccHan Wistar rats (HarlanLaboratories B.V., Horst, Netherlands) were kept under a 12-hlight/dark cycle with free access to food and water. To prepare tis-sue sections, the animals were sacrificed by decapitation afterwhich their kidneys were removed, frozen on dry ice, and storedat -80°C. Clinically relevant rat models of traumatic brain injury (TBI)induced by lateral fluid percussion were analyzed to map the dis-tribution of elements, which might be affected by ischemia. Thismodel features focal hemorrhagic injury to the cortex and theunderlying hippocampus as well as widespread injury of axons[25]. Each animal (male, adult Sprague-Dawley rats) was inducedin a mixture of 4% isoflurane in air for 3 min and anesthesia wasthen maintained using nitrous oxide and oxygen (70/30%) contain-ing 1.2-1.4% isoflurane administered via a nose cone. The animals’core body temperature was maintained at 37C throughout thisprocess. The anaesthetized rodents'skulls were fixed in a stereo-taxic frame, a midline incision was made, and a 4.8 mm cran-iotomy centered over the left parietal cortex was made using adental drill. A hollow Luer-Lok coupling was then placed in thecraniotomy and anchored with dental cement (Dentalon Plus,Heraeus Kulzer GmbH, Hanau, Germany) and a screw fixed overthe right hemisphere. The animals were then moved to the fluidpercussion injury device (VCU Biomedical Engineering Facility, Richmond,VA) where a lateral fluid percussion injury was pro-duced by injecting a pressure pulse of saline into the closed cranialcavity, causing an increase in intracranial pressure and braindisplacement. After the injury, an apnea and a short seizure were observed.The cap and screw were removed, the bone flap was restored toits original position, and the skin was closed with sutures. Animalswere injured in this way and allowed to survive 24 h post-injury,after which they were treated with a lethal 200-mg/kg intraperi-toneal dose of sodium pentobarbital (Pentobarbitalnatrium60 mg/ml, VET ATL, Apoteket, Sweden). After perfusion with 4℃heparinized saline the brain was rapidly removed from the cra-nium, snap frozen in isopentane, and stored at -80 C until furtherprocessing. Sections of the frozen organs with a thickness of 10 umwere cut using a cryostat microtome (Leica CM1900, LeicaMicrosystems, Wetzlar, Germany) at-20 ℃. Tissue sections weretransferred onto conductive indium tin oxide (ITO) glass slides(Bruker Daltonics, Bremen, Germany) or 1x1 cm large pieces ofa high purity silicon wafer by thaw-mounting and stored at-80℃ until analyzed. Sections were desiccated at room tempera-ture for 15 min prior to analysis. Optical images of the tissue sec-tions were acquired using a standard flatbed scanner (SeikoEpson, Japan) before being used in LA MSI and LA-ICP MSIexperiments. 2.3. Mass spectrometry imaging and quantitation LA MS and LA MSI analyses were performed using a TOF/TOFmass spectrometer equipped with its standard MALDI source(ultrafleXtreme, Bruker Daltonics) in positive and negative ionreflectron modes with a Smartbeam Ⅱ 2 kHz laser. The mass spec-trometer was operated using the manufacturer's recommended m/z Fig. 1. LA mass spectra of elements.(A) LA mass spectrum of a solution containingNat,Mg,K, Cat, Feacquired in positive ionization mode and (B) mass spectrumof Cl-, PO, and I acquired in negative ionization mode. All labeled ions weredetected as singly charged species. settings with minor adjustments to achieve optimal acquisitionperformance. The laser spot diameter was ~50 pm and the laserpower was optimized at the start of each run and then kept con-stant during the LA MSI experiment. Tissue sections were analyzedin random order to avoid bias due to variation in mass spectrome-ter sensitivity. An on-plate quantitative experiment was done toevaluate the feasibility of the method for different elements (seeSupplementary material, Fig. S1). For quantitation of sodium in rat kidney sections, endogenoussodium was washed away from control tissue sections by immers-ing the slides in 20 mM ammonium acetate solution for 10 s, fol-lowed by complete drying under high vacuum for 15 min.Sodium acetate solutions (0.5-20 mM in water) were manuallyspotted onto the washed tissue sections (0.15 pL), resulting inspots with the diameter of about 1 mm which were then analyzedby LA MSI to derive a calibration curve. Quantitation was per-formed by comparing the intensities of the endogenous sodiumsignals in unwashed rat kidney sections to those originating fromthe spotted calibration standards. LA MSI data were visualized using FlexImaging (v4.0, BrukerDaltonics) with a mass tolerance of ±0.1 Da. Regions of interestwere manually defined in the analysis software based on boththe optical and MS images. The average spectra generated for theregions encompassing the standard spots and the tissue sectionswere exported from FlexImaging into our in-house developedquantitative imaging program msIQuant (v1.2)[26] to calculate the concentration of the targeted element in selected regions bycomparing its signals to the calibration standard curve. LA-ICP MSI measurements were performed using a commer-cially available laser ablation system (NWR213, ESI,Fremont, CA)equipped with a frequency-quintupled Nd:YAG laser. LA-ICPinstrumentation was coupled to a Thermo iCAP Qc ICP MS device(ThermoFisher Scientific, Bremen, Germany) for analyte detection.Data acquisition was performed using Qtegra software provided bythe manufacturer of the instrument. The sample material wasablated under a constant stream of helium, which was mixed withargon as make-up gas upon introduction of the aerosol into the ICPMS. Detailed information about the LA-ICP MS conditions can befound elsewhere [27]. During the experiments, laser beam diame-ters ranging from 30 to 75 um were used. In each case, the stagescan speed was adjusted to be the threefold value of the beamdiameter per second (i.e., if beam diameter was X um, then scanspeed was 3X um/s). Before LA-ICP MSI measurements, the samples were coatedwith a thin layer of gold to be used as pseudo-internal standardduring the measurements [27]. This procedure allows compensa-tion of instrumental drifts during measurement time and matrix-related differences in material ablation and transport. Quantitationwas performed using dried-droplet standards [24]. Aqueous stan-dard solutions of the elements were deposited onto pre-cut filterpieces. After drying and gold coating, radial line scans wereacquired and the elements were ablated to establish a calibration Fig. 2. LA MS and LA-ICP MS images of elements from rat kidney tissue sections. (A-E) LA MS and (G-M) LA-ICP MS images of elements were acquired in positive (A, B andG-M) and negative (C-E) ionization modes. The images represent (A) Na*, (B) K*(C) Cl, (D) POz and (E) POs ions in rat kidney tissue sections acquired by LA MSI (thecorresponding optical images are shown in the insets). LA MS images are shown using a rainbow scale with the same range; scale bar of 2 mm and spatial resolution of 75 um.Quantitative MSI of the rat kidney tissue section (F) (optical image) analyzed by LA-ICP MS in positive ionization mode was performed using the dried-droplet method. Theion concentrations for the elemental distribution images of (G) sodium, (H) potassium, (I) magnesium, (J) calcium, (K) manganese, (L) copper and (M) zinc ions are shownusing a color scale (ug/g); scale bar of 2 mm and spatial resolution 75 um. function. This approach represents an easy-to-handle alternative totypically used matrix-matched tissue standards for quantificationin LA-ICP MSI. 3. Results and discussion There is a growing interest in studying elemental and biomolec-ular distributions in biological tissues using MSI. The application ofMALDI MSI in the life sciences for the detection and identificationof biomolecules is already well established [13,14,28],whereas theapplication of elemental imaging using LA-ICP MSI is more recent[29]. LA-ICPMSI has been applied to obtain images of detailed ele-ment distributions in sections of different organs,e.g., brain andkidney [29], which provided new information on the spatial ele-ment distribution. Here we present a strategy for quantitativeimaging of elements in rat brain and kidney using LA MSI in addi-tion to elemental imaging using LA-ICP MS. LA MS images showing the distributions of selected elements intissue sections were acquired in both positive and negative ioniza-tion modes. LA MS analysis of a solution containing the elementsshowed that sodium, magnesium, potassium, calcium and ironwere detected as singly charged cations while chlorine, iodineand phosphorus (as PO and PO) were detected as singly chargedanions with no need for any assisting matrix (Fig. 1). Rat kidney samples were imaged to assess the method's utilityas a tool for mapping the distribution of elements within tissuesections. Kidneys play several vital regulatory roles in the body.They are essential in the urinary system and control homeostaticfunctions such as blood pressure regulation by maintaining salt,water and acid-base balances [30]. Their ability to maintain home-ostasis of multiple elements is important in all of these processes.Both LA MSI and LA-ICP MSI of kidney sections in positive ioniza-tion mode revealed strong sodium (Fig. 2A, G) and potassium(Fig. 2B, H) signals, with sodium being predominantly localizedin the renal pelvis but less abundant in the medulla and cortex.In addition, the sodium concentration varied along the length ofthe tubular system, forming the corticomedullary sodium concen-tration gradient that regulates fluid homeostasis and serves as thedriving force for the reabsorption of water into the plasma fromthe filtrate. The distributions of potassium and sodium were simi-lar in that both elements were most abundant in the renal pelvis.However, whereas the concentrations of sodium in the medullaand cortex were much lower than in the renal pelvis, those ofpotassium were only slightly lower. The cortex is the primary siteof filtration and reabsorption, the medulla is the site of renal fil-trate concentration, and the renal pelvis is the funnel throughwhich urine flows en route to the ureter. It is therefore unsurprising Fig. 3. Quantitative LA MSI of sodium. (A) Relative abundance and distribution of sodium on a washed control kidney tissue section.(B) Relative abundance and distributionof sodium on a washed control tissue section spotted with sodium calibration standard solutions of different concentrations.(C) A standard curve was constructed using theaverage intensities of the LA MSI signals originating from the spotted sodium standard solutions and was used to determine (D) the absolute concentrations ofendogenous sodium in different regions of an unwashed rat kidney tissue section. The lower limit of detection (LOD) was 0.13 nmol/mg and limit of quantification (LOQ) was0.43 nmol/mg. Data are shown using a rainbow scale with the same range; scale bar of 2 mm and spatial resolution of 75 um. that these three regions have constitutive differences in theirsodium and potassium concentrations. While LA MSI and LA-ICPMSI generated consistent data for sodium and potassium, LA-ICPMSI was able to detect more elements such as magnesium, cal-cium, manganese, copper and zinc (Fig. 2I-M). The dried-dropletapproach generated quantitative data for all above-mentioned ele-ments. The concentrations of magnesium and calcium were higherin renal pelvis than medulla and cortex while manganese and zincrevealed the opposite distribution. Copper was found more con-centrated in the cortex structure of the kidney. During the filtration and reabsorption process, anions such aschloride, phosphate and sulfate are co-transported with the metal-lic elements. Consequently, their distributions also differ betweenthe cortex, medulla,and renal pelvis. To visualize the localizationof anions, rat kidney sections were analyzed by LA MSI in negativeion mode. Intense signals were detected for anions such as Cl,POz, and PO in this way (Fig. 2C-E). The Cl signal was strongestin the renal pelvis of the kidney; its intensity was somewhat lowerin the medulla and substantially lower in the cortex (Fig. 2C). Ingeneral, its distribution was similar to that of sodium and potas-sium. Conversely, the concentrations of POz and PO anions(Fig.2D,E) were low in the renal pelvis but much higher in the cor-tex and medulla. In the case of the phosphate anion, this patternmay reflect the distribution of fragmented phosphopeptides andphospholipids as well as glycolytic metabolites rather than freephosphate ions since high intensity of laser was used to ablatethe tissue and desorb the ions, thus making LA MSI functioning[31]. LA MSI overall spectra of the kidney tissue sections acquiredin positive and negative ion modes are shown in Supplementarymaterial (Fig. S2). The feasibility of quantitative elemental imaging by LA MSI wasevaluated by spotting iron, magnesium, calcium and iodine calibra-tion standards onto a stainless steel plate and imaging them. Theresulting ion intensities were used to construct calibration curves,which revealed that the signal intensity increased linearly with theconcentration of the targeted element (see Supplementary mate-rial, Fig. S1). To assess the potential of LA MSI quantitation in tissue samplesand to compare it with the established dried-droplet LA-ICP MSquantitation method, the concentrations of sodium in a rat kidneytissue section was measured. A control tissue section was preparedby washing to reduce the intensity of the endogenous sodium signaland increase its homogeneity (Fig. 3A), making it suitable as a back-ground for spotting calibration standards (Fig.3B). The washed sec-tion was then spotted with known concentrations of sodium andimaged to create a calibration curve relating the intensity of theion signal for each spot to its concentration. The curve exhibitedacceptable linearity, with a correlation coefficient of r=0.95within the chosen concentration range (Fig. 3C). Assuming a tissuedensity of 1 g/cm , the endogenous sodium concentrations in renalpelvis, medulla, and cortex were calculated to be 700 pg/g, 444 pg/g and 324 pg/g, respectively (Fig. 3D). These values are consistentwith previous reports [32] and are in-line with the concentrationsmeasured by quantitative dried-droplet LA-ICP MSI (Fig. 2G). 3.2. Elemental imaging of a traumatic brain injury model Essential elements such as sodium, potassium and calcium arerequired in the brain to maintain the membrane potentials thatsupport neuronal activity and to regulate cell functions. Increases 0.65 Fig. 4. LA MS and LA-ICP MS images of brain tissue sections from a traumatic brain injury model induced unilaterally by lateral fluid percussion. Optical images of rat braintissue sections 24 h post trauma that were analyzed by (A) LA MSI and (E) LA-ICP MSI, respectively. The LA MS images represent the distribution of (B) sodium, (C) calciumand (D)iron. Images were acquired at a spatial resolution of 80 um. Data are shown using a rainbow scale with the same range; scale bar of 2 mm. The quantitative LA-ICP MSimages represent the distribution of (F) sodium,(G) calcium,(H) potassium, (I) magnesium, (J) manganese,(K) copper and (L) zinc using a color scale (ug/g); scale bar of 2 mmand spatial resolution of 30 um. in the sodium and calcium concentration of the brain following thedevelopment of cerebral ischemia is well documented [33-36] andit has been suggested that the sodium concentration could be auseful biomarker for assessing brain tissue viability after a stroke[37]. Brain tissue sections from a traumatic brain injury (TBI) ratmodel were imaged by LA MSI as well as LA-ICP MSI to investigateelemental distributions. The TBI was induced unilaterally and anaccumulation of sodium and calcium consistent with previousreports [35,38,39]was observed in the cortex of the contusion siteby both LA MSI (Fig.4B, C) and LA-ICP MSI (Fig. 4F, G). Iron wasdetected by LA MSI and its localization was matched with theischemic region of the brain (Fig. 4D) where bleeding occurred.Sodium, calcium, potassium, magnesium, manganese, copper andzinc were detected and quantified by LA-ICP MSI using the dried-droplet method (Fig.4F-L). LA MSI showed that relative to the contralateral side, thesodium concentration in the injured ipsilateral brain hemisphereincreased by 3 folds (Supplementary material, Fig. S3). This valuewas consistent with LA-ICP MSI quantitative data, which revealeda significant enhancement of the concentration of sodium fromabout 300 ug/g in the control side of the brain to 1000 pg/g inthe ischemic area (Supplementary material, Fig. S3). A significantenhancement of the concentration of calcium was found by quan-titative LA-ICP MS from about 30 ug/g in the hemisphere contralat-eral to the impact side to 150 pg/g in the lesioned side of the brain.Such increase of the calcium concentration was also reproduciblyobserved in LA MSI analysis (Supplementary material, Fig. S3). 3.3. Conclusion The present study demonstrates that LA MSI and LA-ICP MSI canbe used to directly map the distributions of essential elements inbiological tissue sections, and to obtain quantitative data on theirconcentrations. The LA-ICP MSI method provided quantitative dis-tribution maps with higher sensitivity and greater number of ele-ments compared to LA MSI. However, LA MSI was found to be auseful quantitative tool to image the higher concentration ele-ments, which are vital in the brain ischemia process. Both LA MSIand LA-ICP MSI revealed similar distributions of sodium and cal-cium in the traumatic brain injury animal model, where theyshowed increased concentrations in the ischemic region. Sodiumwas used as a model element to evaluate the feasibility of LAMSI for quantitative imaging. Quantitative imaging of sodiumusing LA MSI was consistent with those results provided by LA-ICP MSI. The results presented herein show that LA MSI and LA-ICP MSI are likely to have diverse applications in direct quantita-tive and qualitative imaging of elements in biological tissuesections. Acknowledgements This work was supported by the Swedish Research Council(Medicine and Health #2013-3105, Natural and EngineeringScience #2014-6215), the Swedish Brain Foundation, the SwedishFoundation for Strategic Research (#RIF14-0078)(to P.E.A.) andthe China Scholarship Council (to J.G.). Appendix A. Supplementary data Supplementary data associated with this article can be found, inthe online version, at http://dx.doi.org/10.1016/j.ymeth.2016.05.020. ( References ) ( [1 ] H . H arag u ch i , M eta l l o mic s a s in t e g rated b i o m etal s ci e n ce, J. A na l . A t . S pectrom. 1 9 (2004) 5- 1 4. ) [2] S. Chandra, G.H. Morrison, Imaging ion and molecular transport at subcellularja.Gresolution by secondary ion mass spectrometry, Int. J. Mass Spectrom. IonProcesses 143 (1995) 161-176. [3]:S. Chandra, SIMS ion microscopy as a novel, practical tool for subcellularchemical imaging in cancer research, Appl.Surf. Sci. 203-204 (2003)679-683. [4]F.-D. Mai, B.J. Chen, L.-C. Wu, F.-Y. Li, W.-K. Chen, Imaging of single liver tumorcells intoxicated by heavy metals using ToF-SIMS, Appl. Surf. Sci. 252 (2006)6809-6812. [5] A. Kindness, C.N. Sekaran, J. Feldmann, Two-dimensional mapping of copperand zinc in liver sections by laser ablation-inductively coupled plasma massspectrometry, Clin. Chem. 49 (2003)1916-1923. [6] J.S. Becker, M.V. Zoriy, C. Pickhardt,N. Palomero-Gallagher, K.Zilles, Imaging ofcopper, zinc, and other elements in thin section of human brain samples(hippocampus) bylaser ablation11inductivelycoupledplasmamassspectrometry, Anal. Chem. 77 (2005) 3208-3216. [7]J.S. Becker, A. Matusch, C.Depboylu, J. Dobrowolska, M.V. Zoriy, Quantitativeimaging of selenium, copper, and zinc in thin sections of biological tissues(slugs-genus arion) measured by laser ablation inductively coupled plasmamass spectrometry, Anal. Chem. 79 (2007)6074-6080. [8] J.S. Becker, Imaging of metals in biological tissue by laser ablation inductivelycoupled plasma mass spectrometry (LA-ICP-MS): state of the art and futuredevelopments, J. Mass Spectrom. 48 (2013)255-268. [9]] R. Lobinski, C.Moulin, R. Ortega, Imaging and speciation of trace elements inbiological environment, Biochimie 88 (2006) 1591-1604. ( [101 E. M argui, I . Q ueralt, M. H idalgo, A ppli c ation o f X -ray f l uorescence spectrome try to determination and quantitatio n of metals i n v eg e tal mater i al, TrAC, Trends Anal. C h em. 28 (2009) 3 62-372. ) ( [11] M . - P. I s aure , B . F a yard, G. Sa r ret , S . P a iris, J. B ourguignon, Loc a lization and c h e mic a l forms o f cadm i um in plant sampl es by co m bi n ing a na l y t ical electron m icroscopy a n d X-ray spectr o microscopy, Spectro c him.Acta, Part B 6 1 (2006) 1 242-1252. ) ( [12] A. Nilsson, R. J . Goodwin, M . S ha r iatgorj i , T. Vallianatou, P.J . Webborn, P .E.Andren, M ass spectrometry i m aging in drug development, A n al. Ch e m. 87 ( 2 015)1437- 1 455. ) ( |13| J . L. Norris, R.M . C a prioli, Analysis of tissue specimens b y m a trix-assisted la s e r d esorp t ion/ionization i maging m a ss sp e ctromet r y in b i ol ogical an d cli nic al r esearch , Chem. Rev. 113 (2013)2309-2342. ) [14]M. Shariatgorji,P. Svenningsson, P.E. Andren, Mass spectrometry imaging, anemerging technology in neuropsychopharmacology,Neuropsychopharmacology: official publication of the American College of,Neuropsychopharmacology 39 (2014) 34-49. [15]C.W.Chumbley, M.L. Reyzer, J.L. Allen, G.A. Marriner, L.E. Via, C.E. Barry 3rd, R.M. Caprioli, Absolute quantitative MALDI imaging mass spectrometry: a caseof rifampicin in liver tissues, Anal. Chem. 88 (2016) 2392-2398. ( [16] A. Nilsson, T.E . Fehniger , L. Gustavsson , M. Andersson , K. Kenne, G. Marko- V arga,P . E. A n d r e n, Fine m apping th e spatial d istribution and c oncentration of unlabeled dr ugs w ithin t issue micro-compartments u s ing im agin g m as s spectrometry, PLoS One 5 (20 1 0) e1141 1 . ) ( [17] B . Speng l er, M. H u b e rt , Scan ni ng microprobe matrix-assisted l aser desorption i onization (SMALDI ) m a ss spectrometry: i nstrumen t atio n fo r sub - micro m eter r esolved LDI a nd M A L D I su r face analysi s , J. A m . S o c. M a ss Sp e c t rom. 13 ( 2002) 735-748. ) [18]K.L. Moore, C.R. Hawes, S.P. McGrath, F.J. Zhao, C.R.M. Grovenor, Highresolution SIMS analysis of arsenic in rice, Surf. Interface Anal. 45 (2013)309-311. ( [19] E . N iehuis, P .N.T . Va n V elzen, J . Lub, T . He l ler , A . Benning h ove n, H i gh m a ssresolution time-of - fligh t secondary ion mass spectrometry. Application to p eak assi g nm e nts, S u rf . I nterface Anal. 14 (1989) 13 5-1 4 2. ) ( [20] L .A . M cDonnel l , R . M. H e eren, R . P . d e Lange , I. W . Fl et c h er, H i g h er s ensitivity s econdary i o n mas s spectromet r y of b i ological mol e cules fo r high resolution, c hemi c ally specific i maging, J. Am. Soc . Mass Spectrom. 1 7 (2006)1 1 95-1202. ) ( [21] J.S. Bec k er, M . V. Zoriy, M . D e h nha r dt, C . P i c khardt, K . Z i ll es , C opper , zinc,phosphorus a n d s u lf u r d i stribution in t h in section of r a t b r ain t i ssu e s measured b y D l a ser ablation i nductivel y cou pl ed pl asma m ass spectrometry: p ossib i l i t y f or small- s ize t u mor analysis, J . Anal. At . Spectrom . 2 0 (2005) 9 1 2 . ) 221B. Wu,M.Zoriy, Y. Chen, J.S. Becker, Imaging of nutrient elements in the leavesof Elsholtzia splendens by laser ablation inductively coupled plasma massspectrometry (LA-ICP-MS), Talanta 78 (2009) 132-137. ( [23 J . S. Bec k er, R.C. Dietrich, A. Ma t usch, D. Pozebon, V .L. D r e s sler, Q uantitative images of metals i n p l ant t i ssues measured b y la s er a b l ation in d uctively couple d plasma mass spectr o met r y , Spectrochim. Acta, Part B 63 (2008)12 4 8- 1 252 . ) [24]M. Bonta, B. Hegedus, A. Limbeck, Application of dried-droplets deposited onpre-cut filter paper disks for quantitative LA-ICP-MS imaging of biologicallyrelevant minor and trace elements in tissue samples, Anal. Chim. Acta 908(2016)54-62. ( [25] H . J. Thompson,J. L ifshitz, N . Marklun d , M.S. Grady, D. I . Graham, D.A. Hovda, T . K . M cIntosh , L a teral f luid p ercussion b r ai n i nj u ry: a 1 5-ye a r review a n d eval uat ion , J. Neurotrauma 22 (2005) 42 - 75 . ) ( [26] P . K allback, M . Shariatgorji, A . Nilsson, P.E. An d ren , N o v el mass spectrometry i maging s o ftware assisti ng l a b e led n o rmalization an d quan t itation of d rug s ) ( and neuropeptid e s directly in ti s sue s e ctions, J. Proteomics 75 ( 2 012) 4941- 4951 . ) [27] M. Bonta, H. Lohninger, V. Laszlo, B. Hegedus, A. Limbeck, Quantitative LA-ICP-MS imaging of platinum in chemotherapy treated human malignant pleuralmesothelioma samples using printed patterns as standard, J. Anal. At.Spectrom. 29 (2014)2159-2167. [28]R.M. Caprioli, T.B. Farmer,J. Gile, Molecular imaging of biological samples:localization of peptides and proteins using MALDI-TOF MS, Anal. Chem. 69(1997)4751-4760. [29]J.S. Becker, M. Zoriy, J.S. Becker, J. Dobrowolska, A. Matusch, Laser ablationinductively coupled plasma mass spectrometry (LA-ICP-MS) in elementalimaging of biological tissues and in proteomics, J. Anal. At. Spectrom. 22(2007)736-744. [30] M. Werner, M.J. Costa, Nephrotoxicity of xenobiotics (vol 237, pg 107, 1995),Clin. Chim. Acta 243 (1995)(1995)101-102. [31] M. Edelson-Averbukh, R. Pipkorn, W.D. Lehmann, Phosphate group-drivenfragmentation of multiply charged phosphopeptide anions. ImprovedOfrecognition of peptides phosphorylated at serine, threonine, or tyrosine bynegative ion electrospray tandem mass spectrometry, Anal. Chem. 78 (2006)1249-1256. [32] S. Leung, B. Williams,A. Chan, M. Minski, J. Lai, Elemental analyses in organsystems in a small animal after life-long controlled diet, Adv. Biochem. Eng.(2011)45-48. [33] A.L. Betz, R.F. Keep, M.E. Beer, X.D. Ren,Blood-brain barrier permeability andbrain concentration of sodium, potassium, and chloride during focal ischemia,J. Cereb. Blood Flow Metab. 14 (1994) 29-37. [34]U. Ito, K. Ohno, R. Nakamura, F. Suganuma, Y. Inaba, Brain edema duringischemia and after restoration of blood flow. Measurement of water, sodium,potassium content and plasma protein permeability, Stroke 10 (1979) 542-547. [35] S.C. Jones, A. Kharlamov, B. Yanovski, D.K. Kim, K.A. Easley, V.E. Yushmanov,S.K. Ziolko, F.E. Boada, Stroke onset time using sodium MRI in rat focal cerebralischemia, Stroke 37 (2006) 883-888. [36] J.K. Deshpande, B.K. Siesjo, T. Wieloch, Calcium accumulation and neuronaldamage in the rat hippocampus following cerebral ischemia, J.Cereb. BloodFlow Metab. 7 (1987)89-95. [37]1F.E. Boada,Y. Qian,E. Nemoto, T. Jovin, C. Jungreis, S.C. Jones,J. Weimer,V. Lee,Sodium MRI and the assessment of irreversible tissue damage during hyper-acute stroke, Transl.Stroke Res. 3 (2012) 236-245. [38]V\.E. Yushmanov, A. Kharlamov, B. Yanovski, G. LaVerde, F.E. Boada, S.C. Jones,Correlated sodium and potassium imbalances within the ischemic core inexperimental stroke:a 23Na MRI and histochemical imaging study, Brain Res.1527(2013)199-208. [39] P.E. Bickler, B.M. Hansen, Causes of calcium accumulation in rat cortical brainslices during hypoxia and ischemia: role of ion channels and membranedamage, Brain Res. 665 (1994) 269-276. 我们提出了一种利用激光剥蚀(LA)质谱(MS)对生物组织中元素进行成像的方法,并与激光剥蚀电感耦合等离子体(LA-ICP)质谱(MS)进行了比较。利用激光的质谱成像(MSI)提供定量数据,将组织中钠的信号丰度与应用于相邻对照组织切片的目标元素的成像定量校准标准所获得的信号丰度进行比较。LA-ICP MSI采用干滴法提供了脑组织和肾脏组织切片中几个基本元素的定量数据。采用两种方法对大鼠外伤性脑损伤模型进行成像,显示撞击区及其周围区域钠、钙的含量。LA MSI被证明是生物组织切片中特定元素定量成像的可行性选择。
确定


还剩5页未读,是否继续阅读?

产品配置单
上海凯来仪器有限公司为您提供《组织切片中元素分布检测方案(激光剥蚀进样)》,该方案主要用于其他中元素分布检测,参考标准--,《组织切片中元素分布检测方案(激光剥蚀进样)》用到的仪器有ESL213 灵活的激光剥蚀系统
推荐专场
相关方案
更多
该厂商其他方案
更多