


方案详情
文
采用双腔Gemini型PIV Nd:YAG 激光器系统做照明光源。532nm波长,200毫焦/脉冲输出能量。脉冲宽度5纳秒。测量部分采用4台LaVision Imager sCMOS高灵敏度相机。相机像素5百50万.进行水流通过突扩管的3D3C层析PIV流场测量。
方案详情

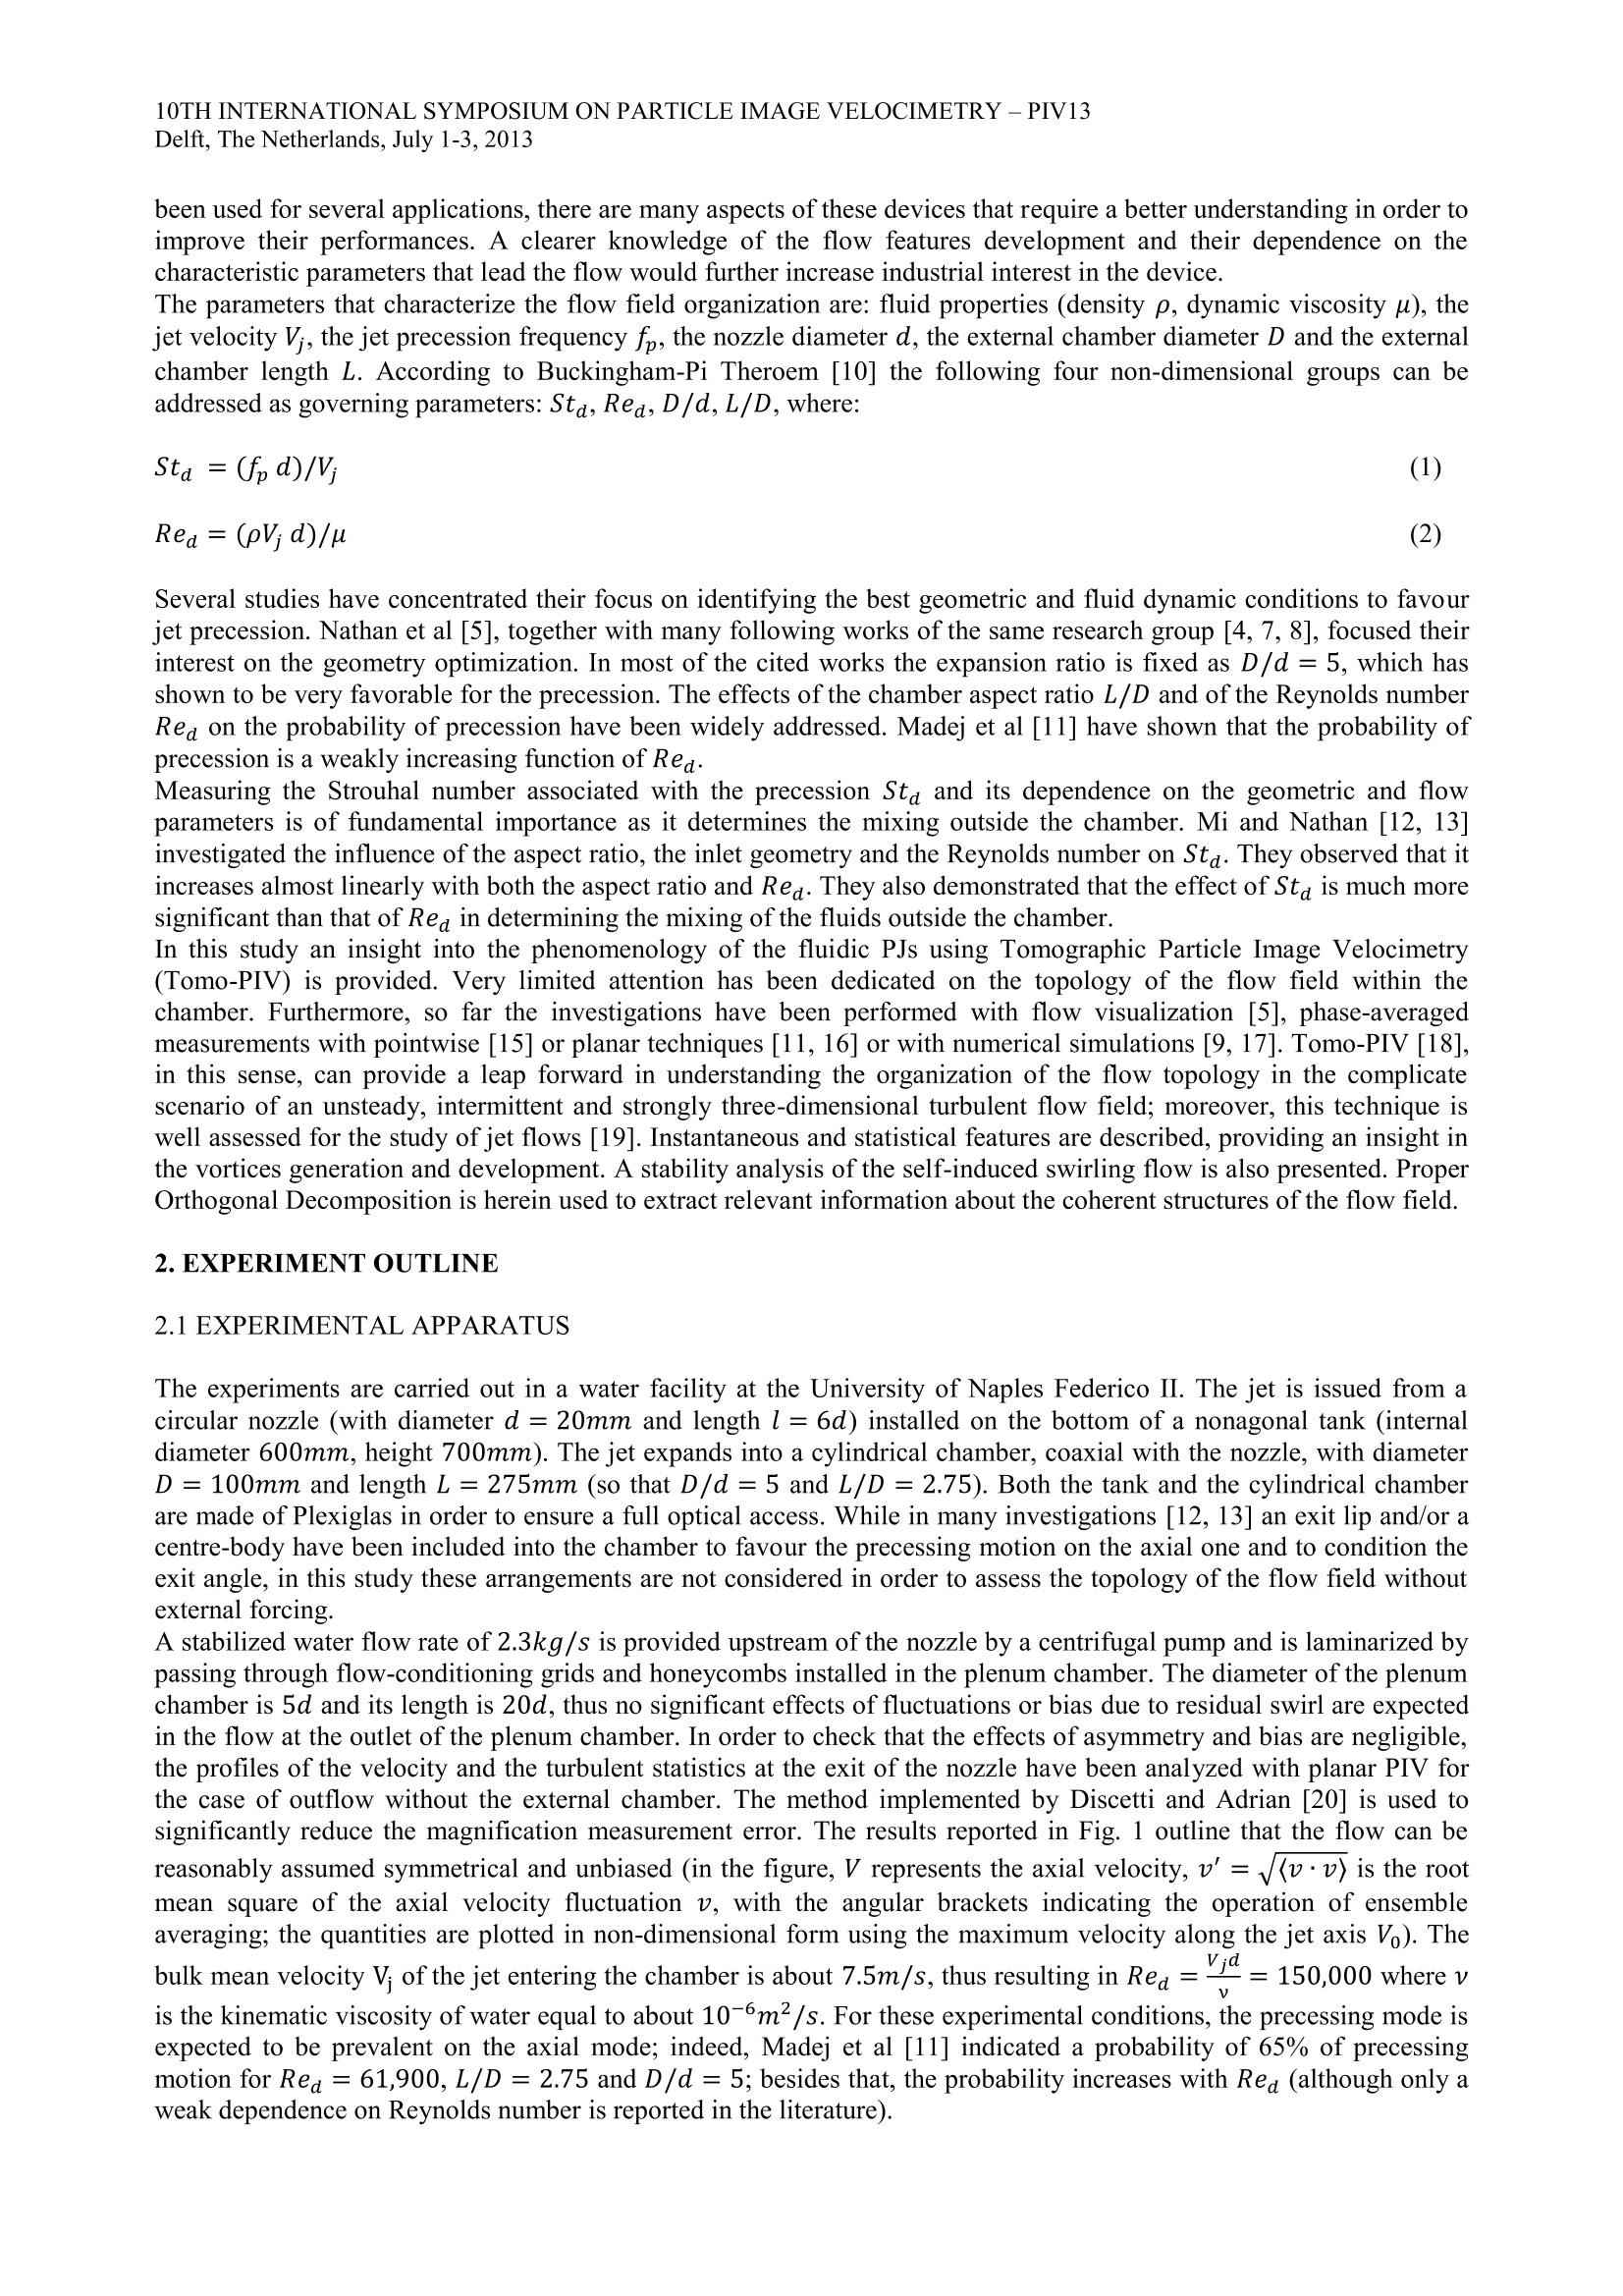
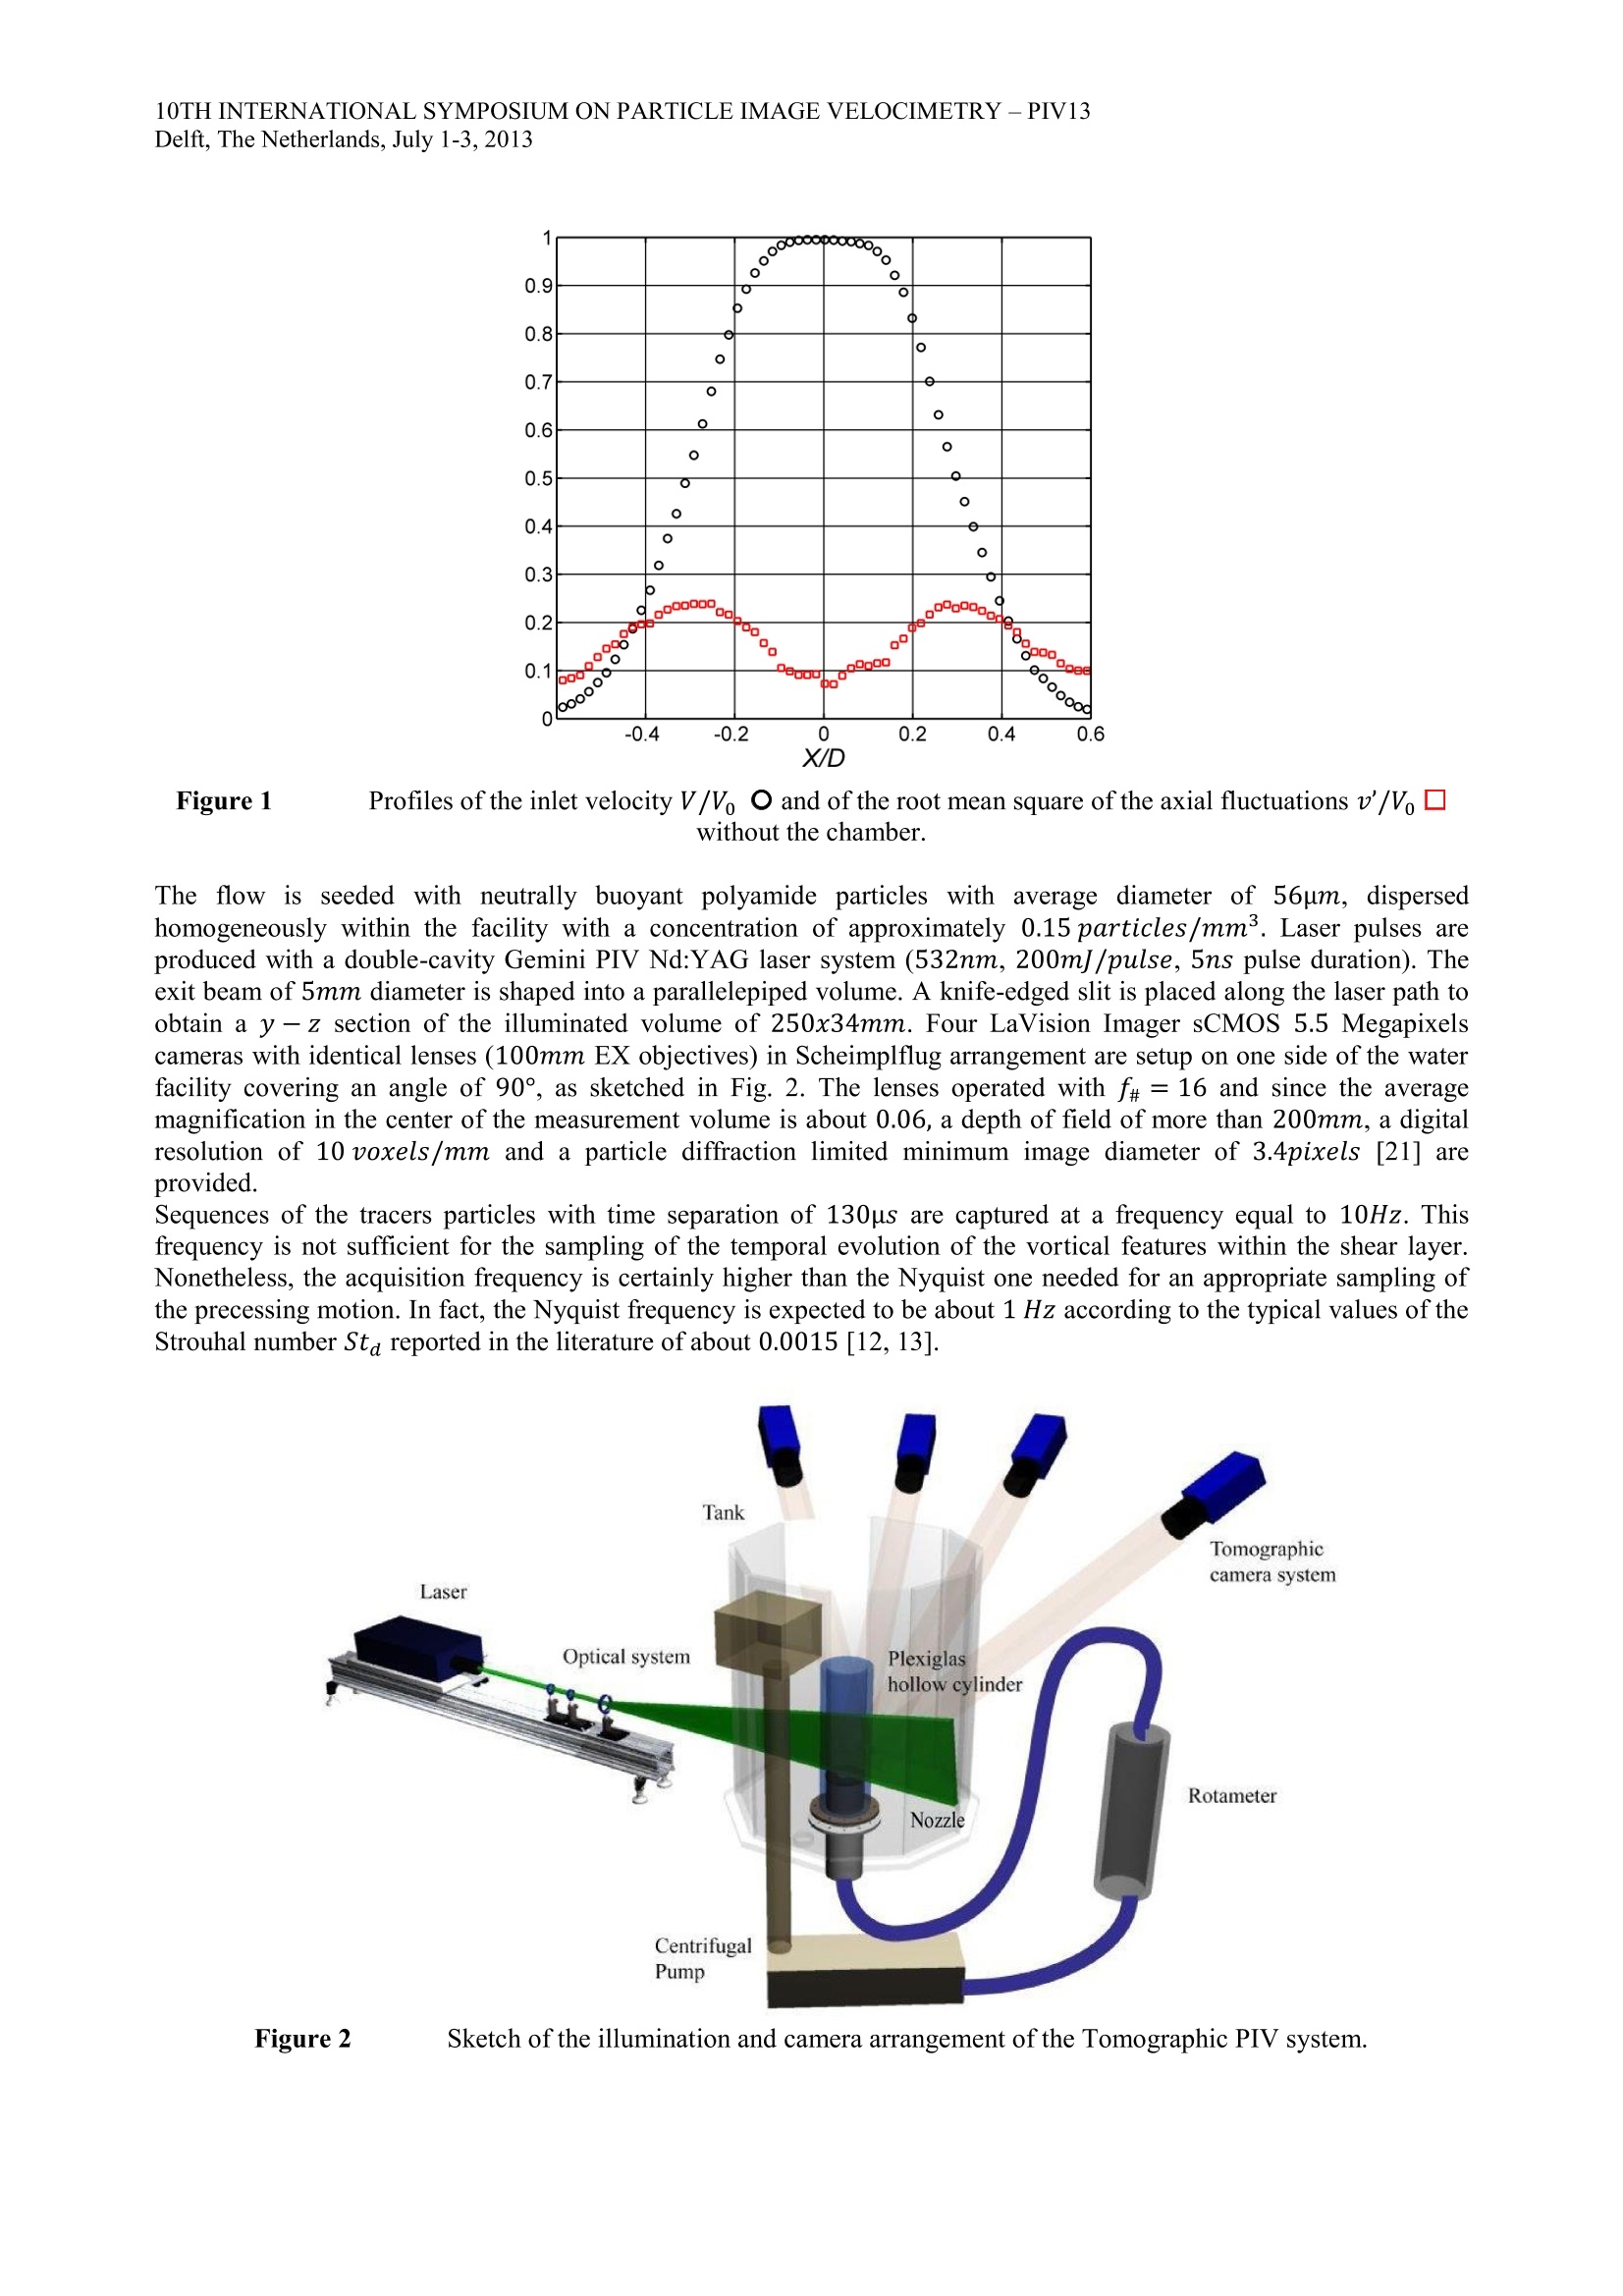
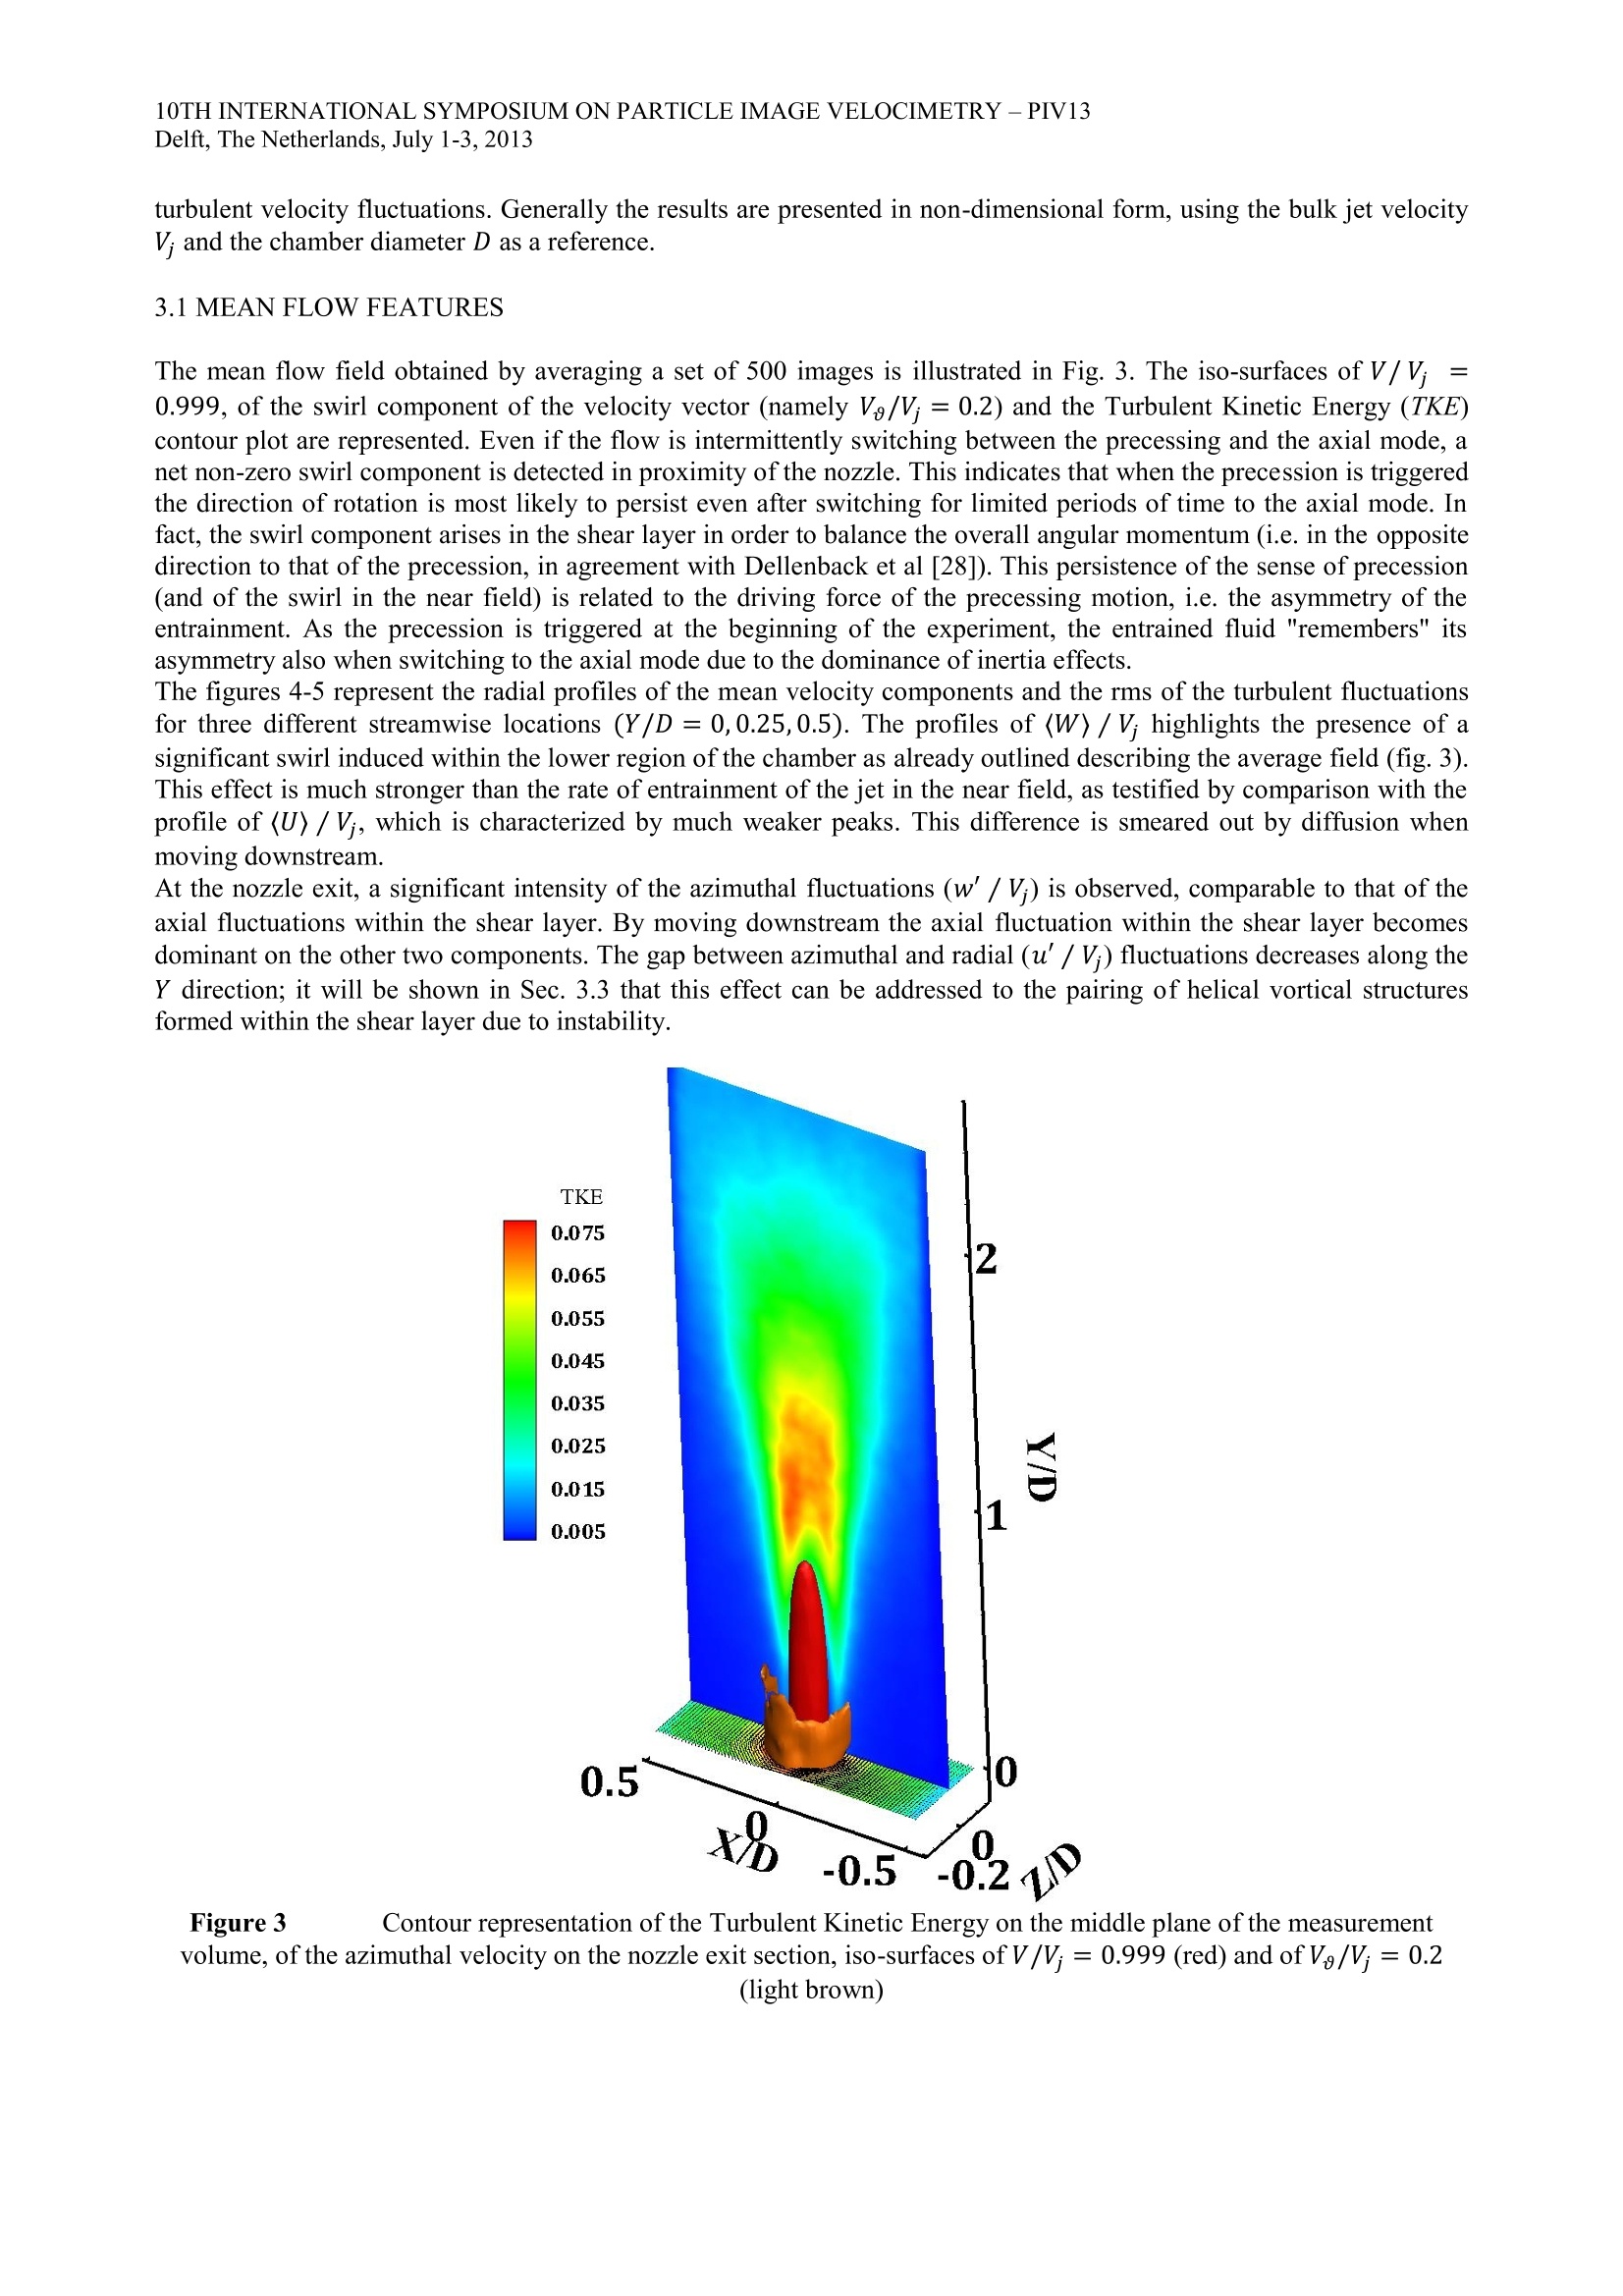
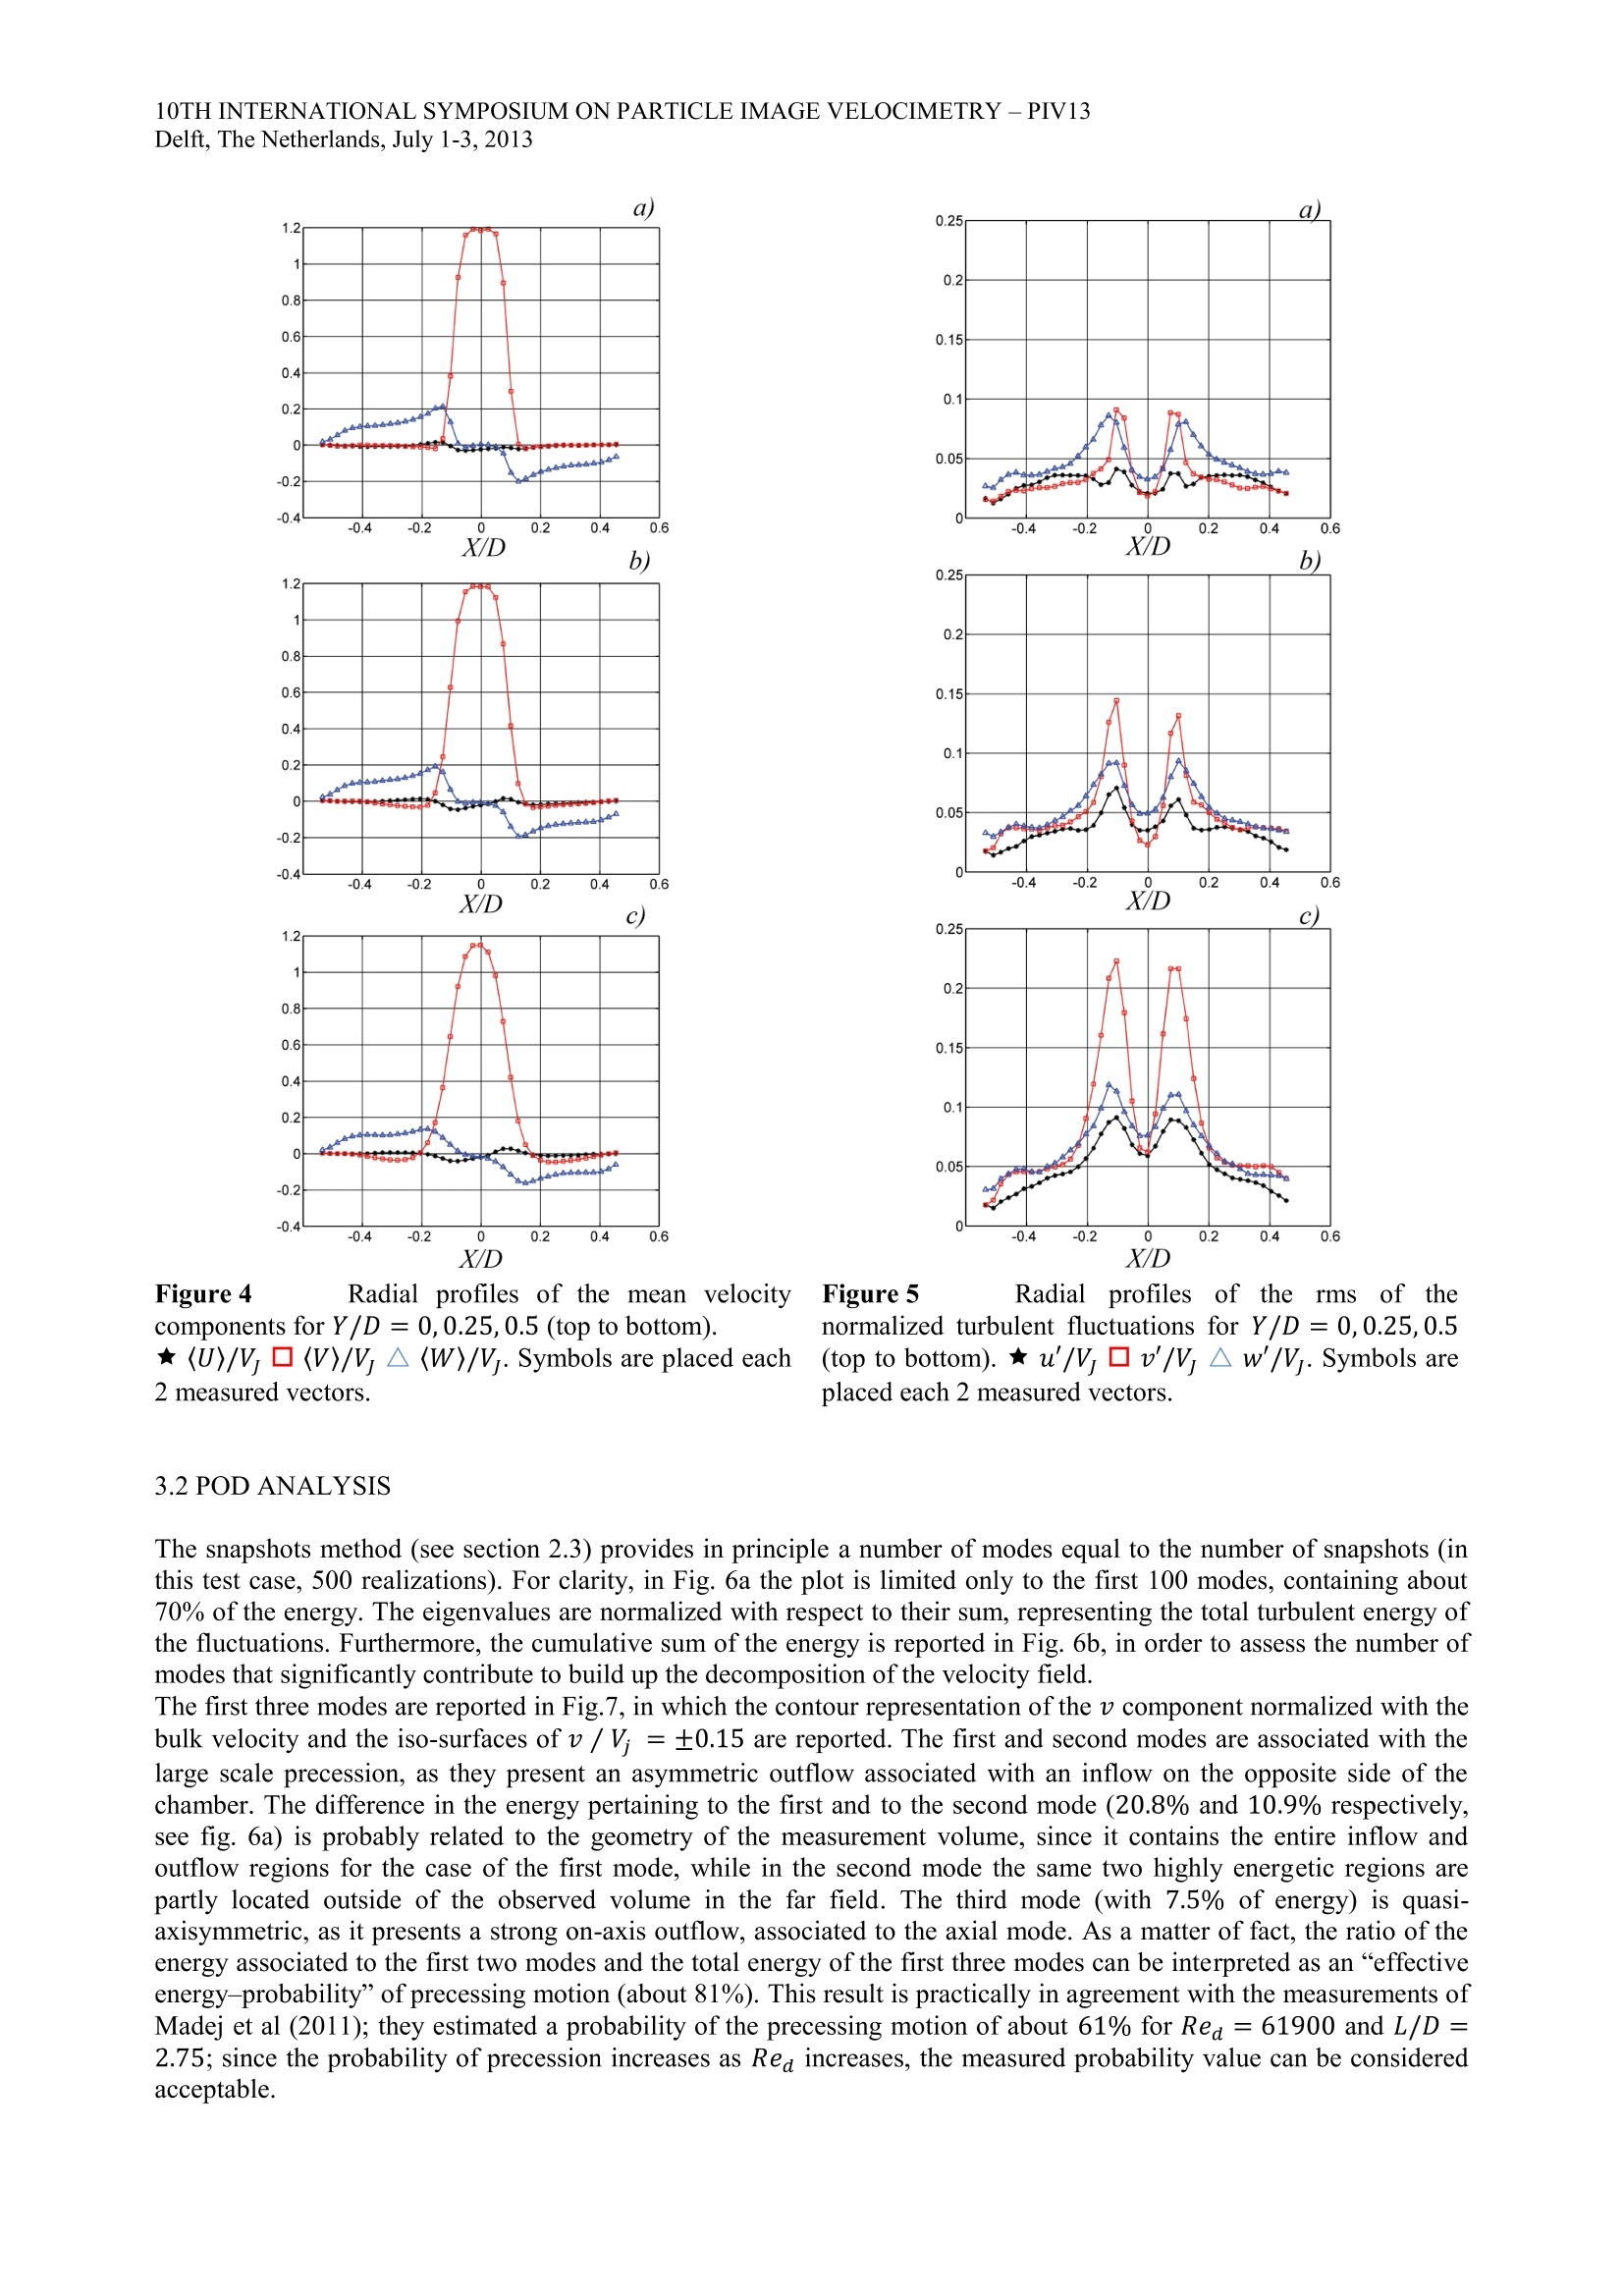
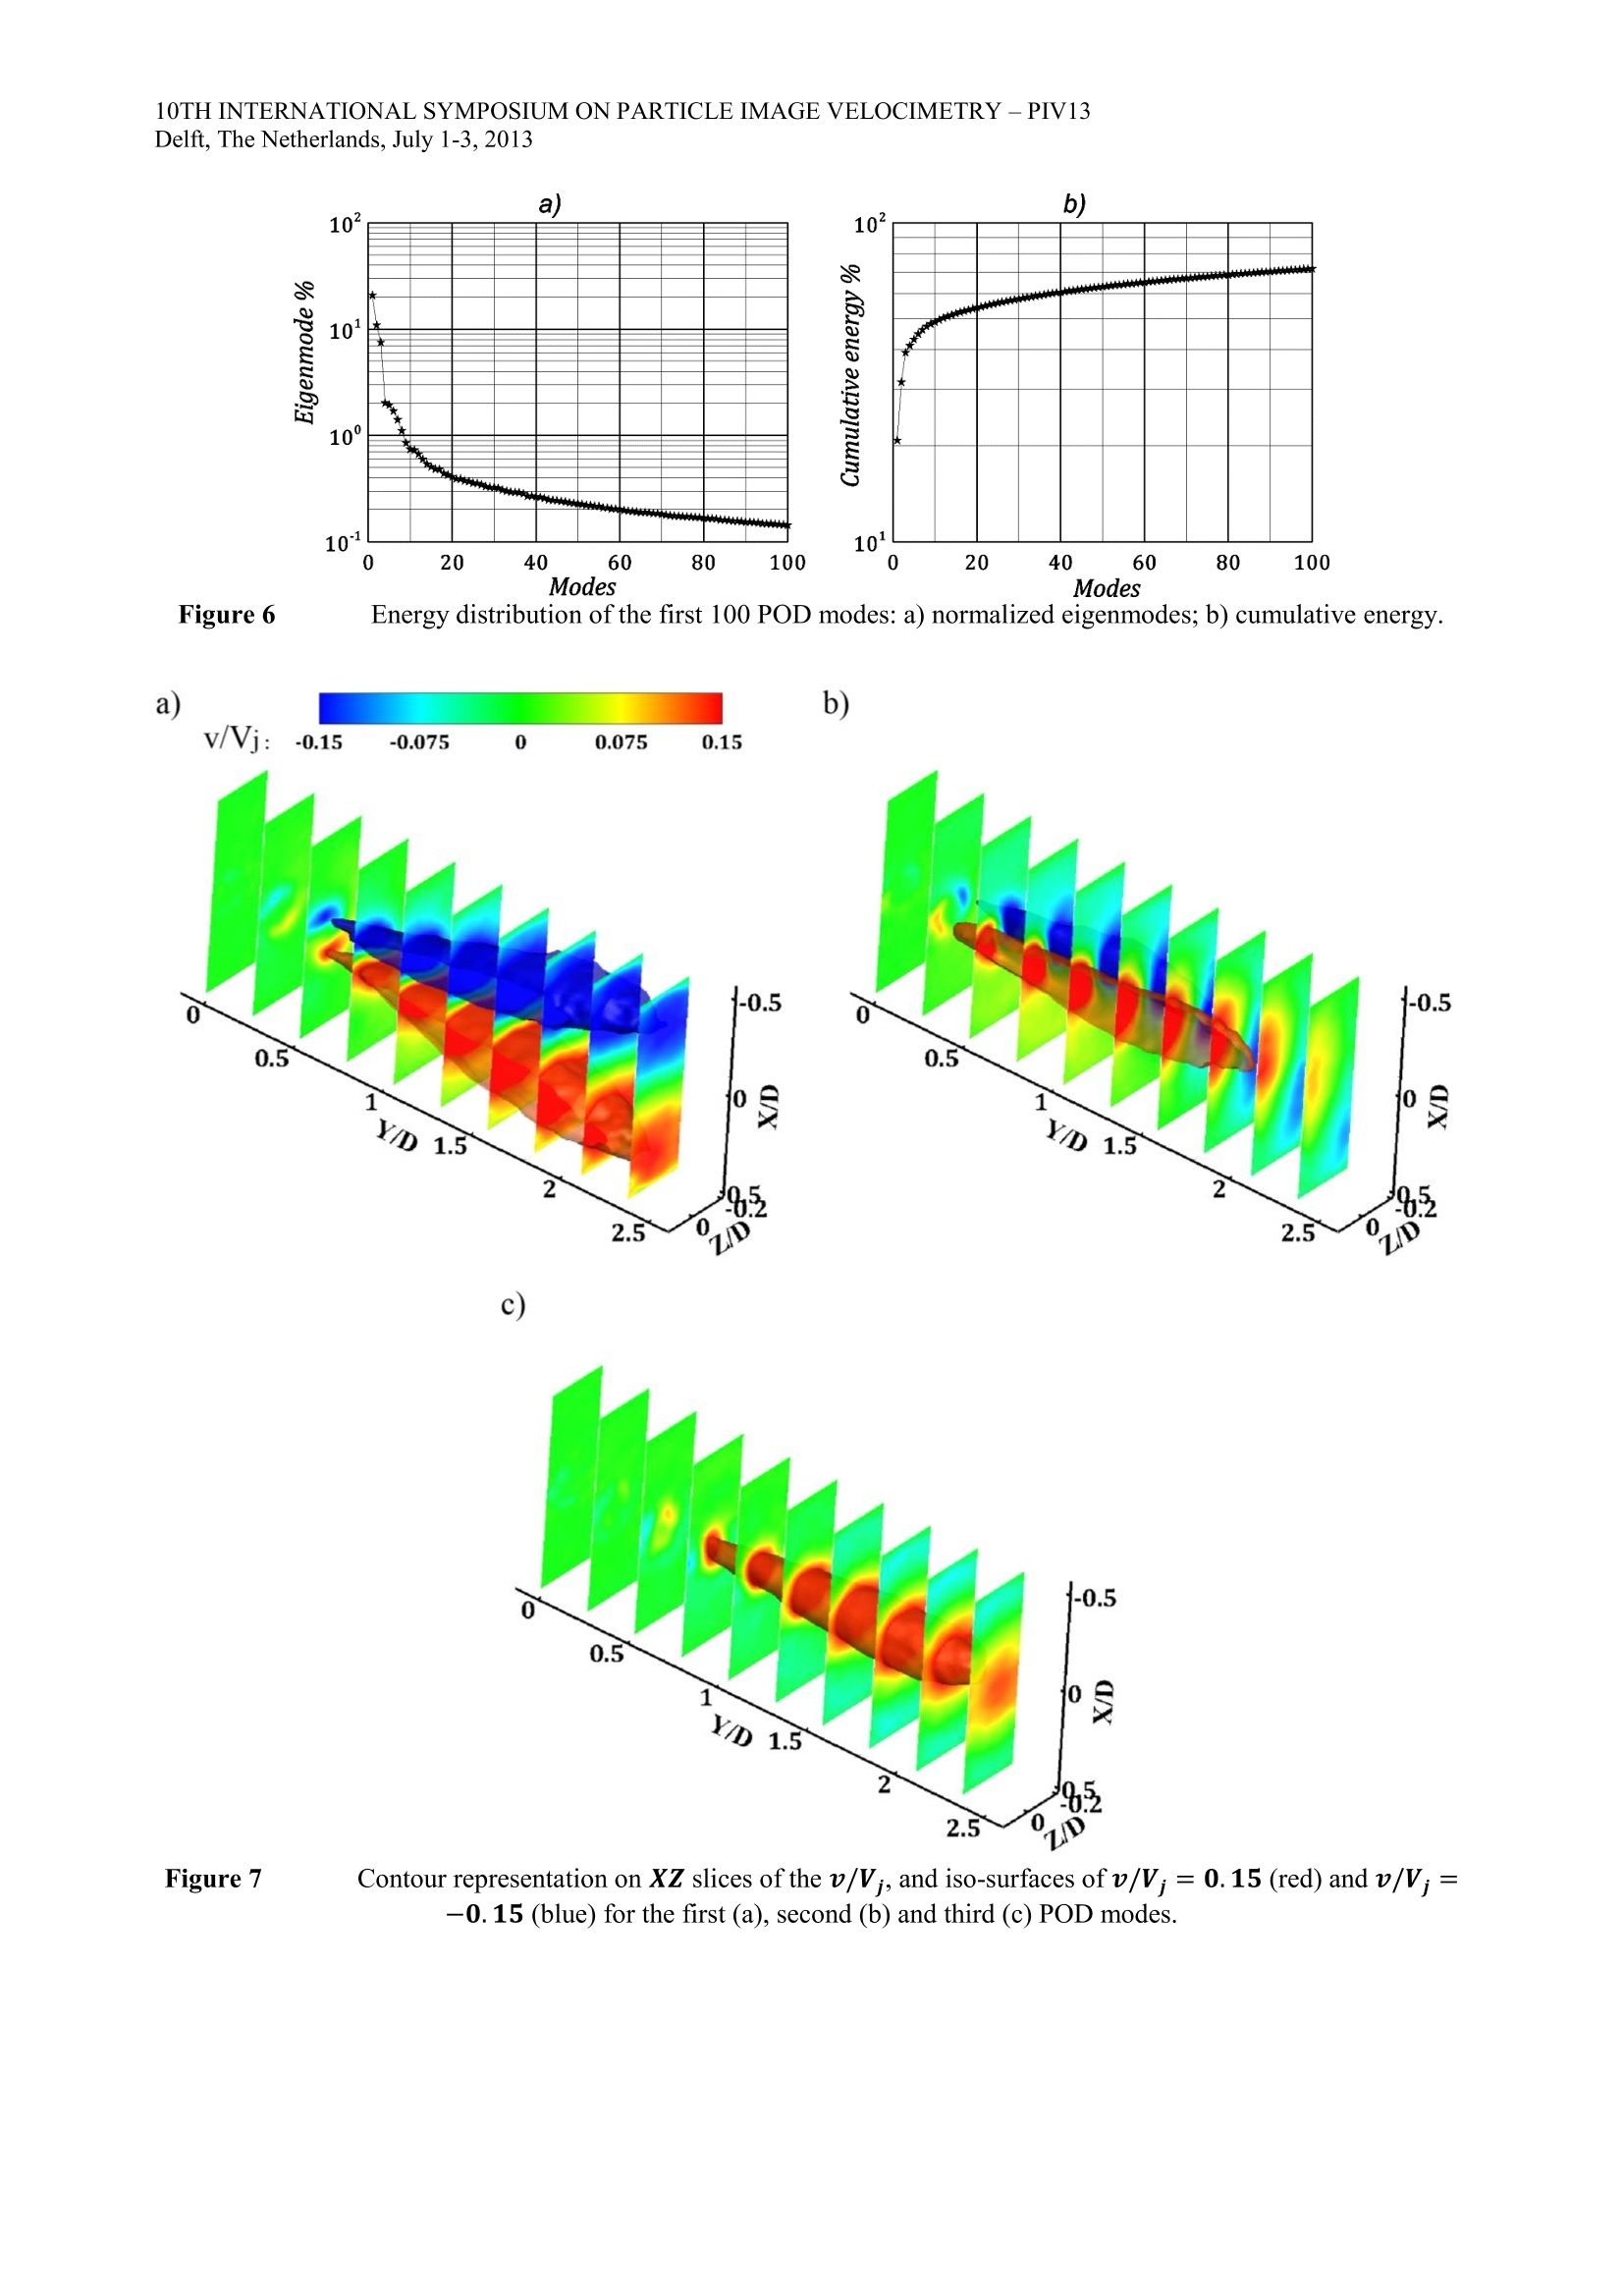
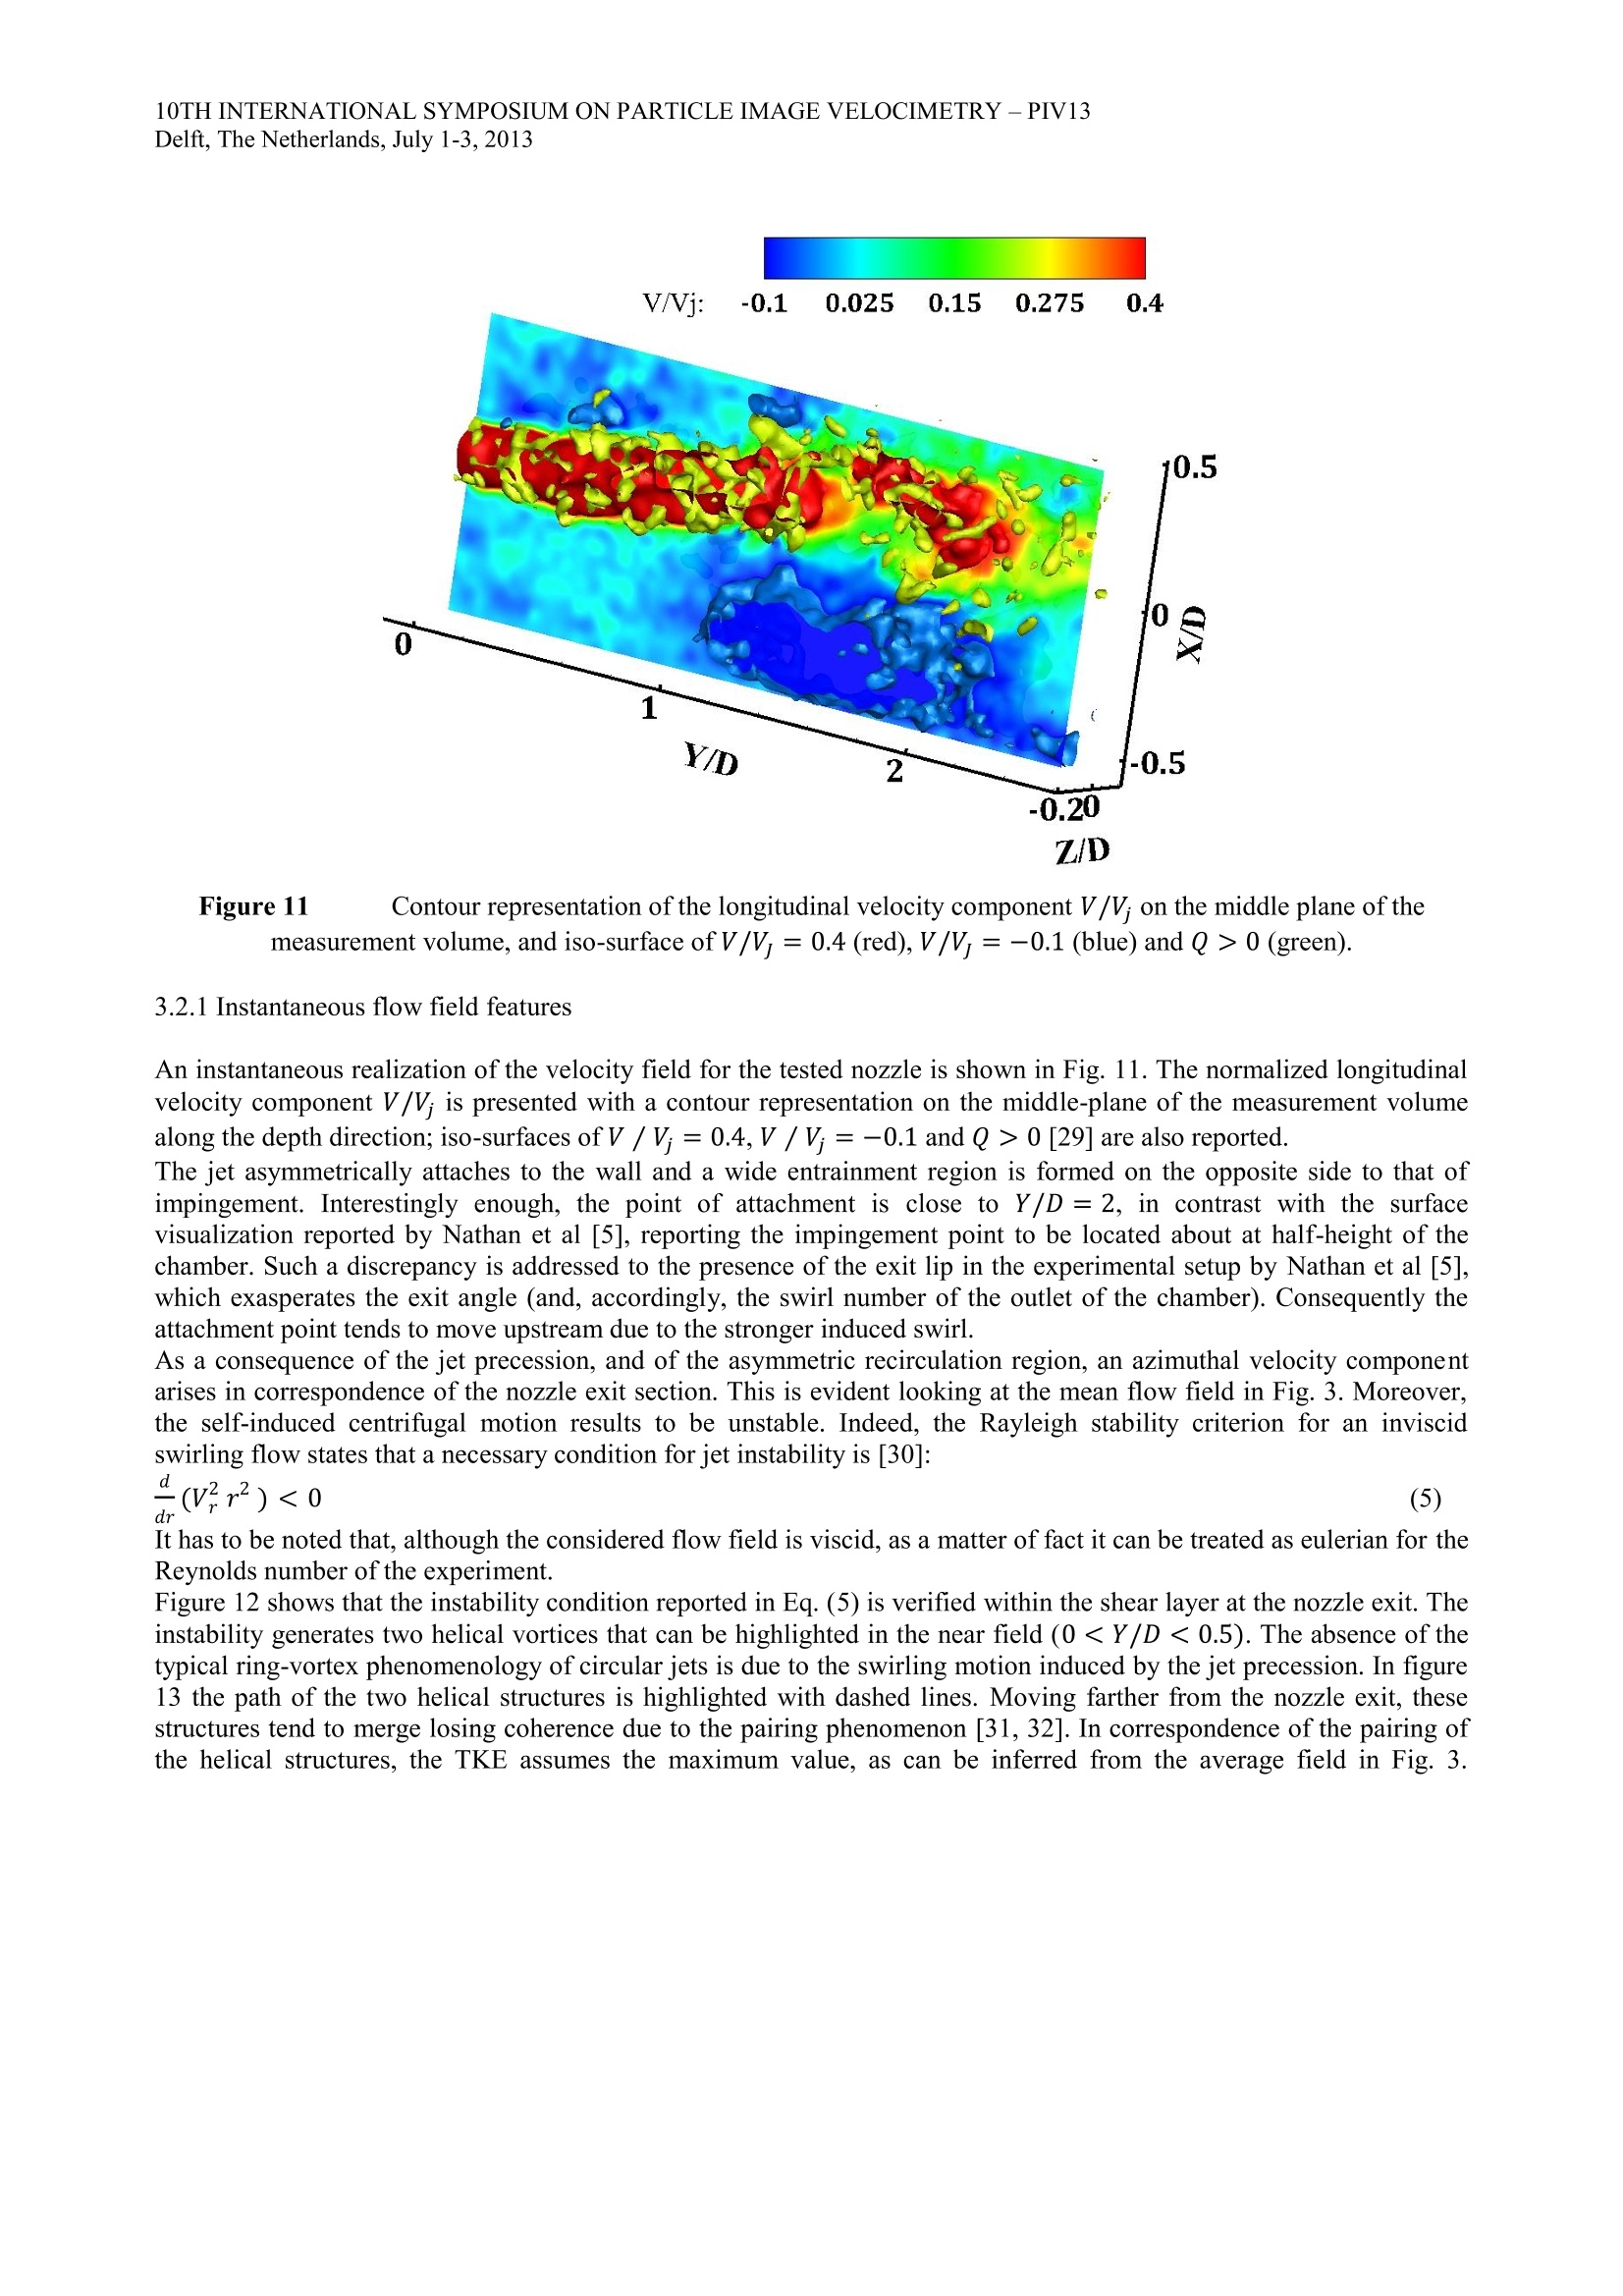
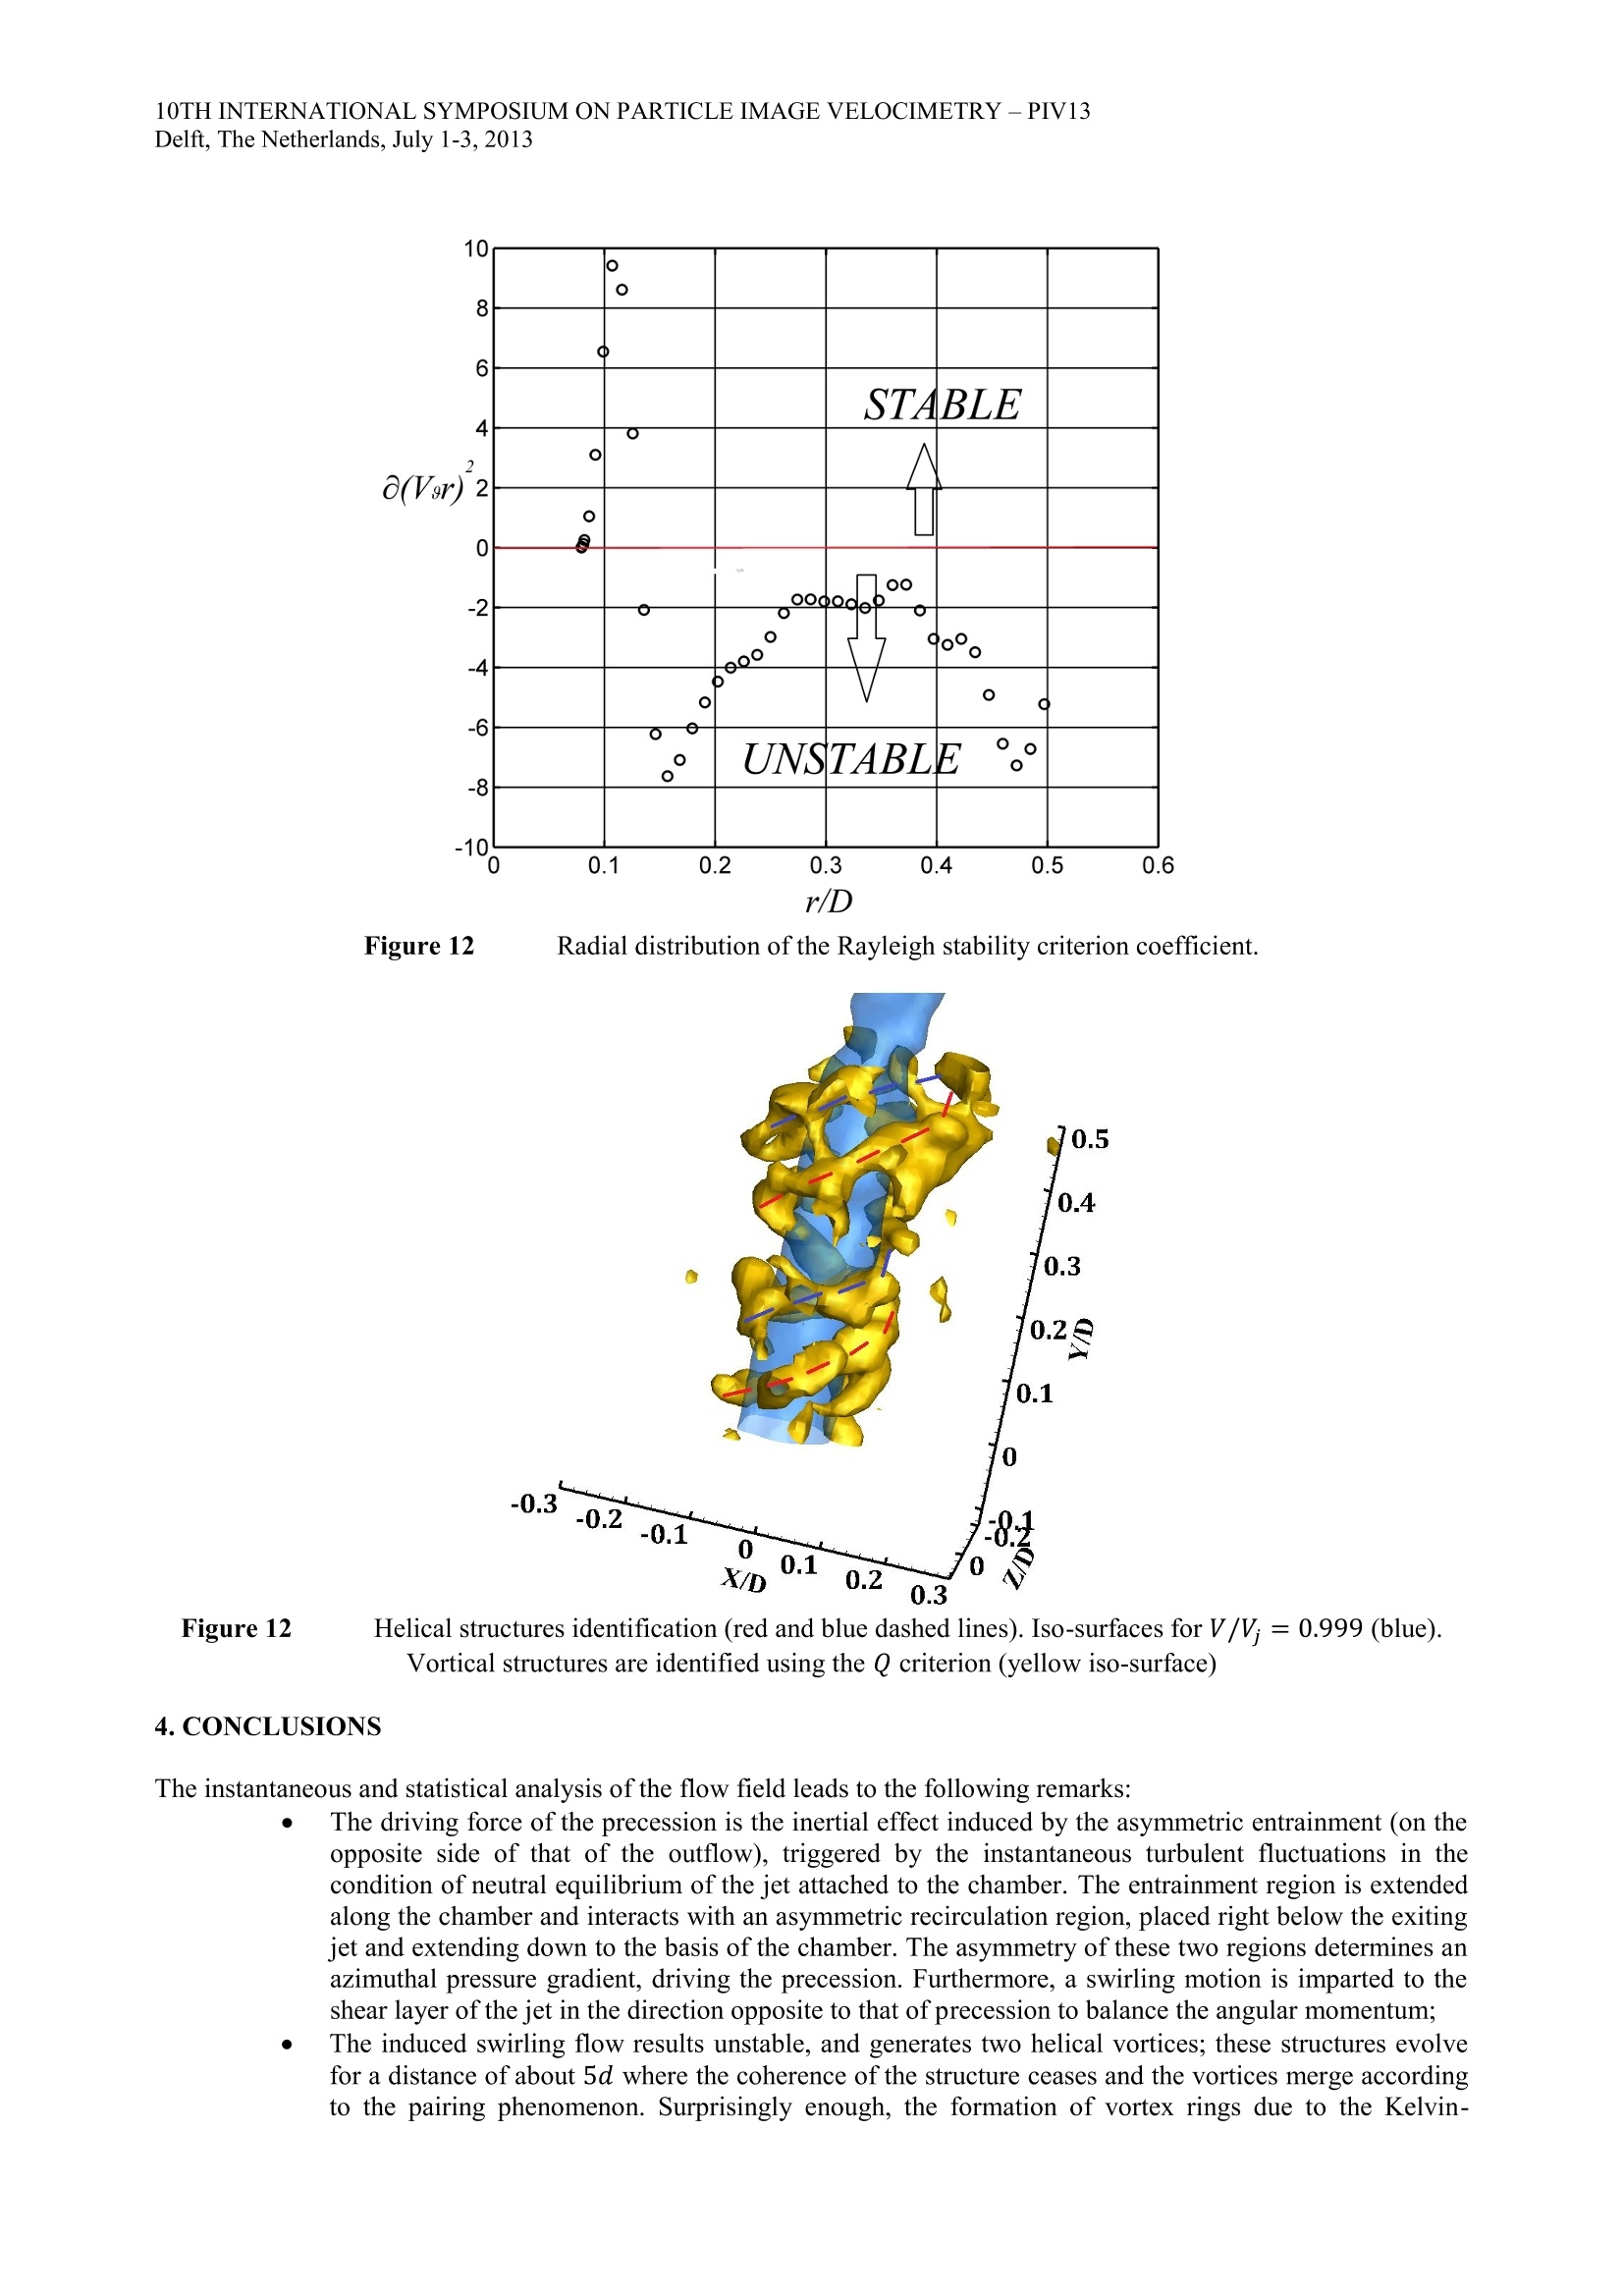
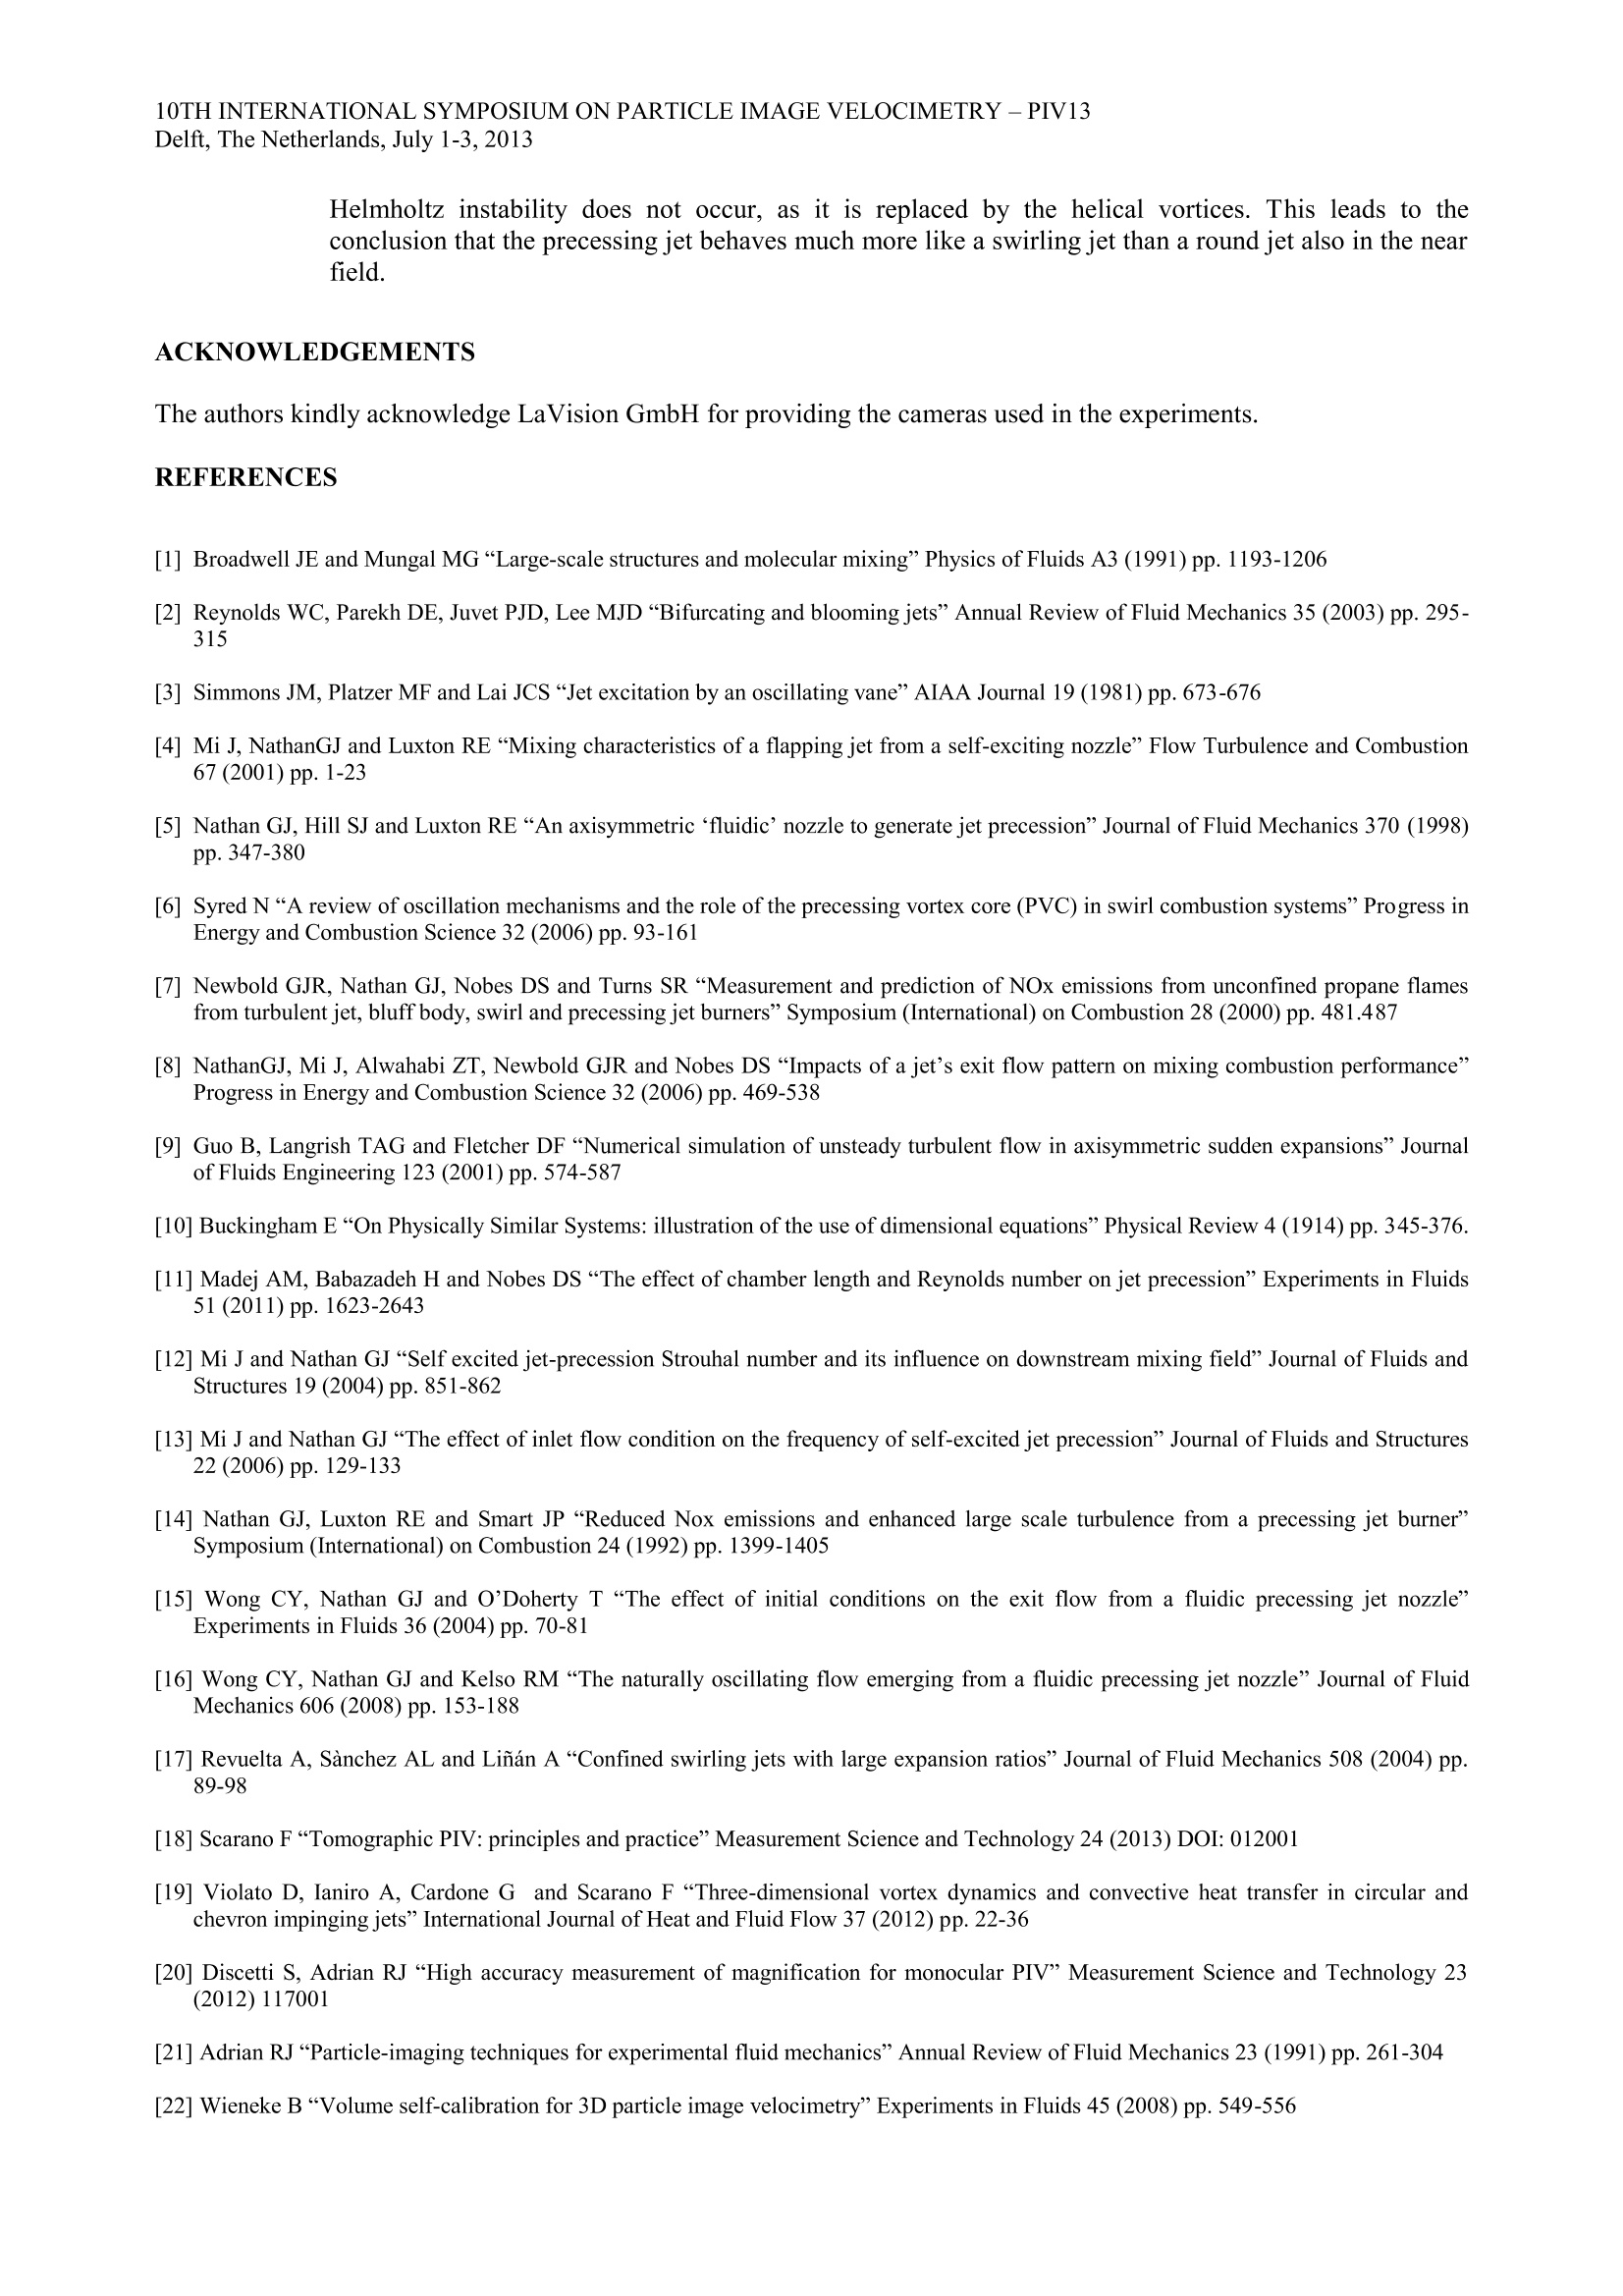
10TH INTERNATIONAL SYMPOSIUM ON PARTICLE IMAGE VELOCIMETRY-PIV13Delft, The Netherlands, July 1-3, 2013 The three-dimensional swirling flow past a sudden expansion Gioacchino Cafiero, Giuseppe Ceglia, Stefano Discetti, Andrea laniro, Tommaso Astarita andGennaro Cardone Dipartimento di Ingegneria Industriale-Sezione Aerospazio, Universita degli studi di Napoli Federico Il,Naples, Italy stefano.discetti@unina.it ABSTRACT The jet flow past an abrupt expansion under some conditions switches intermittently between two states: quasi-axisymmetric expansion and gyroscopic-like precessing motion. In this work an experimental analysis is carried out bymeans of Tomographic Particle Image Velocimetry (Tomo-PIV).The self-excited flow precession generated by a 5:1expansion of a round jet in a coaxial cylindrical chamber is investigated. The experiments are performed at a Reynoldsnumber equal to 150,000. Proper Orthogonal Decomposition (POD) is applied to extract information on theorganization of the larger structures of the precessing motion. This technique highlights the dominance of three modes:the first two are associated to the jet precession; the third one is representative of the axial motion. Furthermore, anapproach based on the modal energy for the evaluation of the precession probability is presented. The application of astability criterion shows that the self-induced swirl flow results to be unstable within the jet shear layer. The instabilityis responsible for the generation of helical-shaped vortices in the near field, instead of the expected phenomenology ofthe ring-vortices generation of circular jets. 1.INTRODUCTION Considerable attention has been devoted to the development of devices with the aim of exciting and enhancing the largescale coherent structures embedded into the shear layer of turbulent jets. The organization of these structures plays akey role in the transport of mass and momentum in flames [1]. These devices caniS' be bundled in three categories:acoustic excitation (see Reynolds et al [2] for a review), which can be obtained both by external excitation (for exampleusing speakers) or by self-excitation, enjoying the coupling between flow instabilities and acoustic resonance;mechanically oscillating devices [3], effective in cold environment but not well suited for combustion applications, inwhich the high temperature prevents the use of fast moving parts; fluidically excited devices, like flapping jets [4] orprecessing jets [5]. The precessing jet (PJ) device is generated with an axisymmetric jet flowing through a circular nozzle with diameter dand subject to an abrupt expansion in a cylindrical chamber (coaxial with the nozzle) with diameter D and length L. Thejet reattaches asymmetrically on the chamber wall after the abrupt expansion, and on the opposite side the fluid isentrained into the chamber from the ambient. Instantaneous asymmetries trigger a rotating pressure field, inducing aprecession of the jet, i.e. a rotation of the jet axis around the nozzle axis. The PJ has some analogies with swirl flows, inwhich, for relatively strong swirl, a precession around the jet axis has been widely documented (the so called precessingvortex core; see Syred [6] for a review). The description of the phenomenology of the precessing jet is extensively provided in [5]. The flow exhibits anintermittent behaviour, switching between a precessing and an axial mode. In the former the flow field is characterizedby a continuously unstable reattaching jet, with a strong recirculation region located on the opposite side of thechamber. A transverse pressure gradient in the outflow is established, thus determining a sharp deflection of the wall jetat the exit of the chamber. Since the flow is in a condition of neutral equilibrium, the effect of any asymmetry and/or theturbulence fluctuations induce the reattachment point to move; as the jet starts to rotate along one direction, theasymmetry of the flow entrained into the chamber induces the establishment of a rotating pressure field. Indeed, therecirculating fluid moves upstream within the chamber and swirls in the opposite direction to that of the precession, thusretaining the net angular momentum equal to zero. The PJ has shown extremely interesting features in terms of reduction of the global flame strain (thus leading to anincrease of the volume of soot). The larger amount of soot enhances the radiative heat transfer,reducing the flametemperature and the production of NOx [7, 8]. PJs have found application in industrial processes in which the radiantheat transfer plays a leading role over convection, such as rotary kilns for the production of cement and lime. Extensivestudies have addressed the main statistical features of PJs; however, the investigation of the instantaneous flow fieldtopology is extremely challenging and it is not yet fully characterized, since it is strongly unsteady and three-dimensional. Furthermore, PJs belong to the class of bifurcating flow instabilities arising in symmetrical configurationin absence of initial bias, which are usually difficult to be modelled and numerically simulated [9]. Although PJs have been used for several applications, there are many aspects of these devices that require a better understanding in order toimprove their performances. A clearer knowledge of the flow features development and their dependence on thecharacteristic parameters that lead the flow would further increase industrial interest in the device. The parameters that characterize the flow field organization are: fluid properties (density p, dynamic viscosity u), thejet velocity V, the jet precession frequency fo, the nozzle diameter d, the external chamber diameter D and the externalchamber length L. According to Buckingham-Pi Theroem [10] the following four non-dimensional groups can beaddressed as governing parameters: Sta,Rea,D/d,L/D, where: Sta =(fd)/V; (1) Rea=(pVd)/u (2) Several studies have concentrated their focus on identifying the best geometric and fluid dynamic conditions to favourjet precession. Nathan et al [5], together with many following works of the same research group [4, 7, 8], focused theirinterest on the geometry optimization. In most of the cited works the expansion ratio is fixed as D/d=5, which hasshown to be very favorable for the precession. The effects of the chamber aspect ratio L/D and of the Reynolds numberRea on the probability of precession have been widely addressed. Madej et al [11] have shown that the probability ofprecession is a weakly increasing function of Rea. Measuring the Strouhal number associated with the precession Sta and its dependence on the geometric and flowparameters is of fundamental importance as it determines the mixing outside the chamber. Mi and Nathan [12, 13]investigated the influence of the aspect ratio, the inlet geometry and the Reynolds number on Sta. They observed that itincreases almost linearly with both the aspect ratio and Rea. They also demonstrated that the effect of Sta is much moresignificant than that of Rea in determining the mixing of the fluids outside the chamber. In this study an insight into the phenomenology of the fluidic PJs using Tomographic Particle Image Velocimetry(Tomo-PIV) is provided. Very limited attention has been dedicated on the topology of the flow field within thechamber. Furthermore, so far the investigations have been performed with flow visualization [5], phase-averagedmeasurements with pointwise [15] or planar techniques [11, 16] or with numerical simulations [9, 17]. Tomo-PIV[18],in this sense, can provide a leap forward in understanding the organization of the flow topology in the complicatescenario of an unsteady, intermittent and strongly three-dimensional turbulent flow field; moreover, this technique iswell assessed for the study of jet flows [19]. Instantaneous and statistical features are described, providing an insight inthe vortices generation and development. A stability analysis of the self-induced swirling flow is also presented. ProperOrthogonal Decomposition is herein used to extract relevant information about the coherent structures of the flow field. 2.EXPERIMENT OUTLINE 2.1 EXPERIMENTAL APPARATUS The experiments are carried out in a water facility at the University of Naples Federico II. The jet is issued from acircular nozzle (with diameter d= 20mm and length l=6d) installed on the bottom of a nonagonal tank (internaldiameter 600mm, height 700mm). The jet expands into a cylindrical chamber, coaxial with the nozzle, with diameterD= 100mm and length L=275mm (so that D/d= 5 and L/D=2.75). Both the tank and the cylindrical chamberare made of Plexiglas in order to ensure a full optical access. While in many investigations [12, 13] an exit lip and/or acentre-body have been included into the chamber to favour the precessing motion on the axial one and to condition theexit angle, in this study these arrangements are not considered in order to assess the topology of the flow field withoutexternal forcing. A stabilized water flow rate of 2.3kg/s is provided upstream of the nozzle by a centrifugal pump and is laminarized bypassing through flow-conditioning grids and honeycombs installed in the plenum chamber. The diameter of the plenumchamber is 5d and its length is 20d, thus no significant effects of fluctuations or bias due to residual swirl are expectedin the flow at the outlet of the plenum chamber. In order to check that the effects of asymmetry and bias are negligible,the profiles of the velocity and the turbulent statistics at the exit of the nozzle have been analyzed with planar PIV forthe case of outflow without the external chamber. The method implemented by Discetti and Adrian [20] is used tosignificantly reduce the magnification measurement error. The results reported in Fig. 1 outline that the flow can bereasonably assumed symmetrical and unbiased (in the figure, V represents the axial velocity, v’=√(v.v) is the rootmean square of the axial velocity fluctuation v, with the angular brackets indicating the operation of ensembleaveraging, the quantities are plotted in non-dimensional form using the maximum velocity along the jet axis V). Thebulk mean velocity V of theVjd jet entering the chamber is about 7.5m/s, thus resulting in Rea==150,000 wherevVis the kinematic viscosity of water equal to about 10-6m²/s. For these experimental conditions, the precessing mode isexpected to be prevalent on the axial mode; indeed, Madej et al [11] indicated a probability of 65% of precessingmotion for Rea = 61,900,L/D= 2.75 and D/d=5; besides that, the probability increases with Rea (although only aweak dependence on Reynolds number is reported in the literature). Figure 1 Profiles of the inlet velocity V/V O and of the root mean square of the axial fluctuations v'/Vwithout the chamber. The flow is seeded with neutrally buoyant polyamide particles with average diameter of 56pm, dispersedhomogeneously within the facility with a concentration of approximately 0.15 particles/mm3. Laser pulses areproduced with a double-cavity Gemini PIV Nd:YAG laser system (532nm, 200mJ/pulse, 5ns pulse duration). Theexit beam of 5mm diameter is shaped into a parallelepiped volume. A knife-edged slit is placed along the laser path toobtain a y - z section of the illuminated volume of 250x34mm. Four LaVision Imager sCMOS 5.5 Megapixelscameras with identical lenses (100mm EX objectives) in Scheimplflug arrangement are setup on one side of the waterfacility covering an angle of 90°, as sketched in Fig. 2. The lenses operated with f#=16 and since the averagemagnification in the center of the measurement volume is about 0.06, a depth of field of more than 200mm, a digitalresolution of 10 voxels/mm and a particle diffraction limited minimum image diameter of 3.4pixels [21] areprovided. Sequences of the tracers particles with time separation of 130us are captured at a frequency equal to 10Hz. Thisfrequency is not sufficient for the sampling of the temporal evolution of the vortical features within the shear layer.Nonetheless, the acquisition frequency is certainly higher than the Nyquist one needed for an appropriate sampling ofthe precessing motion. In fact, the Nyquist frequency is expected to be about 1 Hz according to the typical values of theStrouhal number Sta reported in the literature of about 0.0015 [12, 13]. Figure 2 Sketch of the illumination and camera arrangement of the Tomographic PIV system. 2.2 TOMOGRAPHIC PIV: PROCEDURE AND DATA PROCESSING An optical calibration is performed by recording images of a two levels spatial calibration target (the separationbetween the levels is 3mm) mechanically translated along the depth direction of the measurement volume in the range±20mm. The calibration markers are white dots on a dark background, equally spaced along two orthogonal directions.A template-matching technique, with a cross-correlation based algorithm, is used to identify the location of the markers.The rms of the initial calibration error is about 0.8 pixels. The challenge in the application of this procedure resides in the impossibility to perform the calibration in-situ due tophysical restrictions, i.e. the calibration is performed without the presence of the chamber. For this reason the volumeself-calibration [22] is the keystone for a successful experiment, as it can correct the mapping functions to account formisalignment of the lines of sight due to refraction effects along the optical path (see, for example, the application in acombustion chamber by Baum et al [23]). The final rms of the calibration error is reduced down to 0.05 pixels. The acquisition and the pre-processing of the set of 500 images are performed using LaVision DaVis 8. A measurementvolume of 100x250x34mm³(i.e.1Dx2.5Dx0.34D) is reconstructed using a custom-made multi resolution algorithmwith MLOS initialization, 3 MART iterations on a binned 2x configuration and 2 final MART iterations on the finalresolution [24]. A further accuracy improvement is obtained by applying a SFIT technique [25] with anisotropicfiltering on a 3x3x1 kernel, with Gaussian distribution of weights and standard deviation equal to 1. The volume isdiscretized with 10vox /mm, thus resulting in a reconstruction volume of 1000x2500x340 voxels. The cross-correlation analysis is performed using an algorithm based on direct sparse cross-correlations and redundancyavoidance [26]. The final interrogation spot is 643 voxels (corresponding to 6.4 x 6.4 x 6.4mm³) with 75% overlap(thus resulting in a vector spacing of 1.6mm). The uncertainty on the velocity measurement can be assessed byapplying physical criteria, for example by computing the divergence of the velocity field. The uncertainty in thedivergence is both due to the measurement error on the velocity and the numerical truncation in the derivativecalculation; however, the 75% overlap reduces this second source of error, thus making it possible to quantify withreasonable approximation the uncertainty on the velocity measurement using the standard deviation of the divergence.Considering the typical value of the vorticity within the shear layer (0.2voxels/voxel) as a reference, for the rawvelocity field the standard deviation is 0.028voxels/voxel (0.14voxels/voxel in the non-dimensional version); theuncertainty is reduced to 0.023 if a low-pass Gaussian filter on a kernel 3 x 3 x 3 and standard deviation equal to 1 isapplied. 2.2 PROPER ORTHOGONAL DECOMPOSITION IMPLEMENTATION The Proper Orthogonal Decomposition (POD) is a powerful technique aimed to extract relevant information about thecoherent structures of the flow field. The mathematical procedure identifies an orthonormal basis using functionsestimated as solutions of the integral eigenvalue problem known as Fredholm equation (see Sirovich [27] for a morerigorous formulation). Consider for example a function U(x, t) that is approximated as: where x and t indicate the spatial and temporal coordinates, respectively. The functions n constitute thedecomposition basis of the fluctuating velocity field and f(t) are the time coefficients. The symbol Nm indicates thenumber of modes used to decompose the velocity field. The solution is not unique since it depends on the chosen basisfunctions On. The snapshots method proposed by Sirovich [27] assumes that the POD modes are calculated as theeigenmodes of the two-points temporal correlation matrix R: where Rij=(u(xit)u(xj,t)). Since R is a non-negative Hermitian matrix, it has a complete set of non-negativeeigenvalues, whose magnitude indicates the energy contribution of the respective eigenmodes. 3. RESULTS AND DISCUSSION Here and in the following, unless otherwise stated, the letters U,V,W indicate the velocity components along the width,the height and the depth of the measurement volume (respectively X,Y,Z). The corresponding lower case letters u, v, wrefer to the turbulent velocity fluctuations obtained by subtracting the mean velocity components from the instantaneousrealizations. In the case of a cylindrical reference frame V.V,V indicate the components along the radial, azimuthaland axial directions respectively. Finally, the symbols u',v’, w’are used to refer to the root mean square (rms) of the turbulent velocity fluctuations. Generally the results are presented in non-dimensional form, using the bulk jet velocityV; and the chamber diameter D as a reference. 3.1 MEANFLOW FEATURES The mean flow field obtained by averaging a set of 500 images is illustrated in Fig. 3. The iso-surfaces of V/V二0.999, of the swirl component of the velocity vector (namely V/V=0.2) and the Turbulent Kinetic Energy (TKE)contour plot are represented. Even if the flow is intermittently switching between the precessing and the axial mode, anet non-zero swirl component is detected in proximity of the nozzle. This indicates that when the precession is triggeredthe direction of rotation is most likely to persist even after switching for limited periods of time to the axial mode. Infact, the swirl component arises in the shear layer in order to balance the overall angular momentum (i.e. in the oppositedirection to that of the precession, in agreement with Dellenback et al [28]). This persistence of the sense of precession(and of the swirl in the near field) is related to the driving force of the precessing motion, i.e. the asymmetry of theentrainment. As the precession is triggered at the beginning of the experiment, the entrained fluid "remembers" itsasymmetry also when switching to the axial mode due to the dominance of inertia effects. The figures 4-5 represent the radial profiles of the mean velocity components and the rms of the turbulent fluctuationsfor three different streamwise locations (Y/D=0,0.25,0.5). The profiles of (W)/V highlights the presence of asignificant swirl induced within the lower region of the chamber as already outlined describing the average field (fig. 3).This effect is much stronger than the rate of entrainment of the jet in the near field, as testified by comparison with theprofile of (U)/V, which is characterized by much weaker peaks. This difference is smeared out by diffusion whenmoving downstream. At the nozzle exit, a significant intensity of the azimuthal fluctuations (w’/V) is observed, comparable to that of theaxial fluctuations within the shear layer. By moving downstream the axial fluctuation within the shear layer becomesdominant on the other two components.The gap between azimuthal and radial (u'/V) fluctuations decreases along theY direction; it will be shown in Sec. 3.3 that this effect can be addressed to the pairing of helical vortical structuresformed within the shear layer due to instability. Figure3 Contour representation of the Turbulent Kinetic Energy on the middle plane of the measurementvolume, of the azimuthal velocity on the nozzle exit section, iso-surfaces ofV/V=0.999 (red) and ofV/V=0.2 (light brown) a) X/D Figure 4 Radial profiles of the mean velocitycomponents forY/D=0,0.25,0.5 (top to bottom). ★(U)/V口(V)/VA(W)/V . Symbols are placed each2 measured vectors. The snapshots method (see section 2.3) provides in principle a number of modes equal to the number of snapshots (inthis test case, 500 realizations). For clarity, in Fig. 6a the plot is limited only to the first 100 modes, containing about70% of the energy. The eigenvalues are normalized with respect to their sum, representing the total turbulent energy ofthe fluctuations. Furthermore, the cumulative sum of the energy is reported in Fig. 6b, in order to assess the number ofmodes that significantly contribute to build up the decomposition of the velocity field. The first three modes are reported in Fig.7, in which the contour representation of the v component normalized with thebulk velocity and the iso-surfaces of v /V=±0.15 are reported. The first and second modes are associated with thelarge scale precession, as they present an asymmetric outflow associated with an inflow on the opposite side of thechamber. The difference in the energy pertaining to the first and to the second mode (20.8% and 10.9% respectively,see fig. 6a) is probably related to the geometry of the measurement volume, since it contains the entire inflow andoutflow regions for the case of the first mode, while in the second mode the same two highly energetic regions arepartly located outside of the observed volume in the far field. The third mode (with 7.5% of energy) is quasi-axisymmetric, as it presents a strong on-axis outflow, associated to the axial mode. As a matter of fact, the ratio of theenergy associated to the first two modes and the total energy of the first three modes can be interpreted as an “effectiveenergy-probability”of precessing motion (about 81%). This result is practically in agreement with the measurements ofMadej et al (2011); they estimated a probability of the precessing motion of about 61% for Rea =61900 and L/D =2.75; since the probability of precession increases as Rea increases, the measured probability value can be consideredacceptable. Figure 6 Energy distribution of the first 100 POD modes:a) normalized eigenmodes; b) cumulative energy. Figure 7 Contour representation on XZ slices of the v/V, and iso-surfaces ofv/V;=0.15 (red) and v/V;=-0.15 (blue) for the first (a), second (b) and third (c) POD modes. Figure11 Contour representation of the longitudinal velocity component V/V; on the middle plane of themeasurement volume, and iso-surface ofV/V=0.4(red),V/V=-0.1 (blue) and Q>0 (green). 3.2.1 Instantaneous flow field features An instantaneous realization of the velocity field for the tested nozzle is shown in Fig. 11. The normalized longitudinalvelocity component V/V is presented with a contour representation on the middle-plane of the measurement volumealong the depth direction; iso-surfaces ofV/V=0.4,V/V=-0.1 and Q >0 [29] are also reported. The jet asymmetrically attaches to the wall and a wide entrainment region is formed on the opposite side to that ofimpingement. Interestingly enough, the point of attachment is close to Y/D=2, in contrast with the surfacevisualization reported by Nathan et al [5], reporting the impingement point to be located about at half-height of thechamber. Such a discrepancy is addressed to the presence of the exit lip in the experimental setup by Nathan et al [5],which exasperates the exit angle (and, accordingly, the swirl number of the outlet of the chamber). Consequently theattachment point tends to move upstream due to the stronger induced swirl. As a consequence of the jet precession, and of the asymmetric recirculation region, an azimuthal velocity componentarises in correspondence of the nozzle exit section. This is evident looking at the mean flow field in Fig. 3. Moreover,the self-induced centrifugal motion results to be unstable. Indeed, the Rayleigh stability criterion for an inviscidswirling flow states that a necessary condition for jet instability is [30]: -(V?r²)<0dr (5) It has to be noted that, although the considered flow field is viscid, as a matter of fact it can be treated as eulerian for theReynolds number of the experiment. Figure 12 shows that the instability condition reported in Eq. (5) is verified within the shear layer at the nozzle exit. Theinstability generates two helical vortices that can be highlighted in the near field (0
确定

还剩9页未读,是否继续阅读?

产品配置单


北京欧兰科技发展有限公司为您提供《水流体,突扩管中3D3C层析速度矢量场检测方案(粒子图像测速)》,该方案主要用于其他中3D3C层析速度矢量场检测,参考标准--,《水流体,突扩管中3D3C层析速度矢量场检测方案(粒子图像测速)》用到的仪器有体视层析粒子成像测速系统(Tomo-PIV)、LaVision DaVis 智能成像软件平台
推荐专场


相关方案
更多
该厂商其他方案
更多