


方案详情
文
The quantification of a panel of antiepileptic drugs in
human plasma has been implemented and analytically
validated on a TSQ Quantum Access MAX mass
spectrometer using the MassTox TDM Series A kit for
antiepileptics from Chromsystems. The TSQ Quantum
Access MAX mass spectrometer proved to have the
proper sensitivity, accuracy, and precision for the
application of this analytical method to clinical research.
方案详情

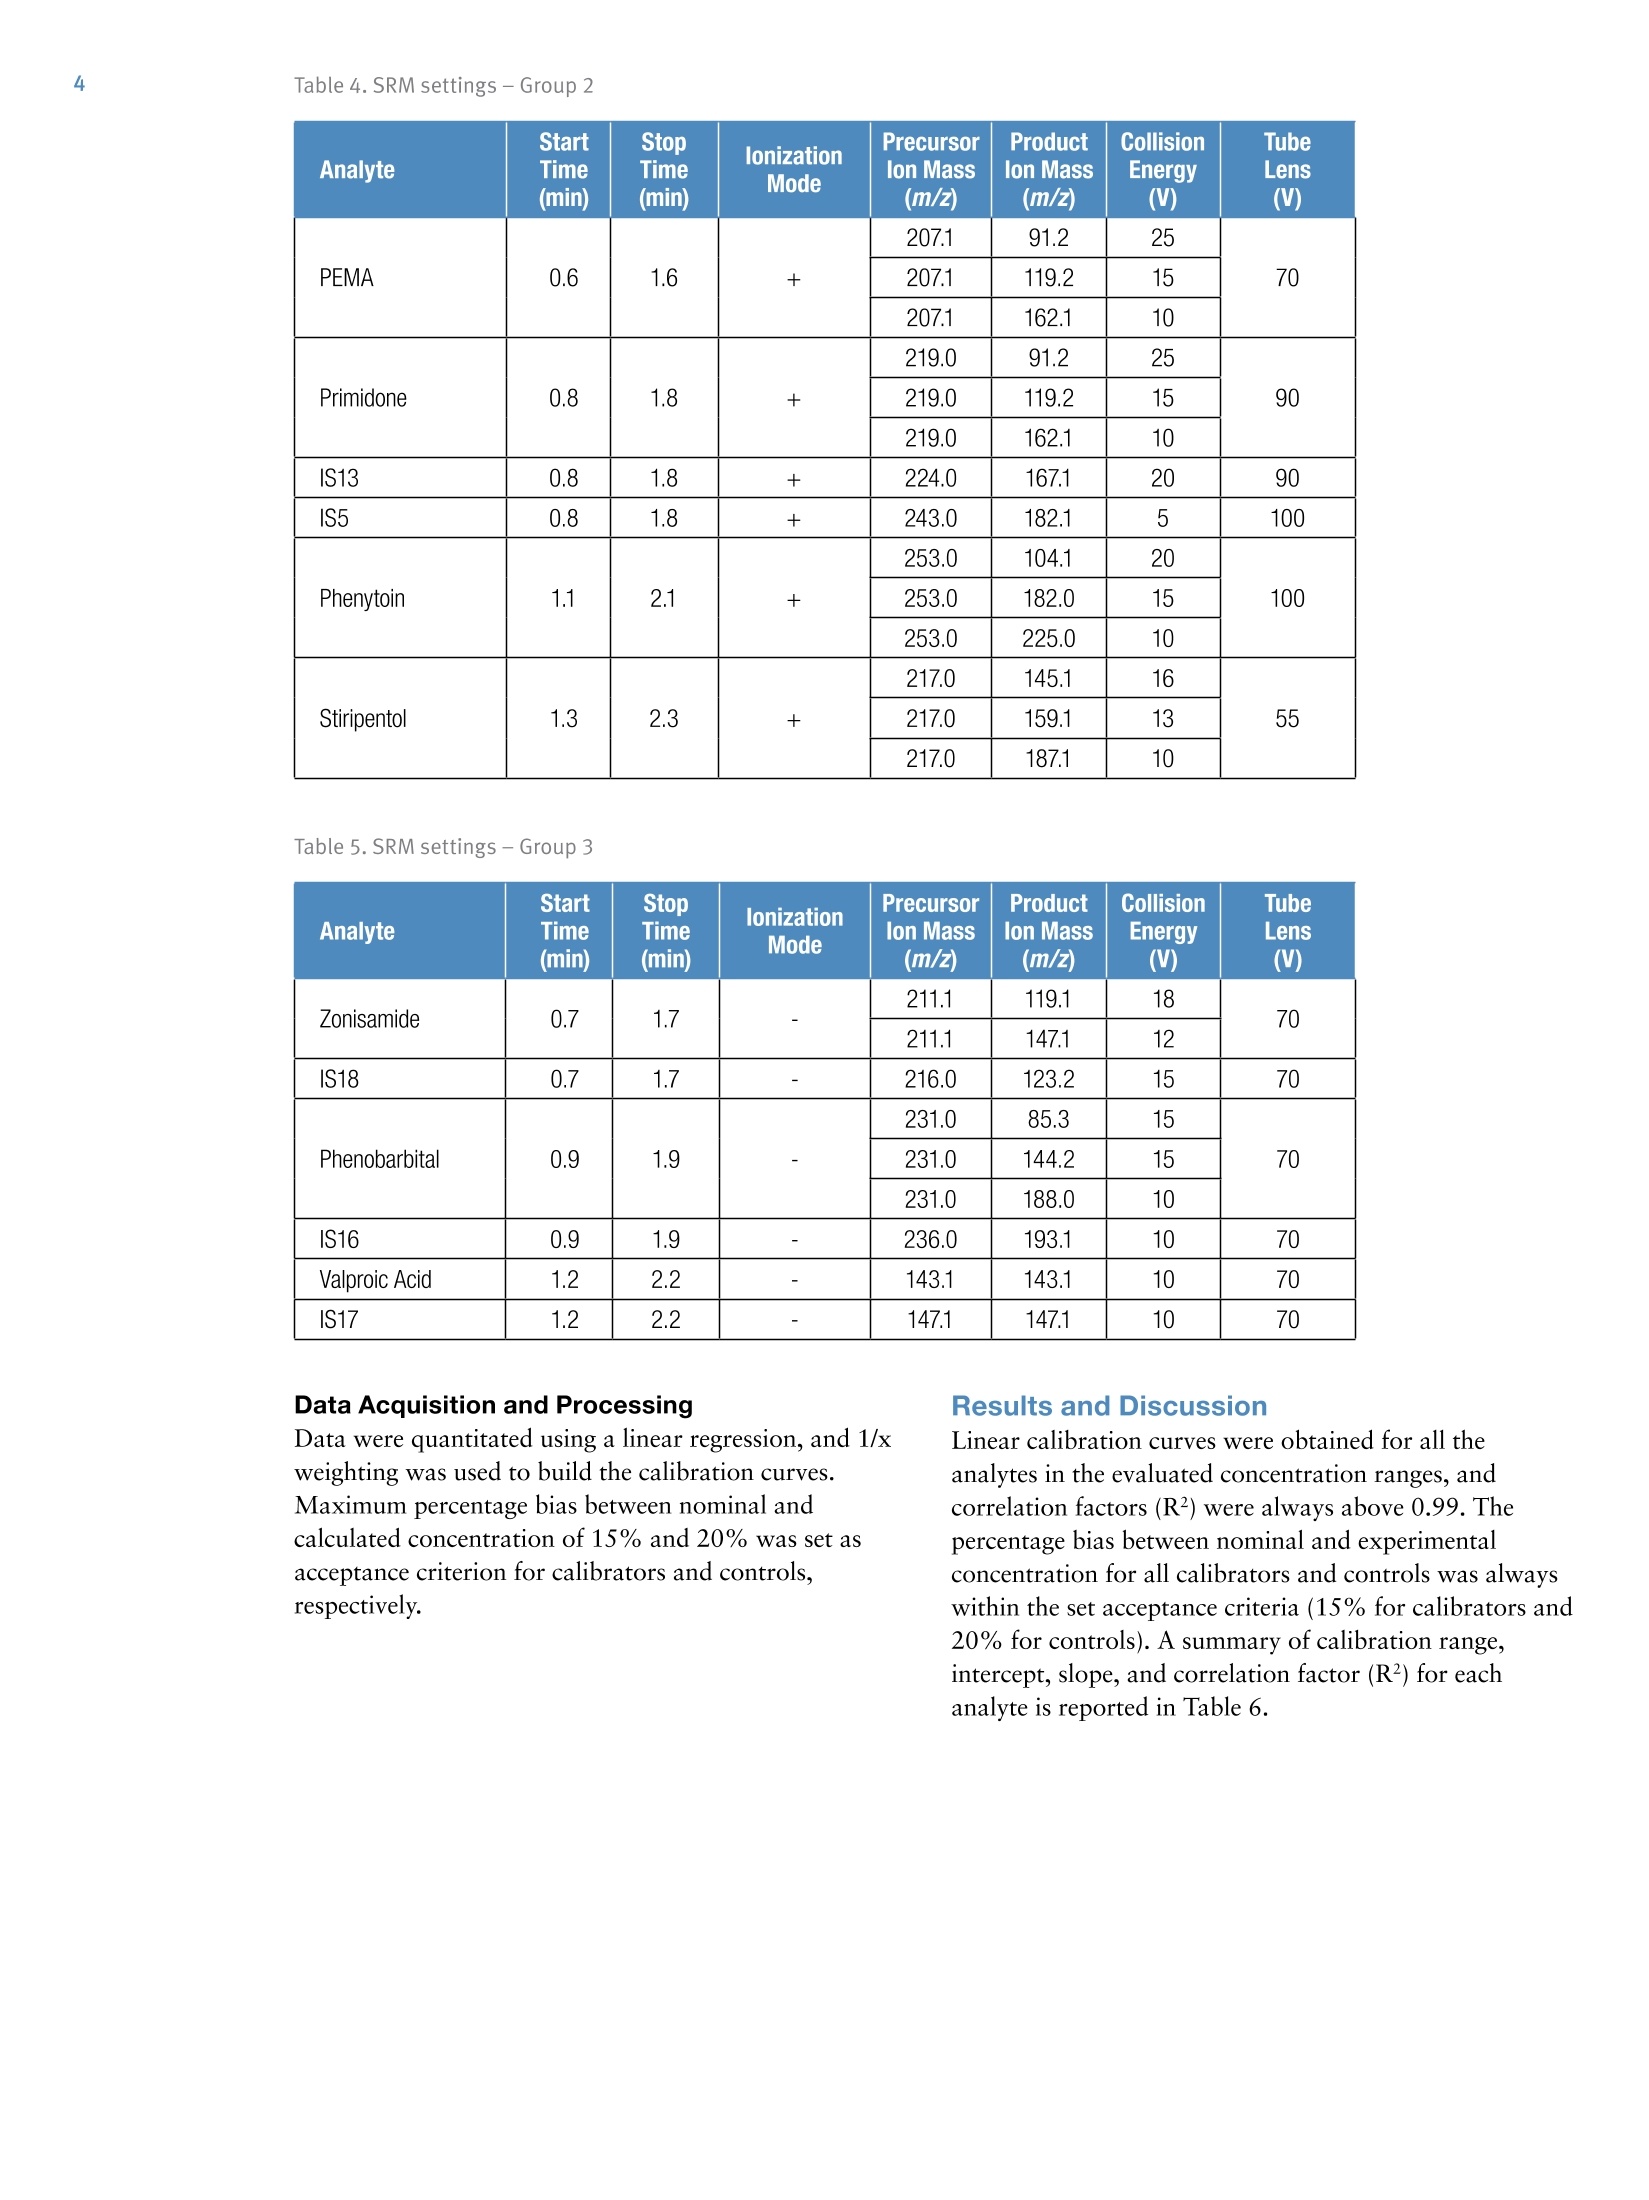
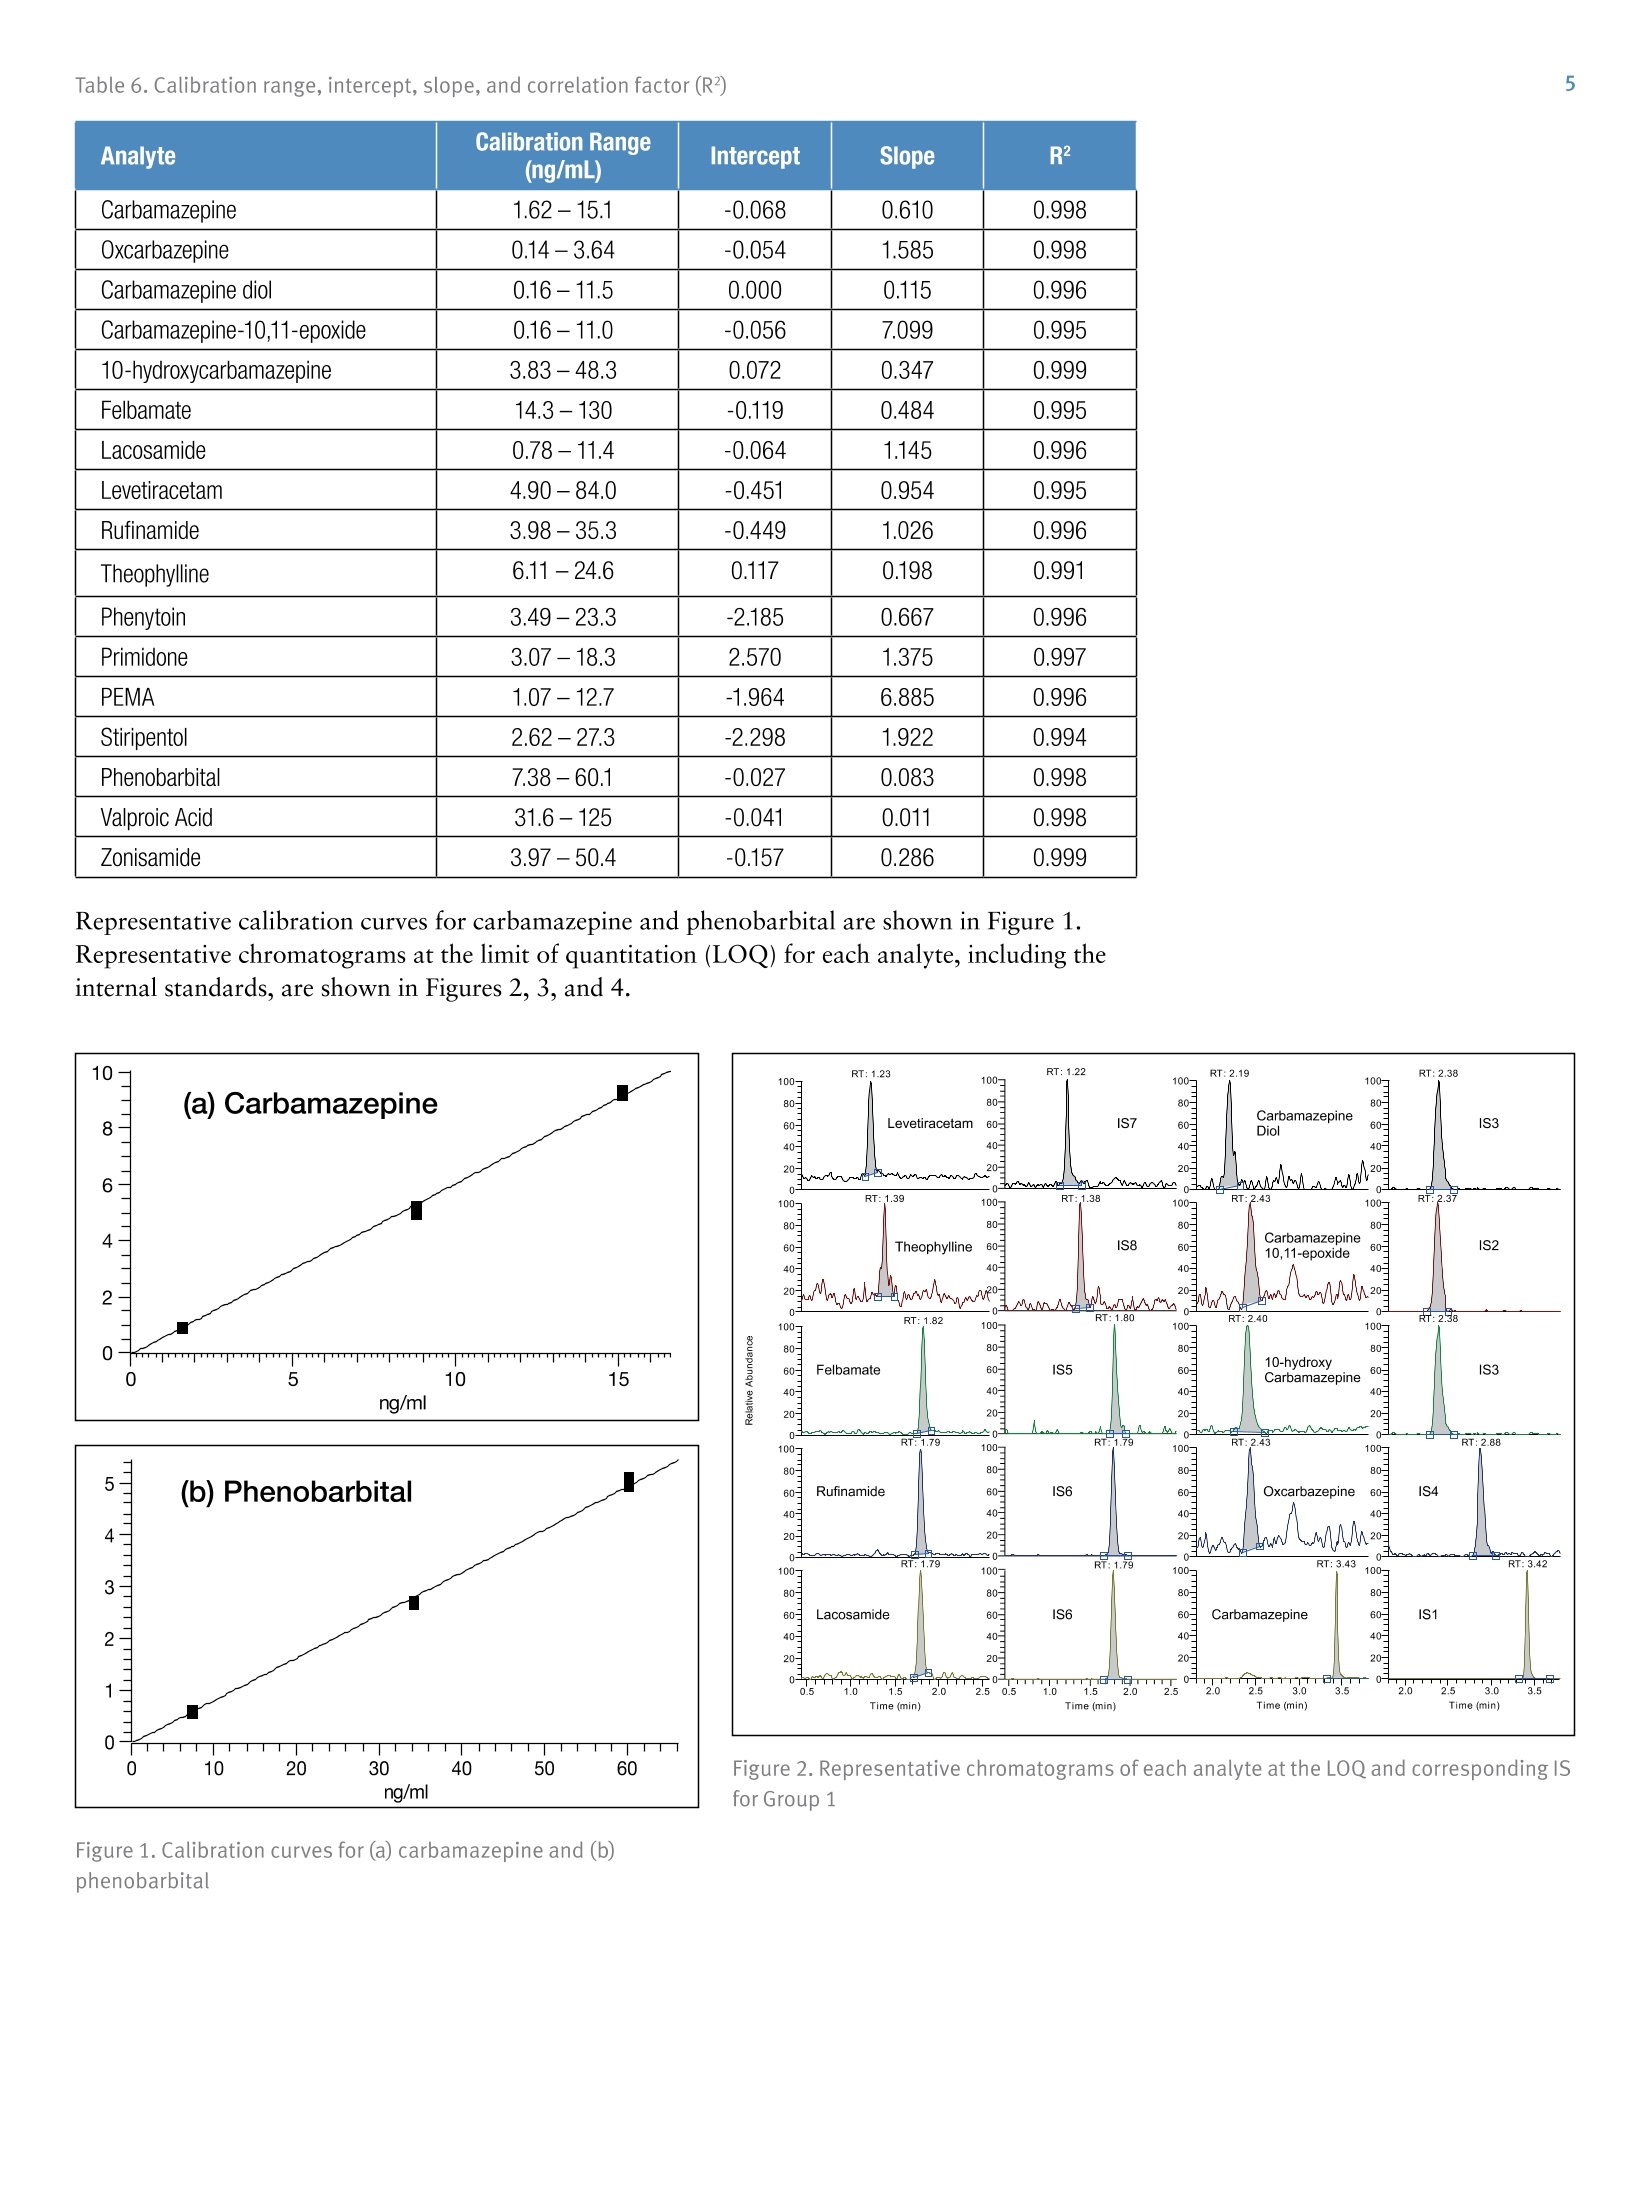
Table 1. Concentrations (ng/mL) of calibrators and controls2 Table 3. SRM settings - Group 1 Quantification of 17 Antiepileptics andTheir Metabolites in Human Plasma bvLC-MS/MS for Research . Claudio De Nardi, Thermo Fisher Scientific, Dreieich, GermanyAnna Morando, Anna Del Plato, Ospedale"La Colletta", Arenzano, Italy Implement an LC-MS/MS method for the quantification of 17 antiepilepticsand their metabolites in human plasma. Introduction Liquid chromatography coupled to tandem massspectrometry (LC-MS/MS) is a valuable tool that can helpclinical researchers to monitor that antiepileptic drugsremain within the desired range. Here, an LC-MS/MSmethod on the Thermo Scientific""TSQ Quantum AccessMAX"triple quadrupole mass spectrometer was usedwith the MassTox TDM Series A kit for antiepilepticsfrom Chromsystemsto quantify a panel of 17antiepileptics and their metabolites in human plasma.The MassTox TDM Series A kit includes levetiracetam,theophylline, felbamate, lacosamide, rufinamide,carbamazepine,oxcarbazepine, carbamazepine diol,carbamazepine-10,11-epoxide,10-hydroxycarbamazepine, phenylethylmalonamide(PEMA), primidone, phenytoin, stiripentol, zonisamide, phenobarbital, valproic acid,and 12 internal standards ExperimentalSample Preparation The MassTox TDM Series A kit for antiepileptics wasused. The 17 evaluated analytes were divided into threegroups. Each group required a different extractionprocedure and analytical method. The kit included driedcalibrators at three different concentration levels anddried controls at two different levels. Concentrations ofcalibrators and controls are reported in Table 1. The kit also included an extraction buffer, a precipitatingagent containing all the internal standards (IS), and twodifferent dilution buffers (dilution buffer 1 and dilutionbuffer 2). Dry calibrators and controls were resuspended using 1 mLof distilled water and let rest for 15 minutes at roomtemperature. Blanks, calibrators, controls, and sampleswere protein precipitated as follows: · 100 pL of blank, calibrator, control, or sample ·50 pL of extraction buffer · 500 pL of precipitating agent containing the internalstandards Calibrators and controls were extracted in duplicate.Precipitated samples were vortex-mixed and centrifugedfor 10 minutes at 4°℃ at 3200g. Supernatant was dilutedusing different dilution schemes depending on the groupprior to injection onto the LC-MS/MS system: · Group 1: dilution 1:10 (20 pL+180 pL) with dilutionbuffer 1 / dilution buffer 2, 50:50 (v/v) · Group 2: dilution 1:5 (100 pL+400 pL) with dilutionbuffer 1 · Group 3: no dilution Group Analyte CAL1 CAL 2 CAL 3 CTRL1 CTRL2 1 Carbamazepine 1.62 8.77 15.1 3.25 10.6 Oxcarbazepine 0.14 1.89 3.64 0.46 2.75 Carbamazepine diol 0.16 5.77 11.5 1.11 8.21 Carbamazepine-10,11-epoxide 0.16 5.61 11.0 1.07 8.1 10-hydroxycarbamazepine 3.83 26.6 48.3 8.48 36.1 Felbamate 14.3 70.8 130 27.2 92.9 Lacosamide 0.78 6.13 11.4 1.91 8.5 Levetiracetam 4.90 28.5 84.0 16.0 62.8 Rufinamide 3.98 21.0 35.3 7.54 28.0 Theophylline 6.11 15.9 24.6 9.78 18.9 2 Phenytoin 3.49 13.3 23.3 5.86 16.9 Primidone 3.07 10.7 18.3 5.11 13.6 Phenylethylmalonamide (PEMA) 1.07 6.68 12.7 2.21 9.03 Stiripentol 2.62 14.3 27.3 5.01 20.3 3 Phenobarbital 7.38 34.2 60.1 13.8 44.7 Valproic Acid 31.6 79.1 125 47.2 97.7 Zonisamide 3.97 27.4 50.4 9.04 36.8 Liquid Chromatography Liquid chromatography analysis was performed using aThermo ScientificTranscend TLX-1 system. The LCconditions were as follows: LC column Provided with the kit Mobile phase A Provided with the kit Mobile phase B Provided with the kit Injection volume Group 1-20 pL Group 2-100 pL Group3-30 pL LC gradient See Table 2 Table 2. LC gradient Group Time(min) Flow Rate(mL/min) A (%) B (%) 1 0.0 0.8 100 0 0.1 0.8 100 0 0.5 0.8 60 40 2.5 0.8 60 40 3.0 1.0 0 100 4.0 1.0 0 100 4.1 0.8 100 0 2 0.0 1.0 100 0 0.1 1.0 100 0 1.0 1.0 0 100 3.0 1.0 0 100 3.1 1.0 100 0 3 0.0 1.0 100 0 0.1 1.0 100 0 1.0 1.0 0 100 3.0 1.0 0 100 3.1 1.0 100 Mass Spectrometry The LC system was connected to a TSQ Quantum AccessMAX triple quadrupole mass spectrometer. Acquisitiontime ranges were used for each analyte and the followingMS conditions were used: Source type Heated electrospray ionization (HESI) Vaporizer temp 350°C Capillary temp 350°C Spray voltage 3500V Sheath gas 70 AU Sweep gas 0 AU Auxiliary gas 40 AU Data acquisition mode Selected-reaction monitoring (SRM) Chrom filter peak width 5.0s Collision gas pressure 1.5 mTorr Cycle time 0.300s Q1 mass resolution (FWMH) 0.7 Q3 mass resolution (FWMH) 0.7 See Tables 3, 4 and 5 Analyte StartTime(min) StopTime(min) lonizationMode Precursorlon Mass(m/z) Productlon Mass(m/z) CollisionEnergy(V) TubeLens(V) PEMA 0.6 1.6 + 207.1 91.2 25 70 207.1 119.2 15 207.1 162.1 10 Primidone 0.8 1.8 + 219.0 91.2 25 90 219.0 119.2 15 219.0 162.1 10 IS13 0.8 1.8 + 224.0 167.1 20 90 IS5 0.8 1.8 + 243.0 182.1 5 100 Phenytoin 1.1 2.1 + 253.0 104.1 20 100 253.0 182.0 15 253.0 225.0 10 Stiripentol 1.3 2.3 + 217.0 145.1 16 55 217.0 159.1 13 217.0 187.1 10 Table 5. SRM settings - Group 3 Analyte StartTime(min) StopTime(min) lonizationMode Precursorlon Mass(m/z) Productlon Mass(m/z) CollisionEnergy (V) TubeLens(V) Zonisamide 0.7 1.7 211.1 119.1 18 70 211.1 147.1 12 IS18 0.7 1.7 216.0 123.2 15 70 Phenobarbital 0.9 1.9 231.0 85.3 15 70 231.0 144.2 15 231.0 188.0 10 IS16 0.9 1.9 - 236.0 193.1 10 70 Valproic Acid 1.2 2.2 143.1 143.1 10 70 IS17 1.2 2.2 147.1 147.1 10 70 Data Acquisition and Processing Results and Discussion Data were quantitated using a linear regression, and 1/xweighting was used to build the calibration curves.Maximum percentage bias between nominal andcalculated concentration of 15% and 20% was set asacceptance criterion for calibrators and controls,respectively. Linear calibration curves were obtained for all theanalytes in the evaluated concentration ranges, andcorrelation factors (R²) were always above 0.99. Thepercentage bias between nominal and experimentalconcentration for all calibrators and controls was alwayswithin the set acceptance criteria (15% for calibrators and20% for controls). A summary of calibration range,intercept, slope, and correlation factor (R2) for eachanalyte is reported in Table 6. Table 6. Calibration range, intercept, slope, and correlation factor (R?) Analyte Calibration Range (ng/mL) Intercept Slope R2 Carbamazepine 1.62-15.1 -0.068 0.610 0.998 Oxcarbazepine 0.14-3.64 -0.054 1.585 0.998 Carbamazepine diol 0.16-11.5 0.000 0.115 0.996 Carbamazepine-10,11-epoxide 0.16-11.0 -0.056 7.099 0.995 10-hydroxycarbamazepine 3.83-48.3 0.072 0.347 0.999 Felbamate 14.3-130 -0.119 0.484 0.995 Lacosamide 0.78-11.4 -0.064 1.145 0.996 Levetiracetam 4.90-84.0 -0.451 0.954 0.995 Rufinamide 3.98-35.3 -0.449 1.026 0.996 Theophylline 6.11-24.6 0.117 0.198 0.991 Phenytoin 3.49-23.3 -2.185 0.667 0.996 Primidone 3.07-18.3 2.570 1.375 0.997 PEMA 1.07-12.7 -1.964 6.885 0.996 Stiripentol 2.62-27.3 -2.298 1.922 0.994 Phenobarbital 7.38-60.1 -0.027 0.083 0.998 Valproic Acid 31.6-125 -0.041 0.011 0.998 Zonisamide 3.97-50.4 -0.157 0.286 0.999 Representative calibration curves for carbamazepine and phenobarbital are shown in Figure 1.Representative chromatograms at the limit of quantitation (LOQ) for each analyte, including theinternal standards, are shown in Figures 2, 3, and 4. ng/ml Figure 2. Representative chromatograms of each analyte at the LOQ and corresponding ISfor Group 1 Figure 1. Calibration curves for (a) carbamazepine and (b)phenobarbital Figure 3. Representative chromatograms of each analyte at theLOQ and corresponding IS for Group 2 Figure 4. Representative chromatograms of each analyte at theLOQ and corresponding IS for Group 3 For Research Use Only. Not for use in diagnostic procedures. www.thermofisher.com O2016 Thermo Fisher Scientific Inc. All rights reserved. MassTox is a registered trademark and Chromsystems is a trademark ofChromsystems Instruments & Chemicals GmbH. All other trademarks are the property of Thermo Fisher Scientific Inc. and its subsidiaries. Thisinformation is presented as an example of the capabilities of Thermo Fisher Scientific products. It is not intended to encourage use of theseproducts in any manners that might infringe the intellectual property rights of others. Specifications, terms and pricing are subject to change.Not all products are available in all countries. Please consult your local sales representative for details. The quantification of a panel of antiepileptic drugs inhuman plasma has been implemented and analyticallyvalidated on a TSQ Quantum Access MAX massspectrometer using the MassTox TDM Series A kit forantiepileptics from Chromsystems. The TSQ QuantumAccess MAX mass spectrometer proved to have theproper sensitivity, accuracy, and precision for theapplication of this analytical method to clinical research. SCIENTIFIC ANEN Antiepileptic drugs, antiepileptics, AEDs, anticonvulsants, antiseizure drugs, liquid chromatography, triple quadrupole mass spectrometry, TSQ Quantum Access MAXImplement an LC-MS/MS method for the quantification of 17 antiepileptics and their metabolites in human plasma.Liquid chromatography coupled to tandem mass spectrometry (LC-MS/MS) is a valuable tool that can help clinical researchers to monitor that antiepileptic drugs remain within the desired range. Here, an LC-MS/MS method on the Thermo Scientific™ TSQ Quantum Access MAX™ triple quadrupole mass spectrometer was used with the MassTox® TDM Series A kit for antiepileptics from Chromsystems™ to quantify a panel of 17 antiepileptics and their metabolites in human plasma. The MassTox TDM Series A kit includes levetiracetam, theophylline, felbamate, lacosamide, rufinamide, carbamazepine, oxcarbazepine, carbamazepine diol, carbamazepine-10,11-epoxide, 10-hydroxycarbamazepine, phenylethylmalonamide (PEMA), primidone, phenytoin, stiripentol, zonisamide, phenobarbital, valproic acid, and 12 internal standards.The quantification of a panel of antiepileptic drugs in human plasma has been implemented and analytically validated on a TSQ Quantum Access MAX mass spectrometer using the MassTox TDM Series A kit for antiepileptics from Chromsystems. The TSQ Quantum Access MAX mass spectrometer proved to have the proper sensitivity, accuracy, and precision for the application of this analytical method to clinical research.
确定


还剩4页未读,是否继续阅读?

产品配置单
赛默飞色谱与质谱为您提供《人血浆中17种抗癫痫药及其代谢产物检测方案(液质联用仪)》,该方案主要用于全血/血清/血浆中生化检验检测,参考标准--,《人血浆中17种抗癫痫药及其代谢产物检测方案(液质联用仪)》用到的仪器有赛默飞Q Exactive Focus LCMSMS 系统
推荐专场
相关方案
更多
该厂商其他方案
更多