


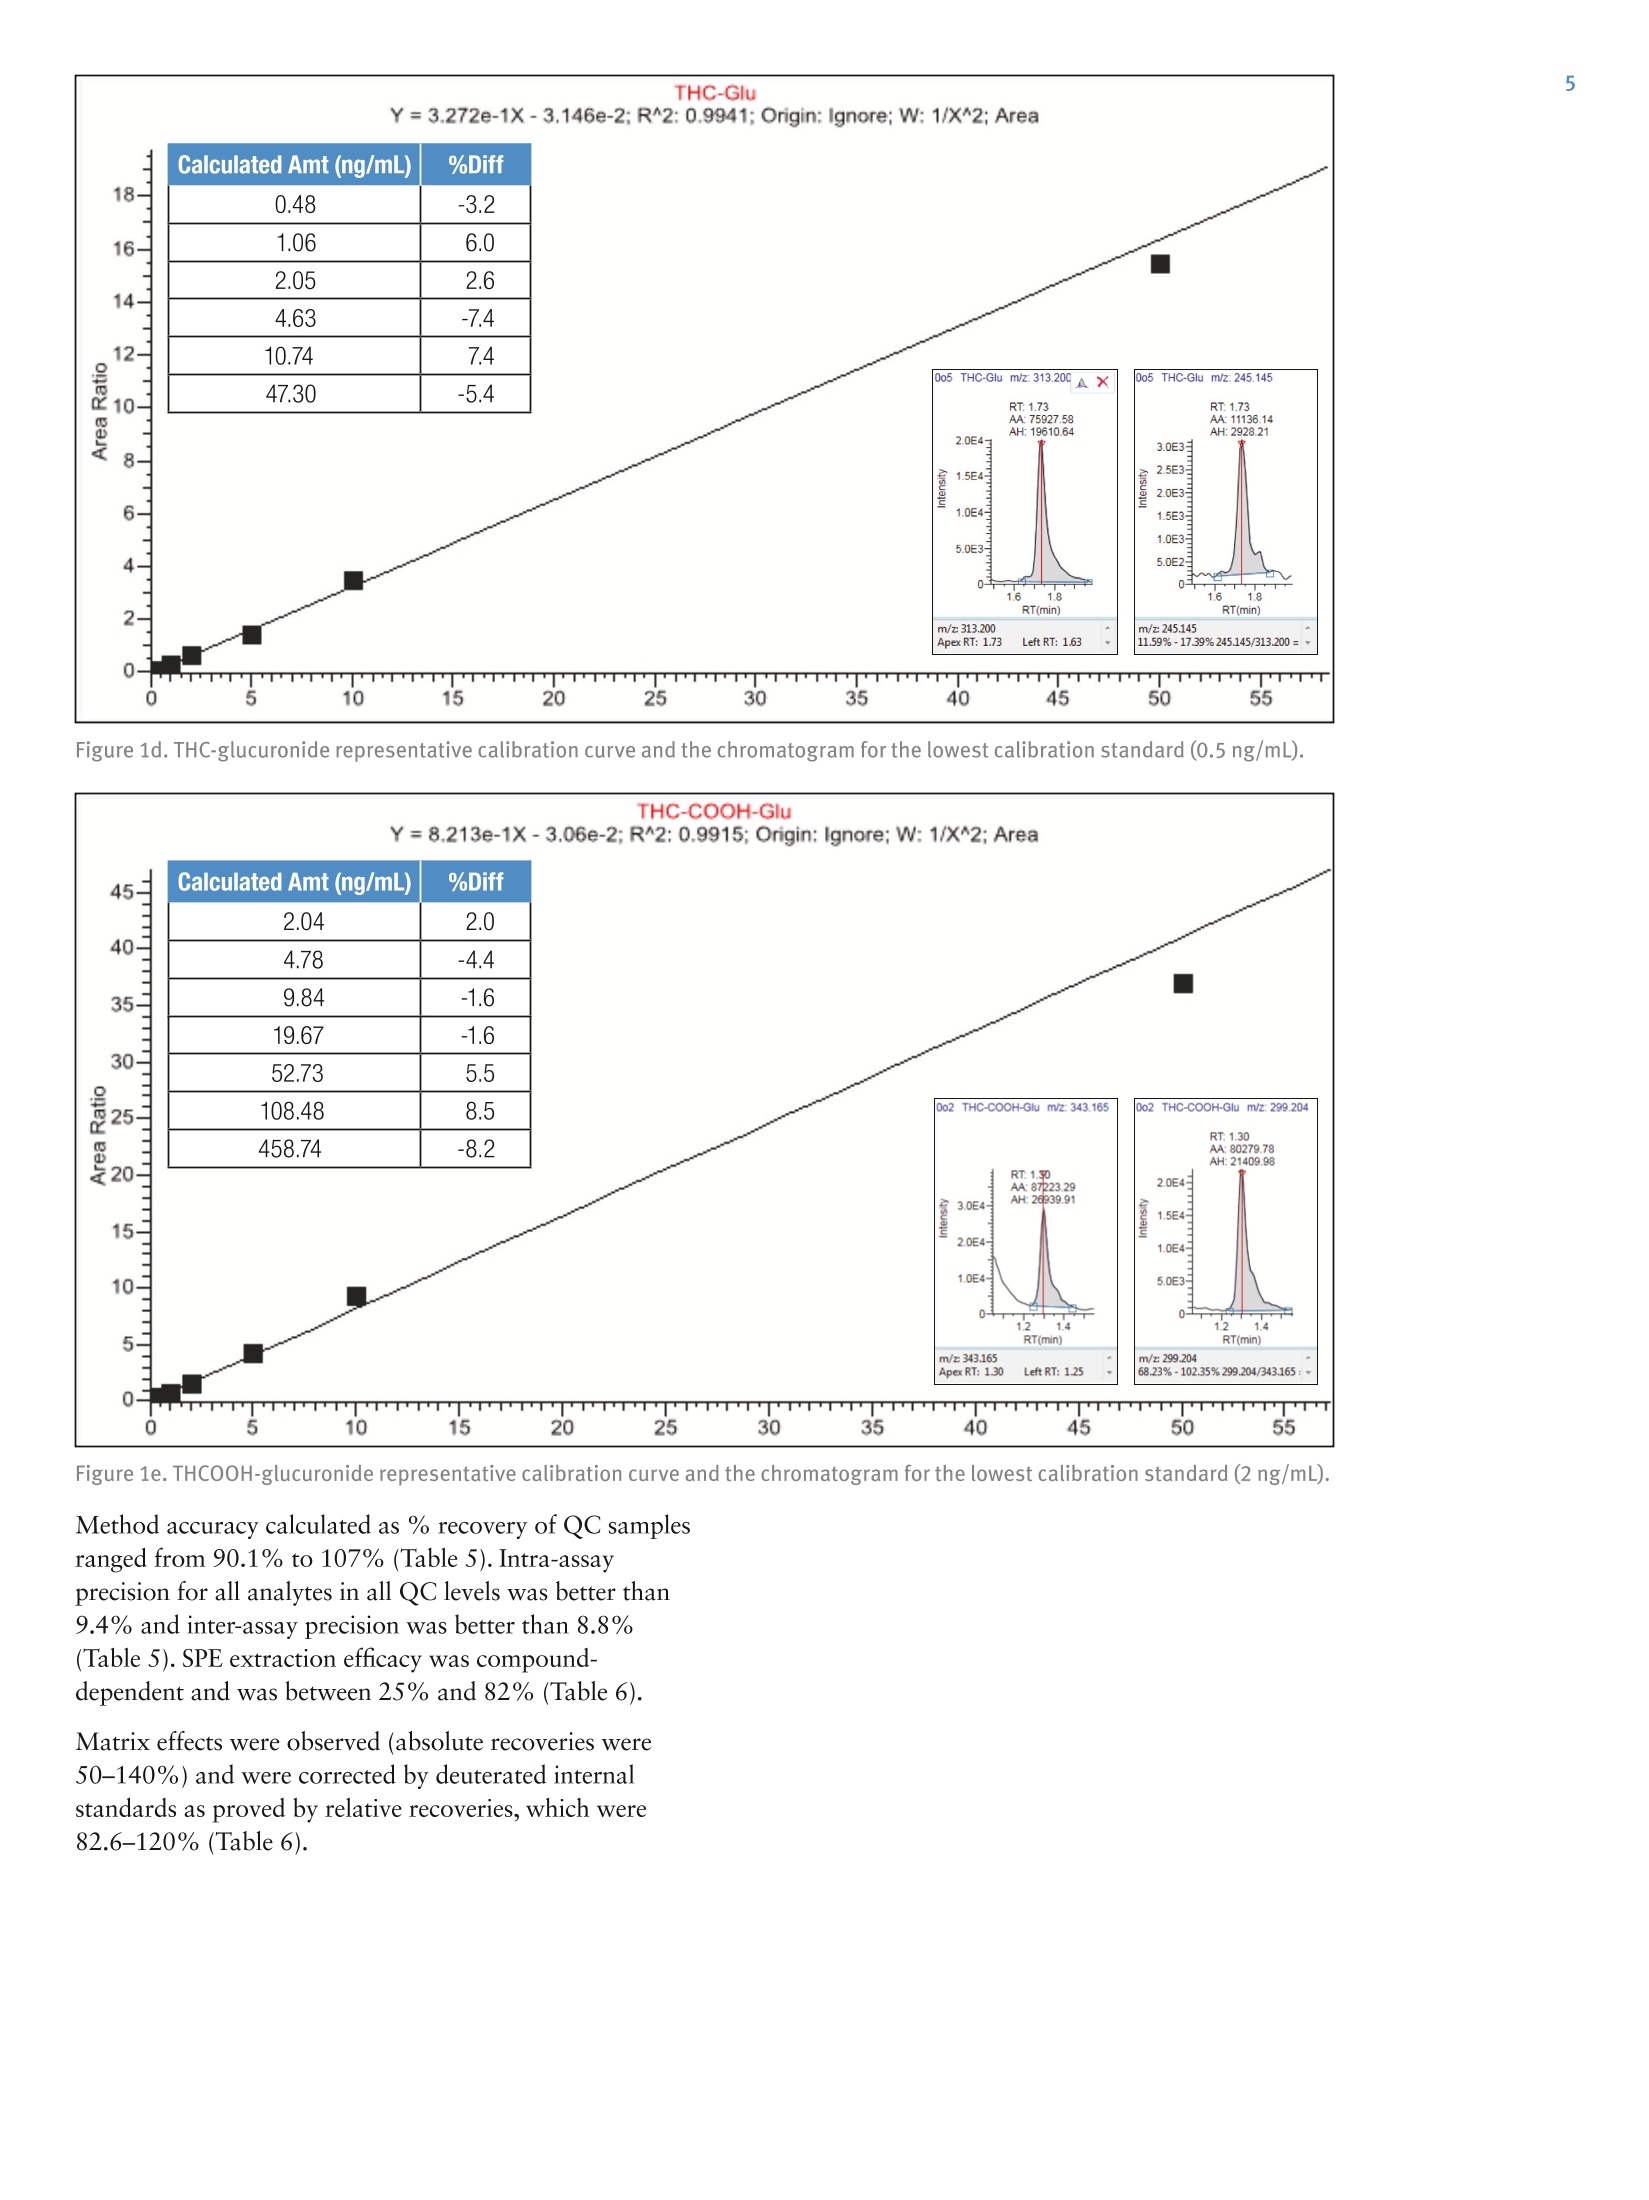
We demonstrated a simple and economical quantitative
method for analysis of THC and metabolites in blood for
forensics. Method performance meets forensic lab
requirements. Analysis of glucuronides allows for better
data interpretation to determine recent cannabis intake.
To improve laboratory throughput by 30%, this method
can be implemented on a 2-channel Thermo Scientific™
Transcend™ II LC system to provide data for 17 samples
per hour.
方案详情

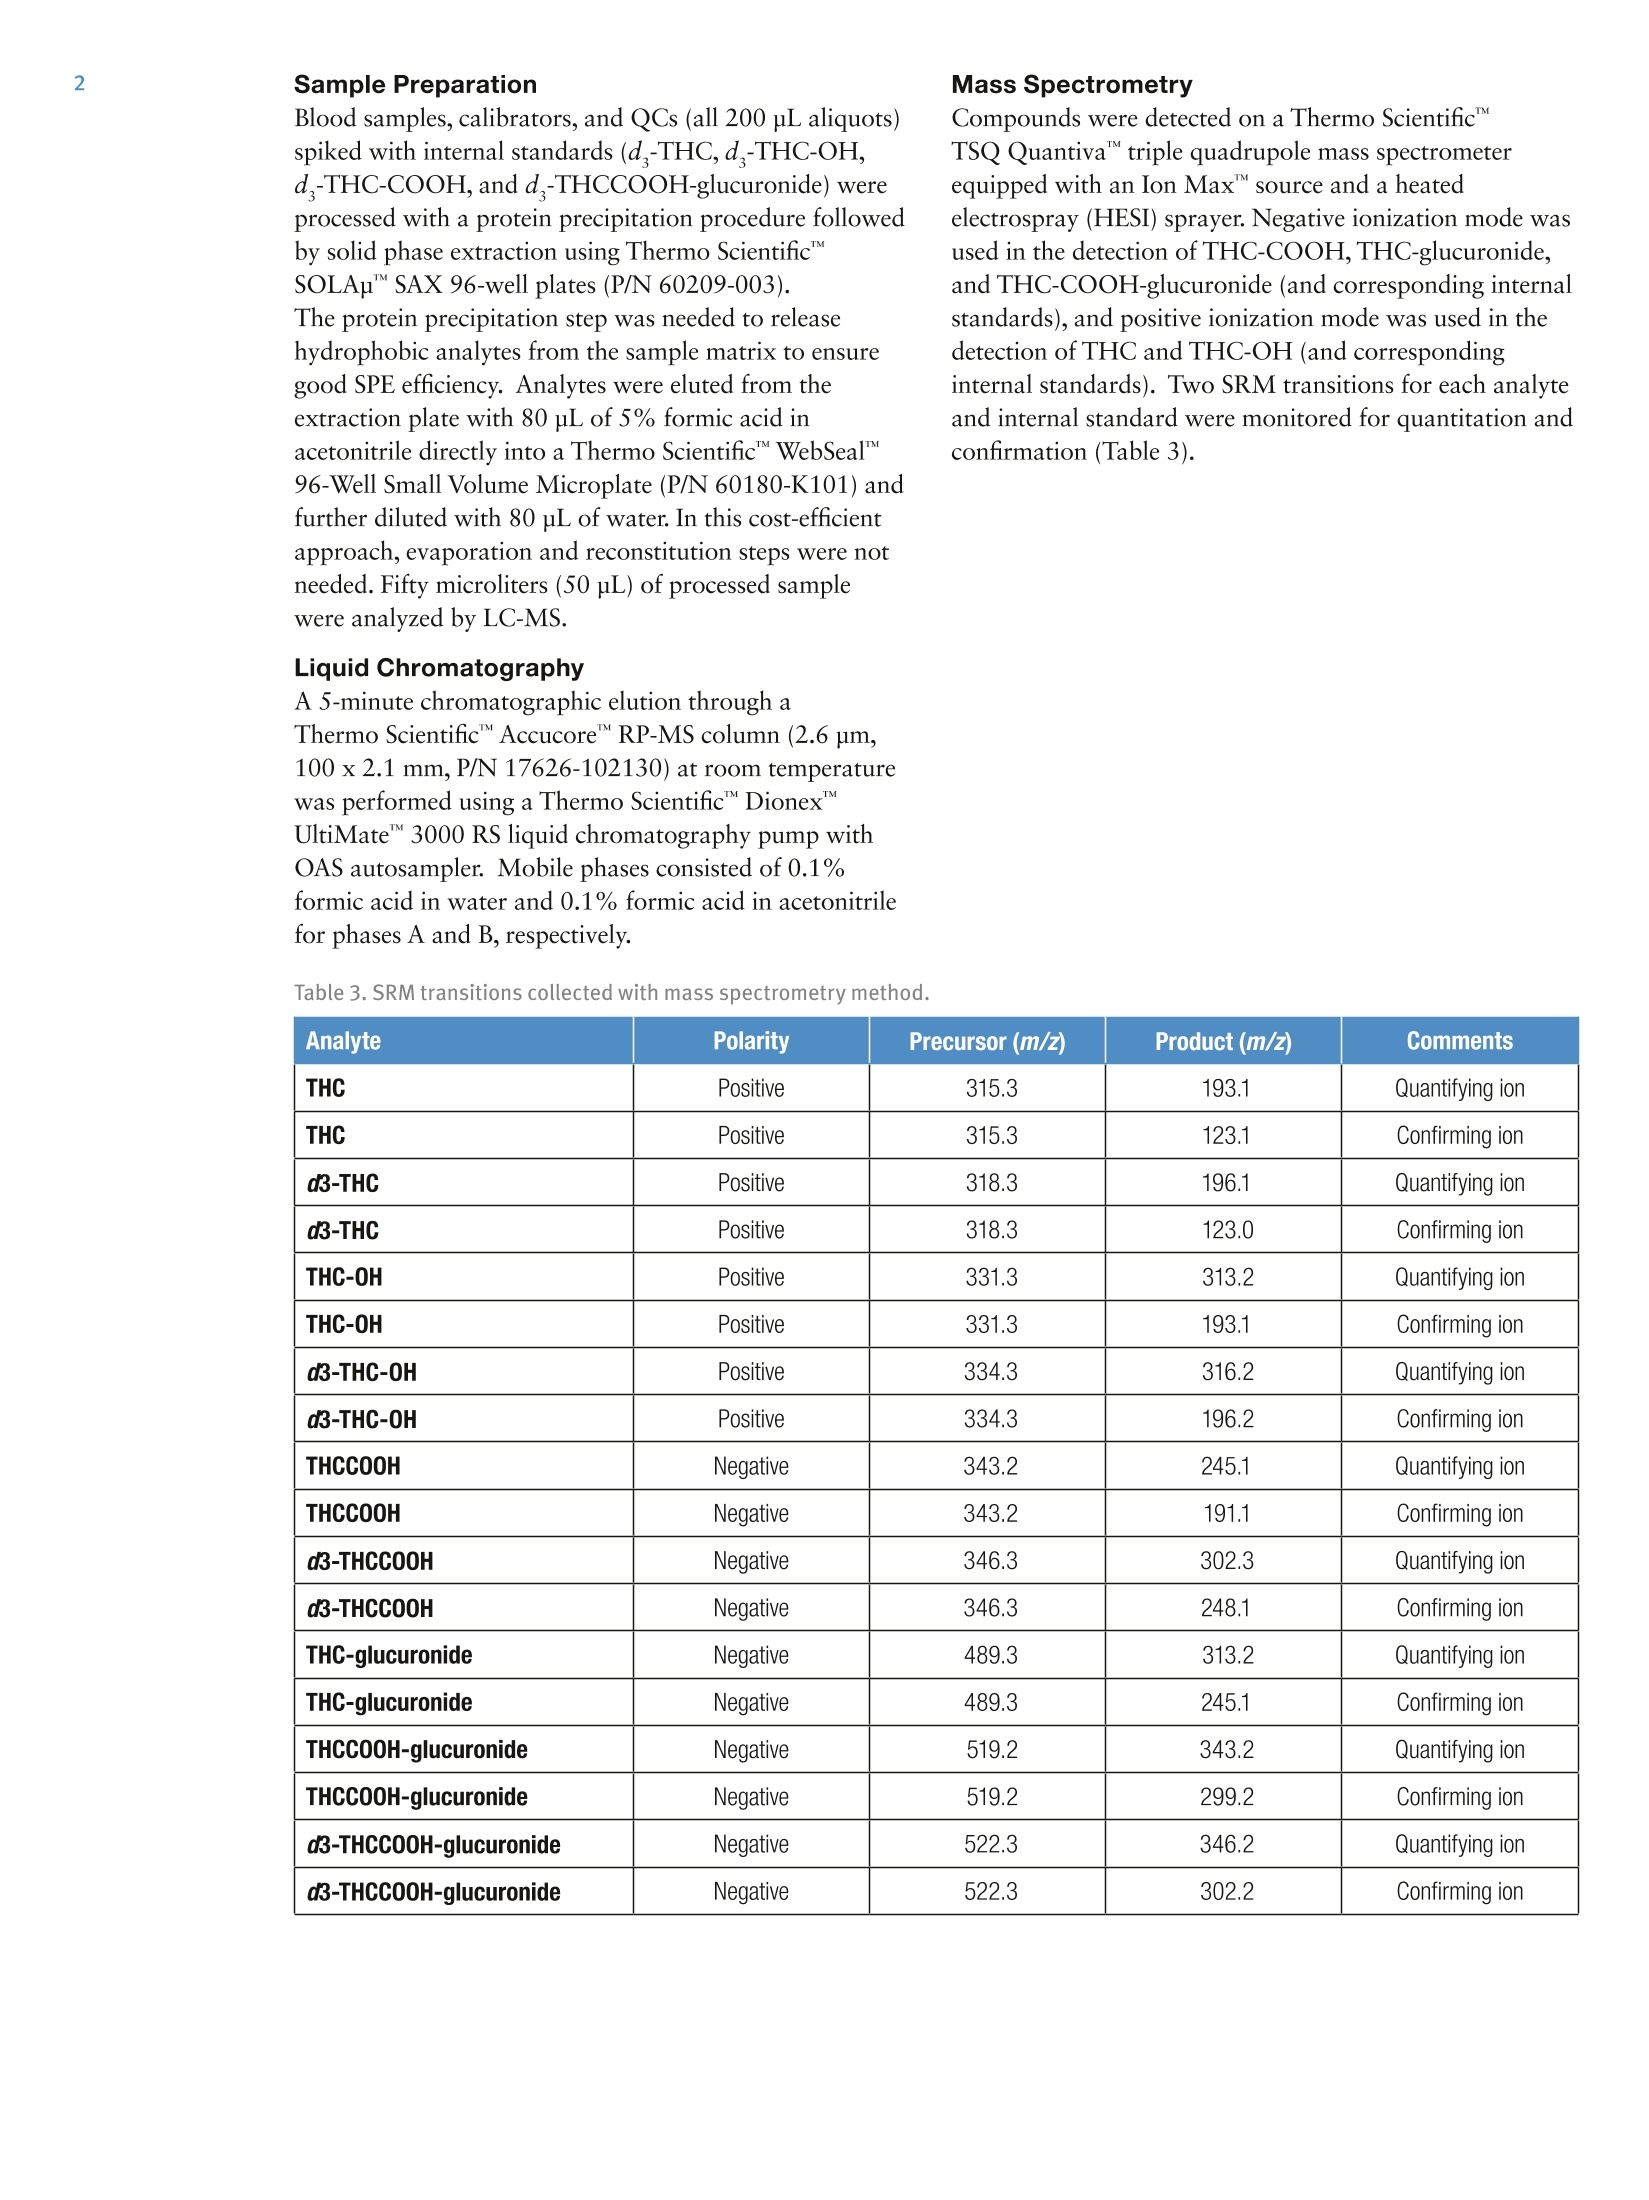
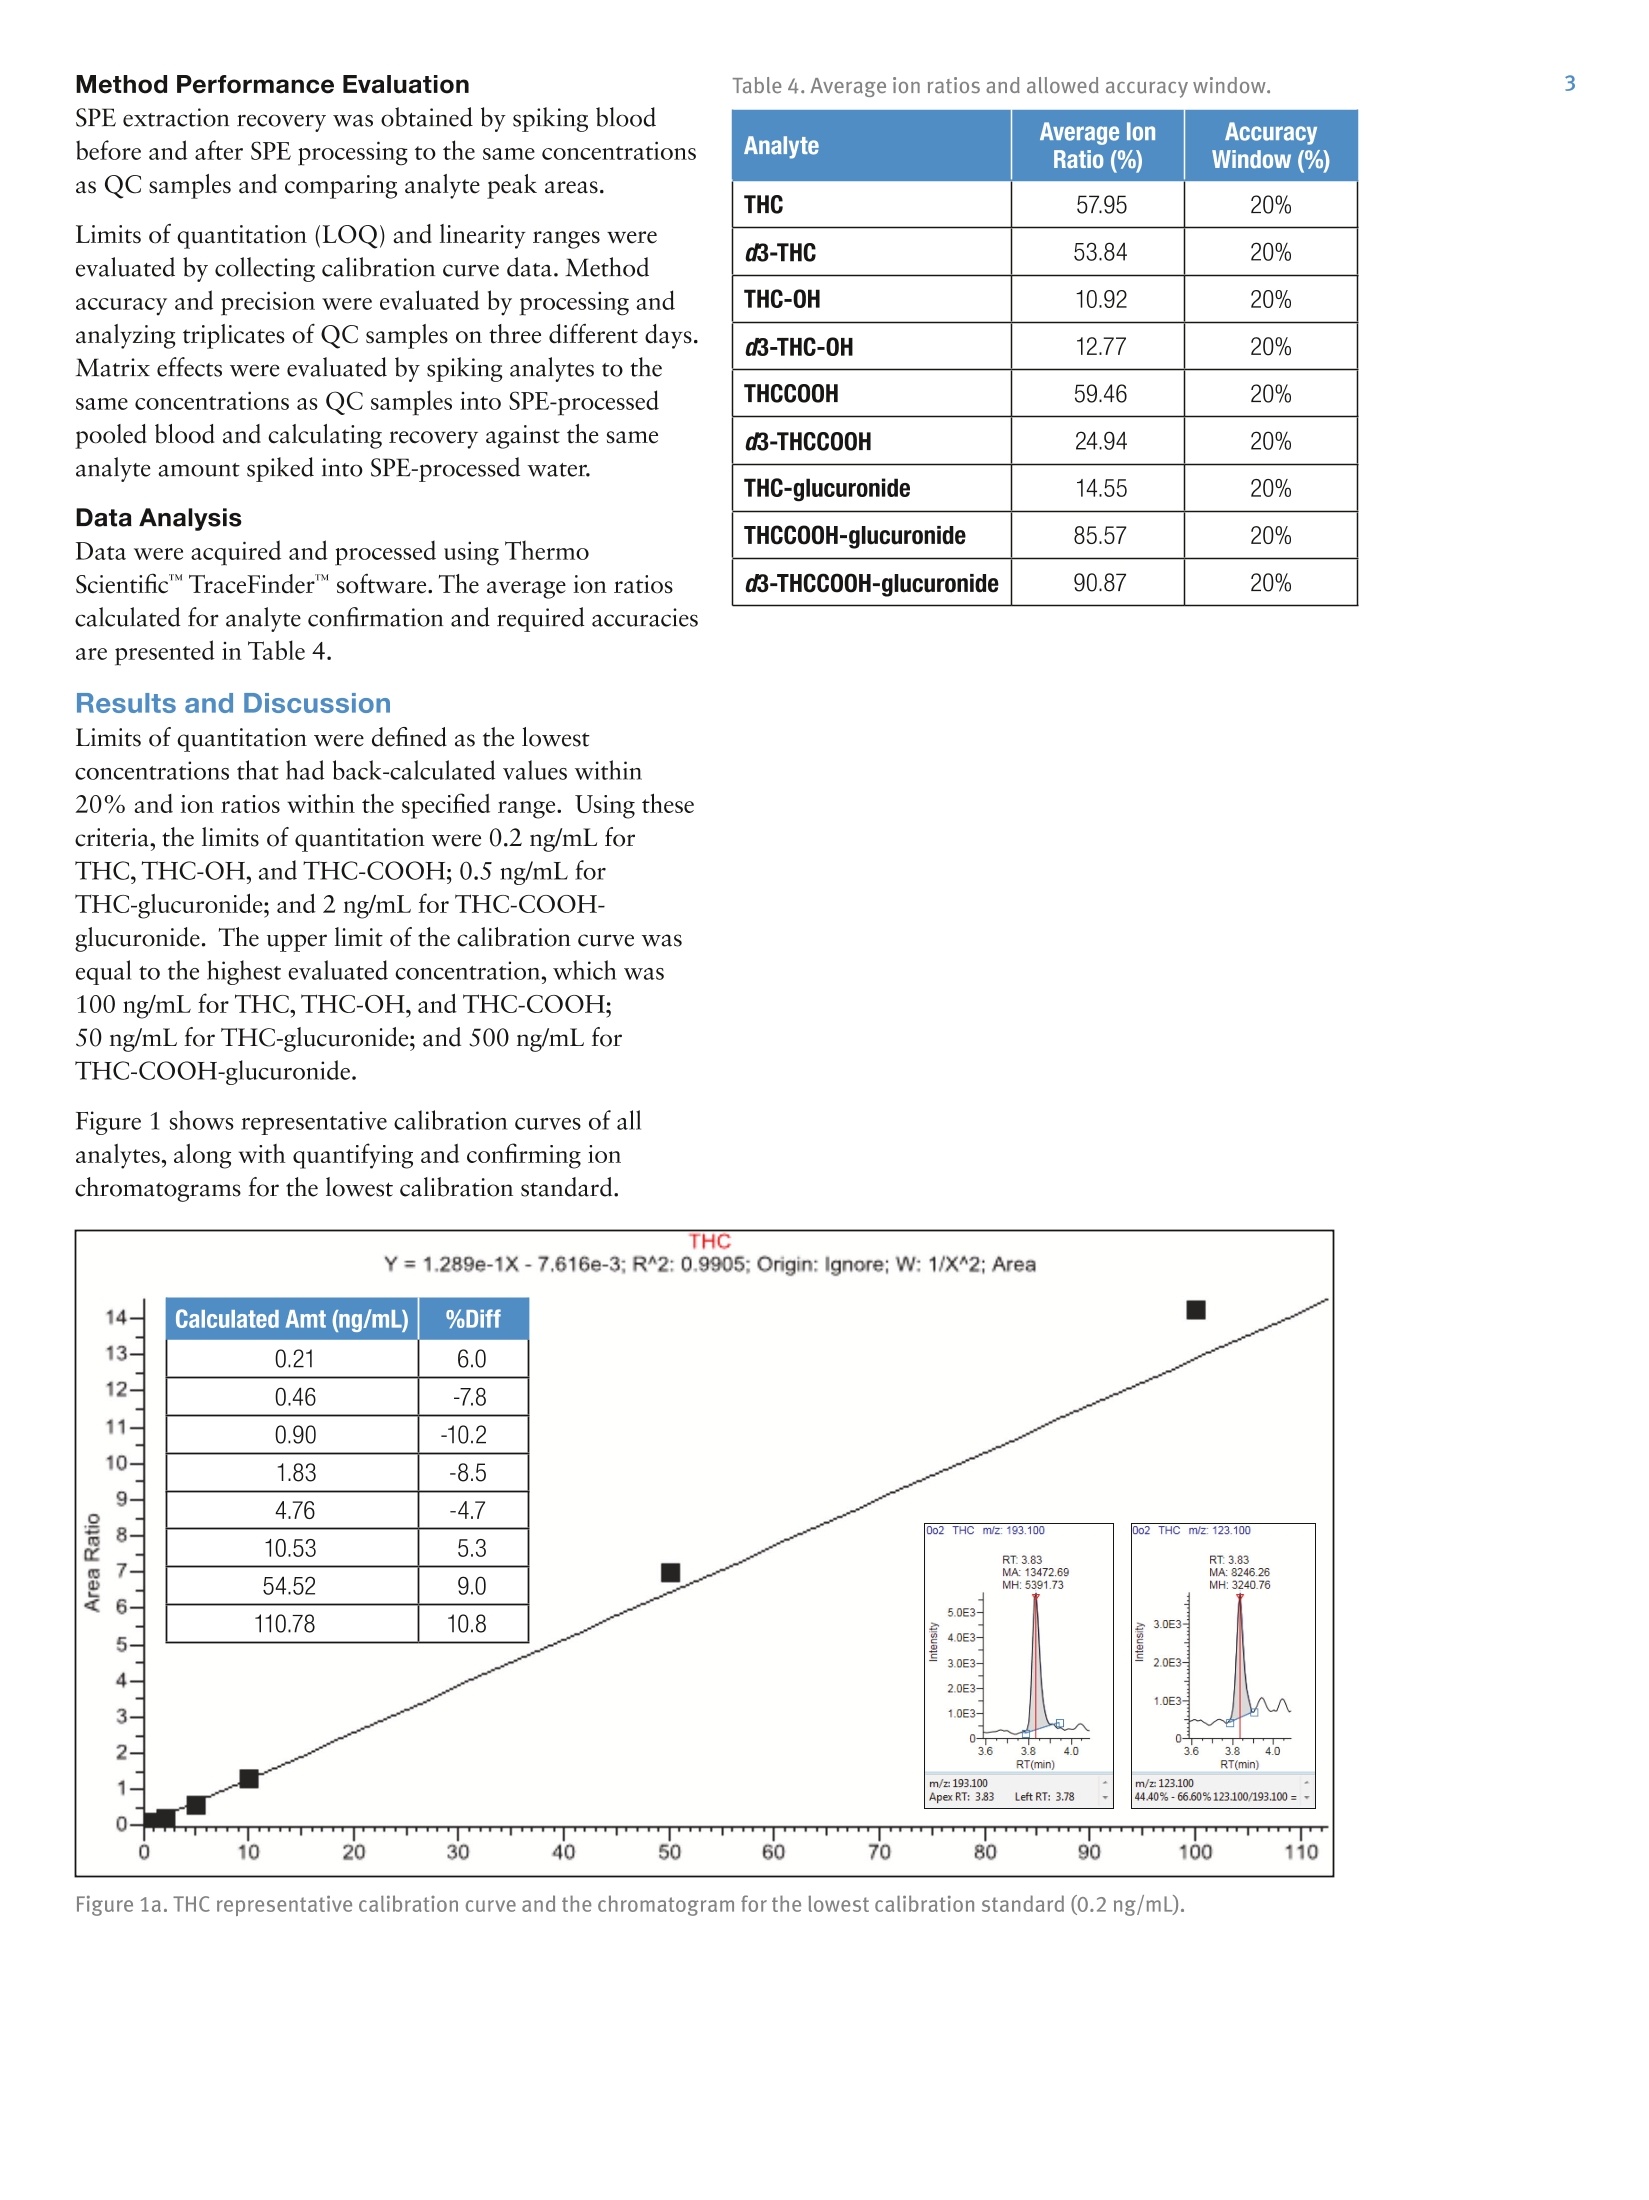
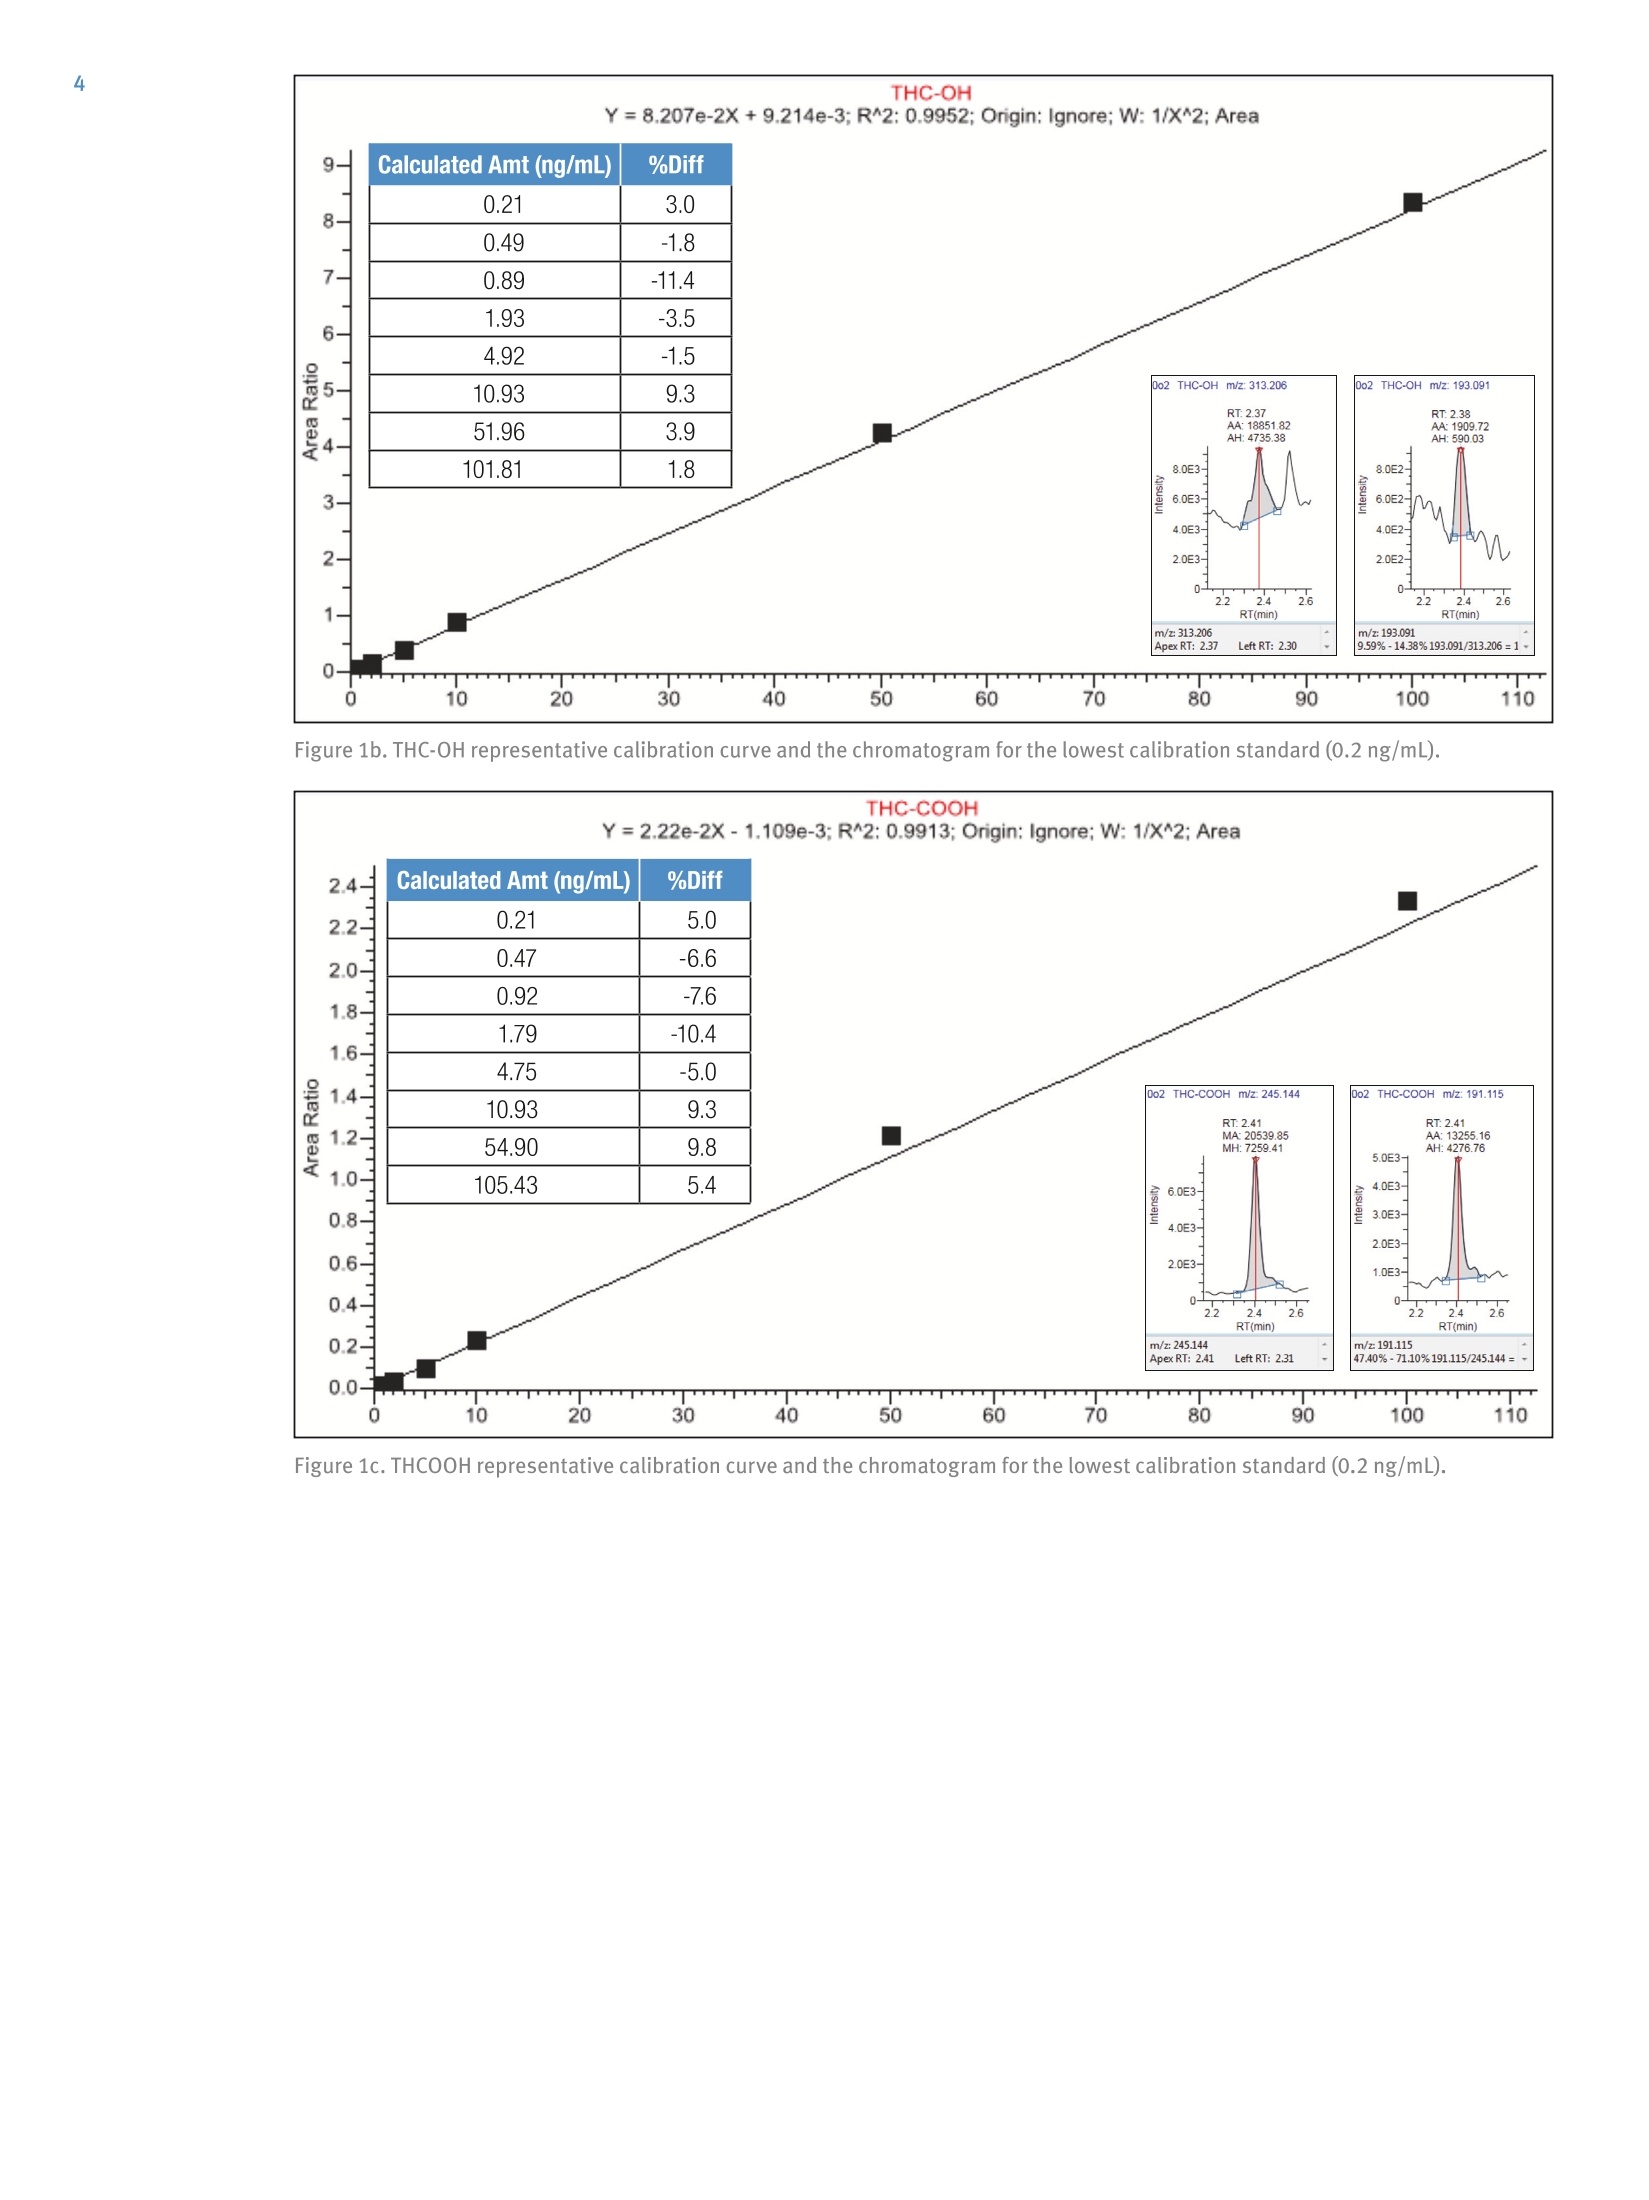
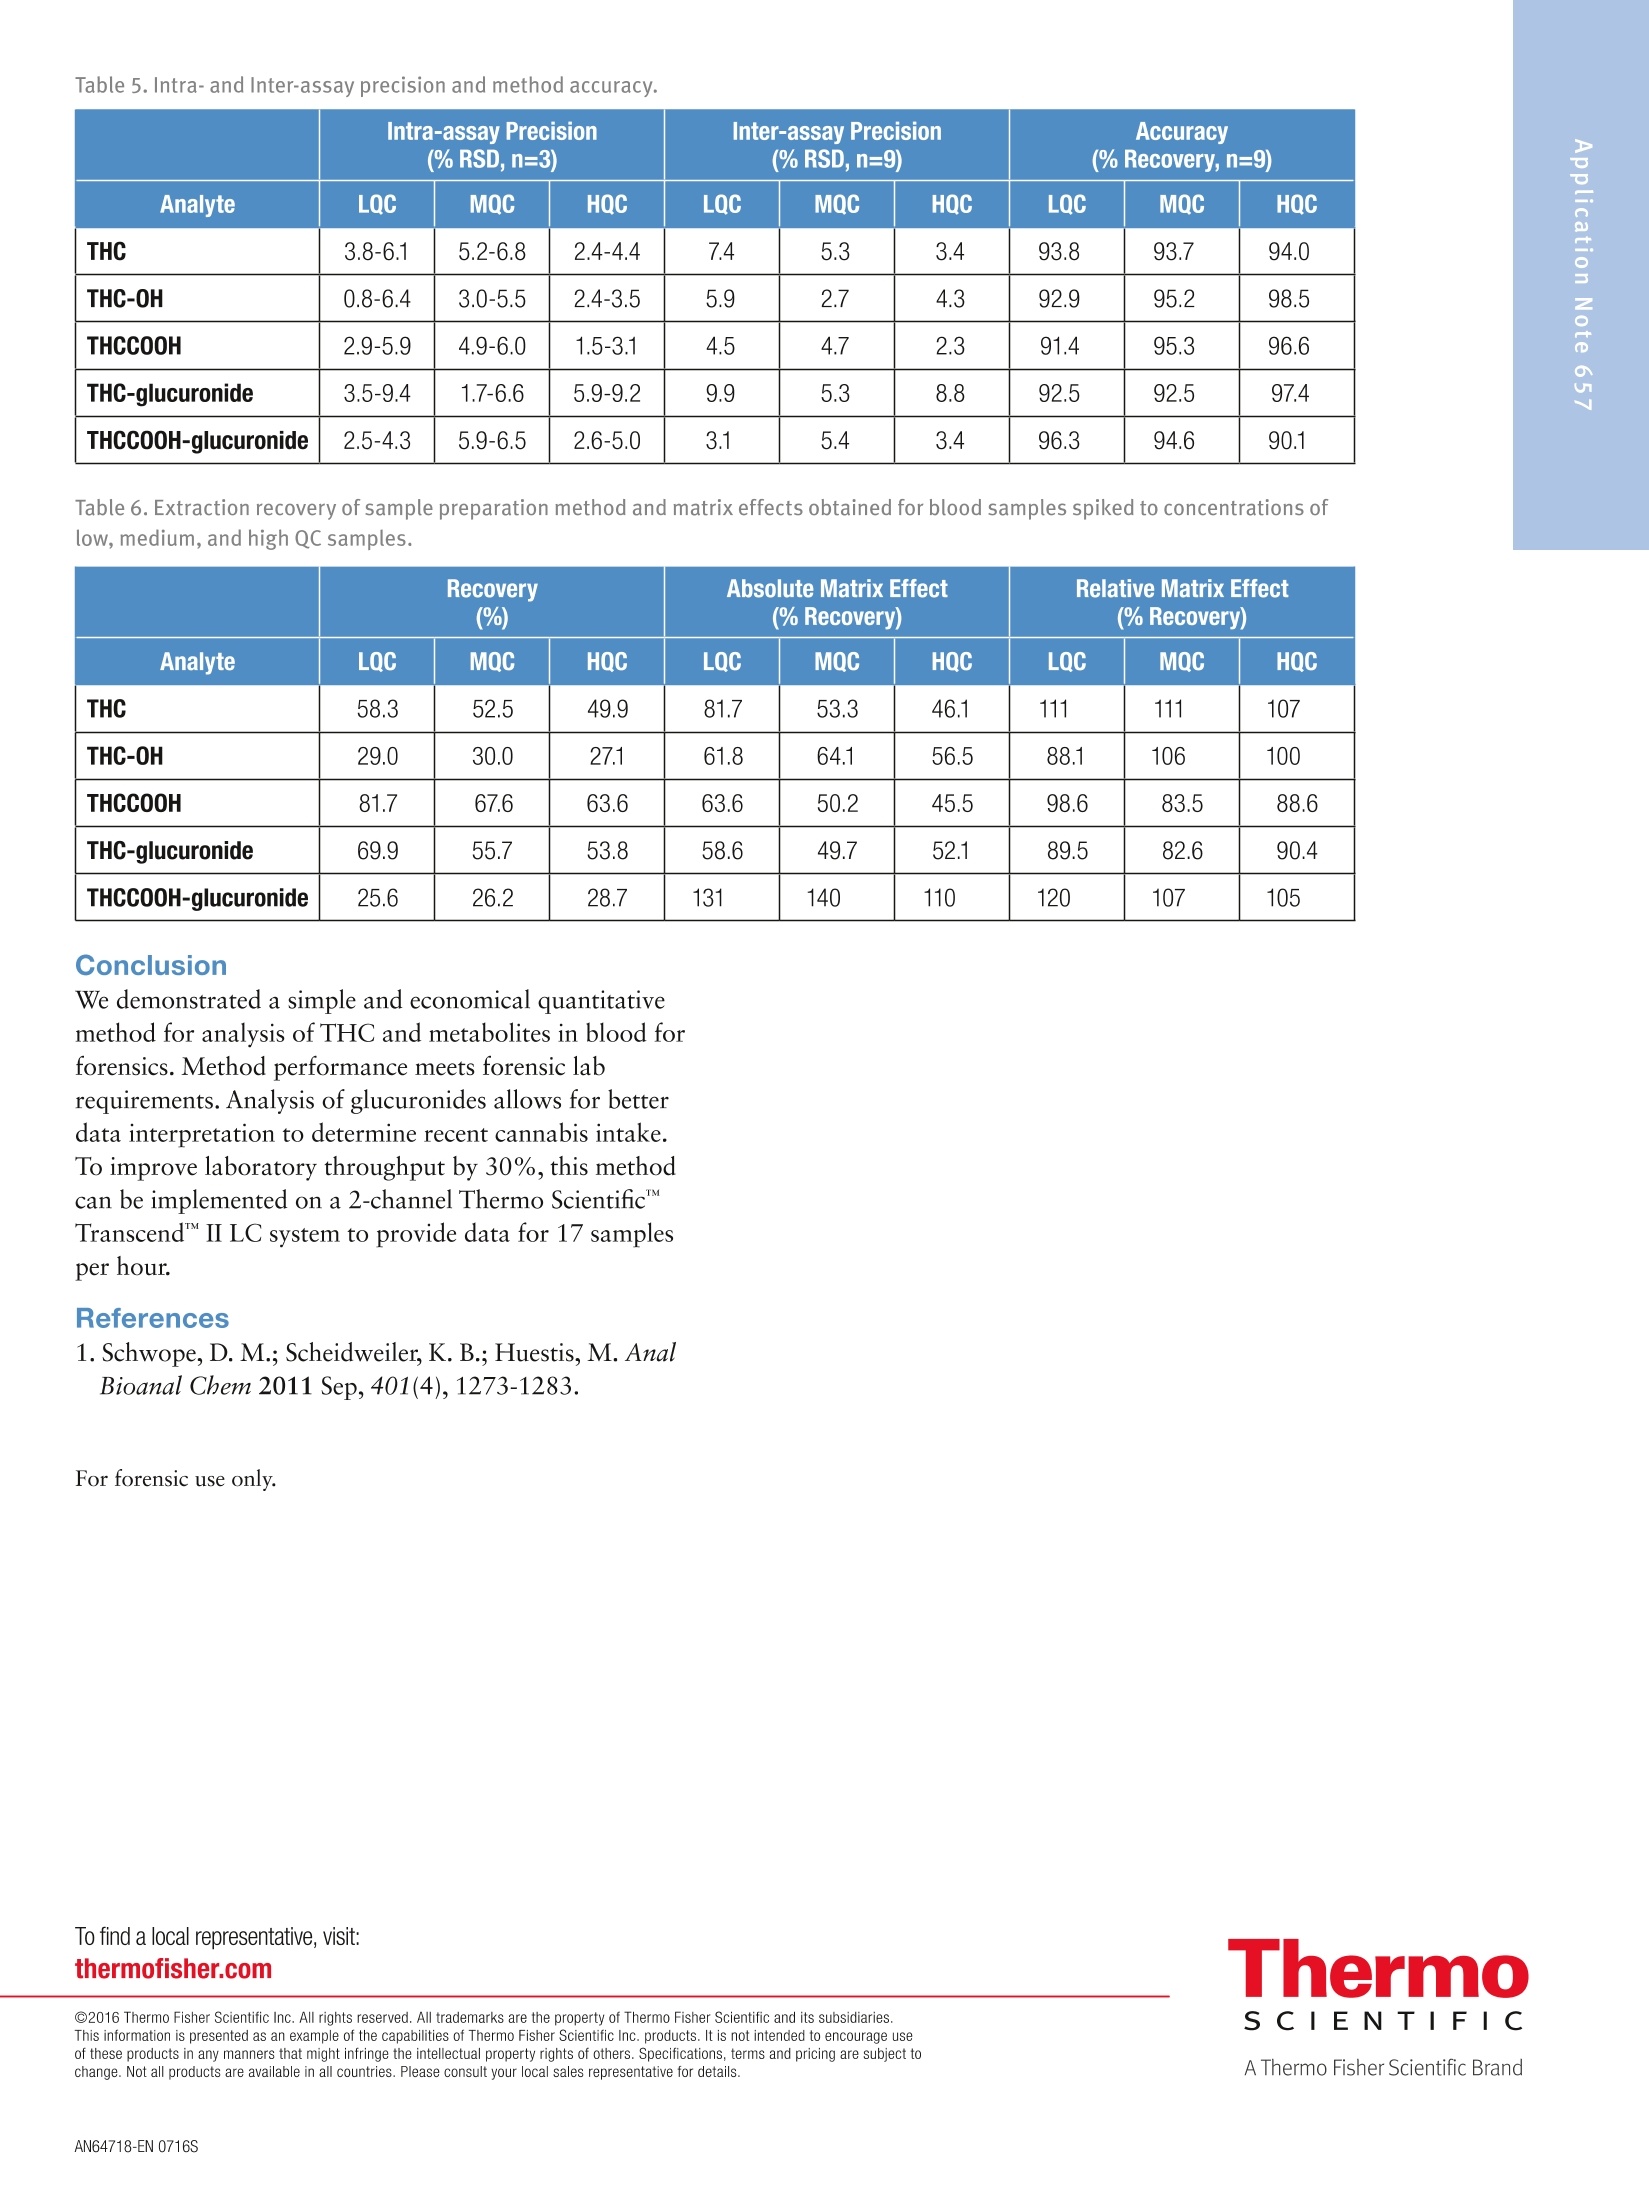
2 3 Quantitation of THC and THC Metabolitesin Blood Using SOLAu SPE Plates and theTSQ Quantiva Triple Quadrupole MassSpectrometer for Forensic Analysis Xiaolei Xie, Thomas Carrell, Marta KozakThermo Fisher Scientific, San Jose, CA Key Words Marijuana, THC, THC-COOH, SOLAp, TSQ Quantiva MS,LC-MS Goal To demonstrate a simple and economical quantitative method for theanalysis of THC and THC metabolites in blood to address key forensiclaboratory requirements. Application Benefits · Analysis of THC and four major metabolites,including glucuronides,to determine recency of cannabis intake · Low limits of quantitation ·Simple, economical,easily automated sample preparation method ·Confident analyte identification with ion ratio confirmation ·Robust method with limited matrix effects corrected by internal standards Introduction Cannabis is the most frequently abused drug. THC(tetrahydrocannabinol) is the major psychoactiveconstituent of cannabis.THC is primarily metabolizedto 11-hydroxy-THC (THC-OH),which has equipotentpsychoactivity and is further metabolized to non-psychoactive 11-nor-9-carboxy-THC (THC-COOH).Second-phase metabolites, THC-glucuronide andTHC-COOH-glucuronide, are also present in bloodand can be used as markers to determine recency ofcannabis intake and to improve interpretation of analyticalresults.' LC-MS analytical methods are widely used foranalysis of THC and its metabolites in blood samples.LC-MS methods do not require sample derivatization,thus yielding savings over typical GC-MS procedures. Methods Calibrators and Quality Controls Calibration standards and quality controls (LQC,MQC,and HQC) at concentrations specified in Table 1 andTable 2 were prepared in donor blood. Silanized labwarewas used to prepare standard spiking solutions to avoidadsorption of analytes to the glass surface. Table 1. Analyte concentration in calibration standards. Analyte Cal 1 Cal 2 Cal3 Cal4 Concentration (ng/mL) THC 0.2 0.5 1.0 2.0 THC-OH 0.2 0.5 1.0 2.0 THCCOOH 0.2 0.5 1.0 2.0 THC-glucuronide 0.2 0.5 1.0 2.0 THCCOOH-glucuronide 2.0 5.0 10 20 Analyte Cal5 Cal 6 Cal 7 Cal 8 Concentration(ng/mL) THC 5.0 10 50 100 THC-OH 5.0 10 50 100 THCCOOH 5.0 10 50 100 THC-glucuronide 5.0 10 50 100 THCCOOH-glucuronide 50 100 500 1000 Table 2. Analyte concentrations in QC samples. Analyte LOC MQC HQC Concentration (ng/mL) THC 1.0 5.0 50 THC-0H 1.0 5.0 50 THCCOOH 1.0 5.0 50 THC-glucuronide 1.0 5.0 50 THCCOOH-glucuronide 10 50 500 Sample PreparationBlood samples, calibrators, and QCs (all 200 pL aliquots)spiked with internal standards (d-THC,d-THC-OH,d-THC-COOH,and d-THCCOOH-glucuronide) wereprocessed with a protein precipitation procedure followedby solid phase extraction using Thermo ScientificSOLAp SAX 96-well plates (P/N 60209-003).The protein precipitation step was needed to releasehydrophobic analytes from the sample matrix to ensuregood SPE efficiency. Analytes were eluted from theextraction plate with 80 pL of 5% formic acid inacetonitrile directly into a Thermo Scientific""WebSeal"96-Well Small Volume Microplate (P/N 60180-K101) andfurther diluted with 80 pL of water. In this cost-efficientapproach, evaporation and reconstitution steps were notneeded. Fifty microliters (50 pL) of processed samplewere analyzed by LC-MS. Mass Spectrometry Compounds were detected on a Thermo Scientific"TSQ Quantiva"triple quadrupole mass spectrometerequipped with an Ion Max" source and a heatedelectrospray (HESI) sprayer. Negative ionization mode wasused in the detection of THC-COOH,THC-glucuronide,and THC-COOH-glucuronide (and corresponding internalstandards), and positive ionization mode was used in thedetection of THC and THC-OH (and correspondinginternal standards). Two SRM transitions for each analyteand internal standard were monitored for quantitation andconfirmation (Table 3). Liquid Chromatography A 5-minute chromatographic elution through aThermo ScientificAccucoreRP-MS column (2.6 pm,100 x 2.1 mm,P/N 17626-102130) at room temperaturewas performed using a Thermo ScientificDionexUltiMate3000 RS liquid chromatography pump withOAS autosampler. Mobile phases consisted of 0.1%formic acid in water and 0.1% formic acid in acetonitrilefor phases A and B, respectively. Table 3. SRM transitions collected with mass spectrometry method. Analyte Polarity Precursor (m/z) Product (m/z) Comments THC Positive 315.3 193.1 Quantifying ion THC Positive 315.3 123.1 Confirming ion d3-THC Positive 318.3 196.1 Quantifying ion d3-THC Positive 318.3 123.0 Confirming ion THC-OH Positive 331.3 313.2 Quantifying ion THC-0H Positive 331.3 193.1 Confirming ion d3-THC-0H Positive 334.3 316.2 Quantifying ion d3-THC-OH Positive 334.3 196.2 Confirming ion THCCOOH Negative 343.2 245.1 Quantifying ion THCCOOH Negative 343.2 191.1 Confirming ion d3-THCC0OH Negative 346.3 302.3 Quantifying ion d3-THCCOOH Negative 346.3 248.1 Confirming ion THC-glucuronide Negative 489.3 313.2 Quantifying ion THC-glucuronide Negative 489.3 245.1 Confirming ion THCCOOH-glucuronide Negative 519.2 343.2 Quantifying ion THCCOOH-glucuronide Negative 519.2 299.2 Confirming ion d3-THCCOOH-glucuronide Negative 522.3 346.2 Quantifying ion d3-THCCOOH-glucuronide Negative 522.3 302.2 Confirming ion Method Performance Evaluation Table 4. Average ion ratios and allowed accuracy window. SPE extraction recovery was obtained by spiking bloodbefore and after SPE processing to the same concentrationsas QC samples and comparing analyte peak areas. Limits of quantitation (LOQ) and linearity ranges wereevaluated by collecting calibration curve data. Methodaccuracy and precision were evaluated by processing andanalyzing triplicates of QC samples on three different days.Matrix effects were evaluated by spiking analytes to thesame concentrations as QC samples into SPE-processedpooled blood and calculating recovery against the sameanalyte amount spiked into SPE-processed water. Data Analysis Analyte Average lonRatio (%) AccuracyWindow (%) THC 57.95 20% d3-THC 53.84 20% THC-0H 10.92 20% d3-THC-0H 12.77 20% THCCOOH 59.46 20% d3-THCCOOH 24.94 20% THC-glucuronide 14.55 20% THCCOOH-glucuronide 85.57 20% d3-THCCOOH-glucuronide 90.87 20% Data were acquired and processed using ThermoScientific"TraceFinder software. The average ion ratioscalculated for analyte confirmation and required accuraciesare presented in Table 4. Results and Discussion Limits of quantitation were defined as the lowestconcentrations that had back-calculated values within20% andion ratios within the specified range. Using thesecriteria, the limits of quantitation were 0.2 ng/mL forTHC,THC-OH,and THC-COOH; 0.5 ng/mL forTHC-glucuronide; and 2 ng/mL for THC-COOH-glucuronide. The upper limit of the calibration curve wasequal to the highest evaluated concentration, which was100 ng/mL for THC,THC-OH, and THC-COOH;50 ng/mL for THC-glucuronide; and 500 ng/mL forTHC-COOH-glucuronide. Figure 1 shows representative calibration curves of allanalytes, along with quantifying and confirming ionchromatograms for the lowest calibration standard. 110 Figure 1a. THC representative calibration curve and the chromatogram for the lowest calibration standard (0.2 ng/mL). Figure 1b.THC-OH representative calibration curve and the chromatogram for the lowest calibration standard (0.2 ng/mL). Figure 1c. THCOOH representative calibration curve and the chromatogram for the lowest calibration standard (0.2 ng/mL). Figure 1d. THC-glucuronide representative calibration curve and the chromatogram for the lowest calibration standard (0.5 ng/mL). Figure 1e. THCOOH-glucuronide representative calibration curve and the chromatogram for the lowest calibration standard(2ng/mL). Method accuracy calculated as % recovery of QC samplesranged from 90.1% to 107% (Table 5). Intra-assayprecision for all analytes in all QC levels was better than9.4% and inter-assay precision was better than 8.8%(Table 5). SPE extraction efficacy was compound-dependent and was between 25% and 82% (Table 6). Matrix effects were observed (absolute recoveries were50-140%) and were corrected by deuterated internalstandards as proved by relative recoveries, which were82.6-120%(Table 6). Table 5.Intra- and Inter-assay precision and method accuracy. Intra-assay Precision(%RSD,n=3) Inter-assay Precision(%RSD,n=9) Accuracy (% Recovery,n=9) Analyte LQC MQC HOC LOC MQC HQC LQC MQC HQC THC 3.8-6.1 5.2-6.8 2.4-4.4 7.4 5.3 3.4 93.8 93.7 94.0 THC-0H 0.8-6.4 3.0-5.5 2.4-3.5 5.9 2.7 4.3 92.9 95.2 98.5 THCCOOH 2.9-5.9 4.9-6.0 1.5-3.1 4.5 4.7 2.3 91.4 95.3 96.6 THC-glucuronide 3.5-9.4 1.7-6.6 5.9-9.2 9.9 5.3 8.8 92.5 92.5 97.4 THCCOOH-glucuronide 2.5-4.3 5.9-6.5 2.6-5.0 3.1 5.4 3.4 96.3 94.6 90.1 Table 6. Extraction recovery of sample preparation method and matrix effects obtained for blood samples spiked to concentrations oflow, medium, and high QC samples. Recovery (%) (% Recovery) Analyte LQC MQC HQC LQC MQC HQC LQC MQC HQC THC 58.3 52.5 49.9 81.7 53.3 46.1 111 111 107 THC-0H 29.0 30.0 27.1 61.8 64.1 56.5 88.1 106 100 THCCOOH 81.7 67.6 63.6 63.6 50.2 45.5 98.6 83.5 88.6 THC-glucuronide 69.9 55.7 53.8 58.6 49.7 52.1 89.5 82.6 90.4 THCCOOH-glucuronide 25.6 26.2 28.7 131 140 110 120 107 105 Conclusion We demonstrated a simple and economical quantitativemethod for analysis of THC and metabolites in blood forforensics. Method performance meets forensic labrequirements. Analysis of glucuronides allows for betterdata interpretation to determine recent cannabis intake.To improve laboratory throughput by 30%, this methodcan be implemented on a 2-channel Thermo Scientific"TMTranscend II LC system to provide data for 17 samplesper hour. 1.Schwope, D. M.; Scheidweiler, K. B.; Huestis, M. AnalBioanal Chem 2011 Sep, 401(4),1273-1283. For forensic use only. To find a local representative, visit: thermofisher.com ◎2016 Thermo Fisher Scientific Inc. All rights reserved. All trademarks are the property of Thermo Fisher Scientific and its subsidiaries. S CIENTIFIC This information is presented as an example of the capabilities of Thermo Fisher Scientific Inc. products. It is not intended to encourage useof these products in any manners that might infringe the intellectual property rights of others. Specifications, terms and pricing are subject tochange. Not all products are available in all countries. Please consult your local sales representative for details.AThermo Fisher Scientific BrandANEN To demonstrate a simple and economical quantitative method for the analysis of THC and THC metabolites in blood to address key forensic laboratory requirements.Cannabis is the most frequently abused drug. THC (tetrahydrocannabinol) is the major psychoactive constituent of cannabis. THC is primarily metabolized to 11-hydroxy-THC (THC-OH), which has equipotent psychoactivity and is further metabolized to non-psychoactive 11-nor-9-carboxy-THC (THC-COOH). Second-phase metabolites, THC-glucuronide and THC-COOH-glucuronide, are also present in blood and can be used as markers to determine recency of cannabis intake and to improve interpretation of analytical results.1 LC-MS analytical methods are widely used for analysis of THC and its metabolites in blood samples. LC-MS methods do not require sample derivatization, thus yielding savings over typical GC-MS procedures.We demonstrated a simple and economical quantitative method for analysis of THC and metabolites in blood for forensics. Method performance meets forensic lab requirements. Analysis of glucuronides allows for better data interpretation to determine recent cannabis intake. To improve laboratory throughput by 30%, this method can be implemented on a 2-channel Thermo Scientific™ Transcend™ II LC system to provide data for 17 samples per hour.
确定
还剩4页未读,是否继续阅读?

产品配置单
赛默飞色谱与质谱为您提供《血液中THC和THC代谢物的定量分析检测方案(液质联用仪)》,该方案主要用于全血/血清/血浆中THC和THC代谢物的定量分析检测,参考标准--,《血液中THC和THC代谢物的定量分析检测方案(液质联用仪)》用到的仪器有赛默飞TSQ Quantis三重四极杆质谱仪
推荐专场
相关方案
更多
该厂商其他方案
更多