


方案详情
文
采用Artium公司特色的DPSSL激光器作光源的相位多普勒粒子干涉仪(PDI)对用LIF/MIE比值法测量喷雾液滴粒径以及用结构化平面激光照明成像方法进行有效性分析提供了可靠的标定。
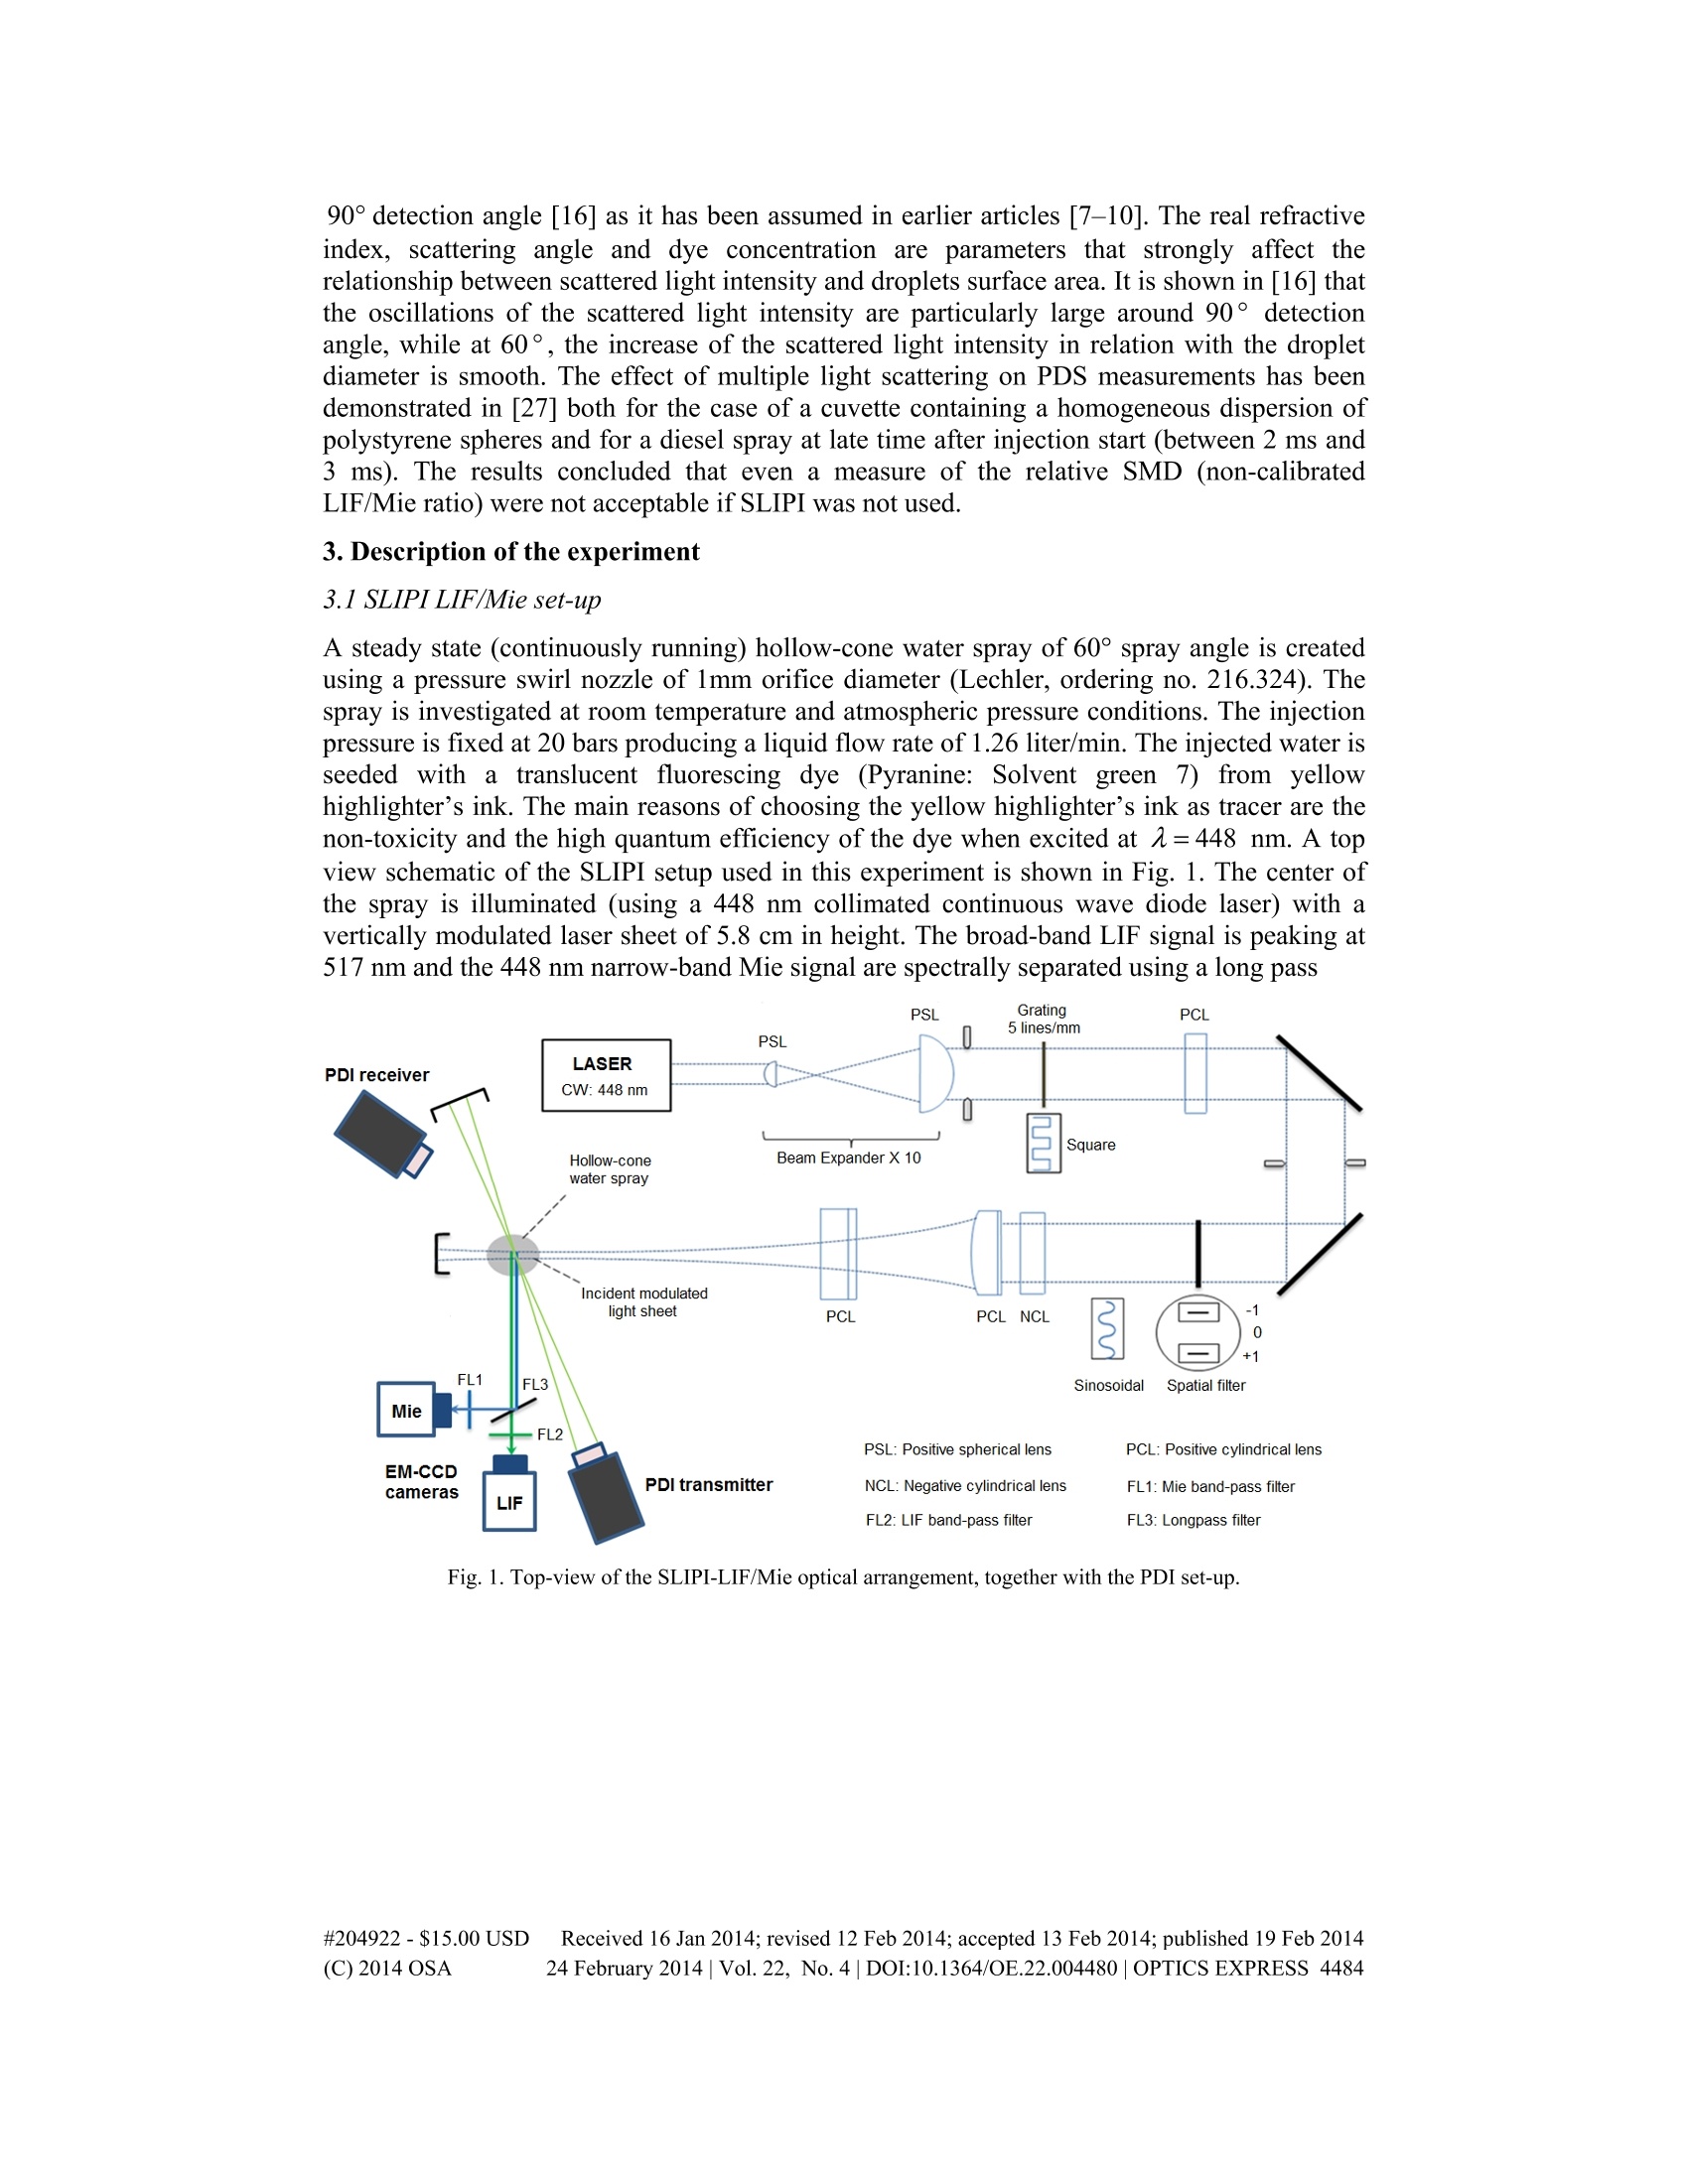
方案详情

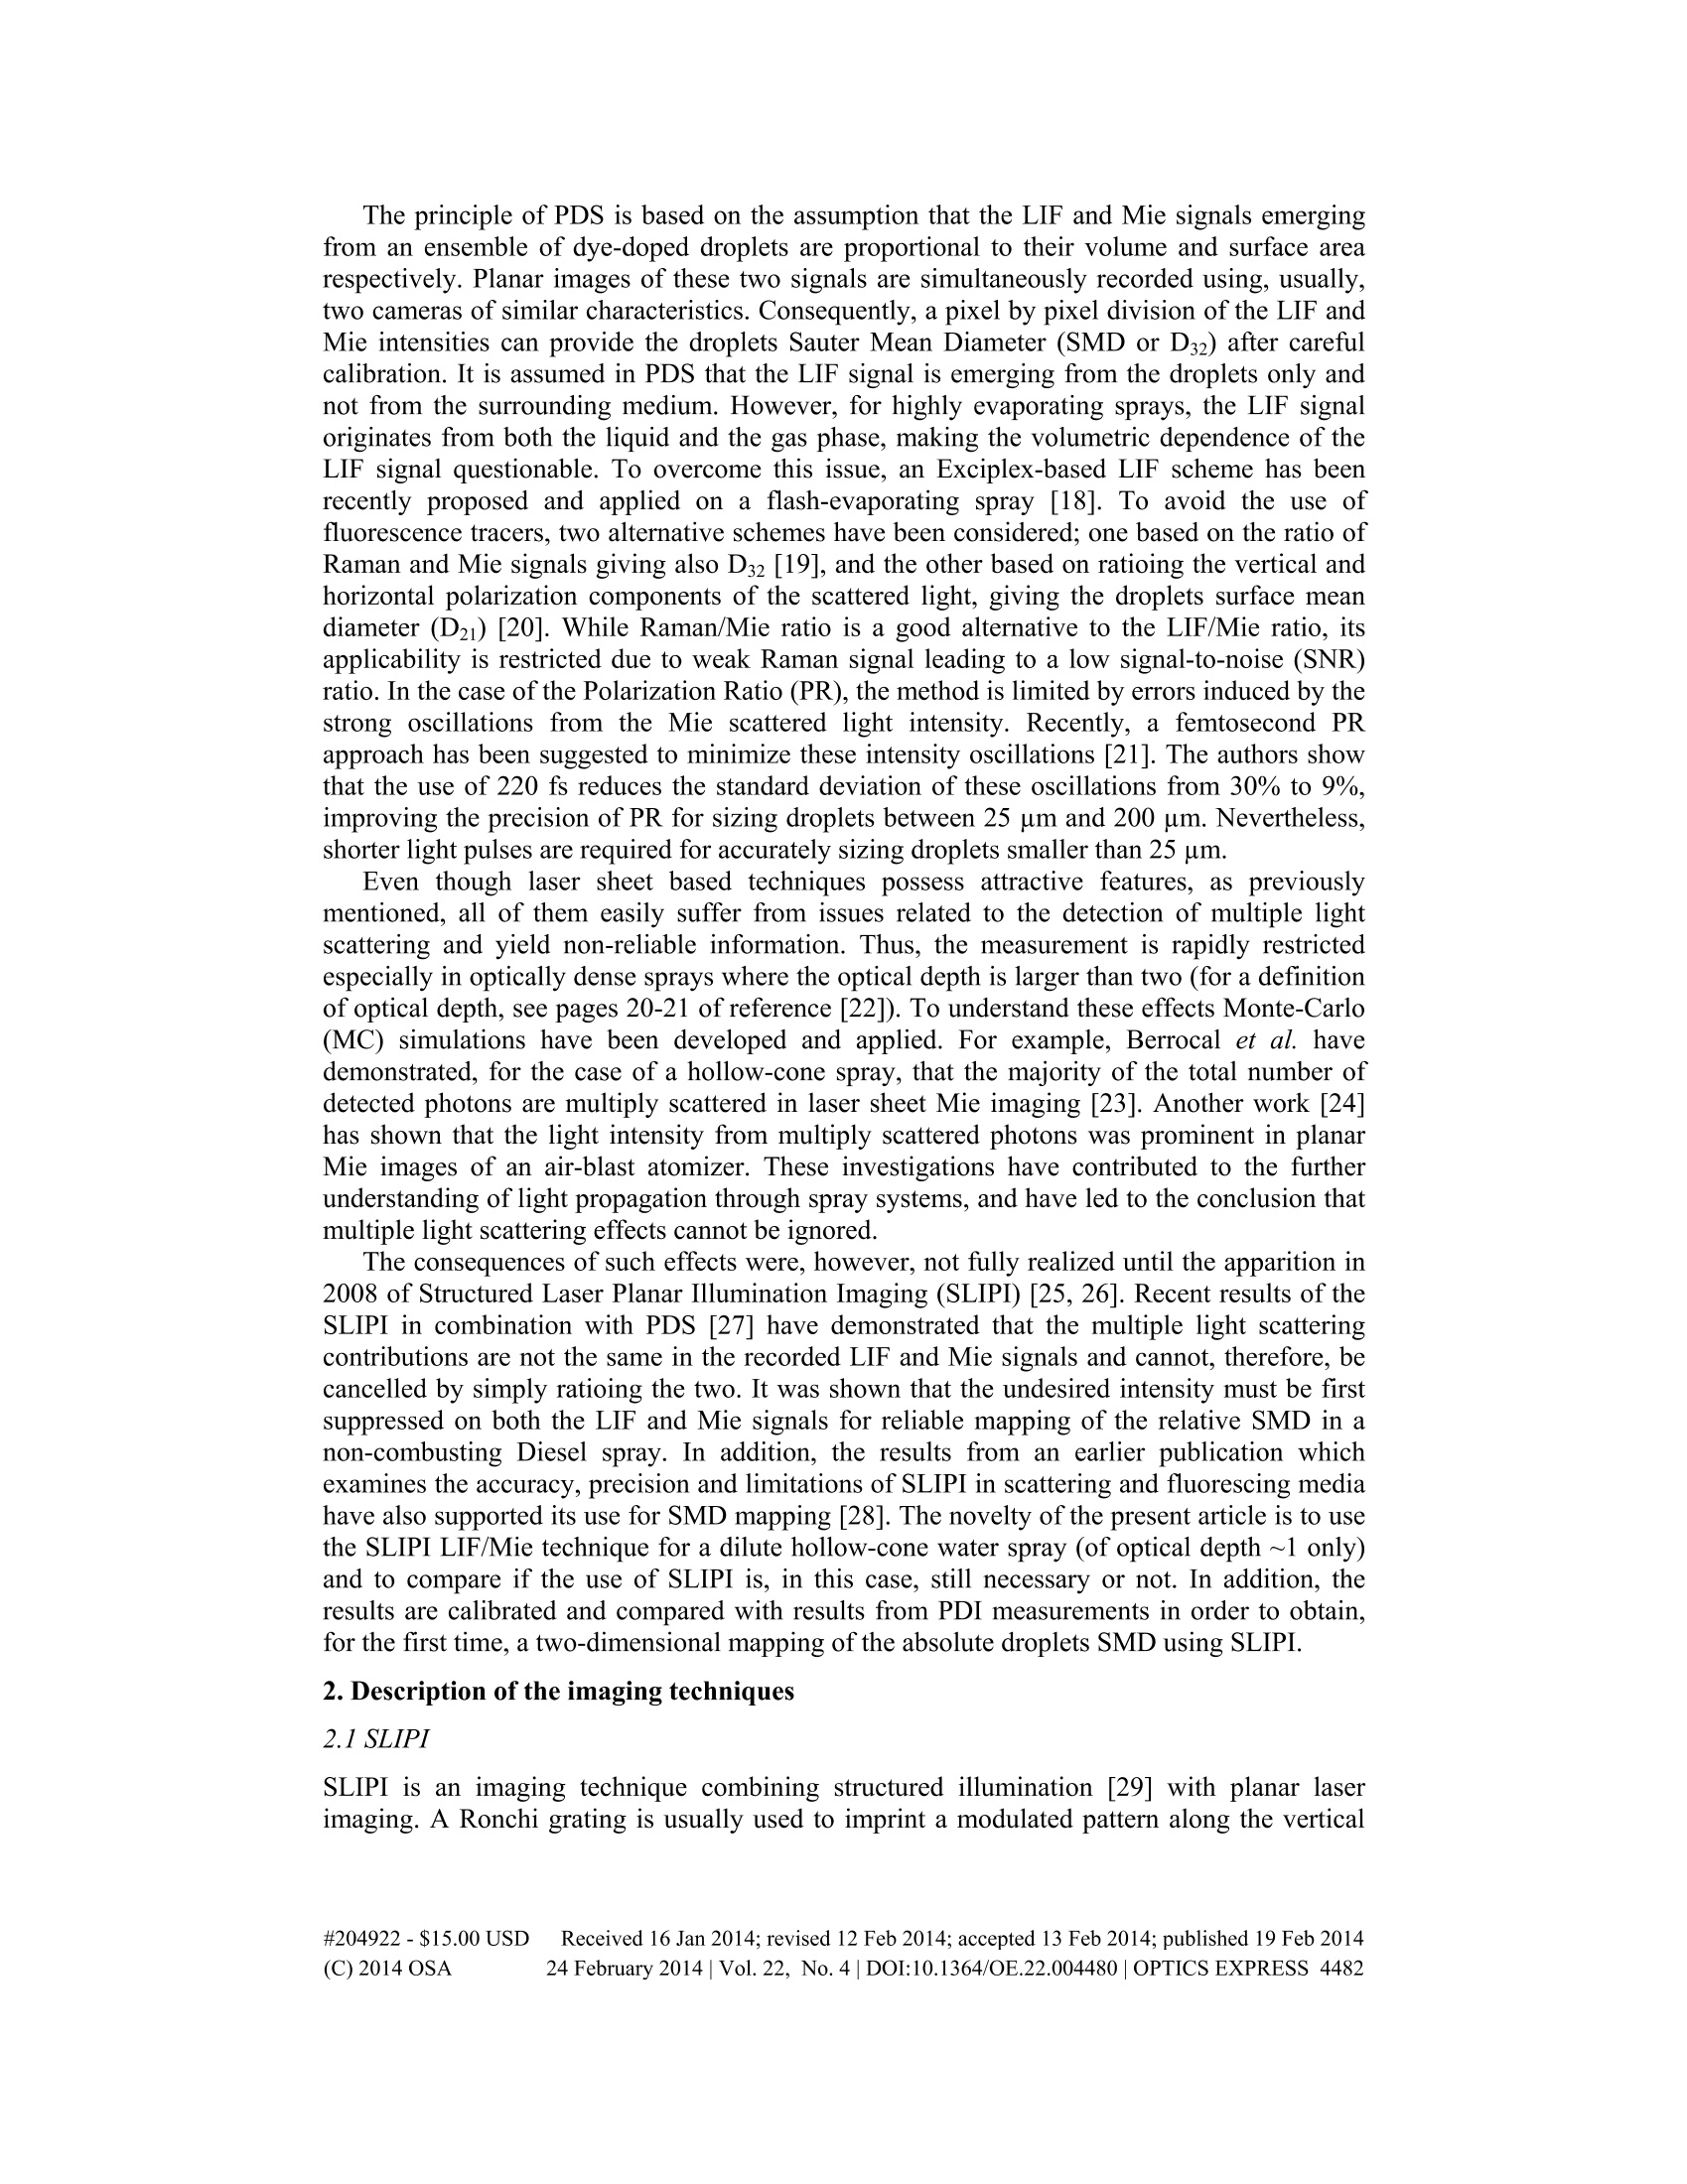
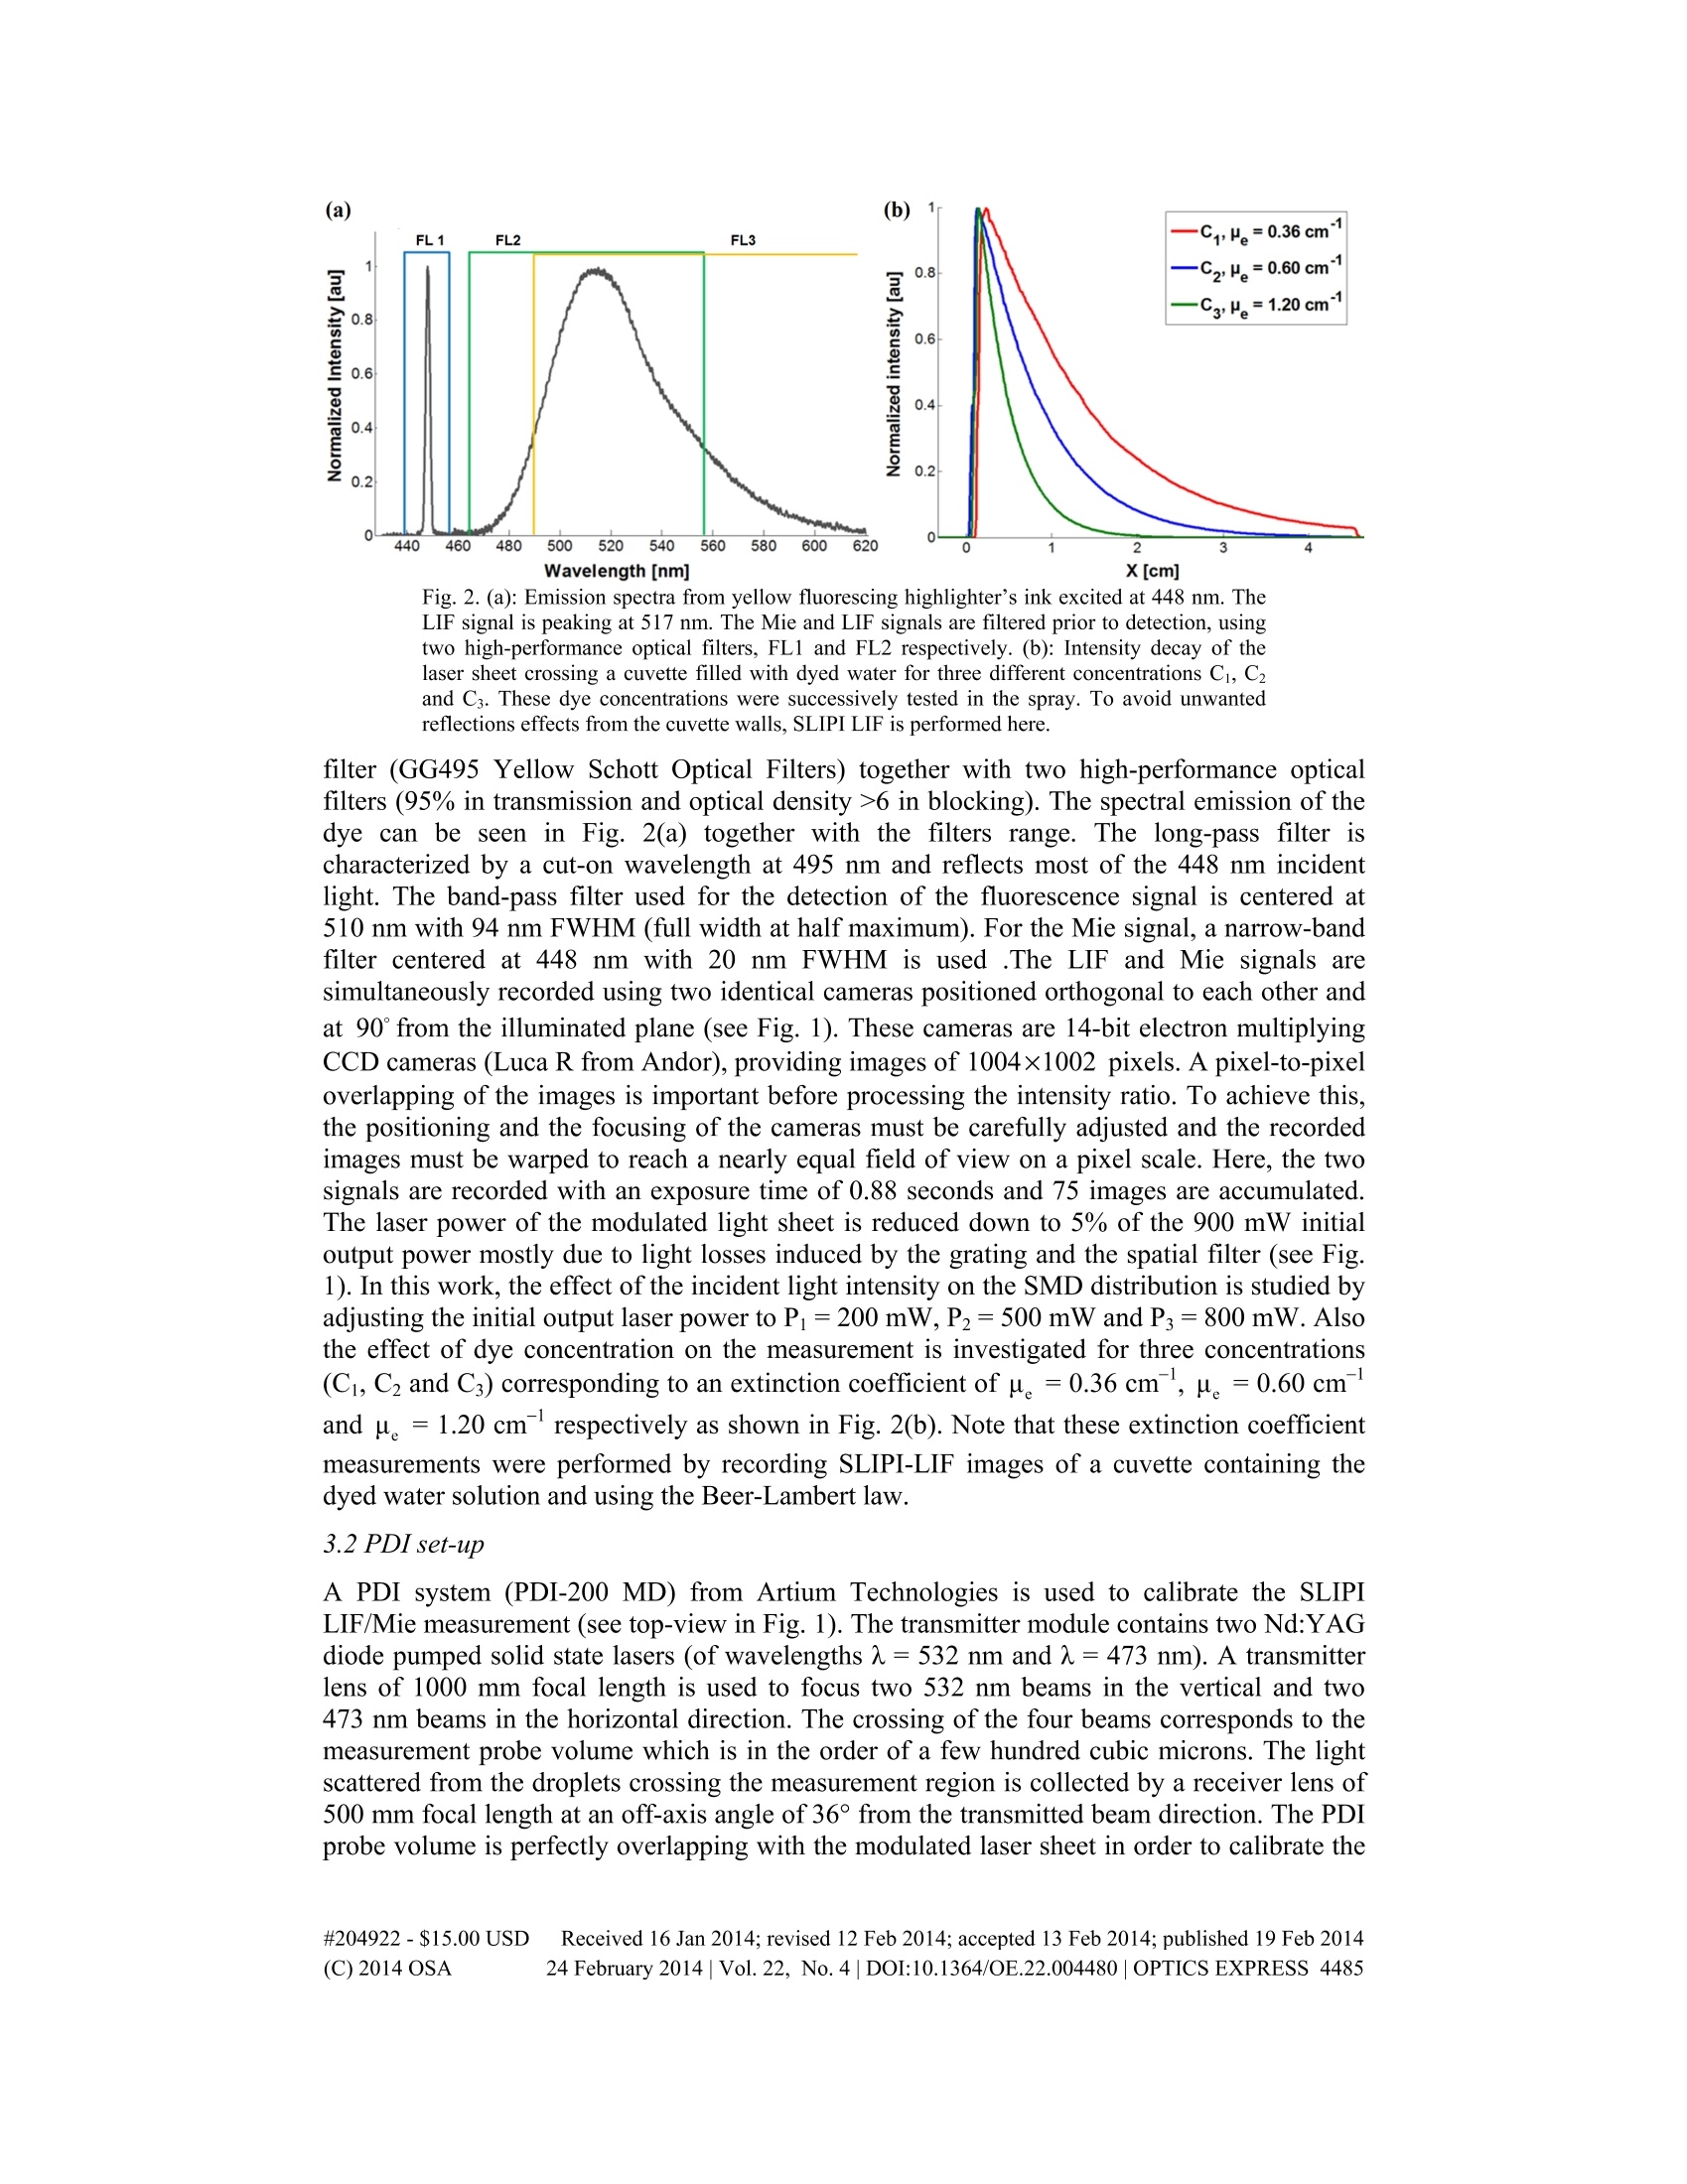
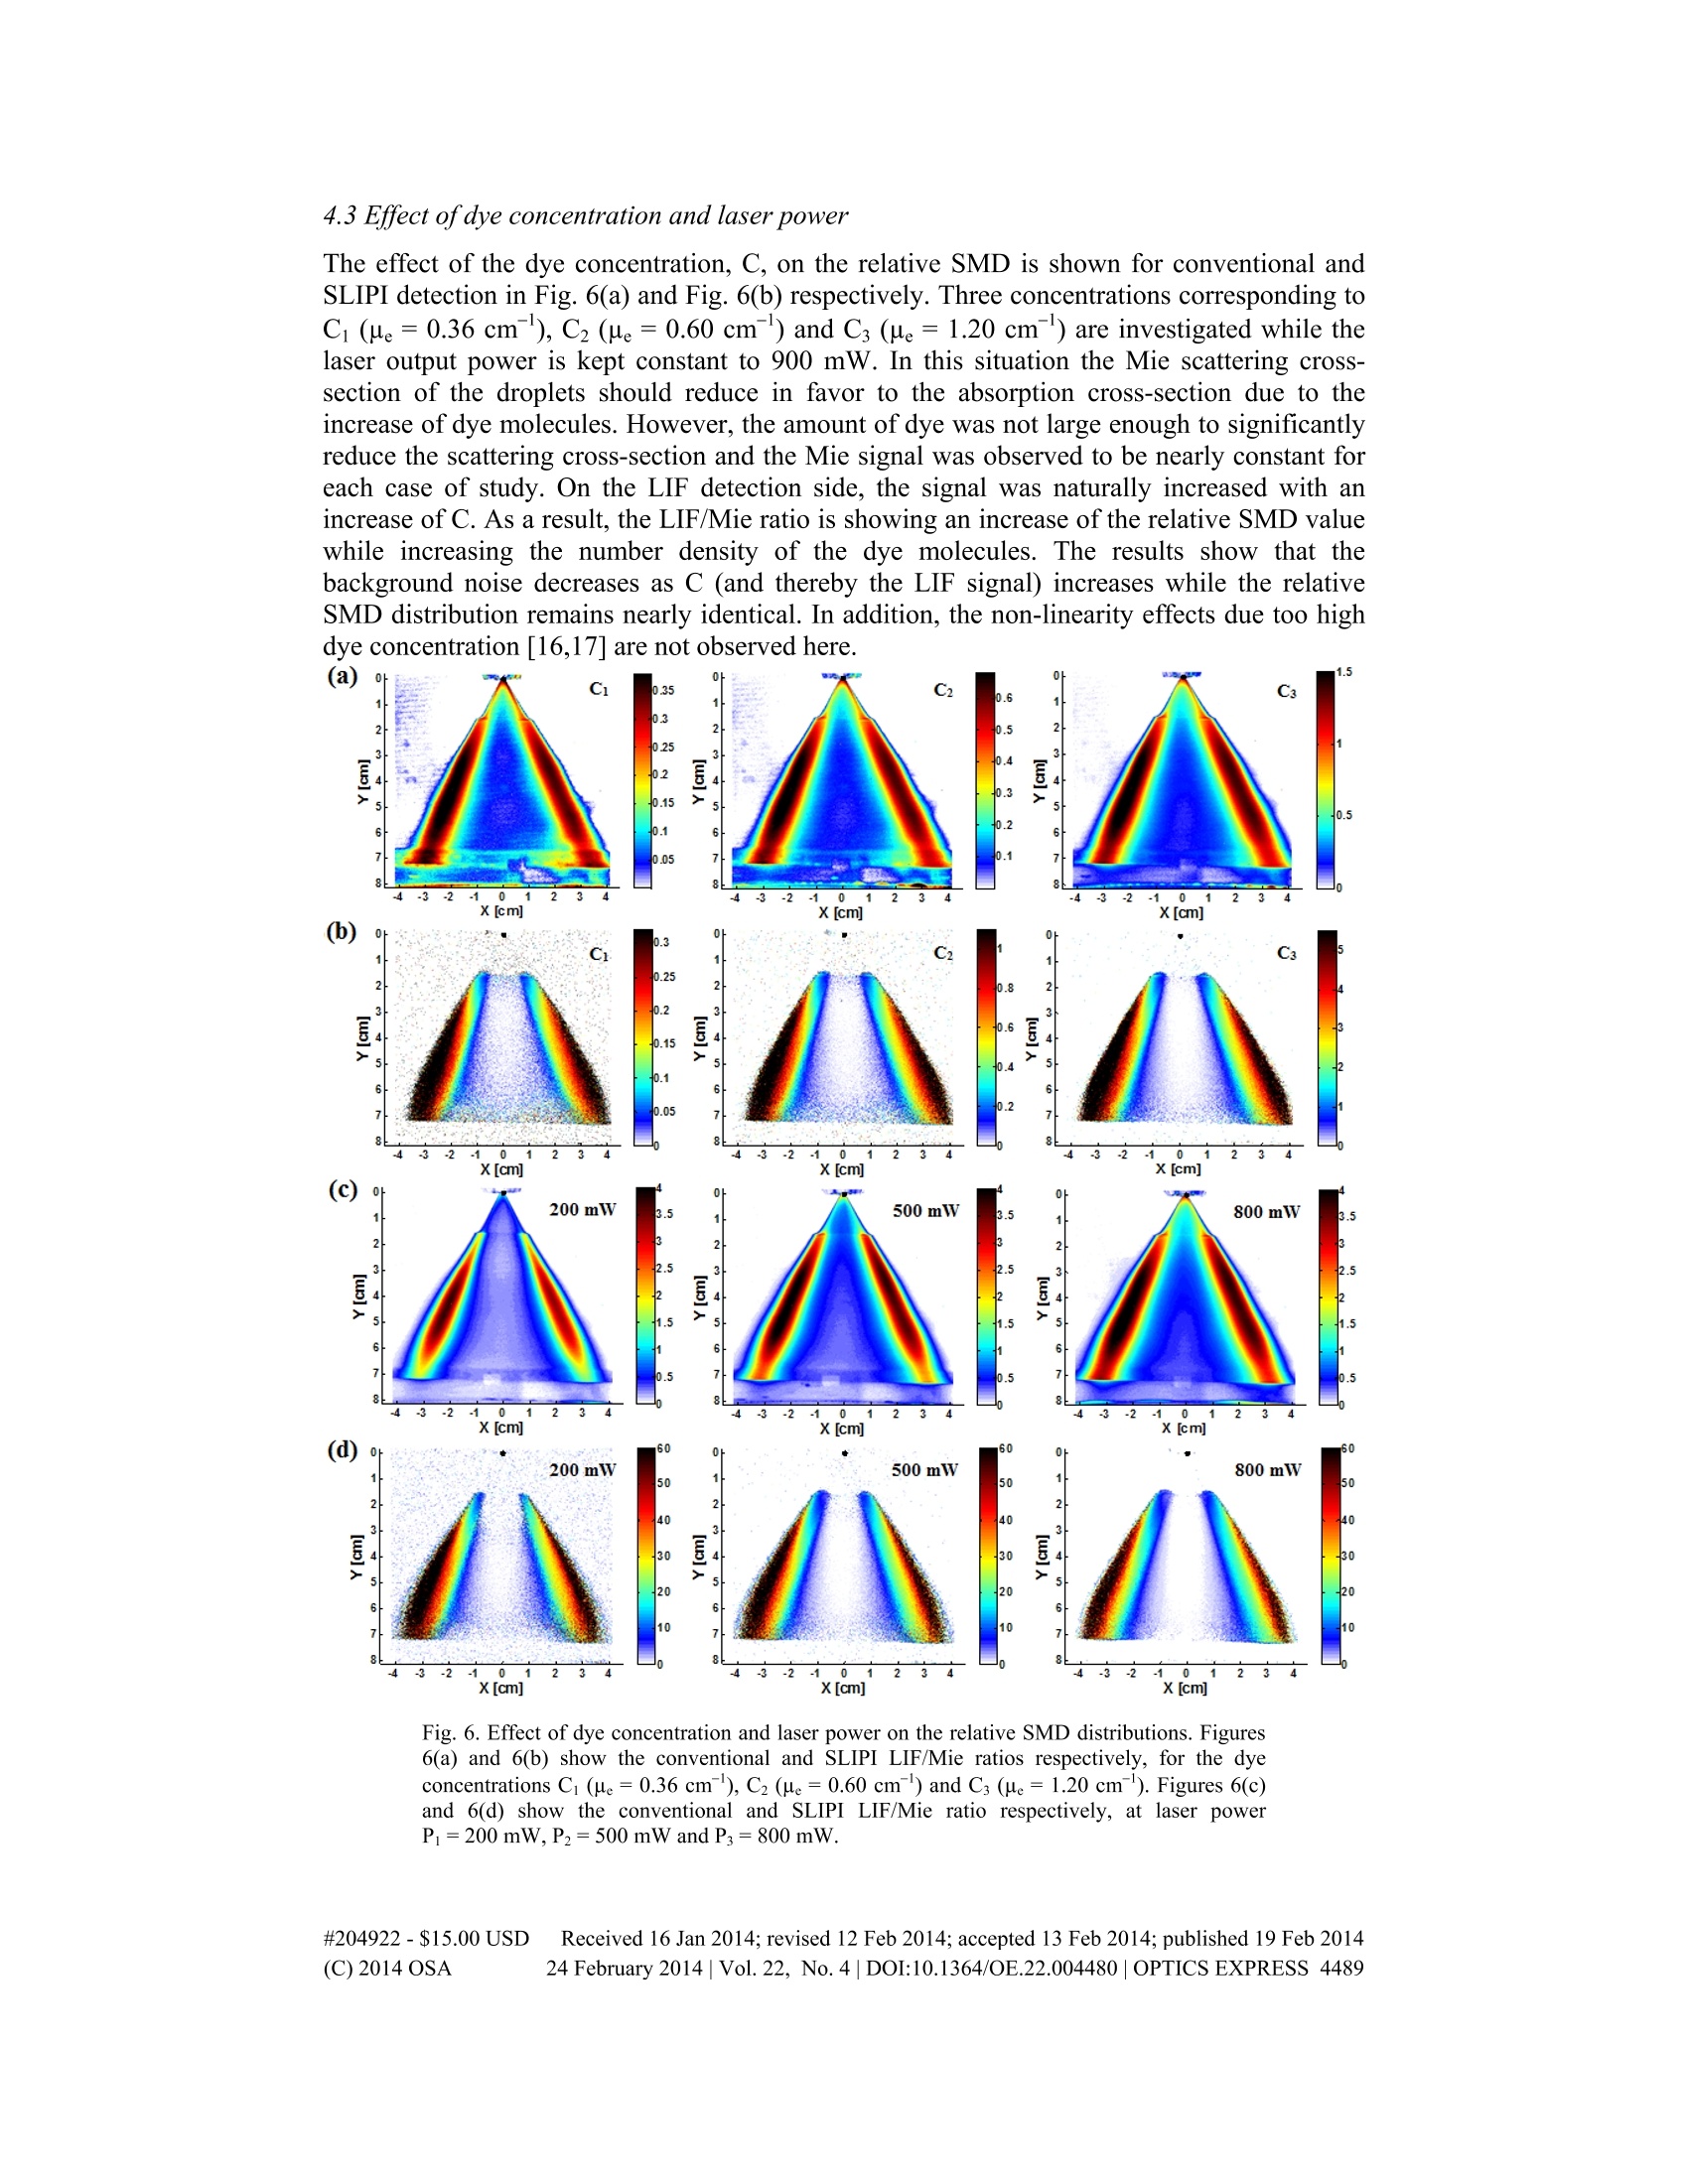
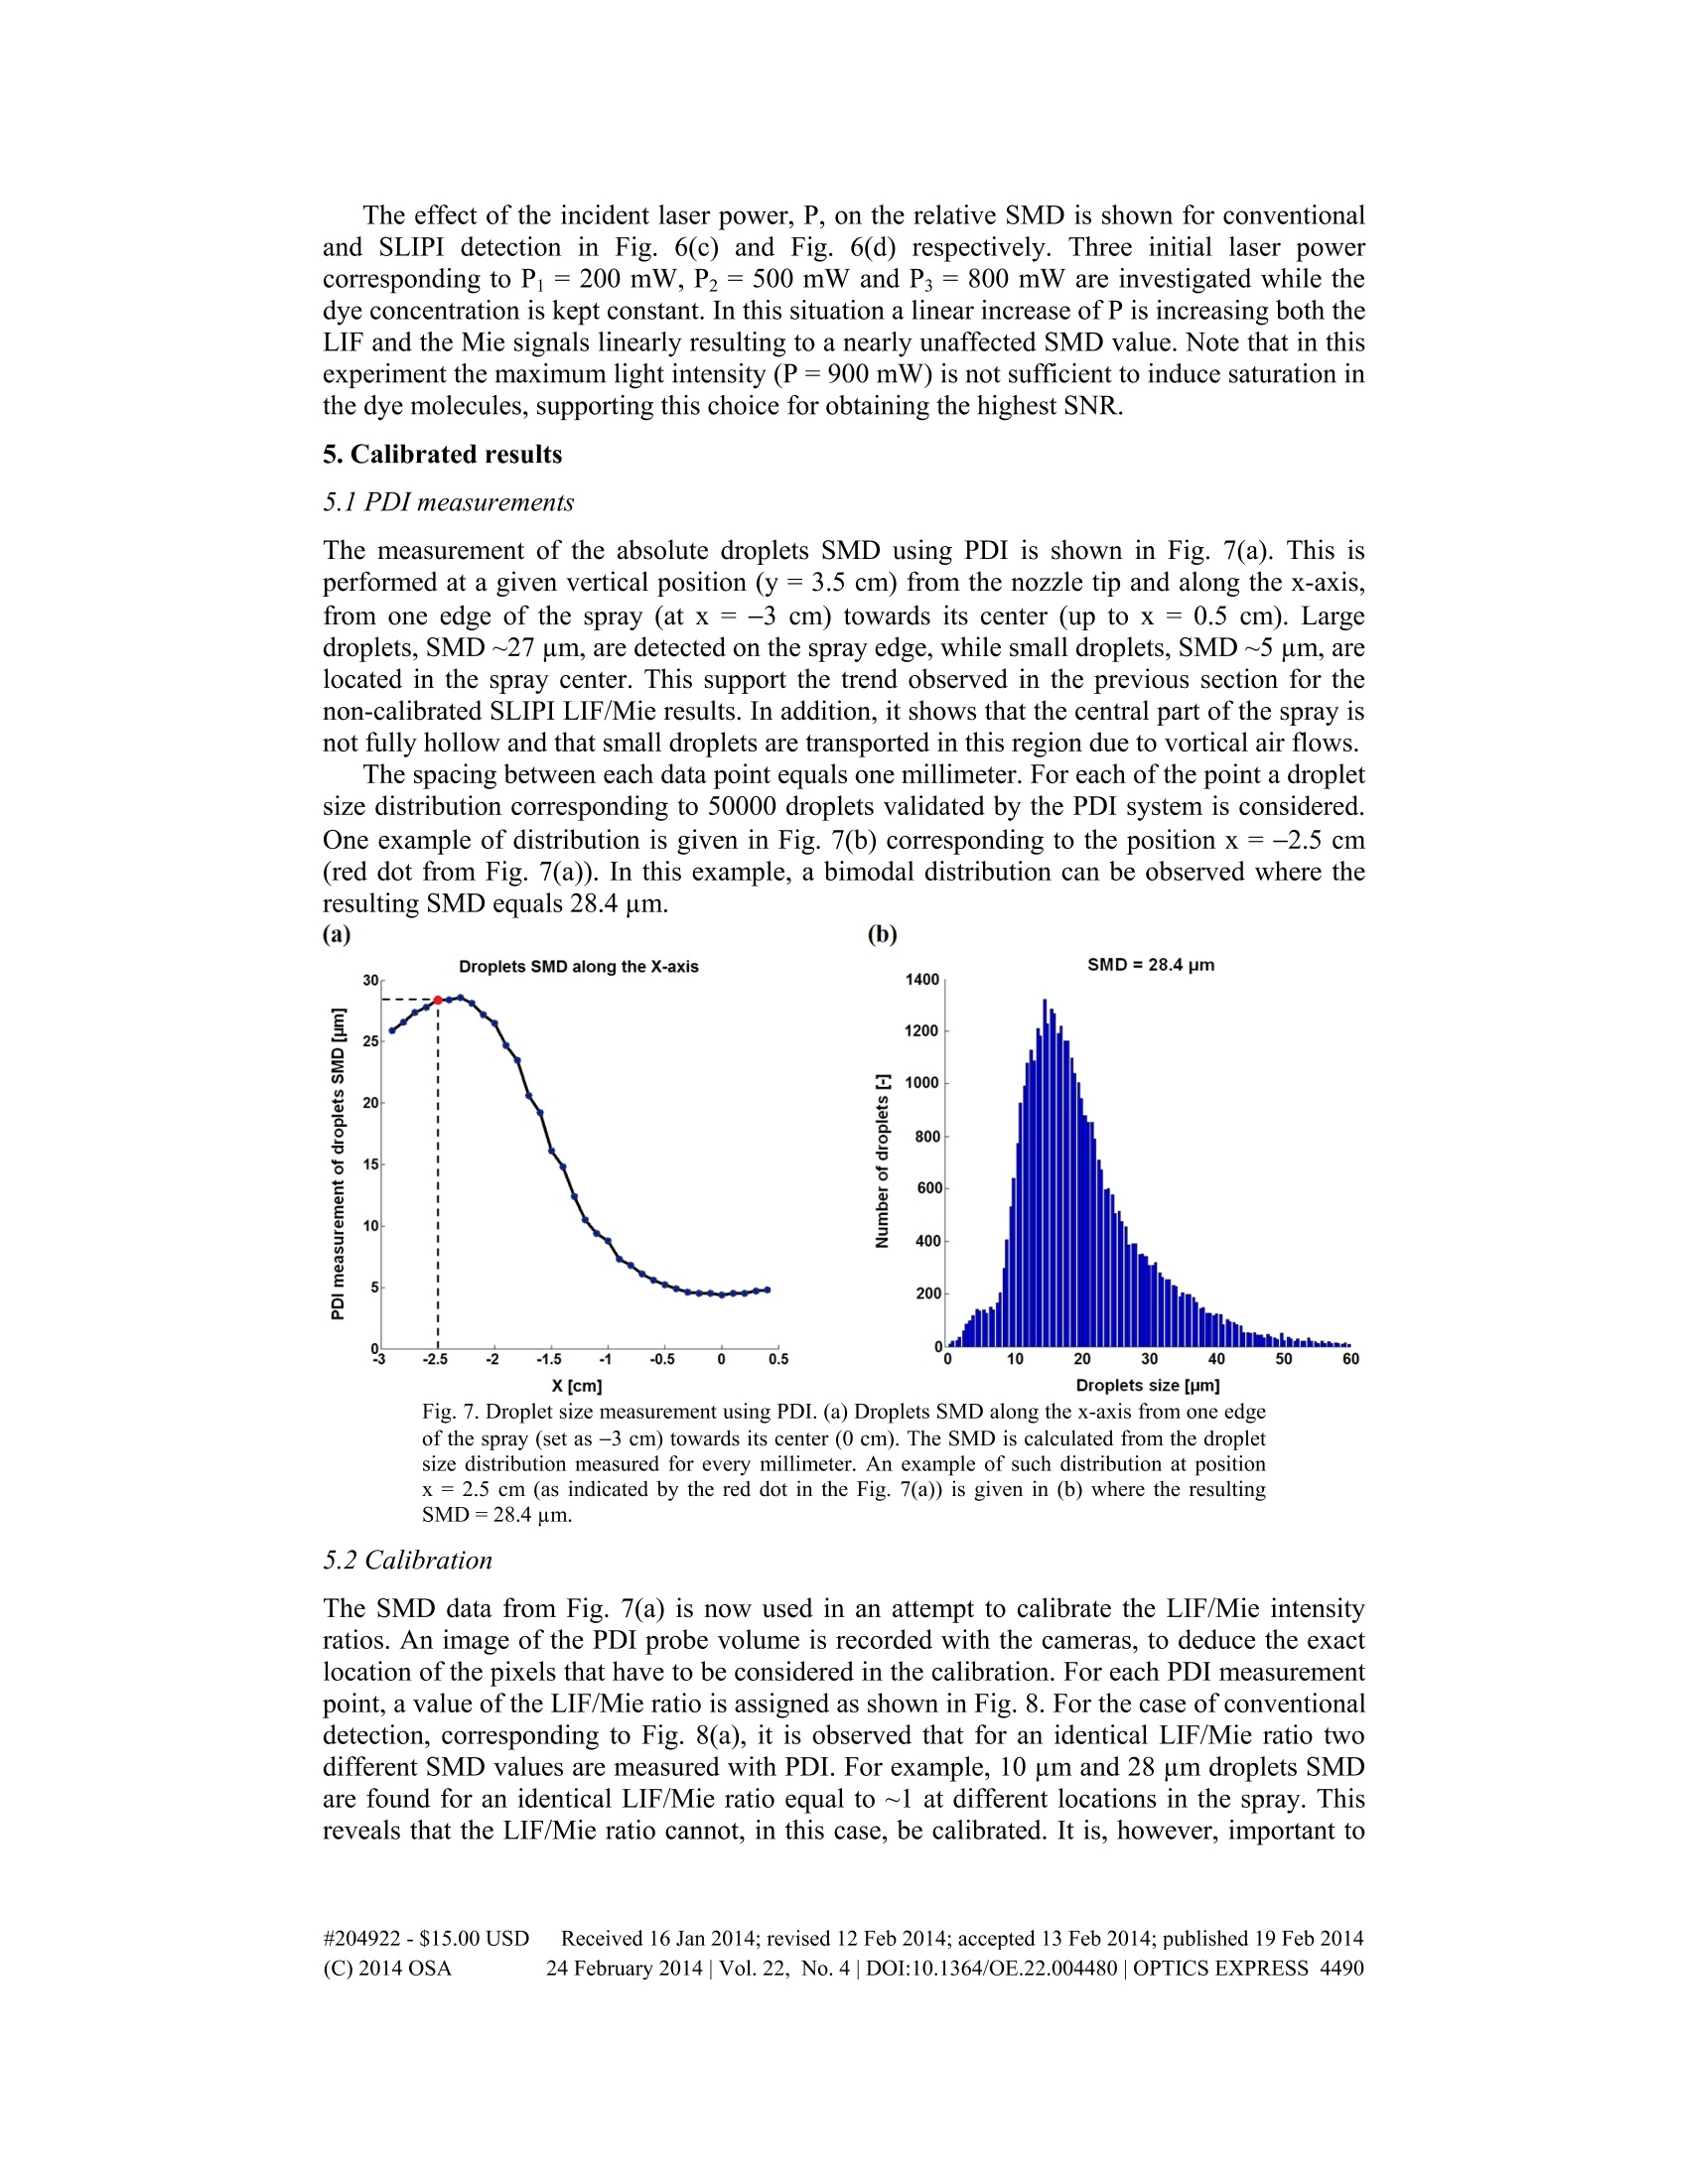
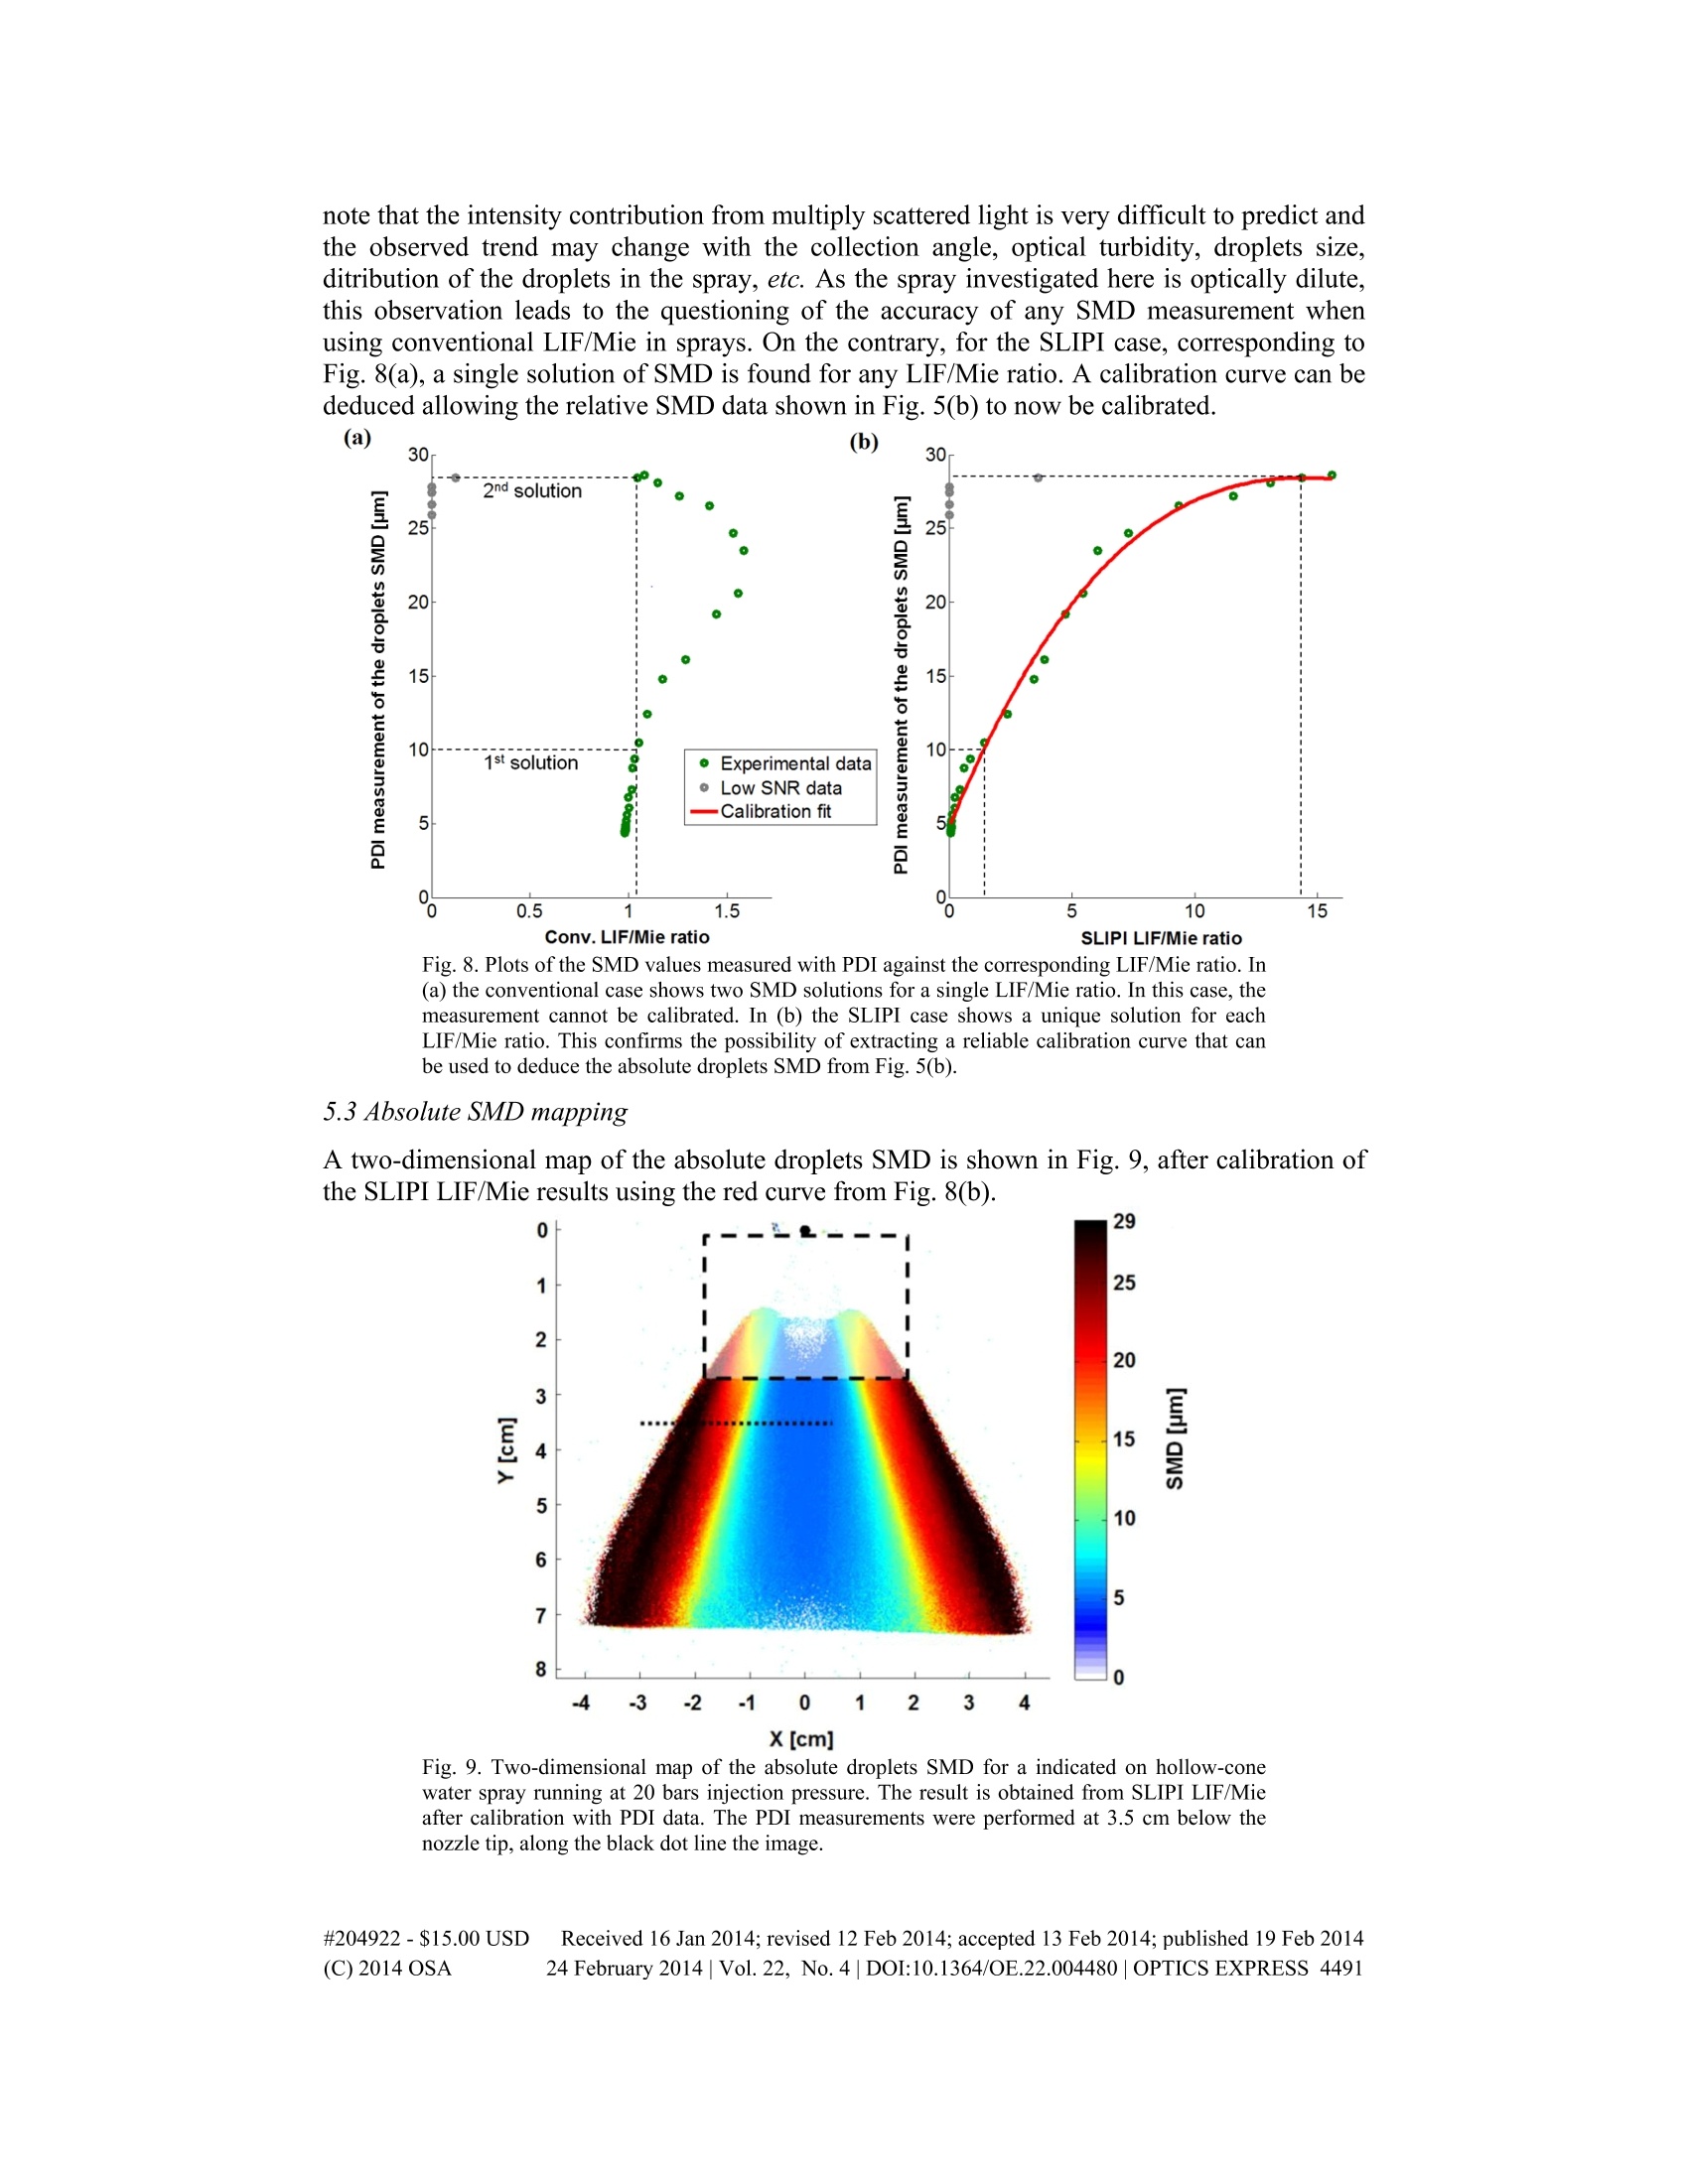
ResearchGateSee discussions,stats, and author profiles for this publication at: https://www.researchgate.net/publication/261068949 Reliable LIF/Mie droplet sizing in sprays usingstructured laser illumination planar imaging Article in Optics Express· February 2014 DOI: 10.1364/OE.22.004480· Source: PubMed READS CITATIONS16 113 3 authors: Yogeshwar Nath MishraLund Universitv Elias KristenssonLund University 17 PUBLICATIONS 47 CITATIONS 48 PUBLICATIONS 409 CITATIONS SEE PROFILE SEE PROFILE Edouard Berrocal Lund University 69 PUBLICATIONS 643 CITATIONS SEE PROFILE Some of the authors of this publication are also working on these related projects: Project Spray research using laser diagnostics View project All content following this page was uploaded by Elias Kristensson on 27 March 2014. The user has requested enhancement of the downloaded file. Reliable LIF/Mie droplet sizing in sprays usingstructured laser illumination planar imaging Yogeshwar Nath Mishra, Elias Kristensson, and Edouard Berrocal Division of Combustion Physics, Department of Physics, Lund University, Box 118, Lund 22100, Swedenedouard.berrocal@forbrflth.se Abstract: In this article, Structured Laser Illumination Planar Imaging(SLIPI) is used in combination with the LIF/Mie ratio technique forextracting a reliable two-dimensional mapping of the droplets Sauter MeanDiameter (SMD). We show that even for the case of a fairly dilute spray,where single scattering events are in majority, the conventional LIF/Mietechnique still remains largely affected by errors introduced by multiplelight scattering. To remove this unwanted light intensity on both the LIFand Mie images SLIPI is used prior to apply the image ratio. For the firsttime, the SLIPI LIF/Mie results are calibratedl and compared withmeasurement data from Phase Doppler Interferometry (PDI). C 2014Optical Society of America OCIS codes: (110.0113) Imaging through turbid media; (300.2530) Fluorescence, laser-induced;(290.5850) Scattering, particles; (290.4210) Multiple scattering. References and links 1N. Chigier,“An assessment of spray technology-editorial,” Atomization Sprays 3(4), 365-371 (1993).2 W. D. Bachalo and M. J. Houser, “Phase Doppler spray analyzer for simultaneous measurements of drop sizeand velocity distributions,"Opt. Eng.23(5),583-590 (1984). 3. N. Roth, K. Anders, and A. Frohn,“Simultaneous measurement of temperature and size of droplets in themicrometer range,"J. Laser Appl.2(1),37-42(1990). 4. R. A. Dobbins, L. Crocco,and I. Glassmans,“Measurement of mean particle sizes of sprays from diffractivelyscattered light,"AIAA J.1(8),1882-1886 (1963). 5. J. T. Kashdan,J. S. Shrimpton, and A. Whybrew, “A digital image analysis technique for quantitativecharacterisation of high-speed sprays,”Opt. Lasers Eng. 45(1), 106-115 (2007). 6. T. Shoba, C. Crua, M. Heikal, and M. Gold, “Optical characterisation of diesel, RME and kerosene sprays bymicroscopic imaging,"in 24th European Conference on Liquid Atomization and Spray Systems (ILASS)(Portugal,2011). ( 7. C. N . Yeh, H . Kosaka,a n d T. Kamimoto,“A fluorescence/scattering imaging technique for instantaneous 2-Dmeasurements of particle size distribution in a transient spray,”in P roceedings of the 3rd Congress on OpticalParticle Sizing (Japan , 1993), pp. 355-361. ) ( 8. T . Kamimoto,“Diagnostics of transient sprays by means of laser sheet techniques,” in International Symposium COMODIA 94, pp. 33-41(1994). ) ( 9. S . V. Sankar, K. E . Maher, D. M. Robart, and W. D. Bachalo,“Rapid characterization of fuel atomizers us i ng anoptical patternato r ,”J.Eng. Gas Turbines Power 121(3), 409-414 (1999). ) ( 10. P. Le Gal, N. F a rrugia, and D. A. Greenhalgh, “Laser sheet d ropsizing of dense s prays,"Opt. Laser T e chnol. 31(1),75-83(1999). ) ( 11 . R. Domann and Y. Hardalupas,“Quantitative measurement of planar droplet sauter mean diameter in s p raysusing Planar droplet sizing,”Part. Part. Syst. Charact. 20(3), 209-218(2003). ) ( 12. M . C. Jermy and D. A. Gr e enhalgh,“Pla n ar dropsizing by elastic and fluorescence scattering in sprays too densefor phase Doppler measurement,” Appl. Phys. B 71(5), 703-710(2000). ) ( 13. B. D . Stojkovic and V . Sick,“Evolution and impingement of an automotive fuel spray investigated withsimultaneous Mie/LIF techniques,”Appl. P h ys. B 73(1), 75-83 (2001). ) 14. S. Park, H. Cho, I. Yoon, and K. Min,“Measurement of droplet size distribution of gasoline direct injectionspray by droplet generator and planar image technique,"Meas. Sci. Technol. 13(6), 859-864(2002). 15. R. Domann and Y. Hardalupas, “A study of parameters that influence the accuracy of the planar droplet sizing(PDS) technique,"Part. Part. Syst. Charact. 18(1),3-11(2001). 16. G. Charalampous and Y. Hardalupas,“Numerical evaluation of droplet sizing based on the ratio of fluorescentand scattered light intensities (LIF/Mie technique),”Appl. Opt. 50(9), 1197-1209(2011). ( #204922-$15.00 USD Received 16 Jan 2 014; r evised 12 Feb 2014; accepted 1 3 Feb 2 014; p ublished 1 9 Feb 2014 (C) 2014OSA 24 February 2014| Vol.2 2 , No .4 DOI:10.1364/OE.22.00448 0 |OPTICS EXPRESS 4480 ) 17. G. Charalampous and Y. Hardalupas,“Method to reduce errors of droplet sizing based on the ratio of fluorescentand scattered light intensities (laser-induced fluorescence/Mie technique),”Appl. Opt. 50(20),3622-3637(2011). 18. W. Zeng, M. Xu, Y. Zhang,and Z. Wang,“Laser sheet dropsizing of evaporating sprays using simultaneousLIEF/Mie techniques,”Proc. Combust. Inst. 34(1), 1677-1685 (2013). 19. A. Malarski, B. Schuirer, I. Schmitz, L. Zigan, A. Fliigel, and A. Leipertz,“Laser sheet dropsizing based on two-dimensional Raman and Mie scattering,"Appl.Opt. 48(10),1853-1860 (2009). 20. D. L. Hofeldt, “Full-field measurements of particle size distributions. II: Experimental comparison of thepolarization ratio and scattered intensity methods,”Appl. Opt. 32(36), 7559-7567(1993). 21. S. Bareiss, B. Bork, S. Bakic,C. Tropea, R. Irsig, J. Tiggesbaumker, and A. Dreizler,“Application offemtosecond lasers to the polarization ratio technique for droplet sizing,"Meas. Sci. Technol. 24(2),025203(2013). 22.E. Kristensson, Structured Laser Illumination Planar Imaging: Applications for spray diagnostics (Ph.D. Thesis,Lund University,2012). ( 23. E . B errocal,I. Meglinski, and M. Jermy,“New model for l ight propagation in highly inhomogeneous ) polydisperse turbid media with applications in spray diagnostics,"Opt. Express 13(23), 9181-9195 (2005). 24. D. Stepowski, O. Werquin, C. Roze, and T. Girasole,“Account for extinction and multiple scattering in planardroplet sizing of dense sprays,” in 13th International Symposium ofLaser Techniques to Fluids Mechanics(Lisbon, 2006), paper 1061. 25. E. Berrocal, E. Kristensson,M. Richter, M. Linne, and M. Alden,“Application of structured illumination formultiple scattering suppression in planar laser imaging of dense sprays,”Opt. Express 16(22),17870-17881(2008). 26. E. Kristensson, E. Berrocal, M. Richter, and M. Alden, “Nanosecond structured laser illumination planar imagingfor single-shot imaging of dense sprays," Atomization Sprays 20(4), 337-343 (2010). 27. E. Berrocal, E. Kristensson, P. Hottenbach, M. Alden, and G.Grunefeld,“Quantitative imaging of a non-combusting Diesel spray using structured laser illumination planar imaging,” Appl. Phys. B 109(4), 683-694(2012). 28. E. Kristensson, L. Araneo, E. Berrocal, J. Manin, M. Richter, M. Alden, and M. Linne, “Analysis of multiplescattering suppression using structured laser illumination planar imaging in scattering and fluorescing media,”Opt. Express 19(14), 13647-13663 (2011). 29. M. A. A. Neil, R. Juskaitis, and T. Wilson,“Method of obtaining optical sectioning by using structured light in aconventional microscope,”Opt. Lett. 22(24), 1905-1907 (1997). 30. D.J. Cuccia, F. Bevilacqua, A. J. Durkin, and B. J. Tromberg,“Modulated imaging: quantitative analysis andtomography of turbid media in the spatial-frequency domain,”Opt. Lett. 30(11), 1354-1356 (2005). 1.Introduction Droplet size is one of the most important quantities of spray characteristics. The suitability ofatomizing sprays for a variety of applications depends on the droplet size distribution over thefull spray structure. For example, in medicine monodisperse droplets smaller than 5 um areused for inhalation while polydisperse fuel droplets in the range of 5-20 um are generated forcombustion engineering purposes [1]. Industrial sprays require also a specific droplet sizerange depending on the needed process such as, cooling, painting, drying, applying chemical,dispersing liquids etc. It is therefore important to accurately measure droplet size distributionin sprays, preferably with both high spatial and temporal resolution. In comparison to other existing techniques, the use of laser sheet imaging for dropletsizing is particularly advantageous: First, it is not a point measurement technique like PhaseDoppler Interferometry (PDI) [2] or rainbow refractometry [3], second, it is not a line-of-sightapproach like laser diffraction [4] or shadow imaging [5] and third, it is not restricted to asmall field-of-view like high resolution microscopic imaging [6]. Laser sheet droplet sizing isthus very attractive because of its ability to directly provide a full-field measurement of aspray section. In the year 1993, the laser sheet based LIF/Mie ratio approach was firstproposed for the characterization of a transient fuel spray [7]. Since then, the technique hasbeen applied for a wide range of sprays such as in Diesel sprays in rapid compression engines[7,8], steady hollow-cone sprays for applications in gas-turbines or industrial burners [9-11],dense cooling sprays [12] and gasoline fuel injection systems [13,14]. In addition, somefundamental studies have been performed to evaluate the accuracy of the technique and itslimitations [15-17]. In each of these articles, independent names of the LIF/Mie ratiotechnique have been given such as optical patternator [9], Laser Sheet Drop-sizing (LSD) [10]or Planar Droplet Sizing (PDS) [11]. In this paper we will refer to it as PDS. ( #204922-$15.00 USD Received 16 Jan 2 014; r evised 12 Feb 2014; accepted 1 3 Feb 2 014; p ublished 1 9 Feb 2014 (C)2014 OSA 24 February 2014| Vol.2 2 , No. 4 |DOI:10.1364/OE.22.0044 8 0|OPTICS EXPRESS 4481 ) The principle of PDS is based on the assumption that the LIF and Mie signals emergingfrom an ensemble of dye-doped droplets are proportional to their volume and surface arearespectively. Planar images of these two signals are simultaneously recorded using, usually,two cameras of similar characteristics. Consequently, a pixel by pixel division of the LIF andMie intensities can provide the droplets Sauter Mean Diameter (SMD or D32) after carefulcalibration. It is assumed in PDS that the LIF signal is emerging from the droplets only andnot from the surrounding medium. However, for highly evaporating sprays, the LIF signaloriginates from both the liquid and the gas phase, making the volumetric dependence of theLIF signal questionable. To overcome this issue, an Exciplex-based LIF scheme has beenrecently proposed and applied on a flash-evaporating spray [18]. To avoid the use offluorescence tracers, two alternative schemes have been considered; one based on the ratio ofRaman and Mie signals giving also D32 [19], and the other based on ratioing the vertical andhorizontal polarization components of the scattered light, giving the droplets surface meandiameter (Dzi) [20]. While Raman/Mie ratio is a good alternative to the LIF/Mie ratio, itsapplicability is restricted due to weak Raman signal leading to a low signal-to-noise (SNR)ratio. In the case of the Polarization Ratio (PR), the method is limited by errors induced by thestrong oscillations from the Mie scattered light intensity. Recently, a femtosecond PRapproach has been suggested to minimize these intensity oscillations [21]. The authors showthat the use of 220 fs reduces the standard deviation of these oscillations from 30% to 9%,improving the precision of PR for sizing droplets between 25 um and 200 um. Nevertheless,shorter light pulses are required for accurately sizing droplets smaller than 25 um. Even though laser sheet based techniques possess attractive features, as previouslymentioned, all of them easily suffer from issues related to the detection of multiple lightscattering and yield non-reliable information. Thus, the measurement is rapidly restrictedespecially in optically dense sprays where the optical depth is larger than two (for a definitionof optical depth, see pages 20-21 of reference [22]). To understand these effects Monte-Carlo(MC) simulations have been developed and applied. For example, Berrocal et al. havedemonstrated, for the case of a hollow-cone spray, that the majority of the total number ofdetected photons are multiply scattered in laser sheet Mie imaging [23]. Another work [24]has shown that the light intensity from multiply scattered photons was prominent in planarMie images of an air-blast atomizer. These investigations have contributed to the furtherunderstanding of light propagation through spray systems, and have led to the conclusion thatmultiple light scattering effects cannot be ignored. The consequences of such effects were, however, not fully realized until the apparition in2008 of Structured Laser Planar Illumination Imaging (SLIPI) [25, 26]. Recent results of theSLIPI in combination with PDS [27] have demonstrated that the multiple light scatteringcontributions are not the same in the recorded LIF and Mie signals and cannot, therefore, becancelled by simply ratioing the two. It was shown that the undesired intensity must be firstsuppressed on both the LIF and Mie signals for reliable mapping of the relative SMD in anon-combusting Diesel spray. In addition, the results from an earlier publication whichexamines the accuracy, precision and limitations of SLIPI in scattering and fluorescing mediahave also supported its use for SMD mapping [28]. The novelty of the present article is to usethe SLIPI LIF/Mie technique for a dilute hollow-cone water spray (of optical depth~1 only)and to compare if the use of SLIPI is, in this case, still necessary or not. In addition, theresults are calibrated and compared with results from PDI measurements in order to obtain,for the first time, a two-dimensional mapping of the absolute droplets SMD using SLIPI. 2. Description of the imaging techniques 2.1 SLIPI SLIPI is an imaging technique combining structured illumination [29] with planar laserimaging. A Ronchi grating is usually used to imprint a modulated pattern along the vertical ( #204922-$15.00 USD Received 16 Jan 2 014; r evised 12 Feb 2014; accepted 1 3 Feb 2 014; p ublished 1 9 Feb 2014 (C) 2014 OSA 24 February 2014| Vol.2 2 , No .4 |DOI:10.1364/OE.22.0044 8 0|OPTICS EXPRESS 4482 ) direction of the light sheet. This special characteristic serves as a signature to tag the singlyscattered photons from the illuminated plane. While those photons do “remember” themodulated signature, the multiply scattered photons will “forget”it rapidly while crossing ascattering medium like a spray system. Thus, the undisturbed modulated component, referredin the literature to as the AC component [30], becomes a faithful representation of the singlelight scattering. On the opposite, the contribution of the multiple light scattering mostlycontains a non-modulated signature. The extraction of the single light scattering consists,then, in measuring the amplitude of the modulation. Due to the inhomogeneous nature of aspray system, this operation must be performed without deteriorating the spatial resolution ofthe image. If the light intensity structure imprinted on the light sheet is a sinusoidal, theresulting image intensity I(x,y) is described as: where v represents the modulation frequency and dis the spatial phase. Here, Ic(x,y) is theintensity corresponding to singly and multiply scattered photons (DC component) andI (x,y) represents the amplitude of the modulation from the singly scattered photons only(AC component). To experimentally extract the information corresponding to I (x,y) inEq. (1), a minimum of three intensity modulated images are recorded with a spatial phasecorresponding to 0°,120°, and 240°. With this recorded data, a SLIPI image can beconstructed by extracting the root-mean square of the modulated images, describedmathematically as: Similarly, a conventional image preserving both the multiply and singly scattered photons canbe constructed by extracting the average of the three modulated images as: A complete and detailed description of the SLIPI technique can be found in Ref [22]. 2.2 LIF/Mie droplet sizing The SMD of spray droplets can be measured from the ratio of a signal proportional to thedroplet volume, such as the fluorescence from the liquid phase, SLIF, and a signal proportionalto droplets surface area, such as the Mie scattered light, SMie. In addition, three conditions arerequired for the PDS technique to work: First, the spray droplets must be spherical. Second,the spray evaporation rate must be sufficiently slow to avoid fluorescence from the gas phase.Third, all photons reaching the camera should have experienced only one scattering eventprior to detection. If those conditions are respected, the SMD of an ensemble of droplets, foreach camera pixel, is equal to: 0 where KLF and KMie includes experimental components such as detector response, signalcollection angle, laser power and dye concentration. There have been several experimentaland theoretical studies [11, 15-17] focusing on the accuracy of the PDS technique. It wasfound that the ratio of KLr/KMie should not be considered as a constant, especially at ( #204922-$15.00 USD Received 16 Jan 2 014; r evised 12 Feb 2014; accepted 1 3 Feb 2 014; p ublished 1 9 Feb 2014 (C) 2014 OSA 24 February 2014 | Vol.2 2 , No.4|DOI:10.1364/OE.22.004480 | OPTICS EXPRESS 4483 ) 90° detection angle [16] as it has been assumed in earlier articles [7-10]. The real refractiveindex, scattering angle and dye concentration are parameters that strongly affect therelationship between scattered light intensity and droplets surface area. It is shown in [16] thatthe oscillations of the scattered light intensity are particularly large around 90°detectionangle, while at 60°, the increase of the scattered light intensity in relation with the dropletdiameter is smooth. The effect of multiple light scattering on PDS measurements has beendemonstrated in [27] both for the case of a cuvette containing a homogeneous dispersion ofpolystyrene spheres and for a diesel spray at late time after injection start (between 2 ms and3 ms). The results concluded that even a measure of the relative SMD (non-calibratedLIF/Mie ratio) were not acceptable if SLIPI was not used. 3. Description of the experiment 3.1 SLIPI LIF/Mie set-up A steady state (continuously running) hollow-cone water spray of 60° spray angle is createdusing a pressure swirl nozzle of 1mm orifice diameter (Lechler, ordering no. 216.324). Thespray is investigated at room temperature and atmospheric pressure conditions. The injectionpressure is fixed at 20 bars producing a liquid flow rate of 1.26 liter/min. The injected water isseeded with a translucent fluorescing dye (Pyranine: Solvent green 7) from yellowhighlighter’s ink. The main reasons of choosing the yellow highlighter’s ink as tracer are thenon-toxicity and the high quantum efficiency of the dye when excited at a=448 nm. A topview schematic of the SLIPI setup used in this experiment is shown in Fig. 1. The center ofthe spray is illuminated (using a 448 nm collimated continuous wave diode laser) with avertically modulated laser sheet of 5.8 cm in height. The broad-band LIF signal is peaking at517 nm and the 448 nm narrow-band Mie signal are spectrally separated using a long pass Grating Fig.1. Top-view of the SLIPI-LIF/Mie optical arrangement, together with the PDI set-up. ( #204922-$15.00 USD Received 16 Jan 2 014; r evised 12 Feb 2014; accepted 1 3 Feb 2 014; p ublished 1 9 Feb 2014 (C) 2014 OSA 24 February 2014| Vol.22, No. 4 |DOI:10.1364/OE.22.00448 0 |OPTICS EXPRESS 4484 ) :X[cm] Fig. 2. (a): Emission spectra from yellow fluorescing highlighter’s ink excited at 448 nm. TheLIF signal is peaking at 517 nm. The Mie and LIF signals are filtered prior to detection,usingtwo high-performance optical filters, FL1 and FL2 respectively. (b): Intensity decay of thelaser sheet crossing a cuvette filled with dyed water for three different concentrations Ci, C2and C. These dye concentrations were successively tested in the spray. To avoid unwantedreflections effects from the cuvette walls, SLIPI LIF is performed here. filter (GG495 Yellow Schott Optical Filters) together with two high-performance opticalfilters (95% in transmission and optical density>6 in blocking). The spectral emission of thedye can be seen in Fig. 2(a) together with the filters range. The long-pass filter ischaracterized by a cut-on wavelength at 495 nm and reflects most of the 448 nm incidentlight. The band-pass filter used for the detection of the fluorescence signal is centered at510 nm with 94 nm FWHM (full width at half maximum). For the Mie signal, a narrow-bandfilter centered at 448 nm with 20 nm FWHM is used .The LIF and Mie signals aresimultaneously recorded using two identical cameras positioned orthogonal to each other andat 90° from the illuminated plane (see Fig. 1). These cameras are 14-bit electron multiplyingCCD cameras (Luca R from Andor), providing images of 1004×1002 pixels. A pixel-to-pixeloverlapping of the images is important before processing the intensity ratio. To achieve this,the positioning and the focusing of the cameras must be carefully adjusted and the recordedimages must be warped to reach a nearly equal field of view on a pixel scale.Here, the twosignals are recorded with an exposure time of 0.88 seconds and 75 images are accumulated.The laser power of the modulated light sheet is reduced down to 5% of the 900 mW initialoutput power mostly due to light losses induced by the grating and the spatial filter (see Fig.1). In this work, the effect of the incident light intensity on the SMD distribution is studied byadjusting the initial output laser power to Pi=200mW,P2=500 mW and P3=800 mW. Alsothe effect of dye concentration on the measurement is investigated for three concentrations(Ci, C2 and C) corresponding to an extinction coefficient of p=0.36 cm,u。=0.60cmand u=1.20 cm-' respectively as shown in Fig. 2(b). Note that these extinction coefficientmeasurements were performed by recording SLIPI-LIF images of a cuvette containing thedyed water solution and using the Beer-Lambert law. 3.2 PDI set-up A PDI system (PDI-200 MD) from Artium Technologies is used to calibrate the SLIPILIF/Mie measurement (see top-view in Fig. 1). The transmitter module contains two Nd:YAGdiode pumped solid state lasers (of wavelengths A=532 nm and )=473 nm). A transmitterlens of 1000 mm focal length is used to focus two 532 nm beams in the vertical and two473 nm beams in the horizontal direction. The crossing of the four beams corresponds to themeasurement probe volume which is in the order of a few hundred cubic microns. The lightscattered from the droplets crossing the measurement region is collected by a receiver lens of500 mm focal length at an off-axis angle of 36° from the transmitted beam direction. The PDIprobe volume is perfectly overlapping with the modulated laser sheet in order to calibrate the ( #204922-$15.00 USD Received 16 Jan 2 014; r evised 12 Feb 2014; accepted 1 3 Feb 2 014; p ublished 1 9 Feb 2014 (C) 2014 OSA 24 February 2014 Vol.2 2 , No .4 DOI:10.1364/OE.22.00448 0 |OPTICS EXPRESS 4485 ) LIF/Mie images. To allocate, at a pixel level accuracy, the position of the PDI probe volumeon the LIF/Mie images, the crossing point of the four beams has been imaged with the EM-CCD cameras. The spray is moved along the direction of the laser sheet (from the edge of thespray towards its center) to acquire data for every millimeter successive distributionhistograms of the droplet size. For each collection point, 50 000 validated size measurementsare recorded and the corresponding absolute SMD is calculated. To ensure the sphericity ofthe measured droplets, a 15% diameter difference threshold is set. It is observed in allmeasurements that the diameter validation percentage was above 96%, demonstrating goodsphericity of the droplets at distance 3.5 cm below the nozzle tip. 3.3 SLIPItransmission measurements SLIPI transmission measurements are performed in order to deduce the optical thickness ofthe spray. The schematic of the set-up is given in Fig. 3(a). The SLIPI-LIF signal is recordedfrom a glass cuvette filled with the dyed water solution (in the exact same way than for theresults presented in Fig. 2(b)). The incident and final intensity profile of the laser sheet areacquired while keeping the spray “off”and “on”,respectively. These profiles are shown inFig. 3(b). The resultant spray transmission and optical depth (OD) is deduced from the Beer-Lambert law, as shown in Fig. 3(c). It is observed that only 35-40% of the incident lightremains after crossing the spray, corresponding to OD~1. From this measurement it is evidentthat the hollow-cone spray used in this study is dilute, as most of the photons have interactedonly once with the droplets prior to exit the spray system. Also noticeable is a sudden increasein OD, interpreted as the border between the spray region and the spray formation region(which is indicated with dashed box in Fig. 5). (a) (b) (c) Fig. 3. (a): Top-view of the SLIPI-transmission setup is shown. (b): Incident and final intensityprofiles of the laser sheet on a glass cuvette filled with dyed water solution. From thesemeasurements the light transmission and the optical depth of the spray can be deduced alongthe vertical axis of the laser sheet as shown in (c). In this case, the OD is mostly close to~1,confirming that the probed spray is dilute. Note that the vertical and horizontal dimensionaspects are not equal on these images. 4. Non-calibrated results 4.1 LIF & Mie images Three modulated sub-images of the LIF and the Mie signals are shown in Fig. 4(a). Theseimages are recorded using the optical setup depicted in Fig. 1. The modulated light sheet isentering the spray from left side and traverses it along its central axis. A spatial phasedifference of 120° between the set of two successive images is achieved by physically shiftingthe grating along the vertical direction. This is operated by means of a high-precision piezoactuator from Physik Instrumente. Based on these three modulated sub-images, the finalconventional and SLIPI images, shown in Fig. 4(b), are extracted using Eq. (3) and Eq. (2) ( #204922-$15.00 USD Received 16 Jan 2 014; r evised 12 Feb 2014; accepted 1 3 Feb 2 014; p ublished 1 9 Feb 2014 (C) 2014 OSA 24 February 2014| Vol.2 2 ,No. 4D OI:10.1364/OE.22.004480 | OPTICS EXPRESS 4486 ) respectively. The image differences between the two detection schemes are apparent. Incomparison to the conventional image, the SLIPI image is“cleaned up” from undesiredeffects such as blurring and detection of light intensities from non-illn-u1mi1nuated areas. A detaildescription of the image improvements using the SLIPI technique can be found in [25], alsofor the case of a hollow-cone spray. Apart of the injector design, the main difference betweenthe two studies is the lower injection pressure used here (20 bars instead of 50 bars), makingthe spray optically dilute. As a result, the laser extinction effect is not clearly apparent andone can observe from Fig. 4(b) that the amount oflight intensity from the entrance and exit(a) Modulated images I20 I240 (b) Conventional images SLIPI images —1cm Fig.4. The conventional and SLIPI, LIF and Mie averaged images of the hollow-cone sprayare generated by recording three modulated sub-images of both signals as shown in Fig. 4(a).These modulated images are recorded with a phase difference of 120°. The conventionalimages, created by averaging the three modulated sub-images, and the SLIPI images, generatedby taking the root-mean square of the same images, are shown in Fig.4(b). side of the spray remains comparable. This observation indicates that the spray is not opticallydense,as verified from the transmission measurements previously shown. 4.2 Relative SMD mapping The relative SMD distribution of droplets is shown in Fig. 5. These images are extracted fromthe ratio of the LIF and Mie images given in Fig. 4(b). In order to adequately compare theconventional and the SLIPI results, the images are post-processed according to the sameprocess: The image background is first calculated from the average of 100 pixels located atthe top left corner of each image. After background subtraction, a threshold value equal to0.001% of the maximum peak intensity of the image is calculated. Any pixel value below thisthreshold is disregarded to avoid numerical errors while ratioing the data. It is worthmentioning here that a nearly identical SLIPI SMD image can be obtained withoutbackground subtraction. However, the same image processing routine was kept on bothdetection schemes for fair comparison. Several noticeable differencesbetween theconventional, Fig. 5(a), and SLIPI, Fig. 5(b), LIF/Mie ratios can be pointed out: First, a SMDvalue is seen up to the nozzle tip on the conventional LIF/Mie image while this is notobservable for the SLIPI case. As this part of the spray is not illuminated by the laser sheet,the corresponding SMD iss extracted from multiply scattered photons only and has,consequently, no real meaning. Second, according to the SLIPI results large droplets arelocated on the edge of the spray while small droplets are measured at this same location withconventional planar imaging. Finally, due to global blurring effect, the spray cone does notappear as hollow for the conventional as it does for the SLIPI image. As a result, Fig.5(b) seems to be a convincing representation of the relative droplets SMDin opposition to Fig. 5(a). This observation needs now to be proven by the means of anadditional technique where the absolute SMD can be measured. To reach this goal, the latestPDI setup from Artium Technologies has been used. It should also be noted from Fig. 5(b)that the SMD data cannot be considered near the nozzle exit (indicated on the SLIPI LIF/Mieimage by the dashed rectangular area) due the presence of non-spherical droplets andligaments. The data shown here correspond to a given dye concentration and laser power. Theinfluence of these two parameters is investigated in the next sub-section. (a) (b) X[cm] Fig. 5. Averaged images of the Conventional LIF/Mie and SLIPI LIF/Mie, in (a) and (b)respectively, representing the relative SMD of droplets distribution. Effects from the multiplelight scattering are apparent on the conventional SMD image. By efficiently removing theintensity contribution from multiple light scattering those effects are suppressed, leading to areliable SMD mapping of the hollow-cone spray as shown in(b). 4.3 Effect ofdye concentration and laser power The effect of the dye concentration, C, on the relative SMD is shown for conventional andSLIPI detection in Fig.6(a) and Fig.6(b) respectively. Three concentrations corresponding toC (ue=0.36 cm), Cz (He=0.60 cm) and C3 (e=1.20 cm-') are investigated while thelaser output power is kept constant to 900 mW. In this situation the Mie scattering cross-section of the droplets should reduce in favor to the absorption cross-section due to theincrease of dye molecules. However, the amount of dye was not large enough to significantlyreduce the scattering cross-section and the Mie signal was observed to be nearly constant foreach case of study. On the LIF detection side, the signal was naturally increased with anincrease of C. As a result, the LIF/Mie ratio is showing an increase of the relative SMD valuewhile increasing the number density of the dye molecules. The results show that thebackground noise decreases as C (and thereby the LIF signal) increases while the relativeSMD distribution remains nearly identical. In addition, the non-linearity effects due too highdye concentration [16,17] are not observed here. (a)o 1.5 Fig. 6. Effect of dye concentration and laser power on the relative SMD distributions. Figures6(a) and 6(b) show the conventional and SLIPI LIF/Mie ratios respectively, for the dyeconcentrations Ci (ue=0.36 cm'), Cz(ue=0.60cm) and Cs (ue=1.20 cm). Figures 6(c)and 6(d) show the conventional and SLIPI LIF/Mie ratio respectively, at laser powerPi=200 mW,P2=500 mW and P3=800 mW. #204922-$15.00 USD Received 16 Jan 2014; revised 12 Feb 2014; accepted 13 Feb 2014;published 19 Feb 2014(C)2014OSA 24 February 2014| Vol.22, No.4|DOI:10.1364/OE.22.004480|OPTICS EXPRESS 4489 The effect of the incident laser power, P, on the relative SMD is shown for conventionaland SLIPI detection in Fig. 6(c) and Fig. 6(d) respectively. Three initial laser powercorresponding to Pi=200 mW, P2=500 mW and P3=800 mW are investigated while thedye concentration is kept constant. In this situation a linear increase ofP is increasing both theLIF and the Mie signals linearly resulting to a nearly unaffected SMD value.Note that in thisexperiment the maximum light intensity (P=900 mW) is not sufficient to induce saturation inthe dye molecules, supporting this choice for obtaining the highest SNR. 5.Calibrated results 5.1 PDI measurements The measurement of the absolute droplets SMD using PDI is shown in Fig. 7(a). This isperformed at a given vertical position (y=3.5 cm) from the nozzle tip and along the x-axis,from one edge of the spray (at x =-3 cm) towards its center (up to x = 0.5 cm). Largedroplets, SMD ~27 um, are detected on the spray edge,while small droplets, SMD ~5 um, arelocated in the spray center. This support the trend observed in the previous section for thenon-calibrated SLIPI LIF/Mie results. In addition, it shows that the central part of the spray isnot fully hollow and that small droplets are transported in this region due to vortical air flows. The spacing between each data point equals one millimeter. For each of the point a dropletsize distribution corresponding to 50000 droplets validated by the PDI system is considered.One example of distribution is given in Fig. 7(b) corresponding to the position x=-2.5 cm(red dot from Fig. 7(a)). In this example, a bimodal distribution can be observed where theresulting SMD equals 28.4 um. 60 Fig. 7. Droplet size measurement using PDI. (a) Droplets SMD along the x-axis from one edgeof the spray (set as -3 cm) towards its center (0 cm). The SMD is calculated from the dropletsize distribution measured for every millimeter. An example of such distribution at positionx= 2.5 cm (as indicated by the red dot in the Fig. 7(a)) is given in (b) where the resultingSMD =28.4 um. 5.2 Calibration The SMD data from Fig.7(a) is now used in an attempt to calibrate the LIF/Mie intensityratios. An image of the PDI probe volume is recorded with the cameras, to deduce the exactlocation of the pixels that have to be considered in the calibration. For each PDI measurementpoint, a value of the LIF/Mie ratio is assigned as shown in Fig. 8. For the case of conventionaldetection, corresponding to Fig. 8(a), it is observed that for an identical LIF/Mie ratio twodifferent SMD values are measured with PDI.For example, 10 um and 28 um droplets SMDare found for an identical LIF/Mie ratio equal to~1 at different locations in the spray. Thisreveals that the LIF/Mie ratio cannot, in this case, be calibrated. It is, however, important to ( #204922-$15.00 USD Received 16 Jan 2 014; r evised 12 Feb 2014; accepted 1 3 Feb 2 014; p ublished 1 9 Feb 2014(C) 2014 OSA 24 February 2014| Vol.2 2 , No .4 |DOI:10.1364/OE.22.0044 8 0|OPTICS EXPRESS 4490 ) note that the intensity contribution from multiply scattered light is very difficult to predict andthe observed trend may change with the collection angle, optical turbidity, droplets size,ditribution of the droplets in the spray, etc. As the spray investigated here is optically dilute,this observation leads to the questioning of the accuracy of any SMD measurement whenusing conventional LIF/Mie in sprays. On the contrary, for the SLIPI case, corresponding toFig. 8(a), a single solution of SMD is found for any LIF/Mie ratio. A calibration curve can bededuced allowing the relative SMD data shown in Fig. 5(b) to now be calibrated. (a) 15 Fig. 8. Plots of the SMD values measured with PDI against the corresponding LIF/Mie ratio. In(a) the conventional case shows two SMD solutions for a single LIF/Mie ratio. In this case, themeasurement cannot be calibrated. In (b) the SLIPI case shows a unique solution for eachLIF/Mie ratio. This confirms the possibility of extracting a reliable calibration curve that canbe used to deduce the absolute droplets SMD from Fig. 5(b). 5.3 Absolute SMD mapping A two-dimensional map of the absolute droplets SMD is shown in Fig. 9, after calibration ofthe SLIPI LIF/Mie results using the red curve from Fig. 8(b). X [cm] Fig. 9. Two-dimensional map of the absolute droplets SMD for a indicated on hollow-conewater spray running at 20 bars injection pressure. The result is obtained from SLIPI LIF/Mieafter calibration with PDI data. The PDI measurements were performed at 3.5 cm below thenozzle tip, along the black dot line the image. The indicated box, corresponds to the spray formation region where non-spherical dropletsand ligaments are present. Similarly to the results found with PDI, the presented image showsthe presence of5 um droplets in the central region of the spray. However, the injected waterdisintegrates into large droplets of ~29 umalong the spray edges which is also in accordancewith the PDI measurements. Such results are unique as they cannot be obtained usingconventional planar imaging where the calibration procedure is, in this case, unfeasible. Fig. 10. Comparison of the PDI results with both the non-calibrated and the calibrated SLIPIdata. A magnification of the non-calibrated ratio data between -1 cm and 0.5 cm shows thatthe SLIPI ratio remains non-zero in this region. The comparison of PDI measurement with the calibrated and non-calibrated SLIPI ratiosis shown in Fig. 10. It is observed that the calibrated SLIPI SMD values agree well with mostof the PDI data curve, except at the edge of the spray at x<-2.5 cm. In this location, fewerdroplets are present, inducing a low SNR on LIF and Mie signals detected by the cameras.The PDI system, which has a larger dynamic range than the EM-CCD cameras, is still capableof detecting the presence of large droplets in these regions, despite their very low numberdensity. 6. Conclusions In this work, it is deduced that an appropriate calibration process is not possible when usingconventional PDS in a spray system, since two SMD values were assigned for a singleLIF/Mie ratio value. This observation is quite surprising, as the investigated spray was notdefined as “optically dense". When using SLIPI a calibration curve was, however, possible toobtain. The trend of the SLIPI LIF/Mie results did show good agreements with the data fromthe PDI measurements. As a result, a reliable two-dimensional distribution of droplets SMDwas obtained in a hollow-cone water spray. The investigation performed in this articlestrongly supports the application of the SLIPI technique for reliable droplet sizing, even forthe case of optically dilute sprays. Future work will focus on the applicability of the presentedcalibrated approach in optically denser sprays. The presented results open up new possibilitiesfor faithful droplet size mapping in sprays and questions, at the same time, about thereliability of the experimental LIF/Mie data presented over the past two decades. Acknowledgments The authors would like to thank Dr. W. Bachalo from Artium Technologies Inc. and Dr. H.Voges from LaVision GmbH for loaning the PDI system. We gratefully acknowledge theSwedish Research Council for the financial support of the Project 2011-4272. Funding fromthe European Research Council Advanced Grant DALDECS is also highly appreciated. ( #204922-$15.00 USD Received 16 Jan 2 014; r evised 12 Feb 2014; accepted 1 3 Feb 2 014; p ublished 1 9 Feb 2014(C) 2014 OSA 24 February 2014| Vol. 2 2, N o. 4DOI:10.1364/OE.22.0044 8 0|OPTICS EXPRESS 4492 ) #$USD Received Jan revised Feb accepted Feb published Feb C) OSA February Vol. No.|DOI:OE.OPTICS EXPRESS In this article, Structured Laser Illumination Planar Imaging(SLIPI) is used in combination with the LIF/Mie ratio technique forextracting a reliable two-dimensional mapping of the droplets Sauter MeanDiameter (SMD). We show that even for the case of a fairly dilute spray,where single scattering events are in majority, the conventional LIF/Mietechnique still remains largely affected by errors introduced by multiplelight scattering. To remove this unwanted light intensity on both the LIFand Mie images SLIPI is used prior to apply the image ratio. For the firsttime, the SLIPI LIF/Mie results are calibrated and compared withmeasurement data from Phase Doppler Interferometry (PDI).
确定

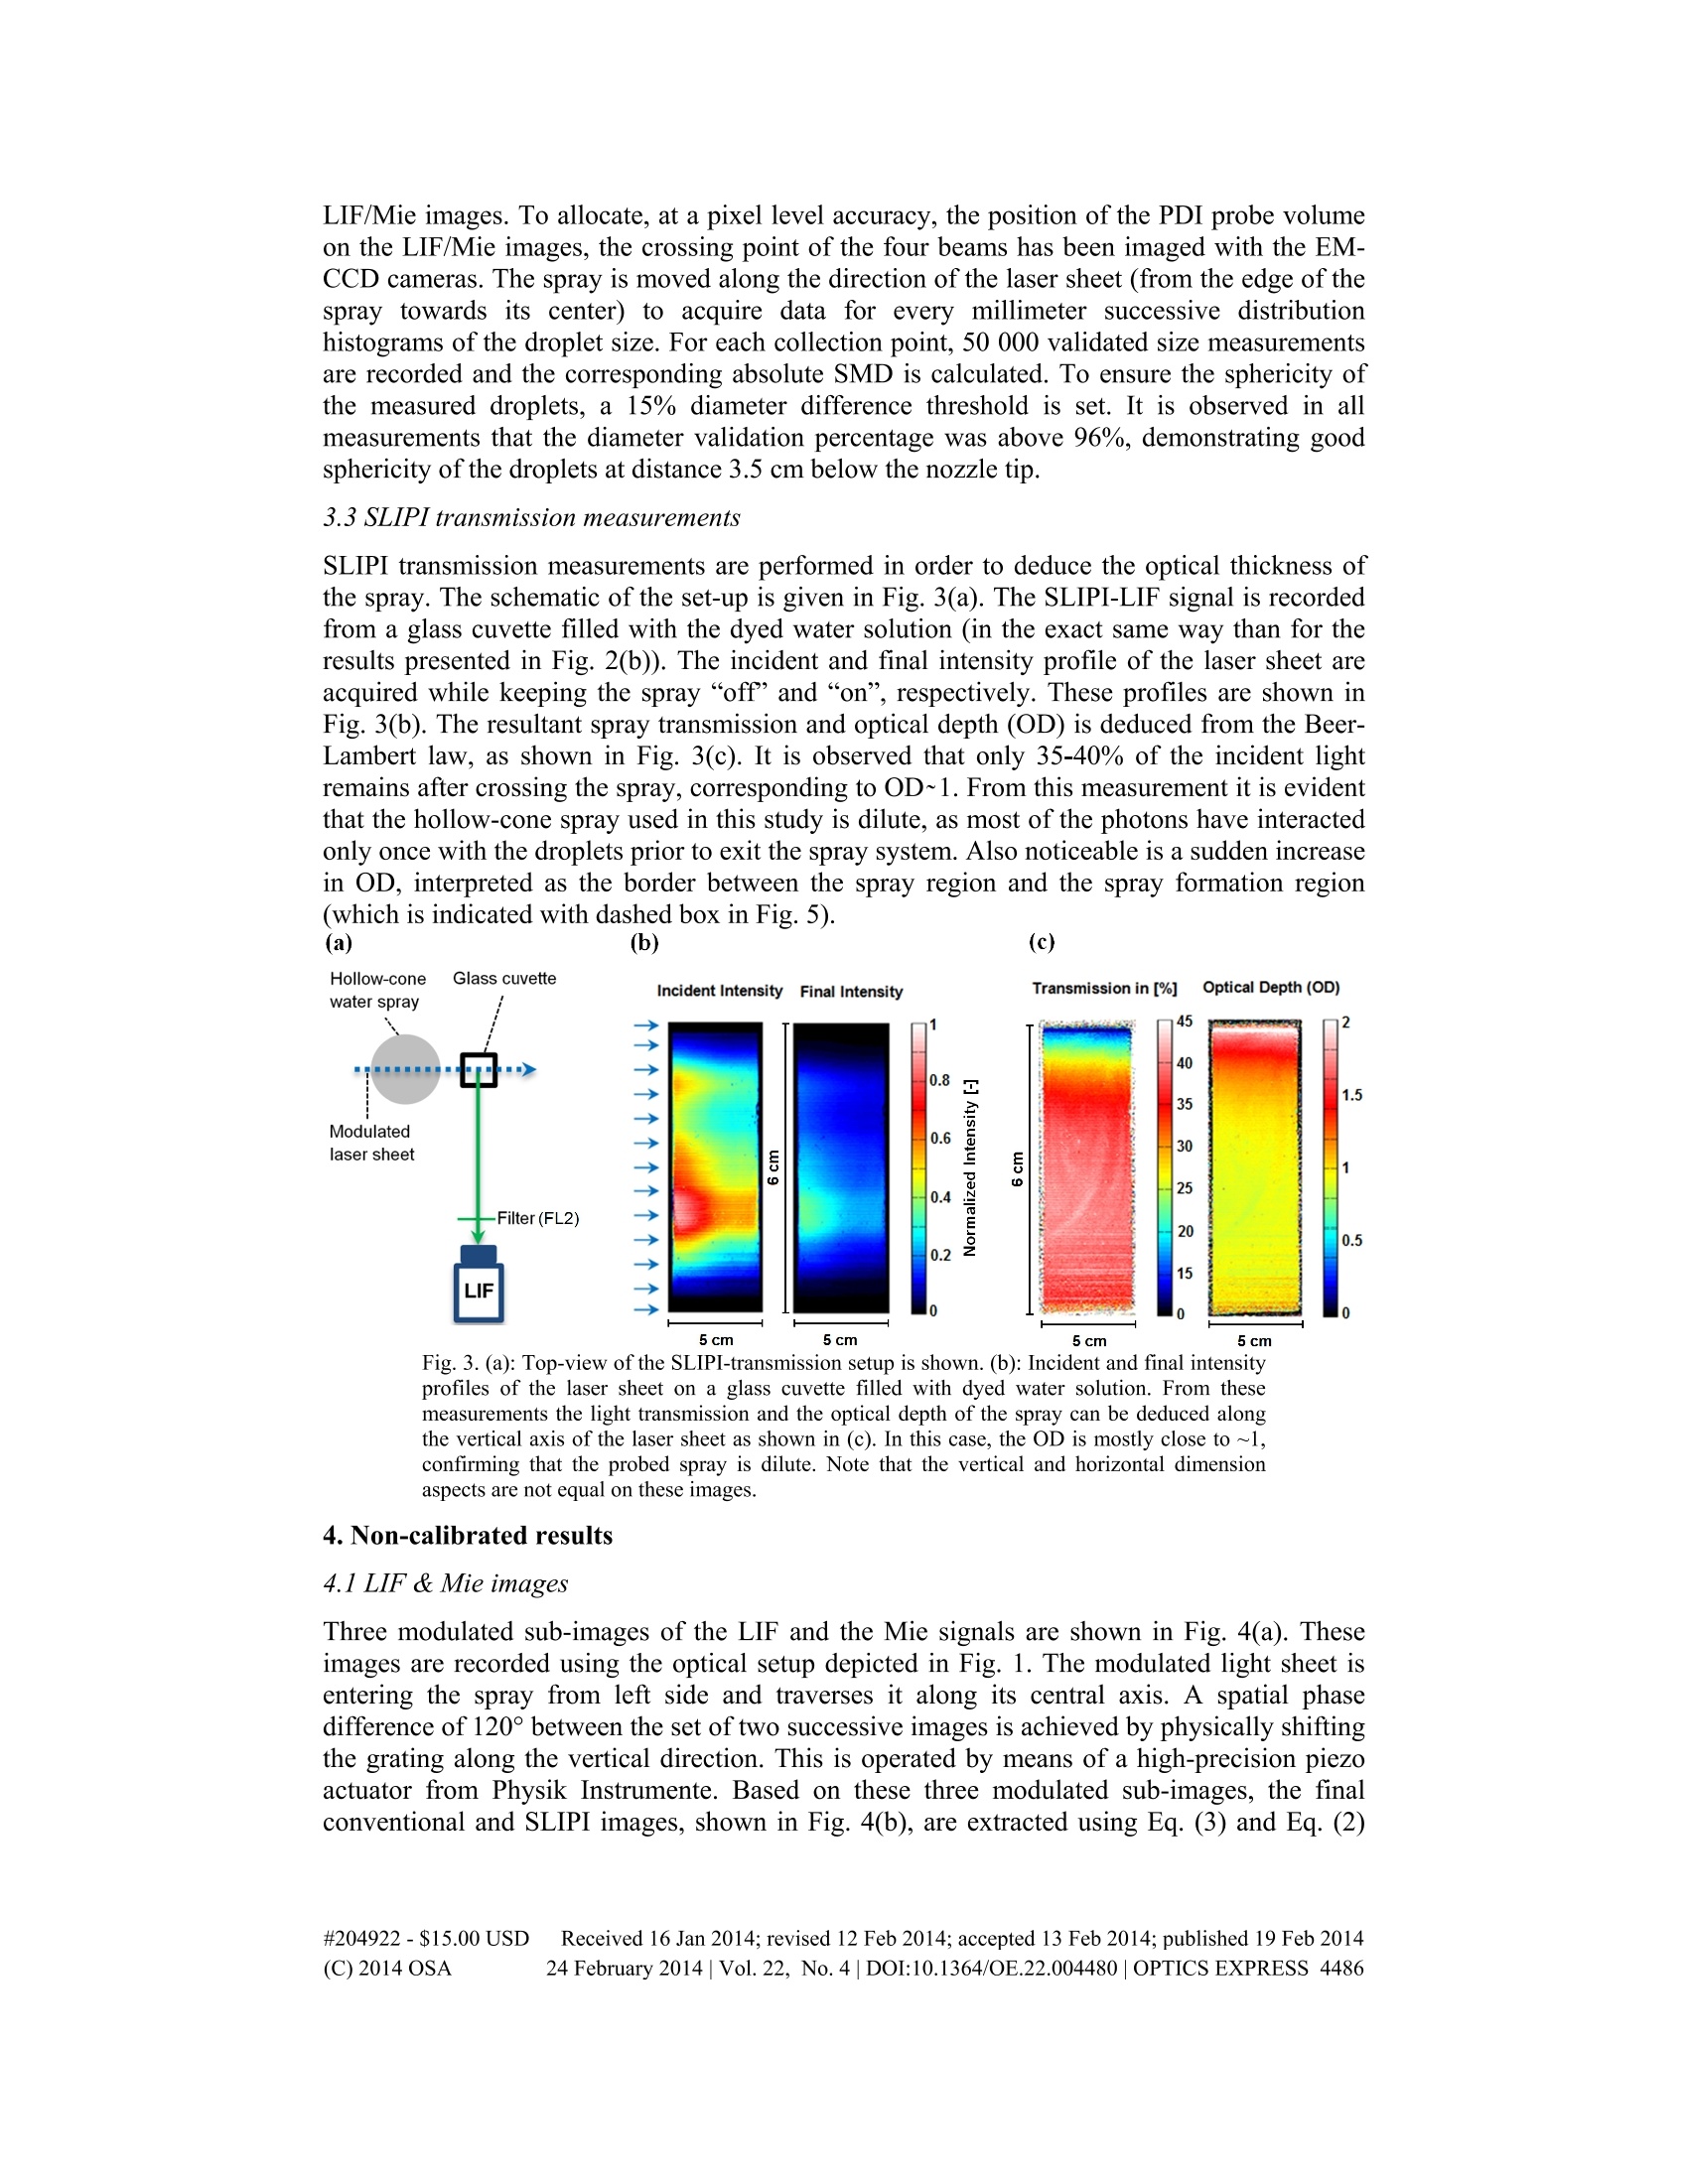


还剩12页未读,是否继续阅读?

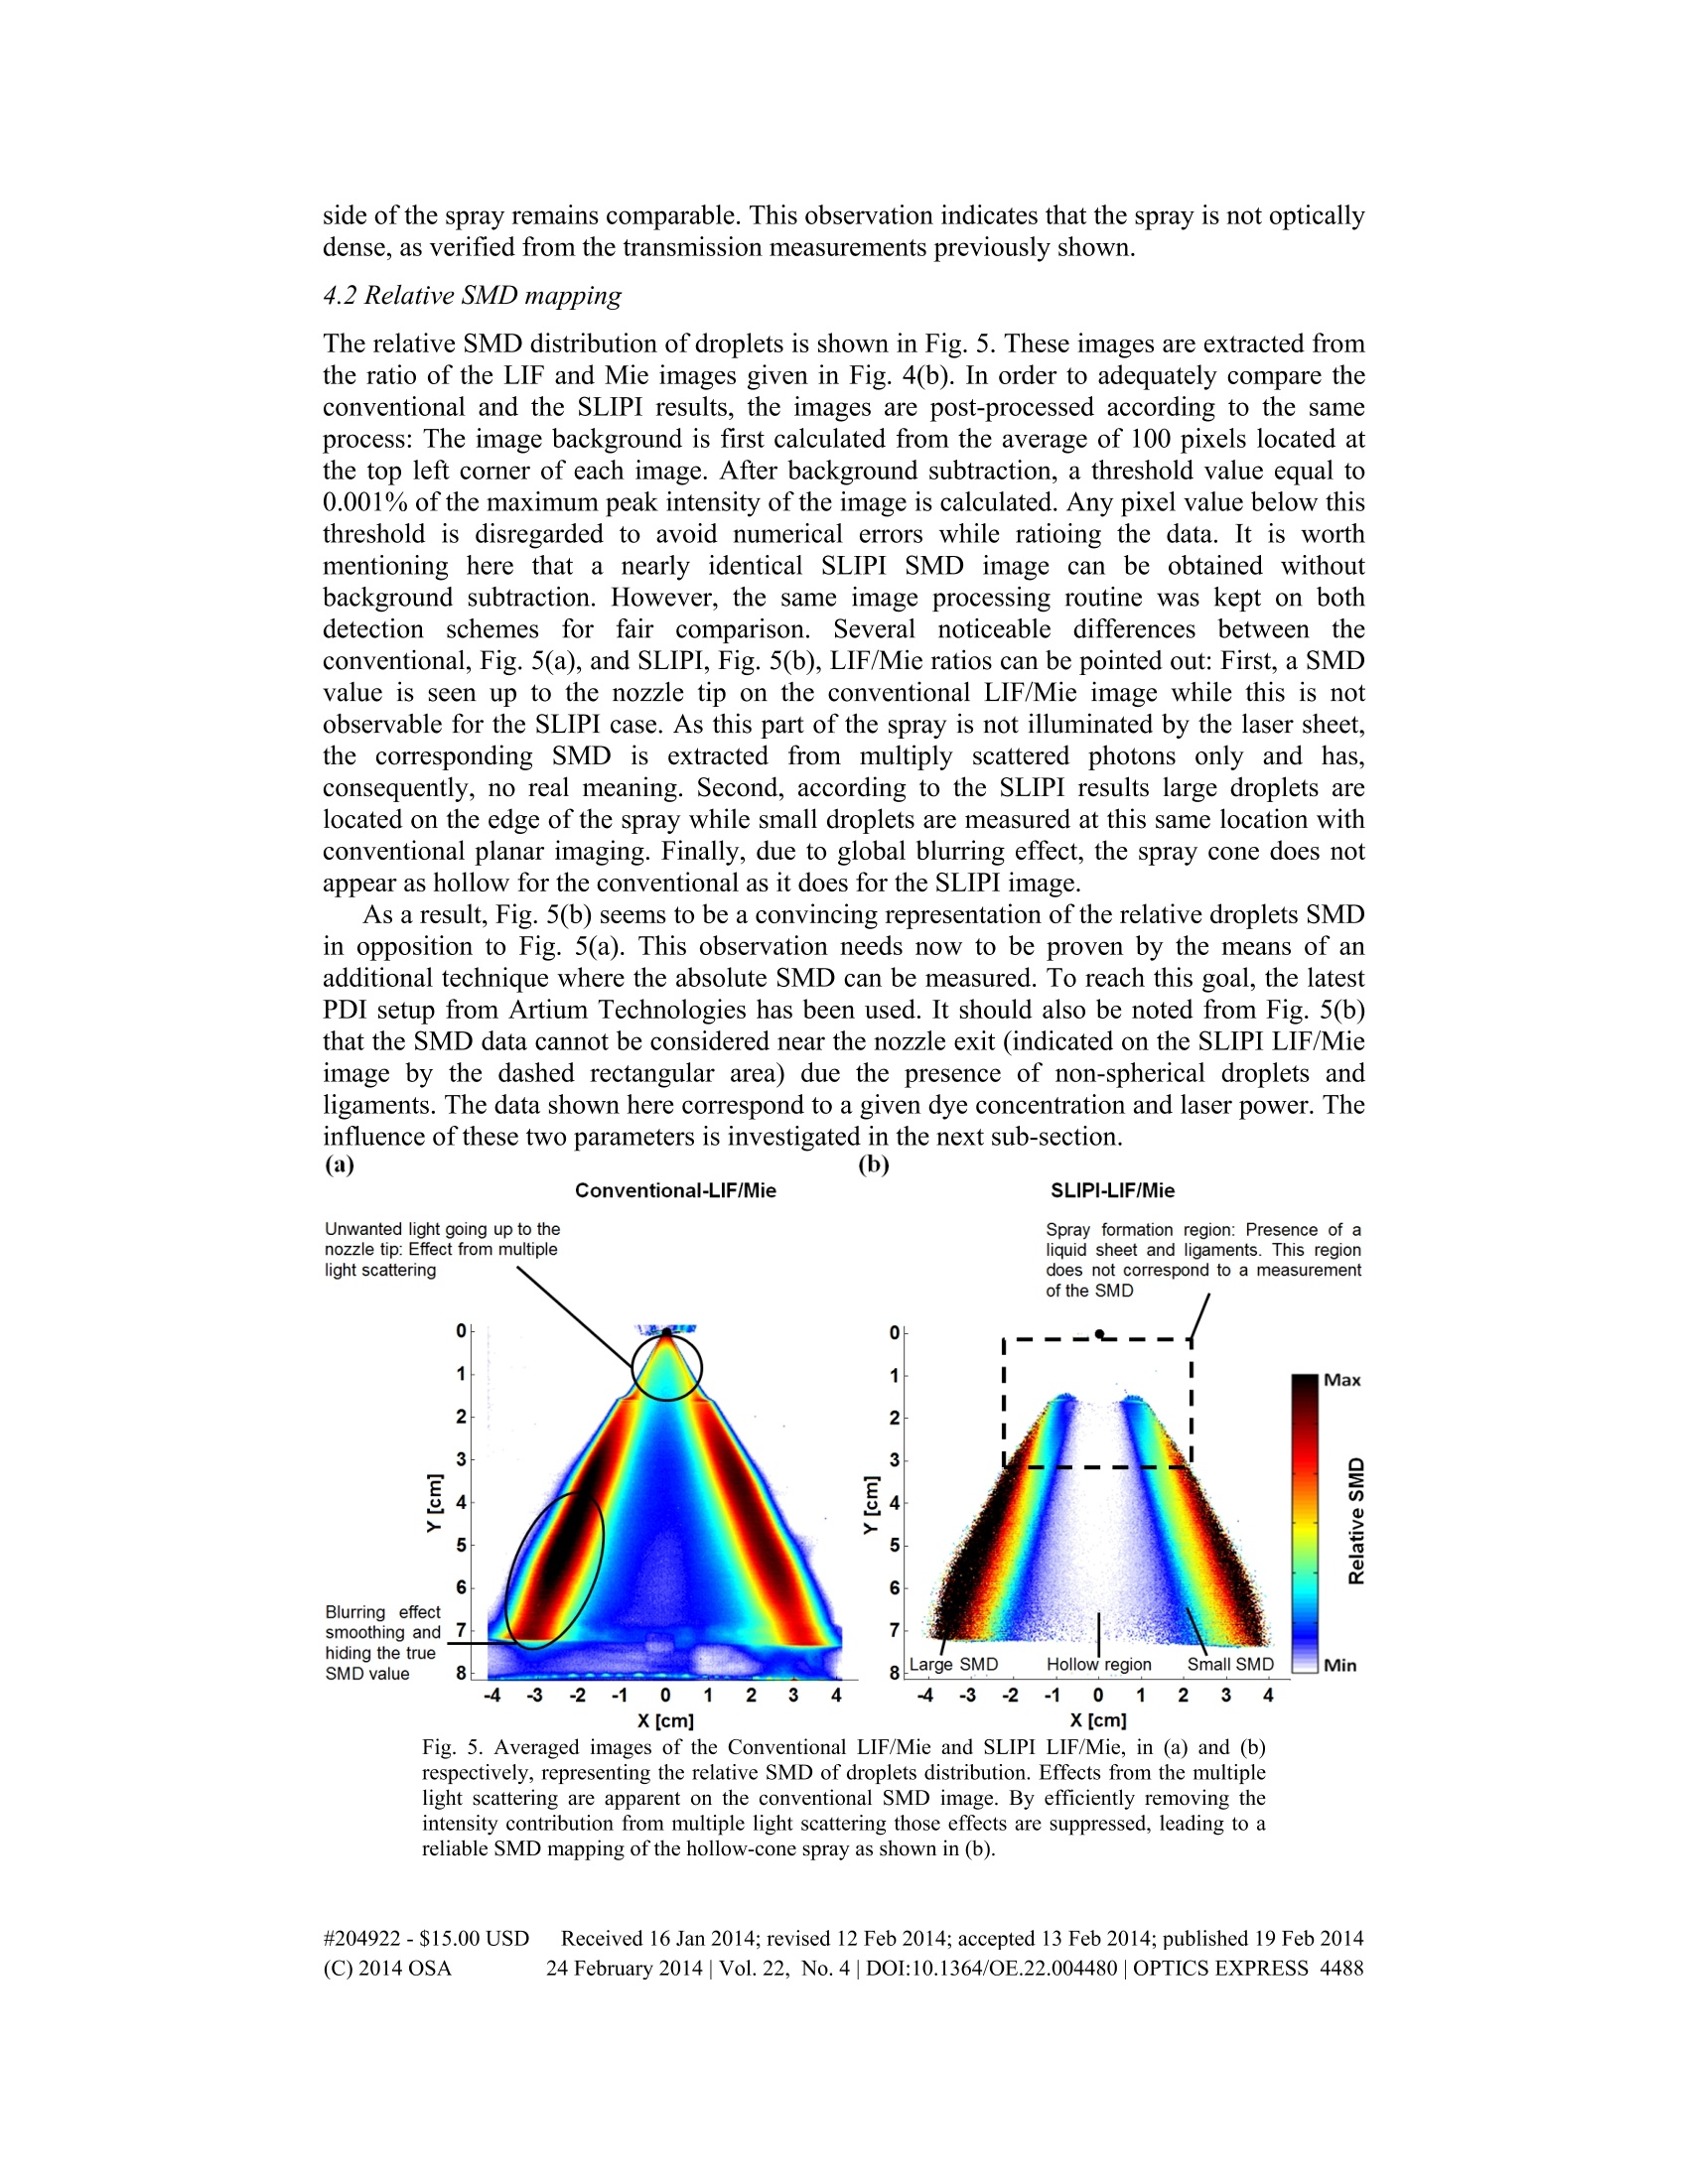
产品配置单


北京欧兰科技发展有限公司为您提供《喷雾液滴中粒径检测方案(激光干涉仪)》,该方案主要用于其他中粒径检测,参考标准--,《喷雾液滴中粒径检测方案(激光干涉仪)》用到的仪器有激光相位多普勒干涉仪LDV,PDI,PDPA,PDA、德国LaVision PIV/PLIF粒子成像测速场仪、PLIF平面激光诱导荧光火焰燃烧检测系统、LaVision SprayMaster 喷雾成像测量系统
推荐专场


相关方案
更多
该厂商其他方案
更多