


方案详情
文
采用LaVision公司的科研型CCD相机和智能成像系统,对酒精喷雾的几何参量进行了实时测量。和1维拉曼散射测量相结合,提供了对喷雾对象,多视角,多参量的测量和表征
方案详情

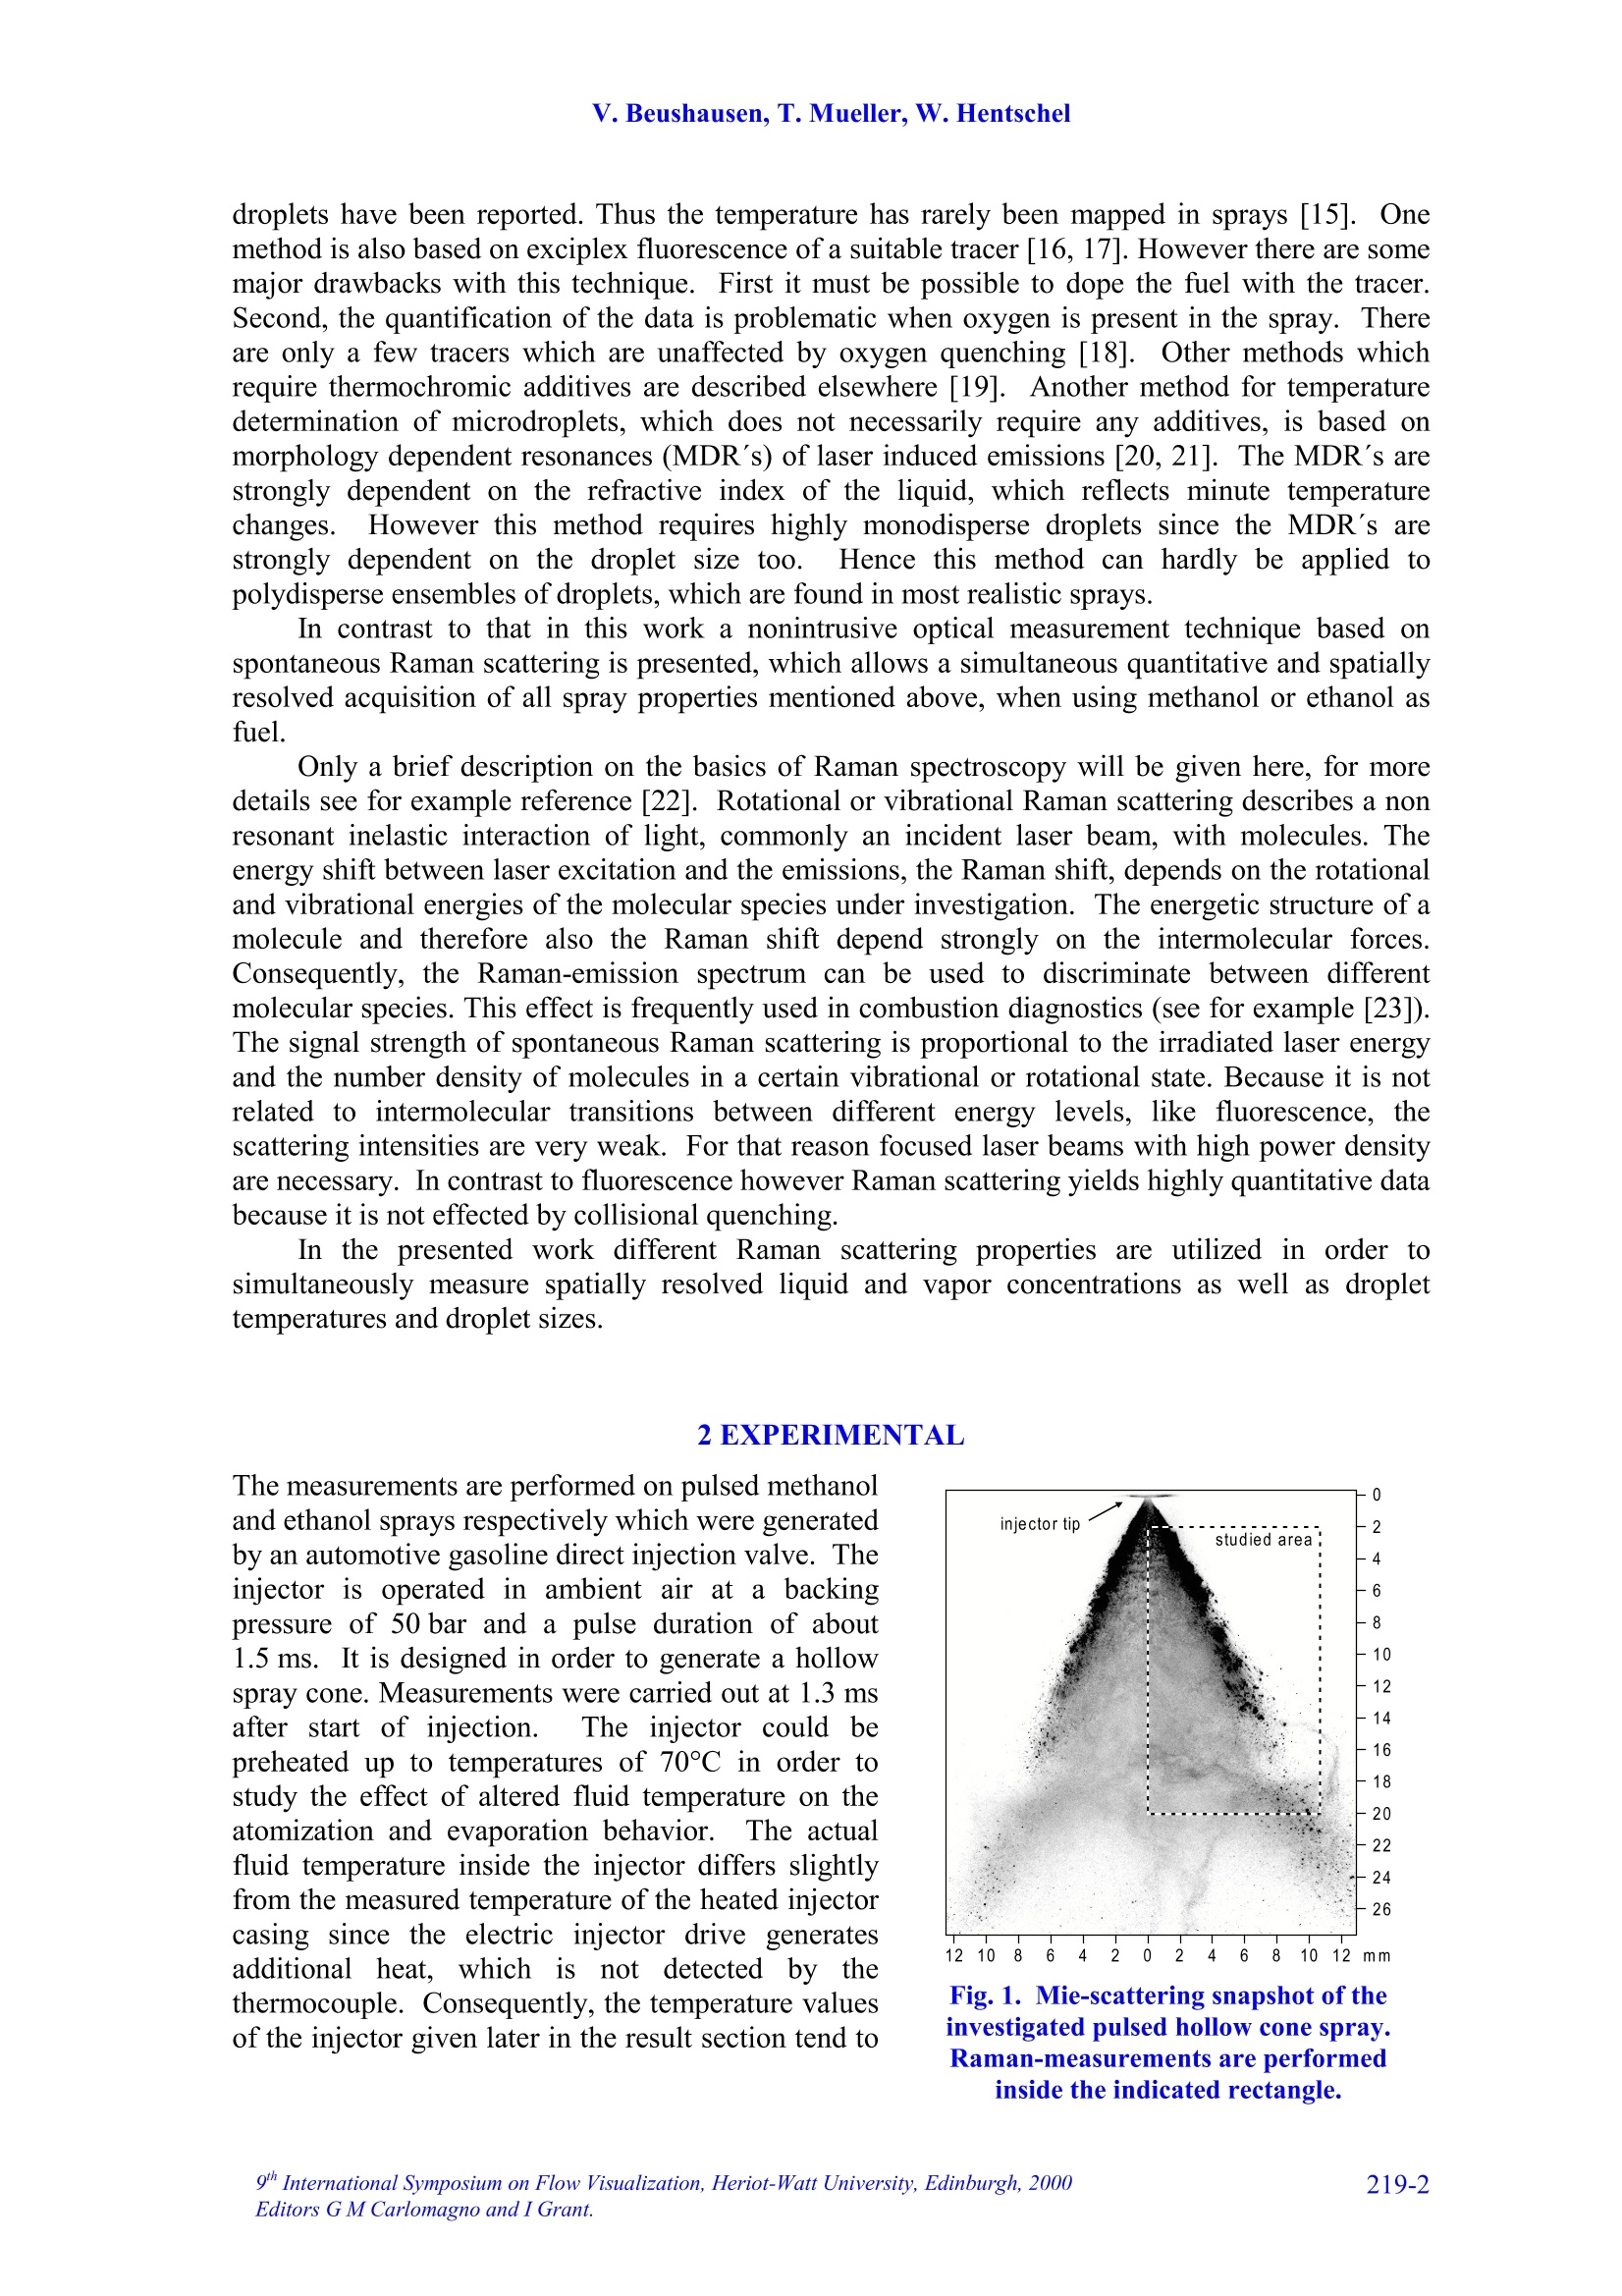
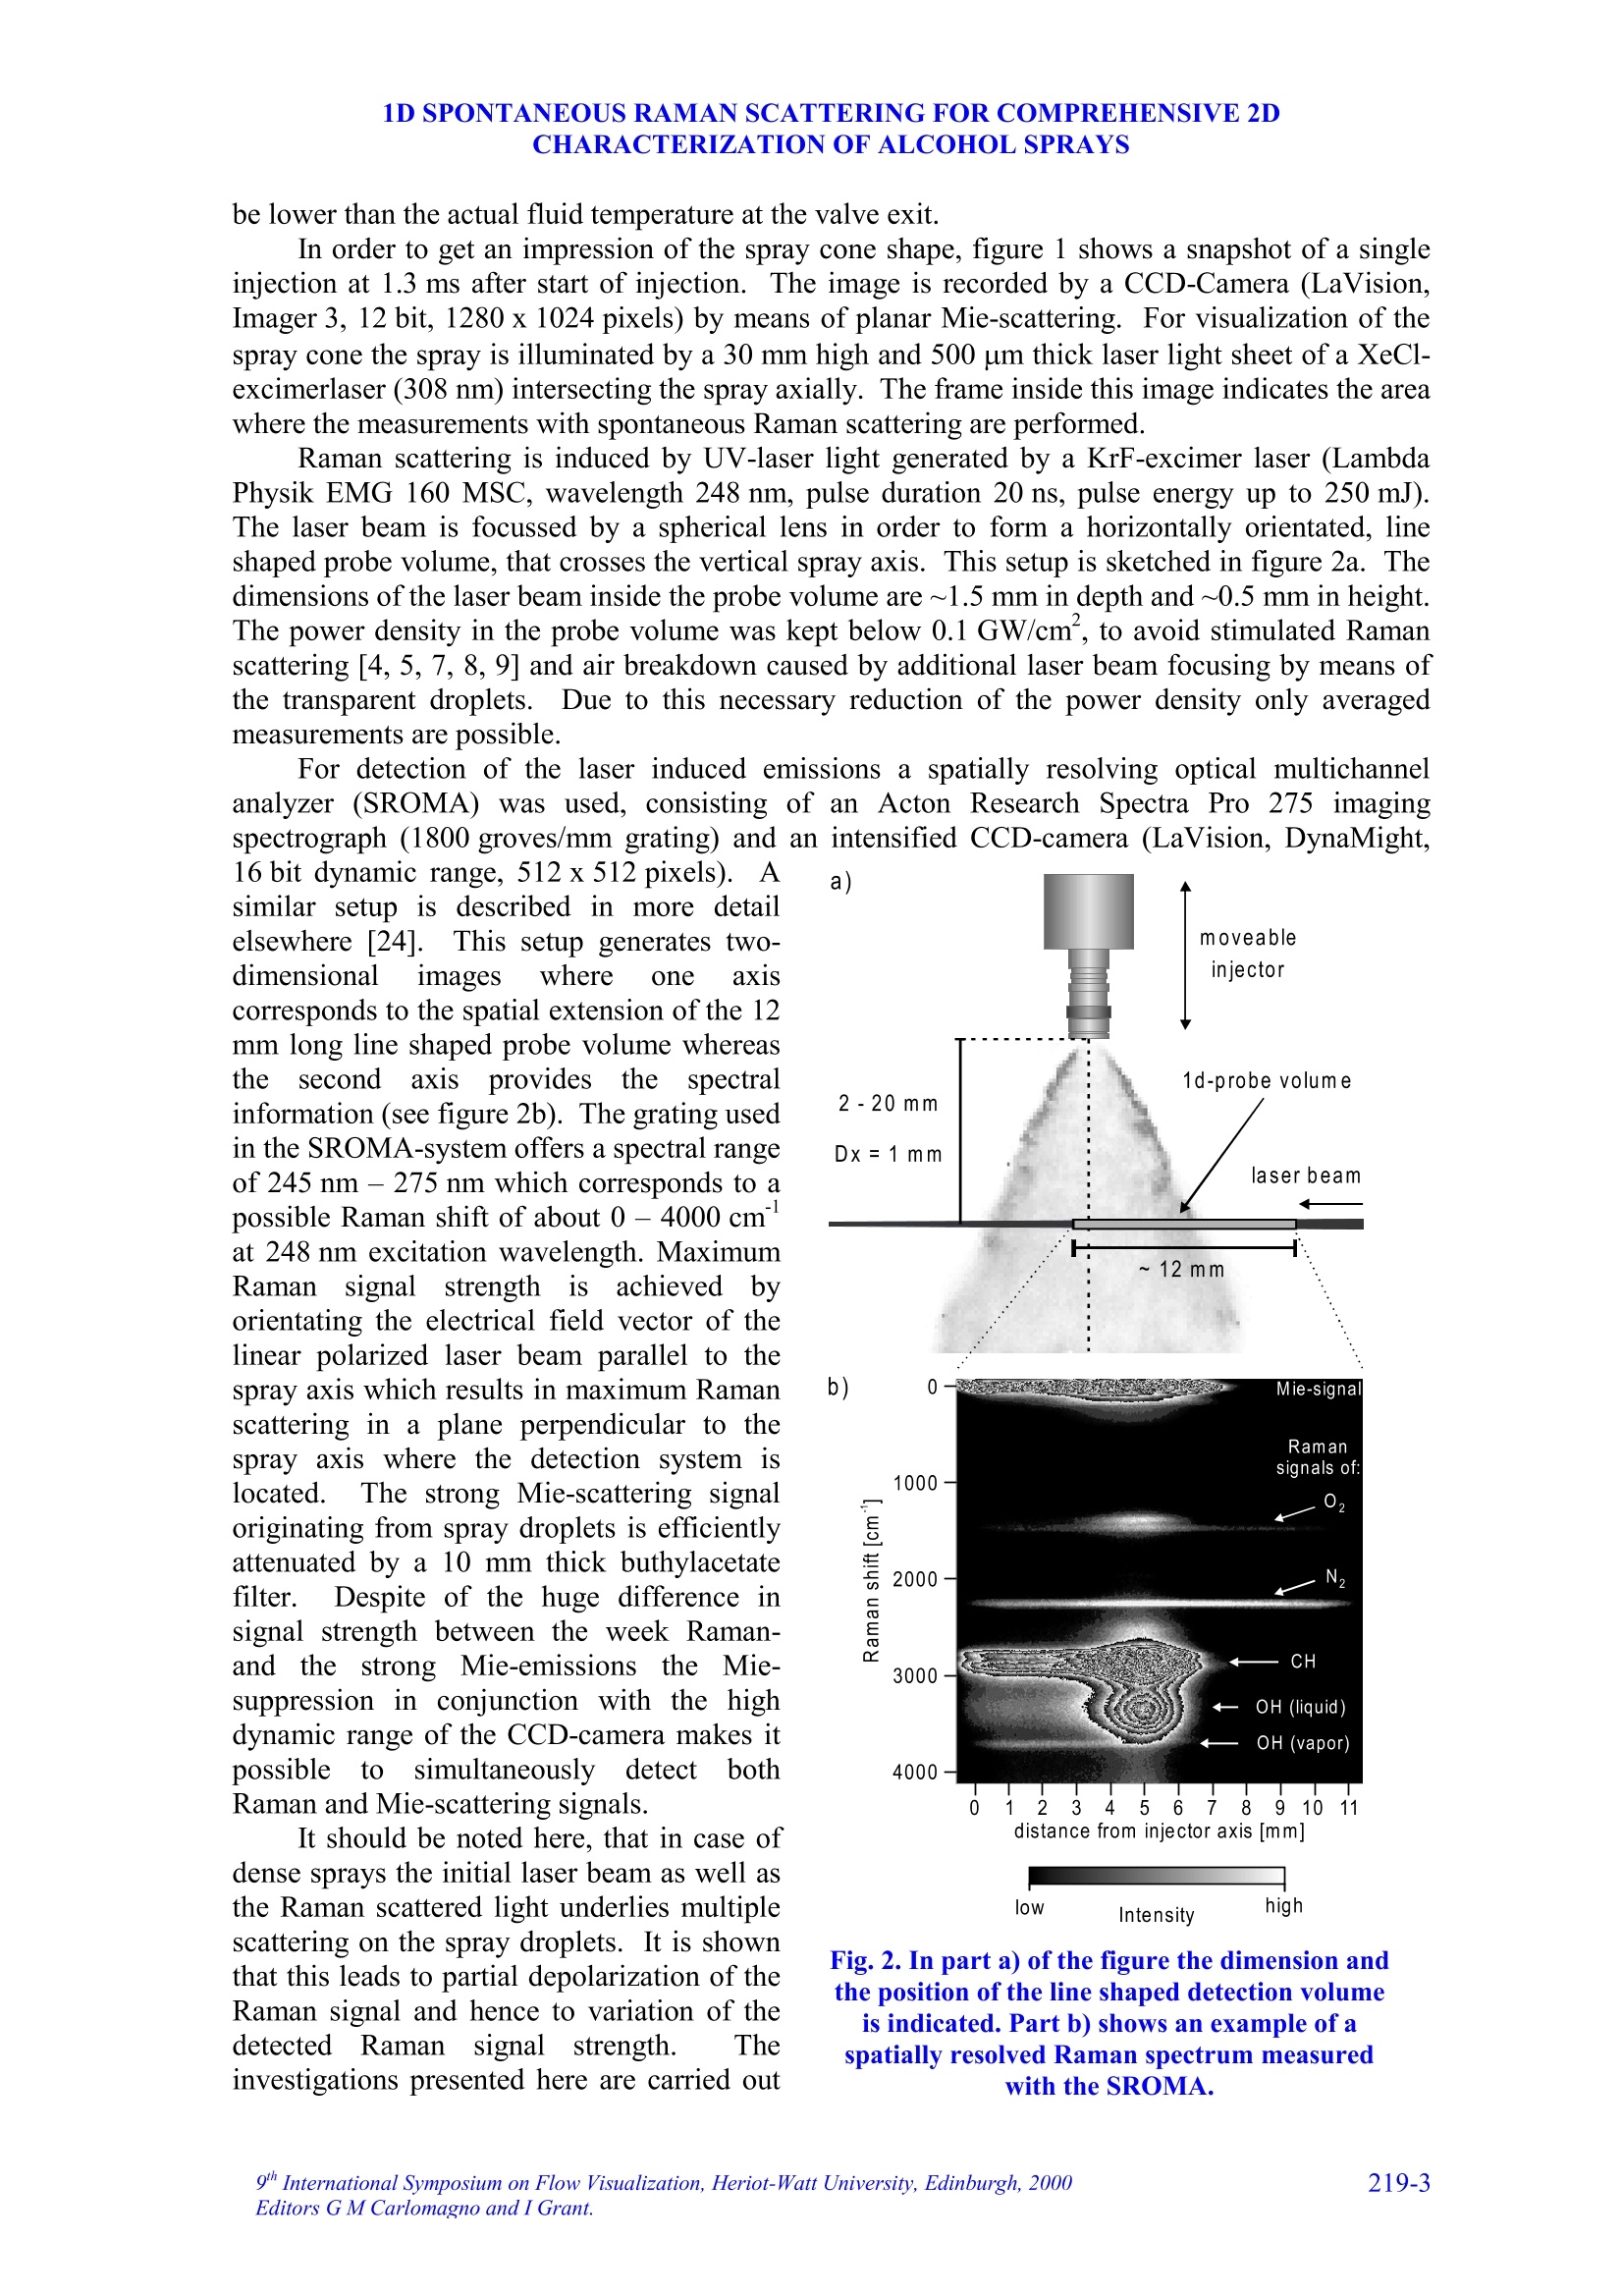
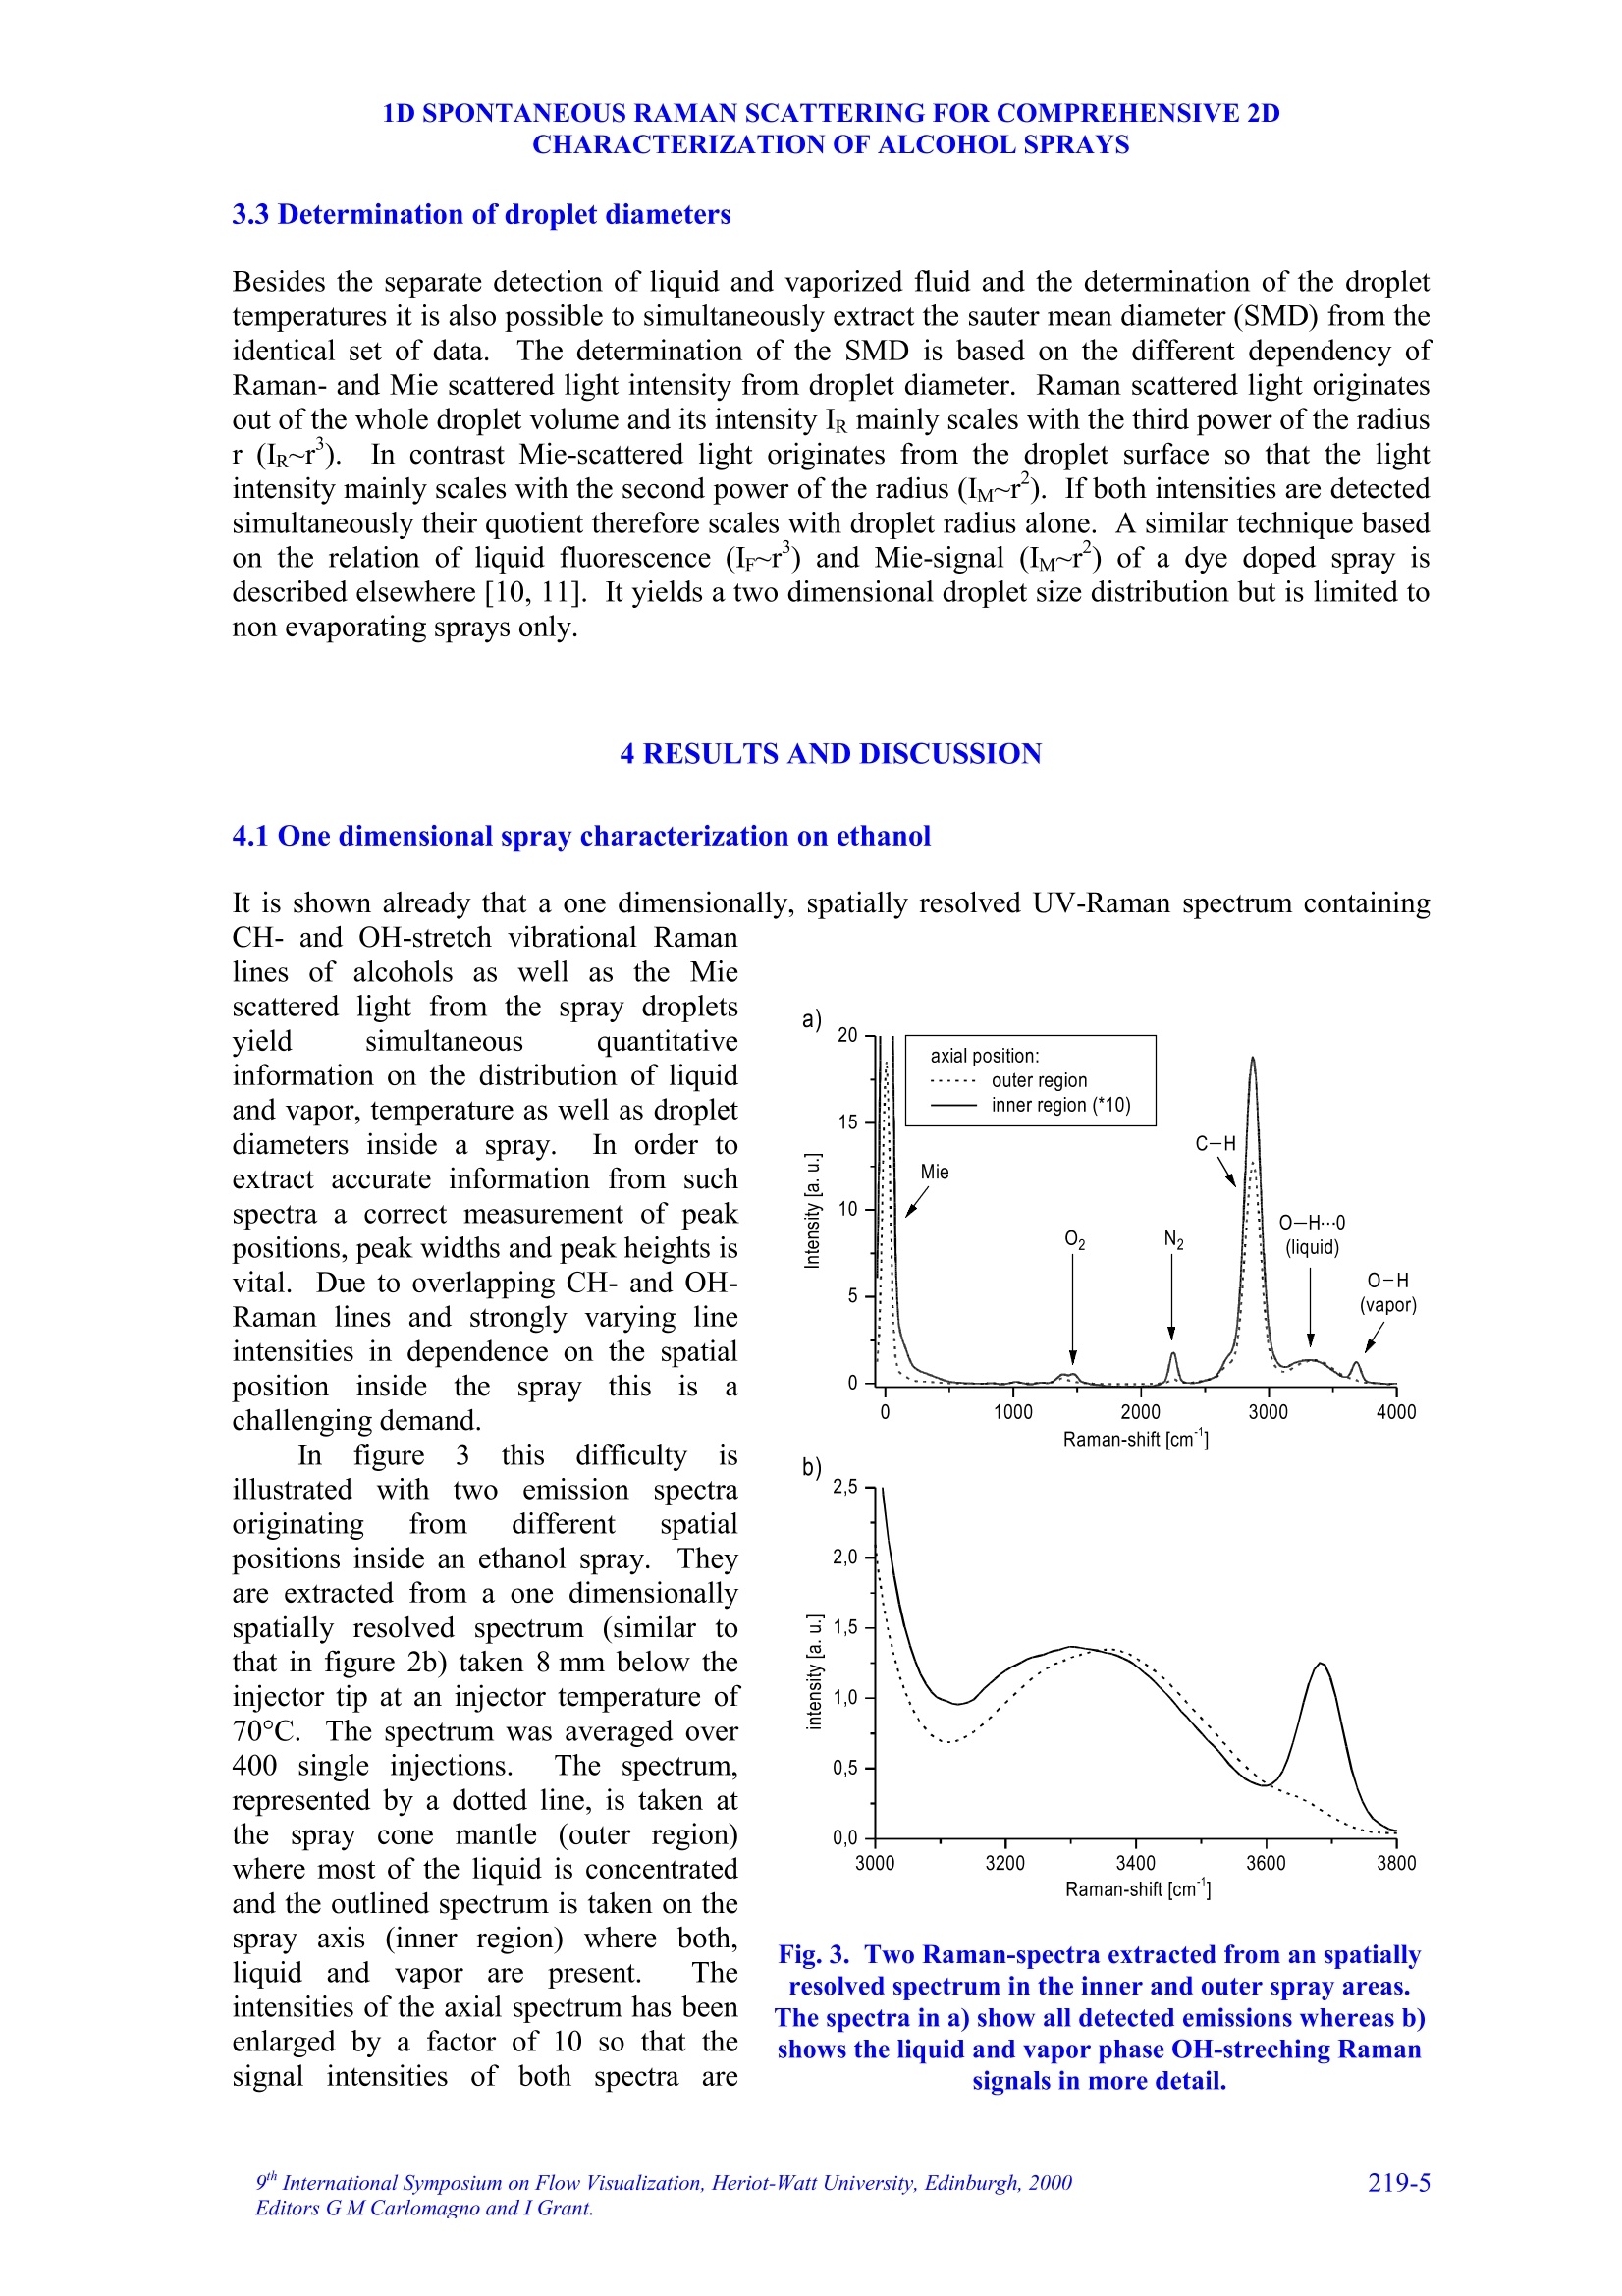
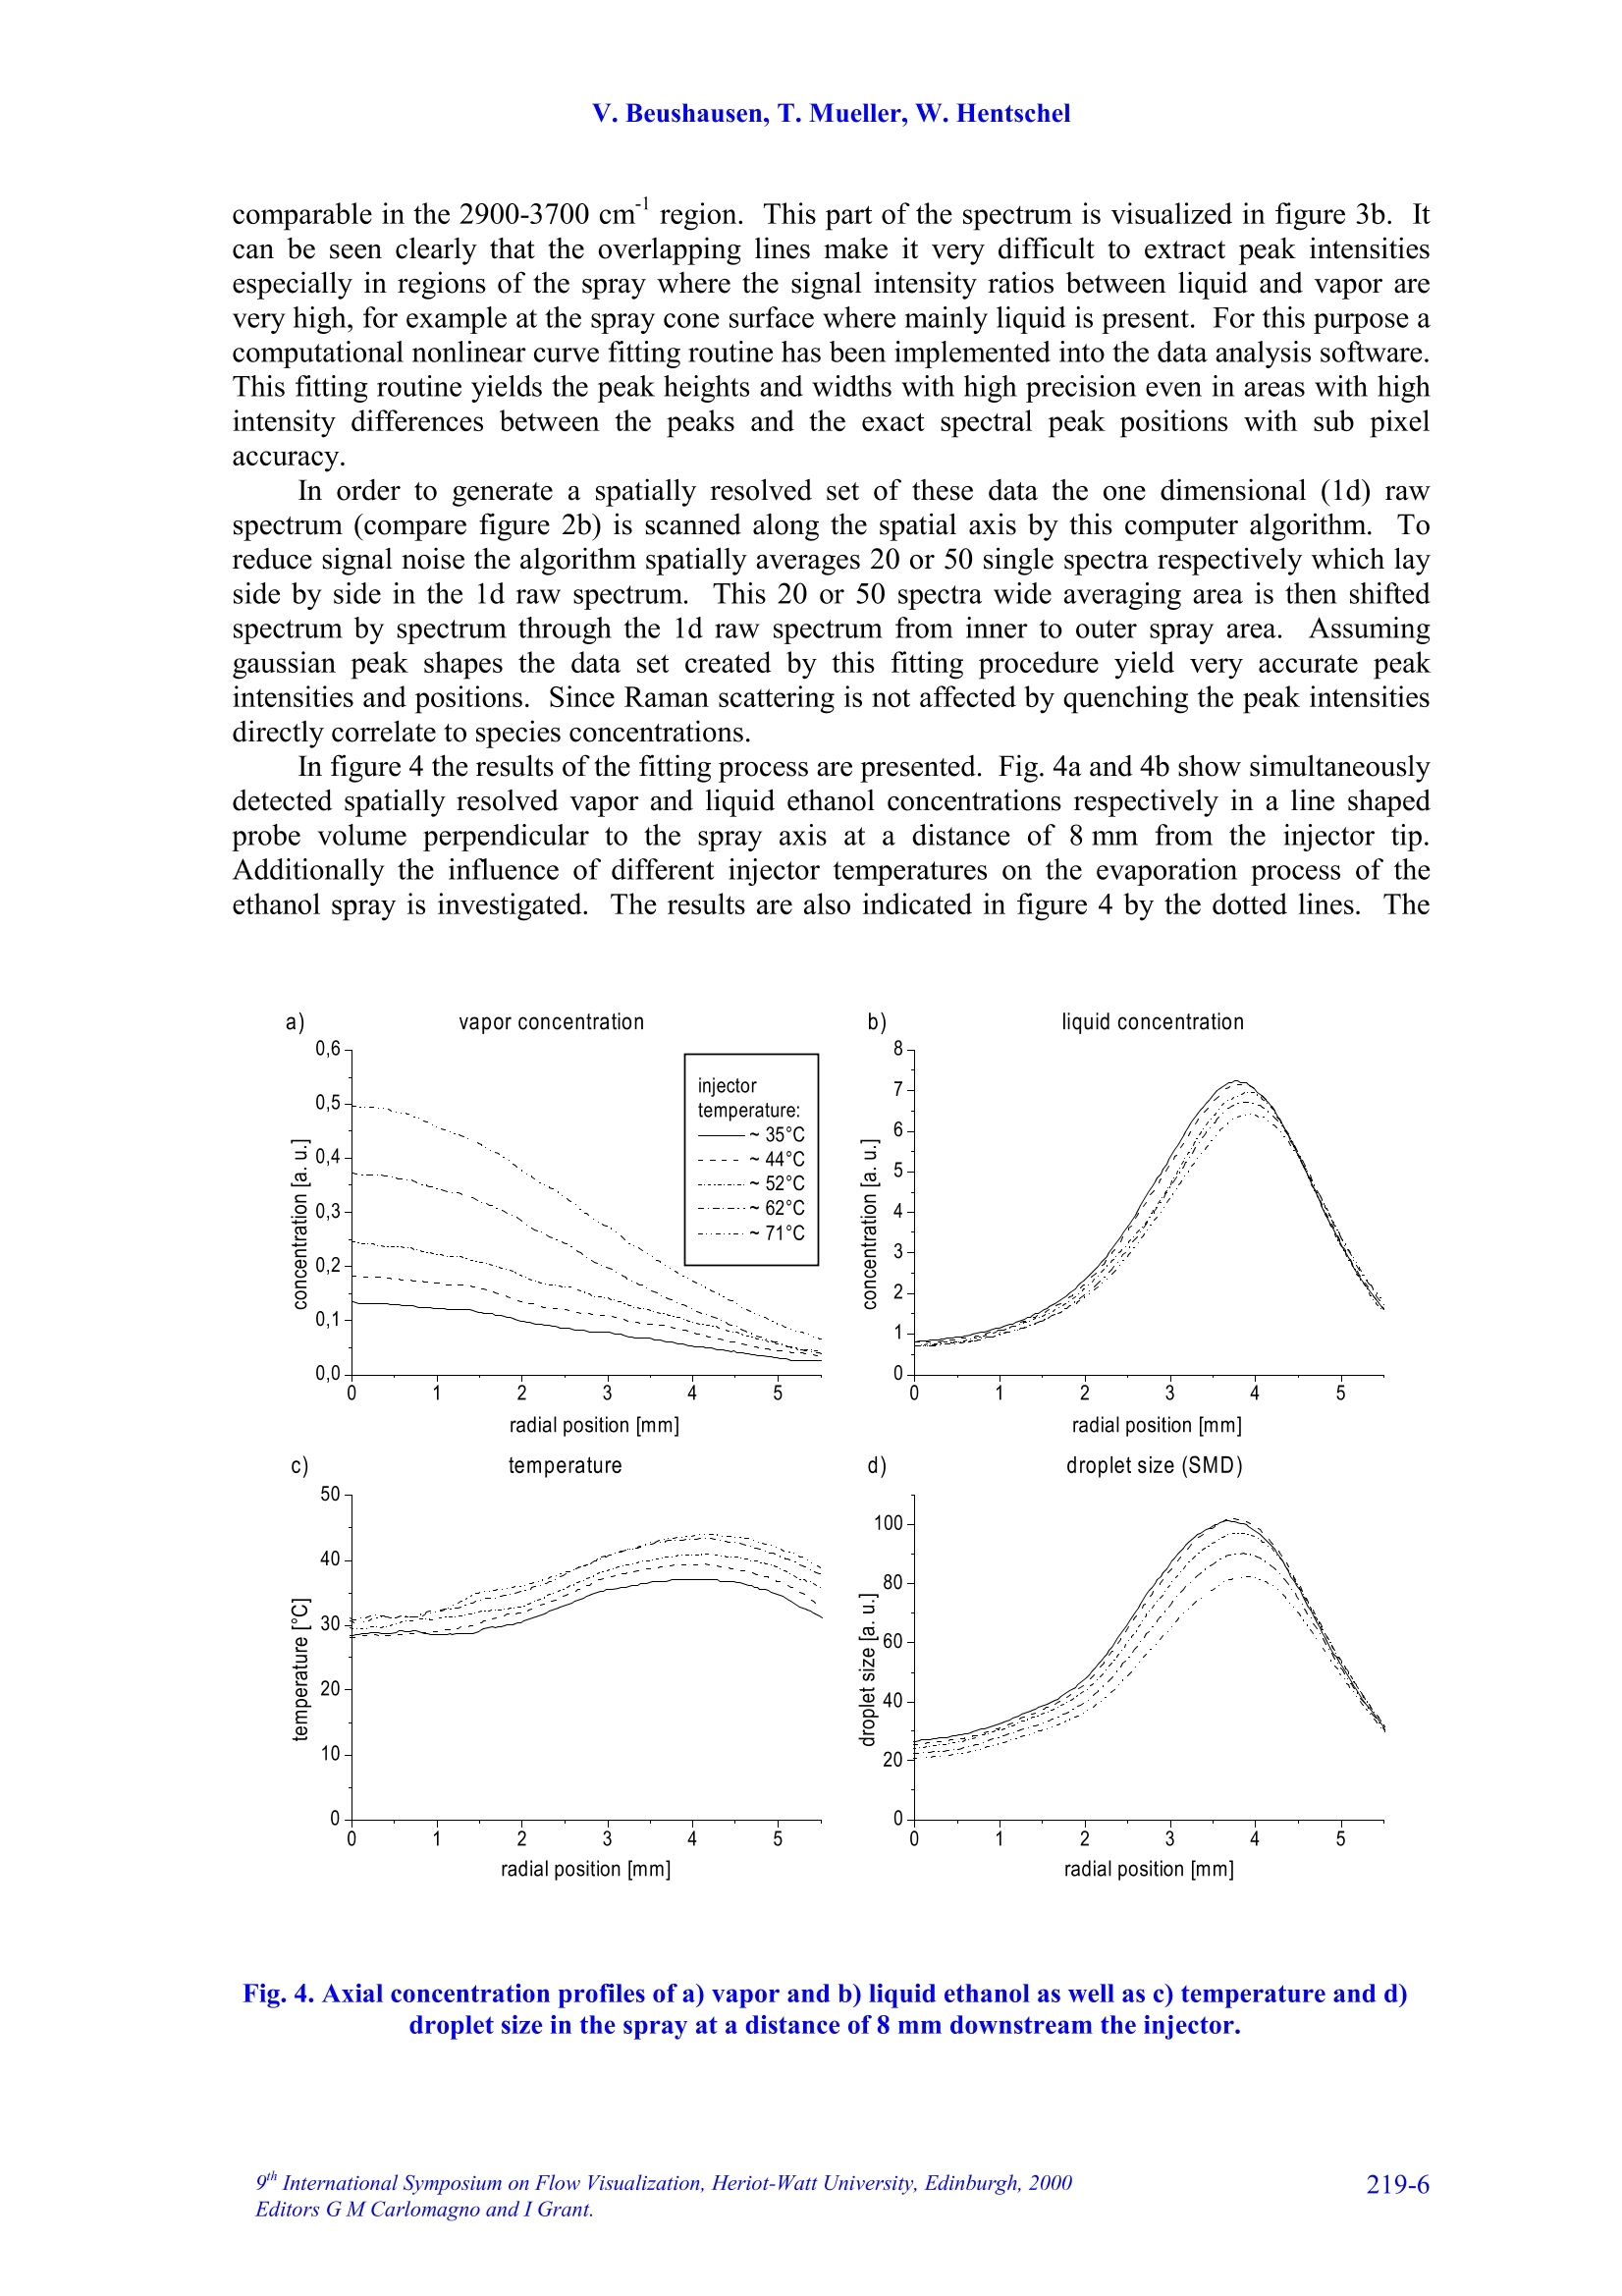
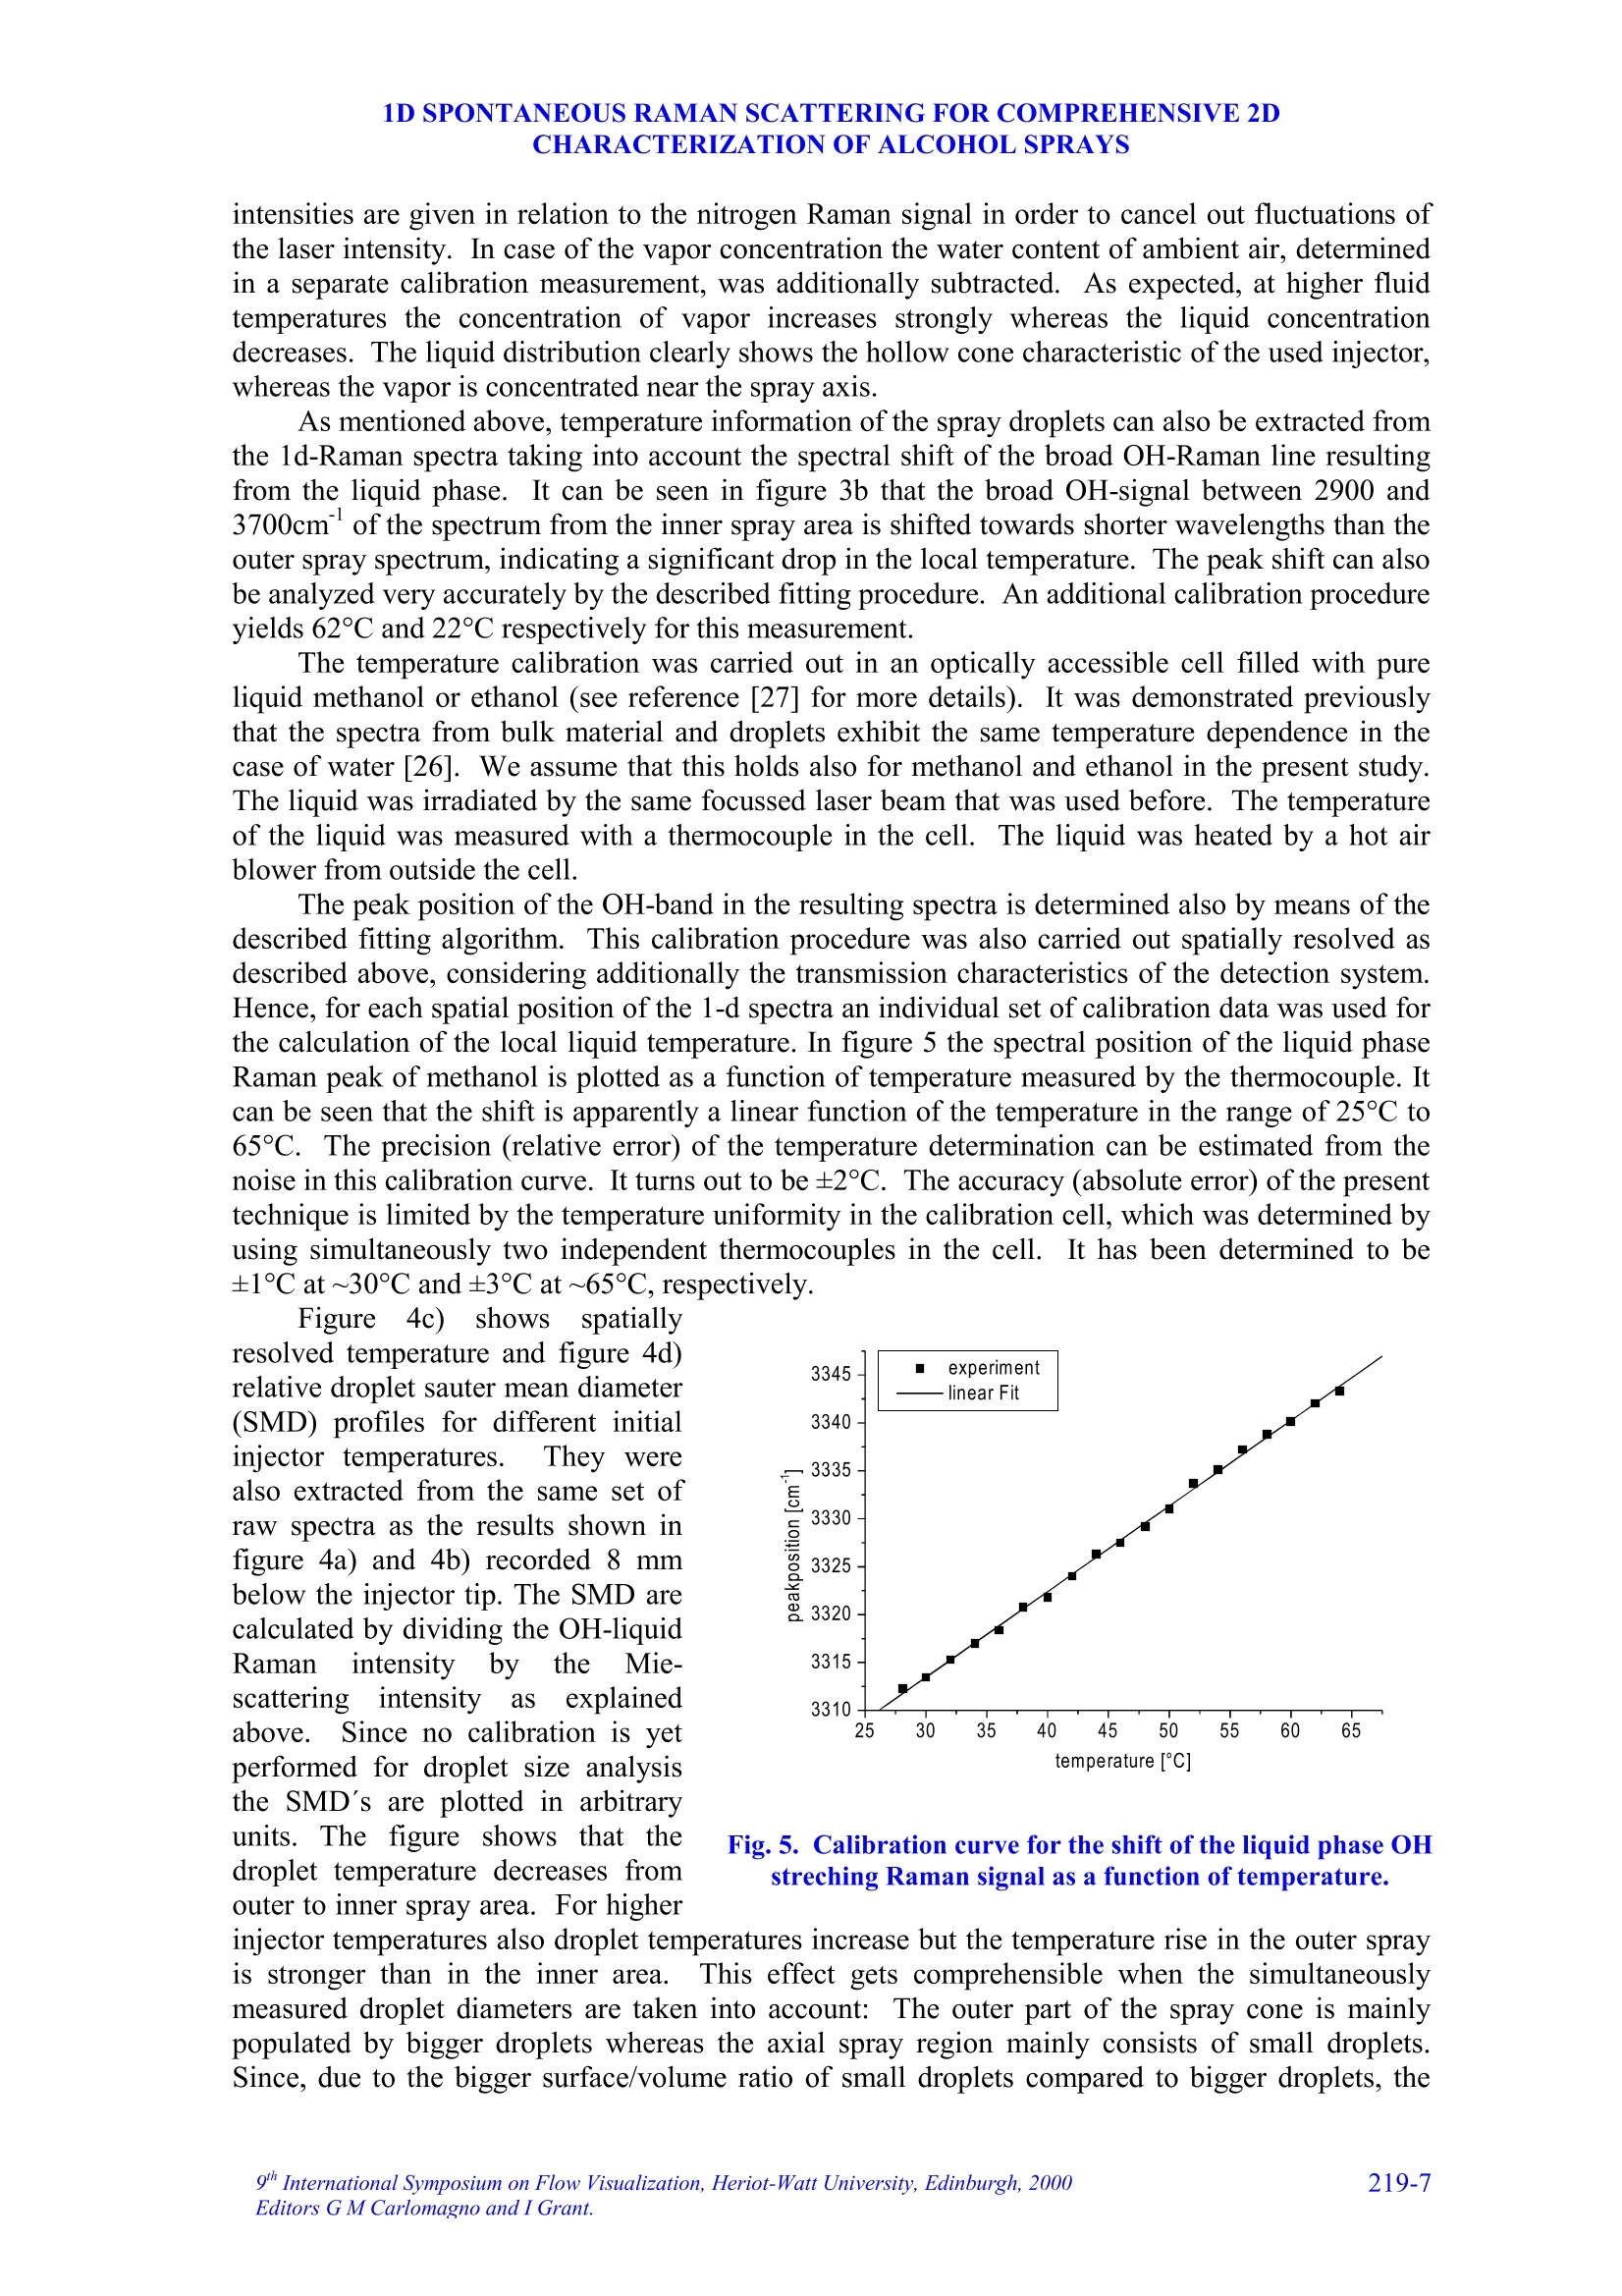
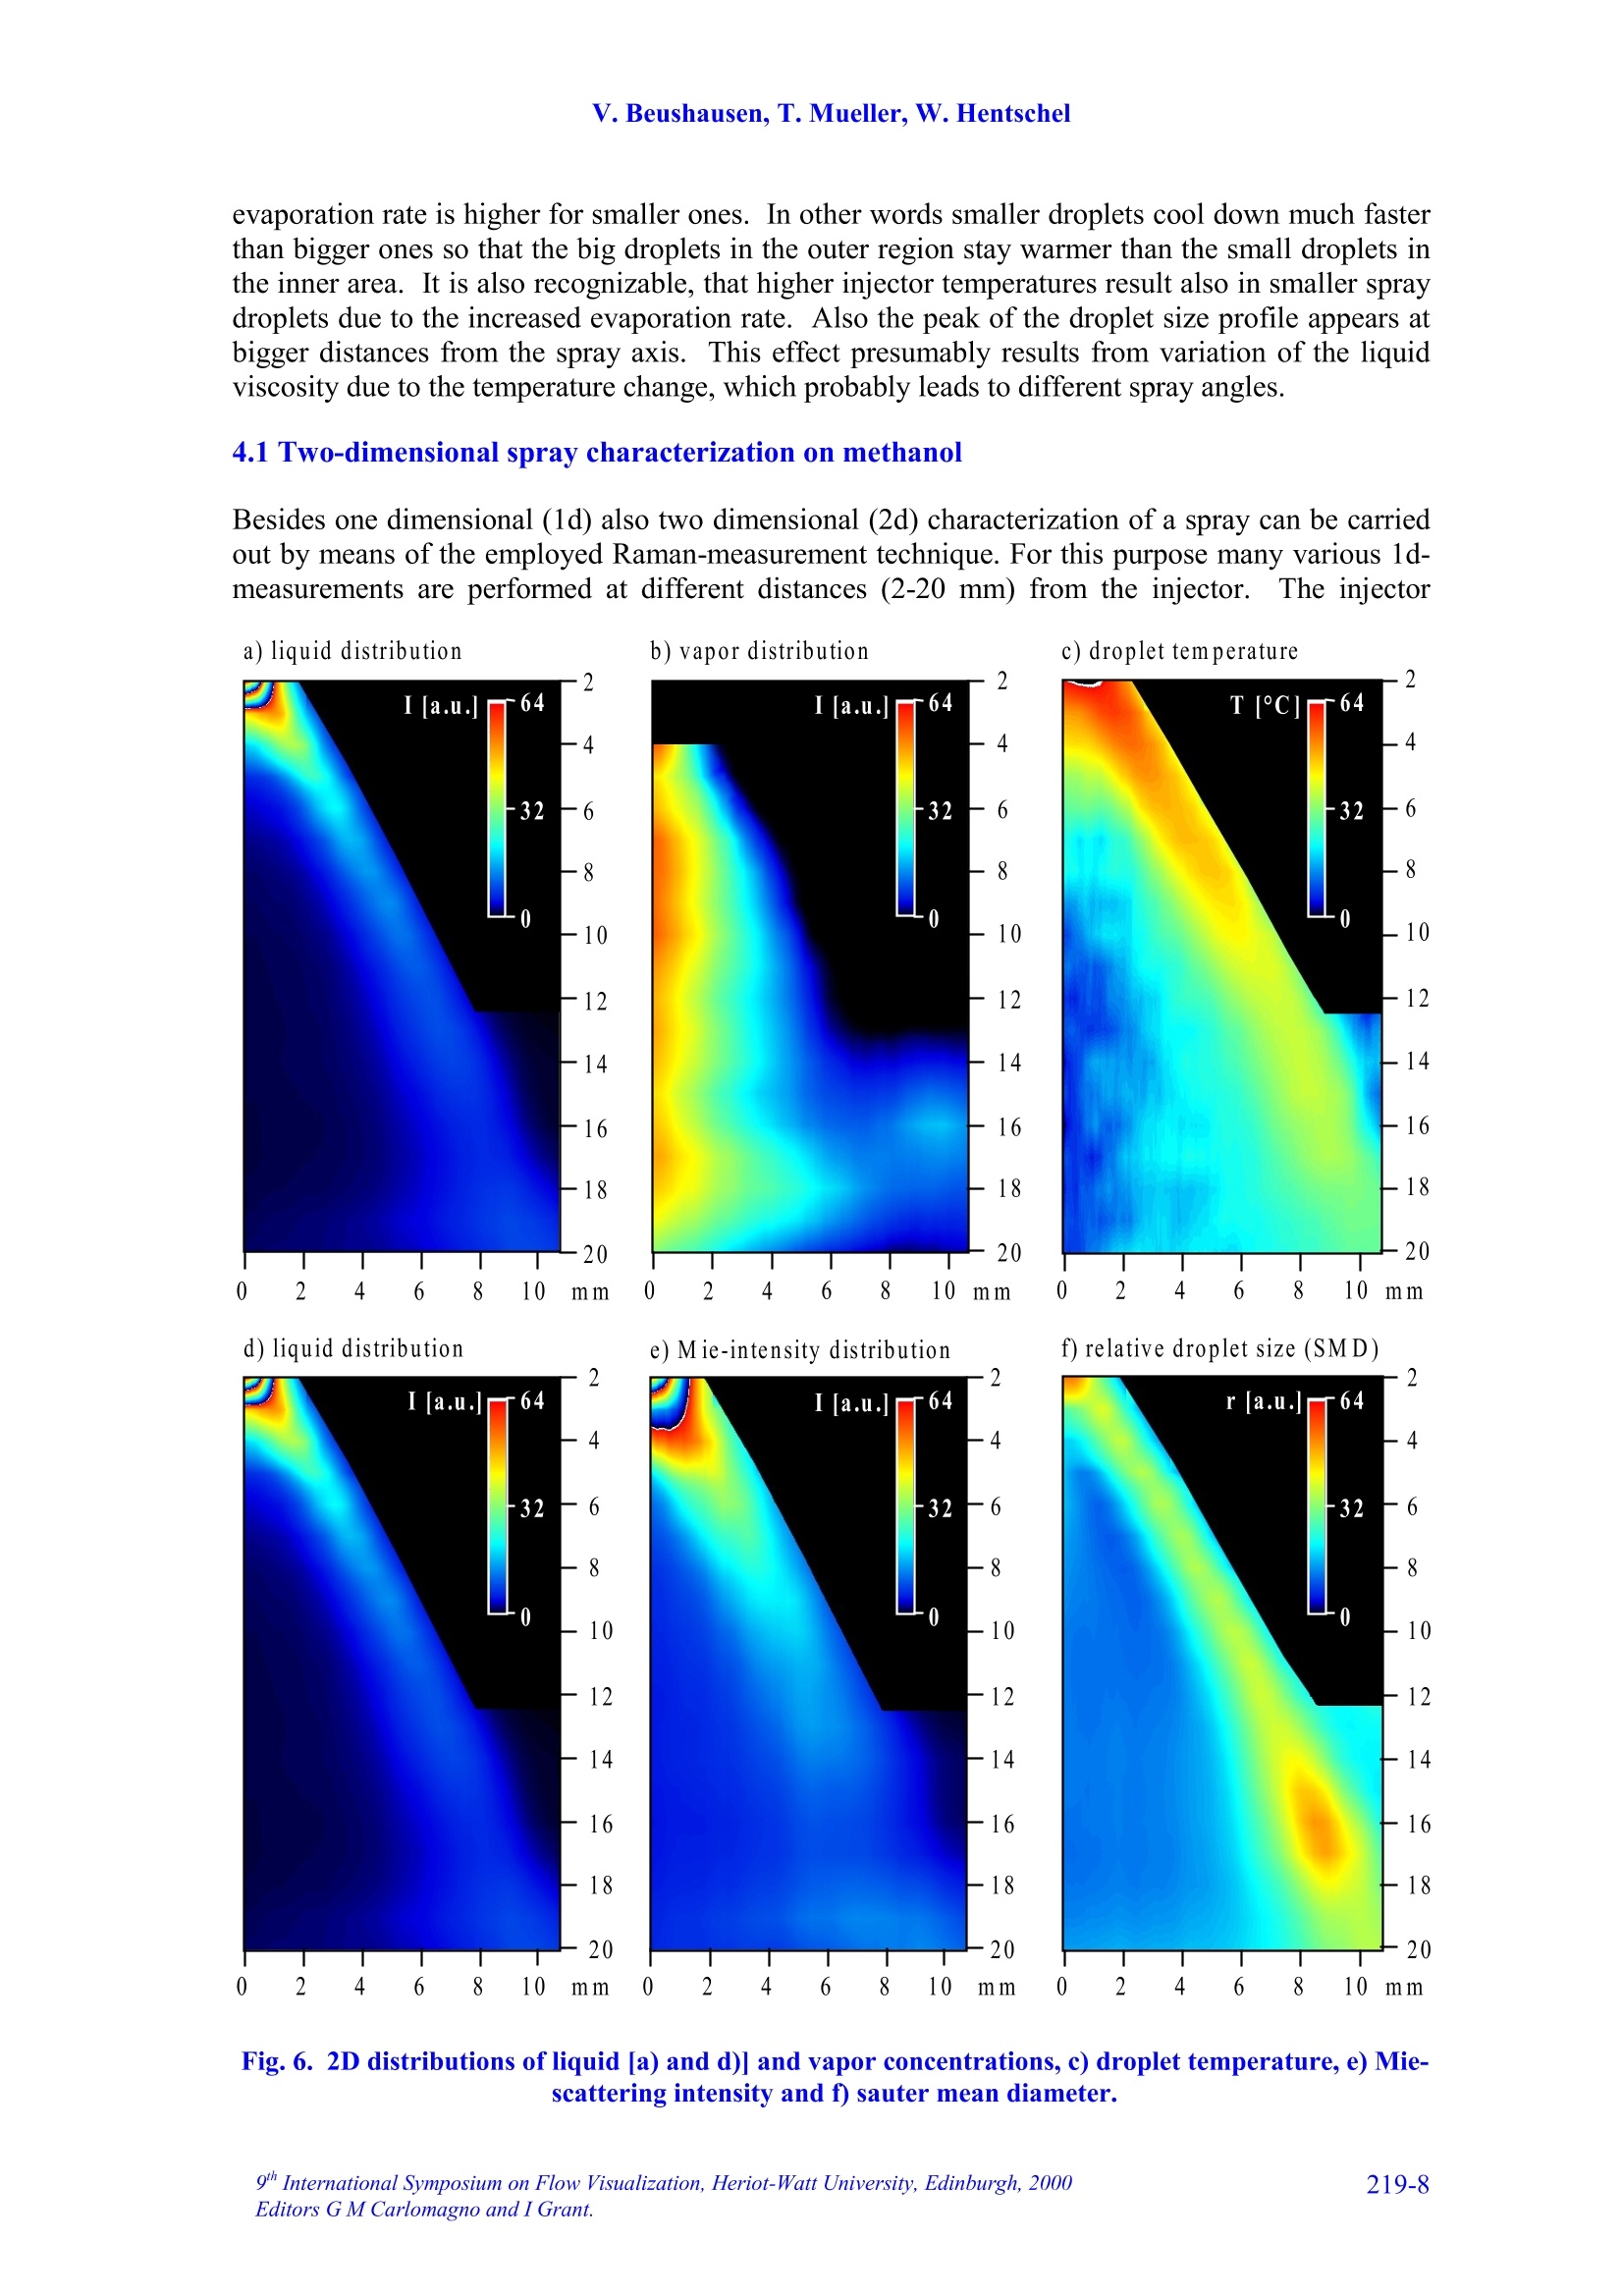
9TH.INTERNATIONAL SYMPOSIUM ON FLOW VISUALIZATION, 2000 V. Beushausen, T. Mueller, W. Hentschel 1D SPONTANEOUS RAMAN SCATTERING FORCOMPREHENSIVE 2D CHARACTERIZATIONOFALCOHOL SPRAYS V. Beushausen ,T.Mueller, W. Hentschel Keywords: sprays, raman scattering, planar distribution, droplet diameter, droplettemperature, liquid, vapor ABSTRACT This paper demonstrates the application of a non intrusive laser measurement technique based onspontaneous Raman scattering for a comprehensive spatially resolved characterization of sprays. Themethod offers the possibilty for a simultaneous quantitative mapping of averaged liquid and vapordistributions as well as droplet temperatures and droplet diameters inside methanol and ethanol sprays. Theinvestigations are carried out on hollow cone sprays generated by a pulsed automotive fuel injector.Resulting one- and two-dimensional distributions of liquid and vapor concentrations and droplettemperature as well as droplet size distributions will be presented and discussed in detail. 1INTRODUCTION The atomization and evaporation of liquid fluids plays an important role in a variety of differentindustrial applications. Especially combustion systems like car engines, turbines and all kind ofburners used for heating purposes rely on a proper atomization of liquid hydrocarbon fuel. In allapplications the quality of the mixture preparation process depends strongly on the atomizationbehavior of the fuel injector. For this reason a comprehensive knowledge of the injector inducedspray characteristics is vital for a good injector design. Particularly quantitative spatially resolveddata of liquid and vapor concentrations as well as droplet temperature and droplet sizes inside thespray cone are very important. Up to now no measurements are reported which can determine all these spray propertiessimultaneously and spatially resolved. In recent years mainly phase doppler anemometry (PDA) isapplied in order to measure droplet sizes and velocities.i.Unfortunately PDAperformsmeasurements only on discrete spatial points so that a two dimensional spray characterization isvery time consuming. Since the technique relies strongly on a good overlap of two single focussedlaser beams measurements in dense sprays, where droplet induced beam steering effects occur, isvery difficult. Recently planar laser induced fluorescence of exciplex-tracers (PLIEF) is used in order tomeasure 2d-vapor/liquid profiles [1 -3]. Due to different vapor pressures of exciplex (excited statecomplex) and spray fluid the application of PLIEF is limited to fluids which match the vaporpressure of the exciplex. Also Raman and combined Raman/Fluorescence-as well as Raman/Mie-measurement techniques have been applied for vapor/liquid and evaporation investigations [4-14]Only very few laser based methods for non-intrusive temperature determination in micro Author(s): 1,2Laser-Laboratorium Goettingen e.V., Hans-Adolf-Krebs-Weg 1, D-37077 Goettingen, Germany. Volkswagen AG, Forschung & Entwicklung,EZMM 1785, D-38436 Wolfsburg,Germany droplets have been reported. Thus the temperature has rarely been mapped in sprays [15]. Onemethod is also based on exciplex fluorescence of a suitable tracer [16, 17]. However there are somemajor drawbacks with this technique. First it must be possible to dope the fuel with the tracer.Second, the quantification of the data is problematic when oxygen is present in the spray. Thereare only a few tracers which are unaffected by oxygen quenching [18]. Other methods whichrequire thermochromic additives are described elsewhere [19]. Another method for temperaturedetermination of microdroplets, which does not necessarily require any additives, is based onmorphology dependent resonances (MDR’s) of laser induced emissions [20, 21]. The MDR’s arestrongly dependent on the refractive index of the liquid, which reflects minute temperaturechanges.However this method requires highly monodisperse droplets since the MDR's arestrongly dependent on the droplet size too.Hence this method can hardly be applied topolydisperse ensembles of droplets, which are found in most realistic sprays. . In contrast to that in this work a nonintrusive optical measurement technique based onspontaneous Raman scattering is presented, which allows a simultaneous quantitative and spatiallyresolved acquisition of all spray properties mentioned above, when using methanol or ethanol asfuel. Only a brief description on the basics of Raman spectroscopy will be given here, for moredetails see for example reference [22]. Rotational or vibrational Raman scattering describes a nonresonant inelastic interaction of light, commonly an incident laser beam, with molecules. Theenergy shift between laser excitation and the emissions, the Raman shift, depends on the rotationaland vibrational energies of the molecular species under investigation. The energetic structure of amolecule and therefore also the Raman shift depend strongly on the intermolecular forcesConsequently, the Raman-emission spectrum can be used to discriminate between differentmolecular species. This effect is frequently used in combustion diagnostics (see for example [23]).The signal strength of spontaneous Raman scattering is proportional to the irradiated laser energyand the number density of molecules in a certain vibrational or rotational state. Because it is notrelated to intermolecular transitions between different energy levels, like fluorescence, thescattering intensities are very weak. For that reason focused laser beams with high power densityare necessary. In contrast to fluorescence however Raman scattering yields highly quantitative databecause it is not effected by collisional quenching. In the presented work different Raman scattering properties are utilized in order tosimultaneously measure spatially resolved liquid and vapor concentrations as well as droplettemperatures and droplet sizes. The measurements are performed on pulsed methanoland ethanol sprays respectively which were generatedby an automotive gasoline direct injection valve. Theinjector is operated in ambient air at a backingpressure of 50 bar and a pulse duration of about1.5 ms. It is designed in order to generate a hollowspray cone. Measurements were carried out at 1.3 msafter start of injection. The injector could bepreheated up to temperatures of 70C in order tostudy the effect of altered fluid temperature on theatomization and evaporation behavior.The actualfluid temperature inside the injector differs slightlyfrom the measured temperature of the heated injectorcasing since the electric injector drive generatesadditional heat, which is not detected by thethermocouple. Consequently, the temperature valuesof the injector given later in the result section tend to Fig.1. Mie-scattering snapshot of theinvestigated pulsed hollow cone spray.Raman-measurements are performedinside the indicated rectangle. be lower than the actual fluid temperature at the valve exit. In order to get an impression of the spray cone shape, figure 1 shows a snapshot of a singleinjection at 1.3 ms after start of injection. The image is recorded by a CCD-Camera (LaVision,Imager 3, 12 bit, 1280 x 1024 pixels) by means of planar Mie-scattering. For visualization of thespray cone the spray is illuminated by a 30 mm high and 500 um thick laser light sheet of a XeCl-excimerlaser (308 nm) intersecting the spray axially. The frame inside this image indicates the areawhere the measurements with spontaneous Raman scattering are performed. Raman scattering is induced by UV-laser light generated by a KrF-excimer laser (LambdaPhysik EMG 160 MSC, wavelength 248 nm, pulse duration 20 ns, pulse energy up to 250 mJ).The laser beam is focussed by a spherical lens in order to form a horizontally orientated, lineshaped probe volume, that crosses the vertical spray axis. This setup is sketched in figure 2a. Thedimensions of the laser beam inside the probe volume are ~1.5 mm in depth and~0.5 mm in height.The power density in the probe volume was kept below 0.1 GW/cm, to avoid stimulated Ramanscattering [4, 5, 7, 8, 9] and air breakdown caused by additional laser beam focusing by means ofthe transparent droplets.Due to this necessary reduction of the power density only averagedmeasurements are possible. For detection of the laser induced emissions a spatially resolving optical multichannelanalyzer (SROMA) was used, consisting of an Acton Research Spectra Pro 275 imagingspectrograph (1800 groves/mm grating) and an intensified CCD-camera (LaVision, DynaMight, 16 bit dynamic range, 512 x 512 pixels).Asimilar setup isdescribed in more detailelsewhere [24].This setup generates two-dimensional images where ·one axiscorresponds to the spatial extension of the 12mm long line shaped probe volume whereasthee second axisprovidess thespectralinformation (see figure 2b). The grating usedin the SROMA-system offers a spectral rangeof 245 nm -275 nm which corresponds to apossible Raman shift of about 0 -4000 cm at 248 nm excitation wavelength. MaximumRaman signal strength isachievedbbyorientating the electrical field vector of thelinear polarized laser beam parallel to thespray axis which results in maximum Ramanscattering in a plane perpendicular to thespray axis where the detection system islocated.i1The strong Mie-scattering signaloriginating from spray droplets is efficientlyattenuated by a 10 mm thick buthylacetatefilter.Despite of the huge difference insignal strength between the week Raman-and the strong Mie-emissionsIStthe Mie-suppression in conjunction with the highdynamic range of the CCD-camera makes itpossible to simultaneouslyydetect bothRaman and Mie-scattering signals. It should be noted here, that in case ofdense sprays the initial laser beam as well asthe Raman scattered light underlies multiplescattering on the spray droplets. It is shownthat this leads to partial depolarization of theRaman signal and hence to variation of thedetected Ramansignal strength. Theinvestigations presented here are carried out Intensity Fig. 2. In part a) of the figure the dimension andthe position of the line shaped detection volumeis indicated. Part b) shows an example of aspatially resolved Raman spectrum measured with the SROMA. on sprays with moderate droplet density and it is verified, that this depolarization effect isnegligible for current measurements. 3 DATA ANALYSIS An example of a recorded raw spectrum of a methanol spray is shown in fig. 2b. It is taken 8 mmbelow the injector tip at an injector temperature of about 64°C. The spectrum is averaged over 400inele iniestions InIn tthhiiss ssnpaattiiially resolved emission spectrum the signal intensities are codedaccording to the gray scale shown at the bottom of the figure. In order to represent also lowintensity Raman lines with good resolution the gray scale needed to be repeated several times forhigher intensity lines. This results in a contour line like peak representation especially for Mie-,CH- and liquid phase OH-signals. Several spatially resolved laser induced emissions can be identified on the vertical (spectral)axis..l From shorter to longer wavelengths (top to bottom) following emissions appear: Mie-scattering (at 0 cm) and the vibrational Raman lines of O2 (at 1556 cm), Nz (at 2330 cm), CH(around 2900 cm), OH (2900-3700 cm , originating from liquid methanol only) and OH (at3683 cm , originating from vaporized methanol). 3.1Vapor liquid separation The spatially resolved CH-Raman signal indicates the distribution of both, liquid and vaporizedmethanol inside the spray cone. It is visible that at the observed position in the spray most of themethanol mass is localized at around 5 mm distance from the spray axis. Nevertheless a distinctamount of methanol is also detectable inside the spray cone. By analyzing just the spatiallyresolved CH-Raman signal it is not possible though to distinguish between liquid and vaporizedfluid. However a separation of liquid and vapor and a simultaneous detection of their spatialdistribution inside the spray is shown to be possible by including both OH-Raman emissions intothe analysis [25, 26]. AAss mmeennttioned above the spectrally sharp OH-emission at 3683 cm-1originates only from gaseous methanol whereas the broad OH-emission around 2900-3700 cmoriginates exclusively from liquid methanol.1.The shift in frequency and the strong spectralbroadening are due to the effect of hydrogen bonding which generates a deformation of theelectronic potential and subsequently a shift of the vibrational energy levels [25, 26]. The spatial intensity distribution of the broad OH-Raman line of liquid methanol indicates,that liquid is mainly distributed directly on the spray cone mantle. In contrast to that, vaporizedmethanol is mainly detected inside the spray cone around the spray axis. The Raman lines of N2 and O2 do not show strong spatial intensity variations which is to beexpected. The slight decrease in signal intensity to both sides of the image results from thetransmission characteristics of the OMA-system. For further data evaluation this spatially variabletransmission is corrected using a spectrum which was taken from homogeneously distributed air. 3.2 Determination of droplet temperature As mentioned above the spectral position and the shape of certain Raman peaks are sensitivelydependent on intermolecular forces (hydrogen bonding). This spectral shift is additionallyinfluenced by the temperature of the liquid. It results from the fact that a certain fraction of themolecules form polymers in the liquid phase, and this fraction decreases with increasingtemperature. Thermometry of liquid water has already been accomplished by means of thevariation of the spectral shift of the broadened OH- stretching band [25, 26]. It was shown by theauthors already that the same method is also applicable to alcohols [27]. Here as well the spectralshift of the OH Raman line, which is broadened by hydrogen bonding, yields temperatureinformation. 1D SPONTANEOUS RAMAN SCATTERING FOR COMPREHENSIVE 2DCHARACTERIZATION OF ALCOHOL SPRAYS 3.3 Determination of droplet diameters Besides the separate detection of liquid and vaporized fluid and the determination of the droplettemperatures it is also possible to simultaneously extract the sauter mean diameter (SMD) from theidentical set of data..The determination of the SMD is based on the different dependency ofRaman- and Mie scattered light intensity from droplet diameter. Raman scattered light originatesout of the whole droplet volume and its intensity I mainly scales with the third power of the radiusr (Ir~r). In contrast Mie-scattered light originates from the droplet surface so that the lightintensity mainly scales with the second power of the radius (Im~r’). If both intensities are detectedsimultaneously their quotient therefore scales with droplet radius alone. A similar technique basedon the relation of liquid fluorescence (Ir~r’) and Mie-signal (Im~r’) of a dye doped spray isdescribed elsewhere [10, 11]. It yields a two dimensional droplet size distribution but is limited tonon evaporating sprays only. 4 RESULTS AND DISCUSSION 4.1 One dimensional spray characterization on ethanol It is shown already that a one dimensionally, spatially resolved UV-Raman spectrum containingCH-and OH-stretch vibrational Raman lines of alcohols as wwell as the Miescattered light from the spray dropletsyield simultaneous quantitativeinformation on the distribution of liquidand vapor, temperature as well as dropletdiameters inside a spray.In order toextract accurate information from suchspectra a correct measurement of peakpositions, peak widths and peak heights isvital. Due to overlapping CH-and OH-Raman lines and strongly varying lineintensities in dependence on the spatialposition inside theSspraytthis is achallenging demand. lnfigure3 this difficulty isillustrated-withtwoemissionspectraoriginatingg from different spatialpositions inside an ethanol spray. Theyare extracted from a one dimensionallyspatially resolved spectrum (similar tothat in figure 2b) taken 8 mm below theinjector tip at an injector temperature of70℃. The spectrum was averaged over400 single injections. The spectrum,represented by a dotted line, is taken atthe spray cone mantle (outer region)where most of the liquid is concentratedand the outlined spectrum is taken on thespray axis (inner region) where both,liquid and vapor are present. Theintensities of the axial spectrum has beenenlarged by a factor of 10 so that thesignal intensities of both spectra are Fig.3. Two Raman-spectra extracted from an spatiallyresolved spectrum in the inner and outer spray areas.The spectra in a) show all detected emissions whereas b)shows the liquid and vapor phase OH-streching Ramansignals in more detail. comparable in the 2900-3700 cm region. This part of the spectrum is visualized in figure 3b. Itcan be seen clearly that the overlapping lines make it very difficult to extract peak intensitiesespecially in regions of the spray where the signal intensity ratios between liquid and vapor arevery high, for example at the spray cone surface where mainly liquid is present. For this purpose acomputational nonlinear curve fitting routine has been implemented into the data analysis software.This fitting routine yields the peak heights and widths with high precision even in areas with highintensity differences between the peaks and the exact spectral peak positions with sub pixelaccuracy. In order to generate a spatially resolved set of these data the one dimensional (1d) rawspectrum (compare figure 2b) is scanned along the spatial axis by this computer algorithm. Toreduce signal noise the algorithm spatially averages 20 or 50 single spectra respectively which layside by side in the 1d raw spectrum. This 20 or 50 spectra wide averaging area is then shiftedspectrum by spectrum through the 1d raw spectrum from inner to outer spray area. Assuminggaussian peak shapes the data set created by this fitting procedure yield very accurate peakintensities and positions. Since Raman scattering is not affected by quenching the peak intensitiesdirectly correlate to species concentrations. In figure 4 the results of the fitting process are presented. Fig. 4a and 4b show simultaneouslydetected spatially resolved vapor and liquid ethanol concentrations respectively in a line shapedprobe volume perpendicular to the spray axis at a distance of 8 mm from the injector tip.Additionally the influence of different injector temperatures on the evaporation process of theethanol spray is investigated. The results are also indicated in figure 4 by the dotted lines.. The Fig.4. Axial concentration profiles of a) vapor and b) liquid ethanol as well as c) temperature and d)droplet size in the spray at a distance of 8 mm downstream the injector. intensities are given in relation to the nitrogen Raman signal in order to cancel out fluctuations ofthe laser intensity. In case of the vapor concentration the water content of ambient air, determinedin a separate calibration measurement, was additionally subtracted. As expected, at higher fluidtemperatures the concentration of vapor increases strongly whereas the liquid concentrationdecreases. The liquid distribution clearly shows the hollow cone characteristic of the used injector,whereas the vapor is concentrated near the spray axis. As mentioned above, temperature information of the spray droplets can also be extracted fromthe 1d-Raman spectra taking into account the spectral shift of the broad OH-Raman line resultingfrom the liquid phase. It can be seen in figure 3b that the broad OH-signal between 2900 and3700cm°of the spectrum from the inner spray area is shifted towards shorter wavelengths than theouter spray spectrum, indicating a significant drop in the local temperature. The peak shift can alsobe analyzed very accurately by the described fitting procedure. An additional calibration procedureyields 62℃ and 22°℃ respectively for this measurement. The temperature calibration was carried out in an optically accessible cell filled with pureliquid methanol or ethanol (see reference [27] for more details). It was demonstrated previouslythat the spectra from bulk material and droplets exhibit the same temperature dependence in thecase of water [26]. We assume that this holds also for methanol and ethanol in the present study.The liquid was irradiated by the same focussed laser beam that was used before. The temperatureof the liquid was measured with a thermocouple in the cell. The liquid was heated by a hot airblower from outside the cell. The peak position of the OH-band in the resulting spectra is determined also by means of thedescribed fitting algorithm. This calibration procedure was also carried out spatially resolved asdescribed above, considering additionally the transmission characteristics of the detectio/nL VVsyIstem.Hence, for each spatial position of the 1-d spectra an individual set of calibration data was used forthe calculation of the local liquid temperature. In figure 5 the spectral position of the liquid phaseRaman peak of methanol is plotted as a function of temperature measured by the thermocouple. Itcan be seen that the shift is apparently a linear function of the temperature in the range of 25°℃ ta65°C. The precision (relative error) of the temperature determination can be estimated from thenoise in this calibration curve. It turns out to be ±2C. The accuracy (absolute error) of the presenttechnique is limited by the temperature uniformity in the calibration cell, which was determined byusing simultaneously two independent thermocouples in the cell. It has been determined to be±1°C at~30°℃ and ±3°℃ at ~65°C, respectively. Figure: 4c) showsspatiallyresolved temperature and figure 4d)relative droplet sauter mean diameter(SMD) profiles for different initialinjector temperatures. They werealso extracted from the same set ofraw spectra as the results shown infigure 4a) and 4b) recorded 8 mmbelow the injector tip. The SMD arecalculated by dividing the OH-liquidRamanintensity byttheMie-scattering intensity asexplainedabove. Since no calibration is yetperformed for droplet size analysisthe SMD’s are plotted in arbitraryunits. The figure shows that thedroplet temperature decreases fromouter to inner spray area. For higher Fig.5. Calibration curve for the shift of the liquid phase OHstreching Raman signal as a function of temperature. injector temperatures also droplet temperatures increase but the temperature rise in the outer sprayis stronger than in the inner area.1. This effect gets comprehensible when the simultaneouslymeasured droplet diameters are taken into account: The outer part of the spray cone is mainlypopulated by bigger droplets whereas the axial spray region mainly consists of small droplets.Since, due to the bigger surface/volume ratio of small droplets compared to bigger droplets, the evaporation rate is higher for smaller ones. In other words smaller droplets cool down much fasterthan bigger ones so that the big droplets in the outer region stay warmer than the small droplets inthe inner area. It is also recognizable, that higher injector temperatures result also in smaller spraydroplets due to the increased evaporation rate. Also the peak of the droplet size profile appears atbigger distances from the spray axis.3T.his effect presumably results from variation of the liquidviscosity due to the temperature change, which probably leads to different spray angles. 4.1 Two-dimensional spray characterization on methanol Besides one dimensional (1d) also two dimensional (2d) characterization of a spray can be carriedout by means of the employed Raman-measurement technique. For this purpose many various 1d-measurements are performed at different distances (2-20 mm) from the injector.The injector a) liquid distribution b) vapor distribution c) droplet tem perature 0 Fig. 6. 2D distributions of liquid [a) and d)] and vapor concentrations, c) droplet temperature, e) Mie-scattering intensity and f) sauter mean diameter. temperature was 65℃. In order to generate a 2d-representation of the generated multiple 1d-datasets an interpolation algorithm is applied. The resulting 2d-distributions are shown in figure 6. Forbetter comparability the 2d-distibution of liquid methanol is shown twice (see 6a and 6d). Theimages in the figure show a distinct correlation of the 2d-distributions of liquid,vapor, droplettemperature and droplet size where the droplet size distribution is calculated by dividing the local(liquid) Raman intensities (fig. 6d) by the local Mie-scattering intensities (fig.6e): As expected for this hollow cone spray the liquid mass is mainly localized on the mantle ofthe spray (see fig. 6a), whereas vaporized methanol appears in the spray center (see fig. 6b). Thisresult correlates well with the droplet size distribution (fig.6f) where big droplets are present onthe hollow spray cone mantle and small droplets are shifted toward the spray axis due to airentrainment. Also the droplet temperature distribution (fig. 6c) correlates very well with theseresults: On the spray cone mantle highest temperatures of about 65C are measured close to theinjector. Temperature is decreasing with increasing distance and is found to be approximately30℃ already 20 mm downstream. In the center of the spray droplet temperatures drop even fasterdown to approximately 10℃ due to the enhanced evaporation of the smaller droplets present in thatarea. The vapor and the droplet size distributions show a distinct spatial structure which differssignificantly from all other distributions:Especially at a position 16 mm downstream and inapproximately 9 mm radial distance an increase in droplet size is detected. This positioncorresponds very well with the vortex structure visible in the spray snapshot of figure 1. It is wellknown from PIV-investigations of this pulsed methanol spray that this vortex carries a significantamount of small droplets and methanol vapor from the spray cone mantle into the surrounding air.This effect is clearly visible also in the vapor distribution (fig. 6b). Accordingly the increaseddroplet size detected in this area results from the fact that small droplets are more affected by thevortex flow than bigger ones and are blown away so that a relatively higher amount of biggerdroplets contributes to the Sauter mean diameter. 5 CONCLUSION Spontaneous Raman scattering is a well know tool for quantitative measurements of speciesconcentrations. Although the physics of Raman spectroscopy allows to discriminate differentspecies due to their individual spectral fingerprints, in general it is not possible to separate differentphases. But for the analysis of the atomization and evaporation process of liquids in particular thephase separation of liquid and vapor is of interest. This limitation of Raman spectroscopy can beovercome using alcohol sprays for the investigations. Hydrogen bonding, occurring only in theliquid phase, changes intermolecular forces and therefor also the Raman spectrum. This allowsdiscrimination of liquid and vapor phase as well as determination of the droplet temperature andSauter mean diameter, by taking the simultaneously measured Mie scattering signal into account. In the presented work spontaneous Raman spectroscopy with one dimensional spatialresolution has been applied to methanol and ethanol sprays generated by an automotive valvegenerally used for gasoline direct injection. The recorded Raman spectra, averaged over severalhundred injections have been examined by a special computational non-linear peak fittingalgorithm to extract the peak intensities as well as their positions. As result the amount of liquidand vaporized methanol or ethanol, the droplet temperature and the Sauter mean diameter havebeen determined with one dimensional spatial resolution. By combination and interpolation ofseveral 1d-results from different locations inside the spray cone 2d-distributions of the liquid andvapor phase, droplet temperature and Sauter meandiameter are generated, offering acomprehensive 2d spay characterization. 6 ACKNOWLEDGEMENTS The authors would like to thank VOLKSWAGEN AG and the German Federal Ministry forScience and Education (BMBF) for financial support of the investigations. 7REFERENCES [1] Knapp M.,Luczak A., Beushausen V., Hentschel W., Andresen P.: SAE Technical Paper No.961122.1996. [2] Miinch K.-U., Kramer H., Leipertz A.: SAE Technical Paper No. 961930, 1996. [3] Kramer H., Miinch K.-U., Leipertz A.: SAE Technical Paper No. 972946,1997. [4] Mewes B., Bauer G., Bruggemann D.: Appl.Opt, Vol. 38, No. 6, 1999 [5] Mewes B., Bauer G., Bruggemann D.: Laser Applications to Chemical and Environmental Analysis,OSA Technical Digest Series (Optical Society of America, Washington, D.C.) Vol. 3, pp. 184-186,1998. [6] Serpengiizel A., Swindal J. C., Chang R. K., Acker W. P.: Appl. Opt., Vol. 31, No.18, 1992. [7] Acker W. P., Serpengiizel A., Chang R. K., Hill S. C.: Appl. Phys. B 51, pp. 9-16,1990. [8] Lin H.-B., Campillo A.J.: Optics Communications 133, pp. 287-292, 1997. [9] Vehring R. and Schweiger G.: J. Aerosol Sci. 22, pp.399-402,1991. [10]Schweiger G.:J. Aerosol Sci. Vol. 21, No. 4, 99. pp. 483-509,1990. [11]Kamimoto T.: Intern. Symp.COMODIA 94, 1994. [12]Su,J.,Ginestet J., and RudoffR.: Proc. VSJ-SPIE98, Yokohama, Japan, 1998. [13]Cunningham K., Lyons P. A.: J.Chem. Phys., Vol.59, No. 4, 1973. [14]Megahed M.: SAE Technical Paper No.930969,1993. [15]Murray A. M., Melton L.A.: Appl.Opt. 24,2783,1985. .[16]Gossage H. E., Melton L. A.: Appl. Opt. 26,2256,1987. [17]Bai F., Melton L. A.: Appl. Spectrosc. 51 (9), 1276,1997. [18]Chen G., Mazumder M. M., Chang R. K., Swindal J., Acker W. P.: Prog. Energy Combust. Sci. 22,163 ,1996. ( [19]Massoli P., Beretta F., Alessio A . D., Lazzaro M.:Appl. Opt. 32,3295,1993. ) [20]Devarakonda V., Ray A. K., Kaiser T., Schweiger G.: Aerosol Sci. Technol. 28, 531,1998. [21]Schweiger G.: J. Aerosol Sci. Vol. 21, No.4,99.483-509,1990. [22]Knapp M., Beushausen V., Hentschel W., Manz P., Gruenefeld G., Andresen P.: SAE Technical PaperSeries No. 970827,1997. [23]Reckers W., Hiiwel L., Grinefeld G.: Appl. Opt. 32(6),907,1993. [24]Walrafen G. E., Fisher M. R., Hokmabadi M. S., Yang W. H.: J.Chem. Phys. 85, 6970, 1986. [25]Vehring R., Schweiger G.: Appl. Spectr. 46 (1),25,1992 ( [26]Muller T., Grunefeld G., B e ushausen V.: Appl. Phys. B 6 9 , 1-4 , 1999 . ) Corresponding author: V. Beushausenaper number International Symposium on Flow Visualization, Heriot-Watt University, Edinburgh, ditors G M Carlomagno and I Grant. This paper demonstrates the application of a non intrusive laser measurement technique based onspontaneous Raman scattering for a comprehensive spatially resolved characterization of sprays. Themethod offers the possibilty for a simultaneous quantitative mapping of averaged liquid and vapordistributions as well as droplet temperatures and droplet diameters inside methanol and ethanol sprays. Theinvestigations are carried out on hollow cone sprays generated by a pulsed automotive fuel injector.Resulting one- and two-dimensional distributions of liquid and vapor concentrations and droplettemperature as well as droplet size distributions will be presented and discussed in detail.
确定
还剩8页未读,是否继续阅读?

产品配置单


北京欧兰科技发展有限公司为您提供《二维酒精喷雾中拉曼散射检测方案(激光粒度仪)》,该方案主要用于其他中拉曼散射检测,参考标准--,《二维酒精喷雾中拉曼散射检测方案(激光粒度仪)》用到的仪器有LaVision SprayMaster 喷雾成像测量系统、PLIF平面激光诱导荧光火焰燃烧检测系统、德国LaVision PIV/PLIF粒子成像测速场仪、汽车发动机多参量测试系统
推荐专场


汽车尾气分析仪
更多

相关方案
更多
该厂商其他方案
更多