


方案详情
文
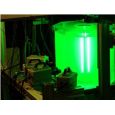
采用LaVision的时间分辨PIV系统测量了固体火箭发动机在风洞中的热气流喷射过程,并研究了喷射火焰热的内核与环绕热核的外部气体流动之间的相互作用。
方案详情

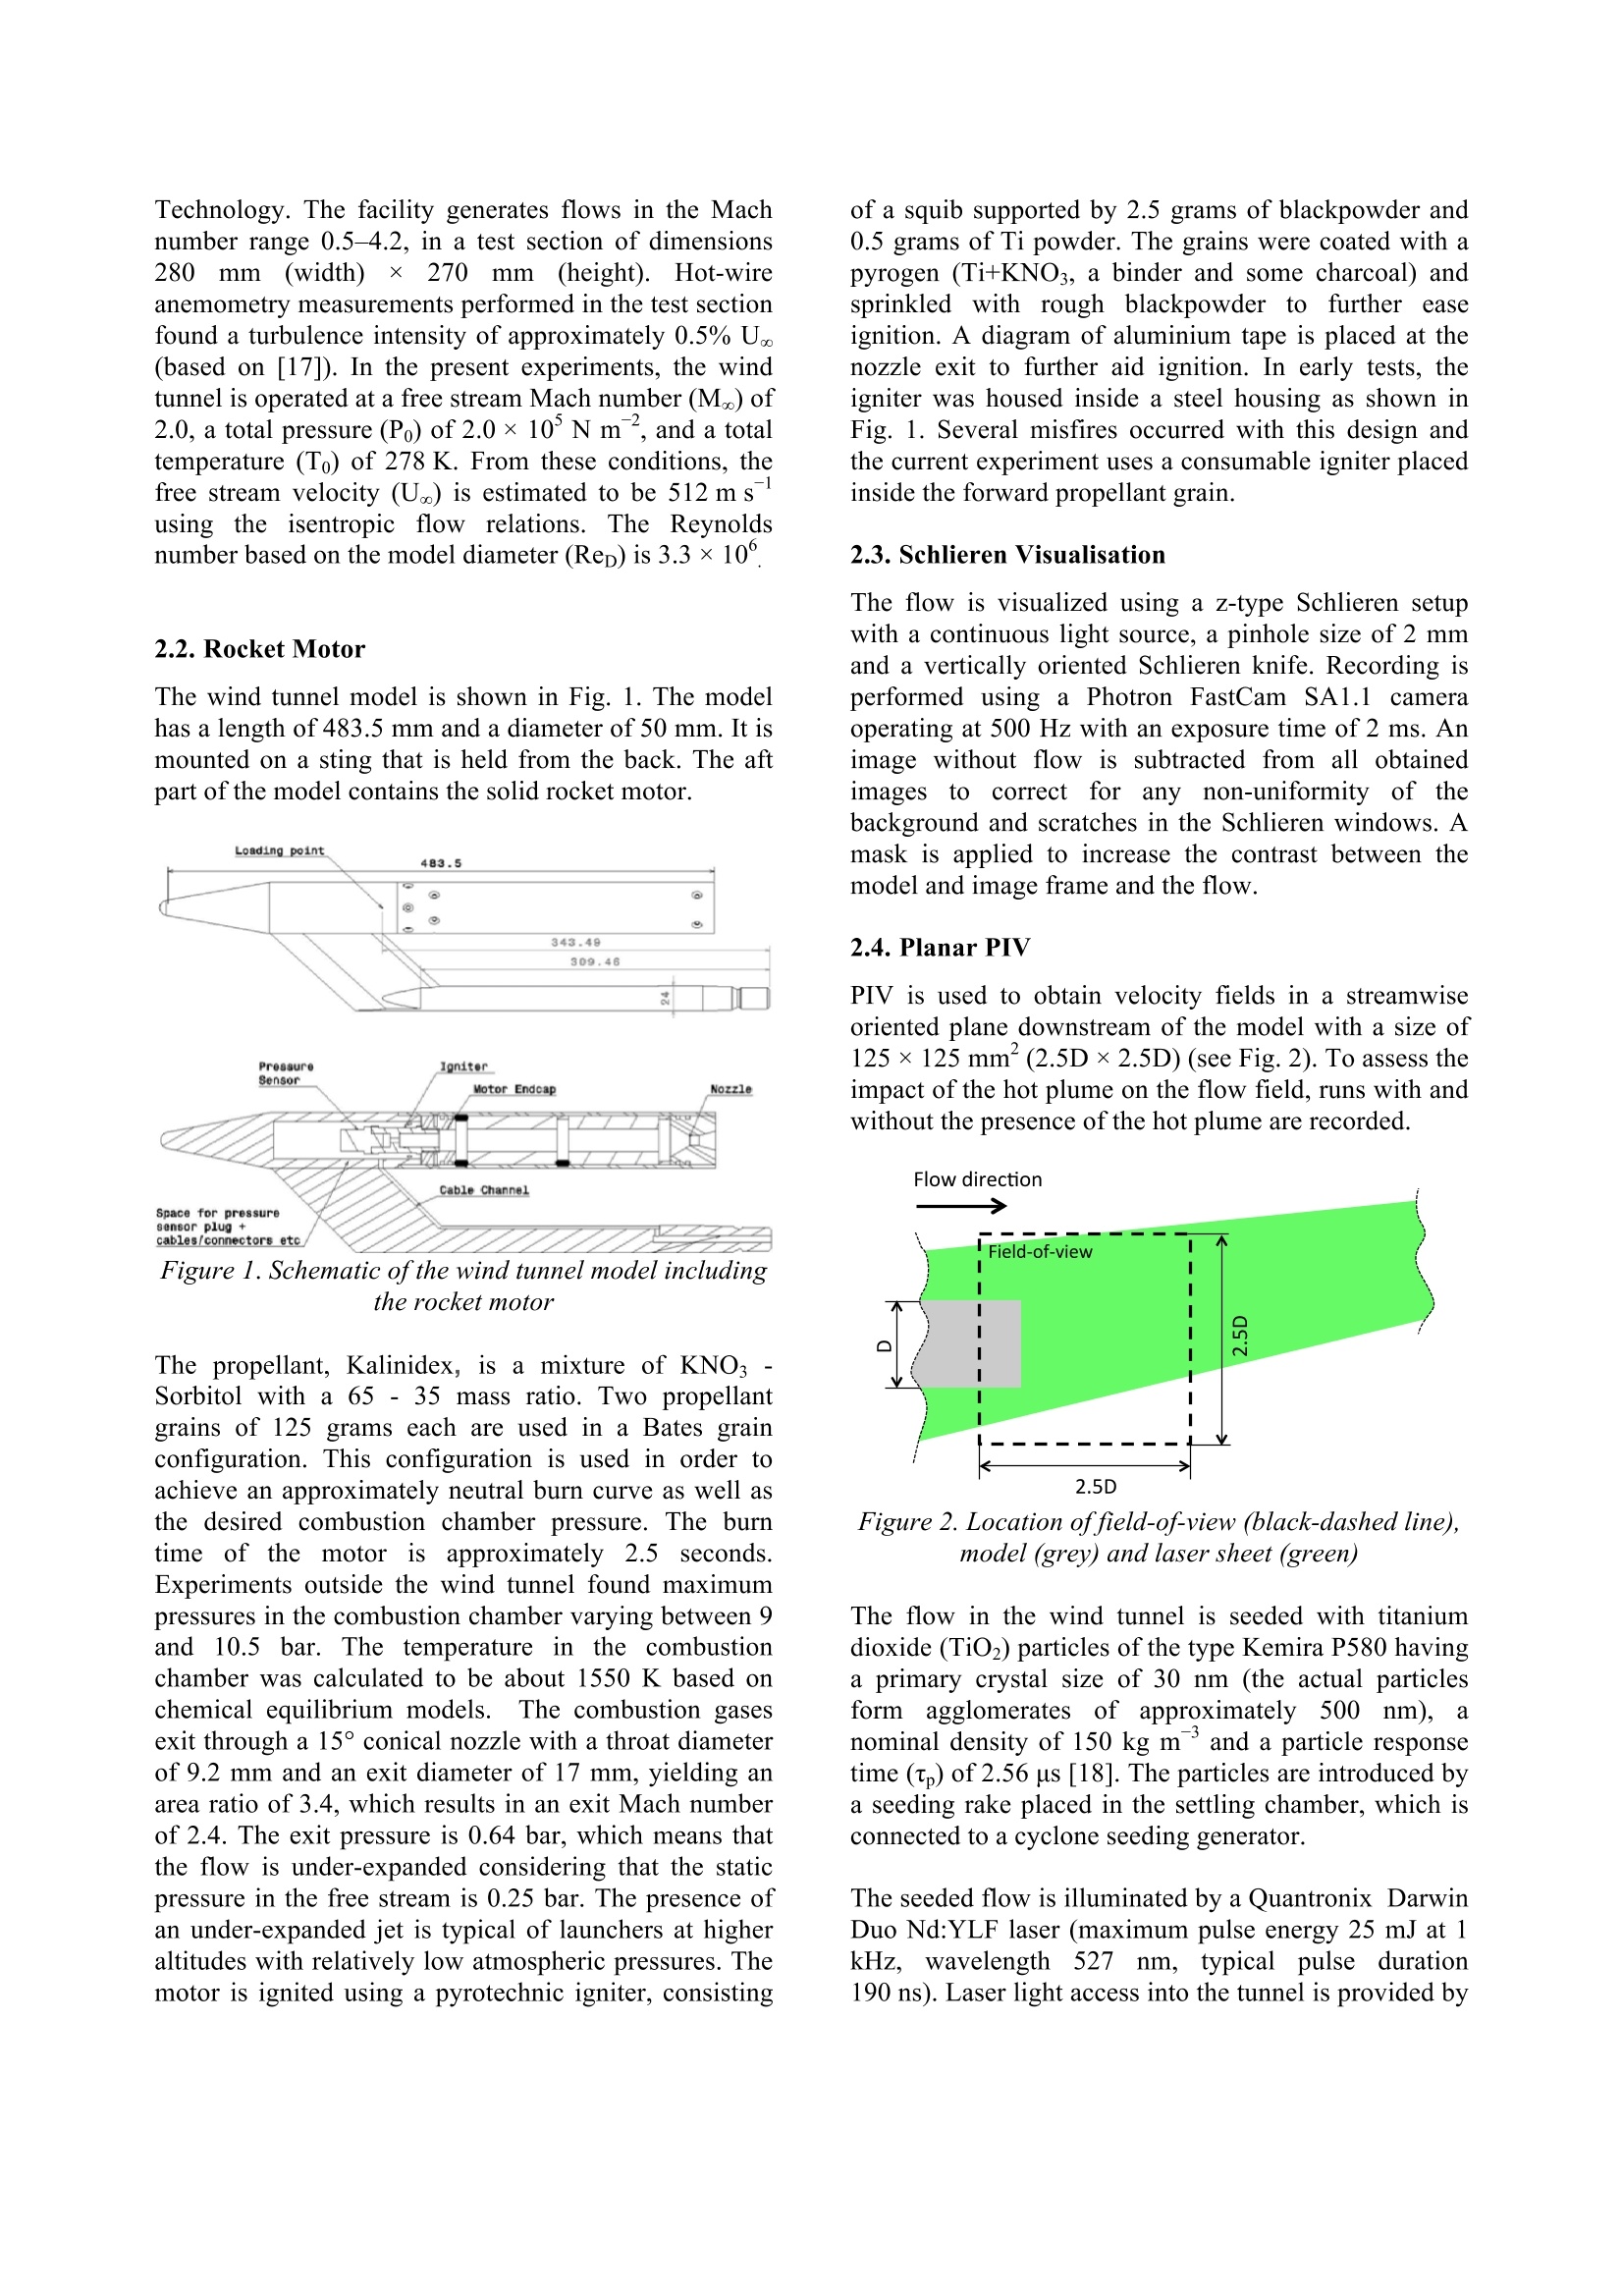
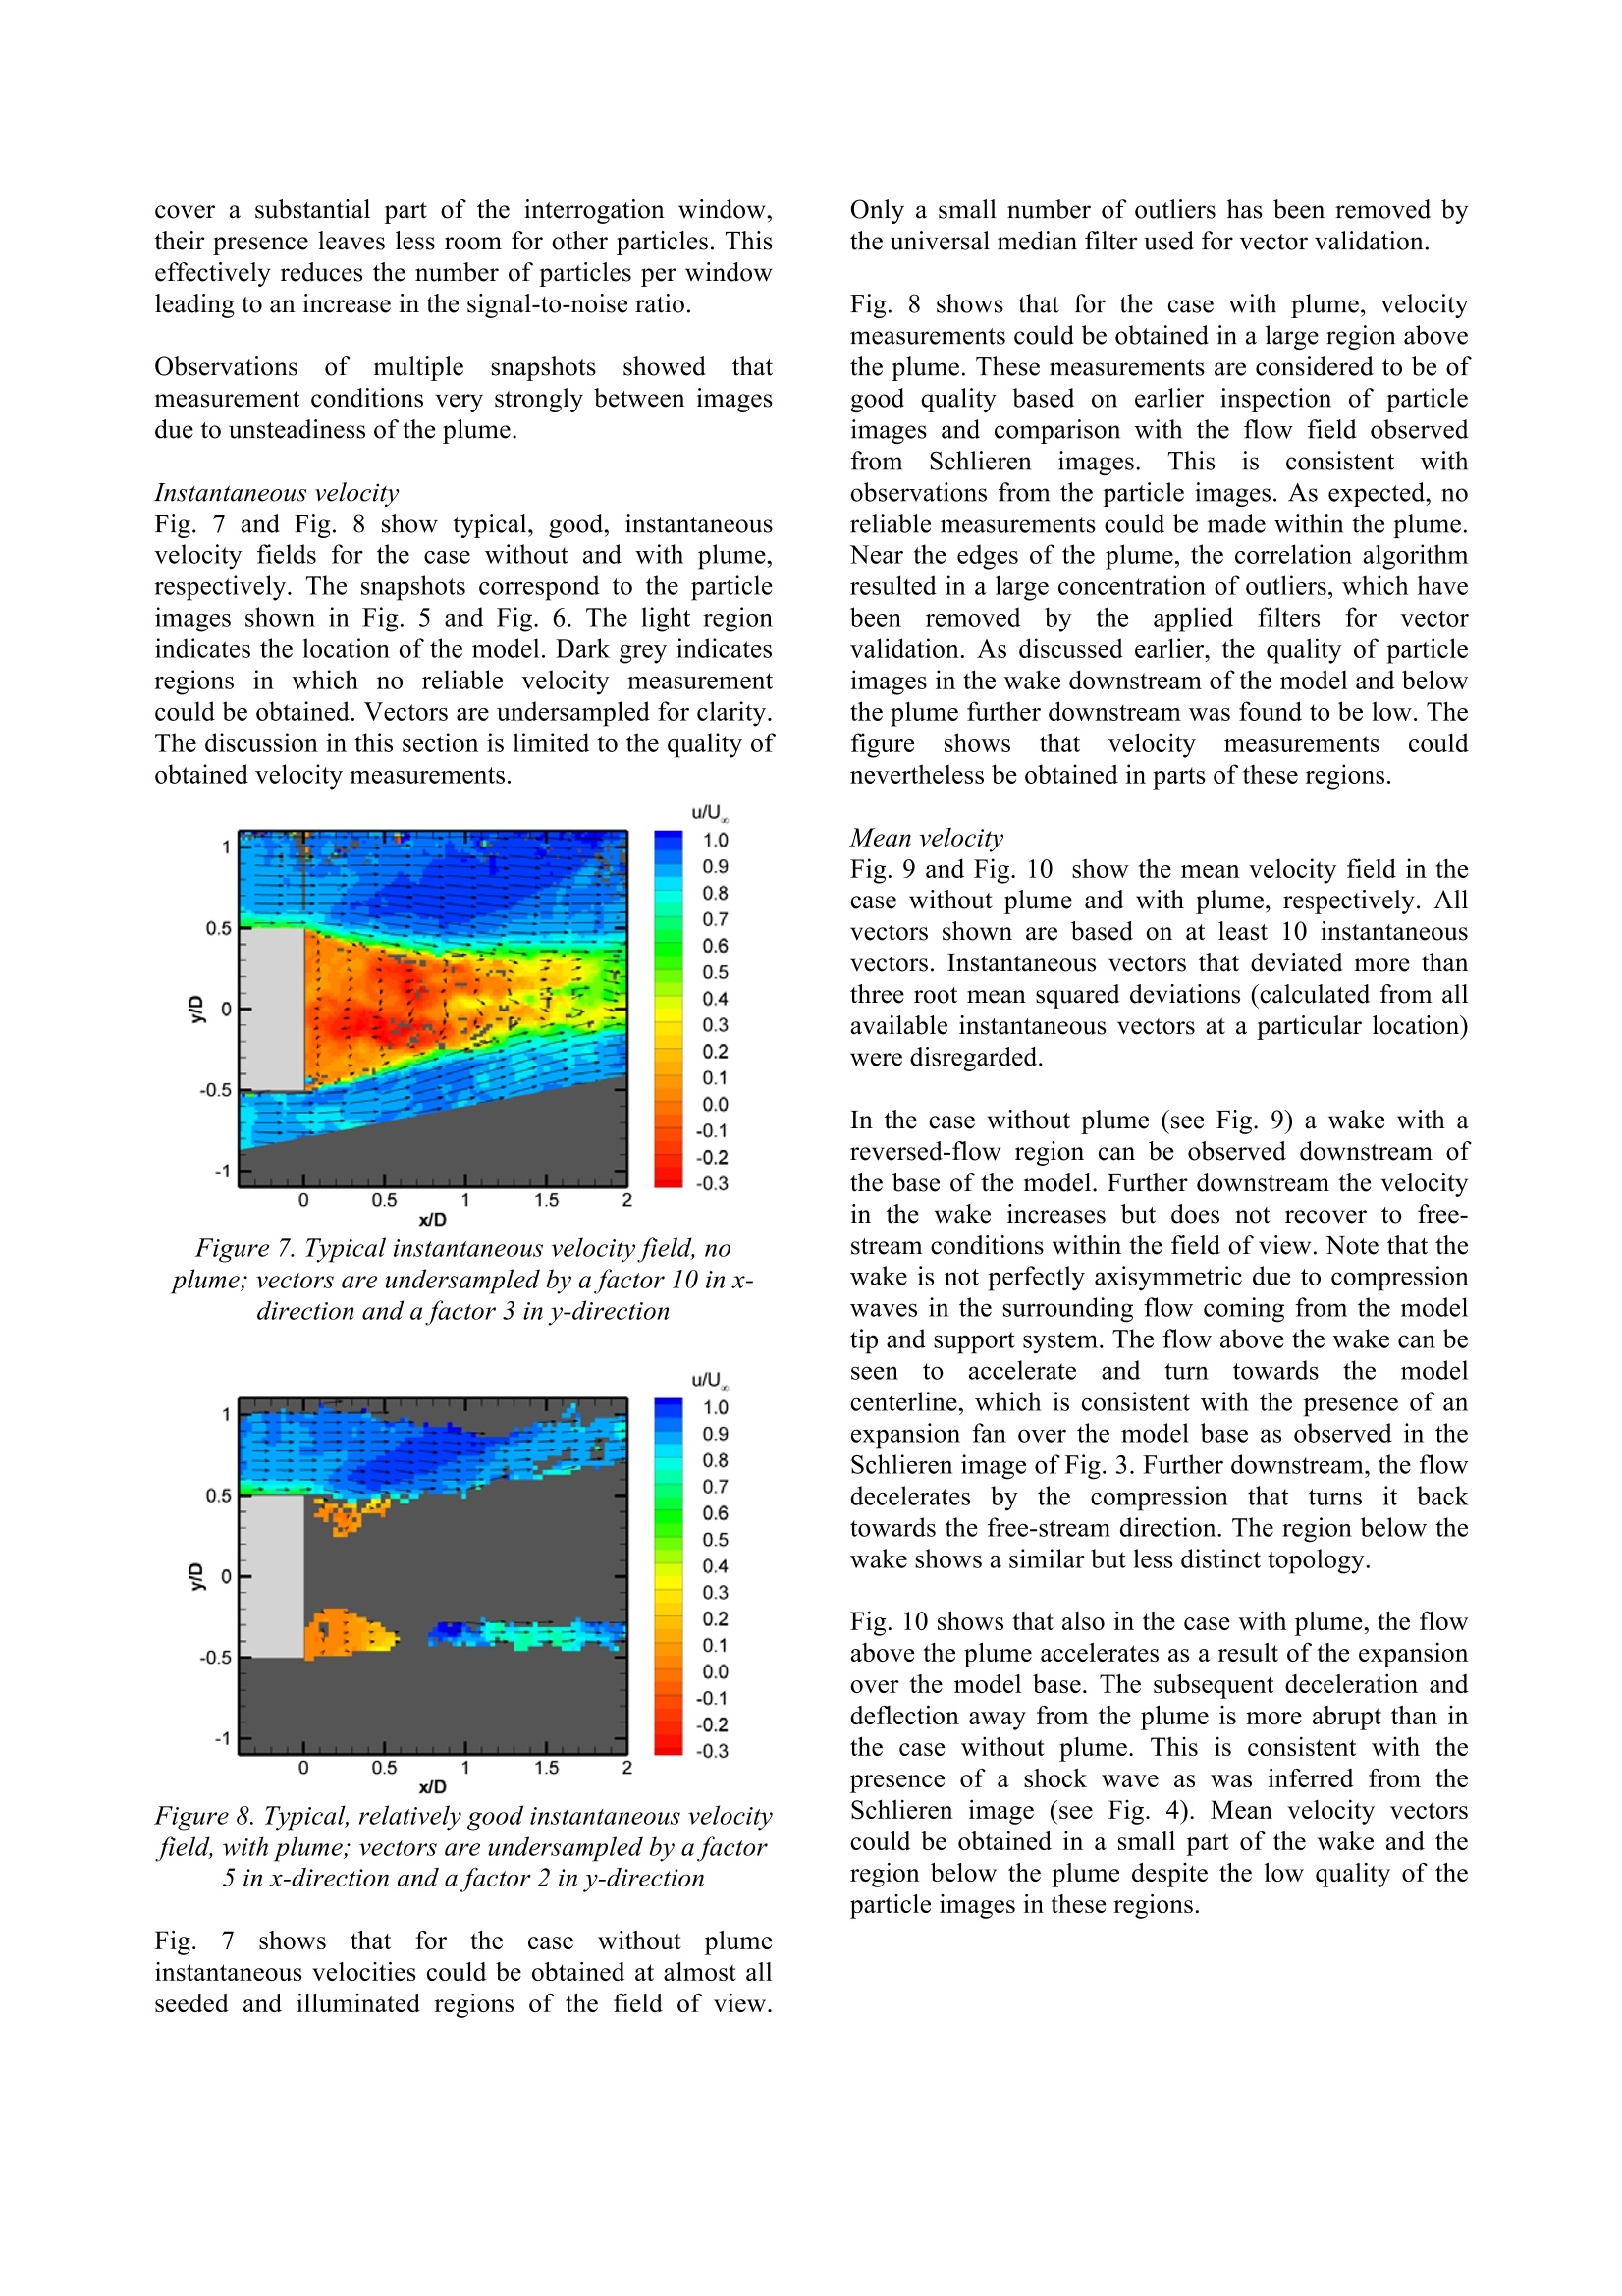
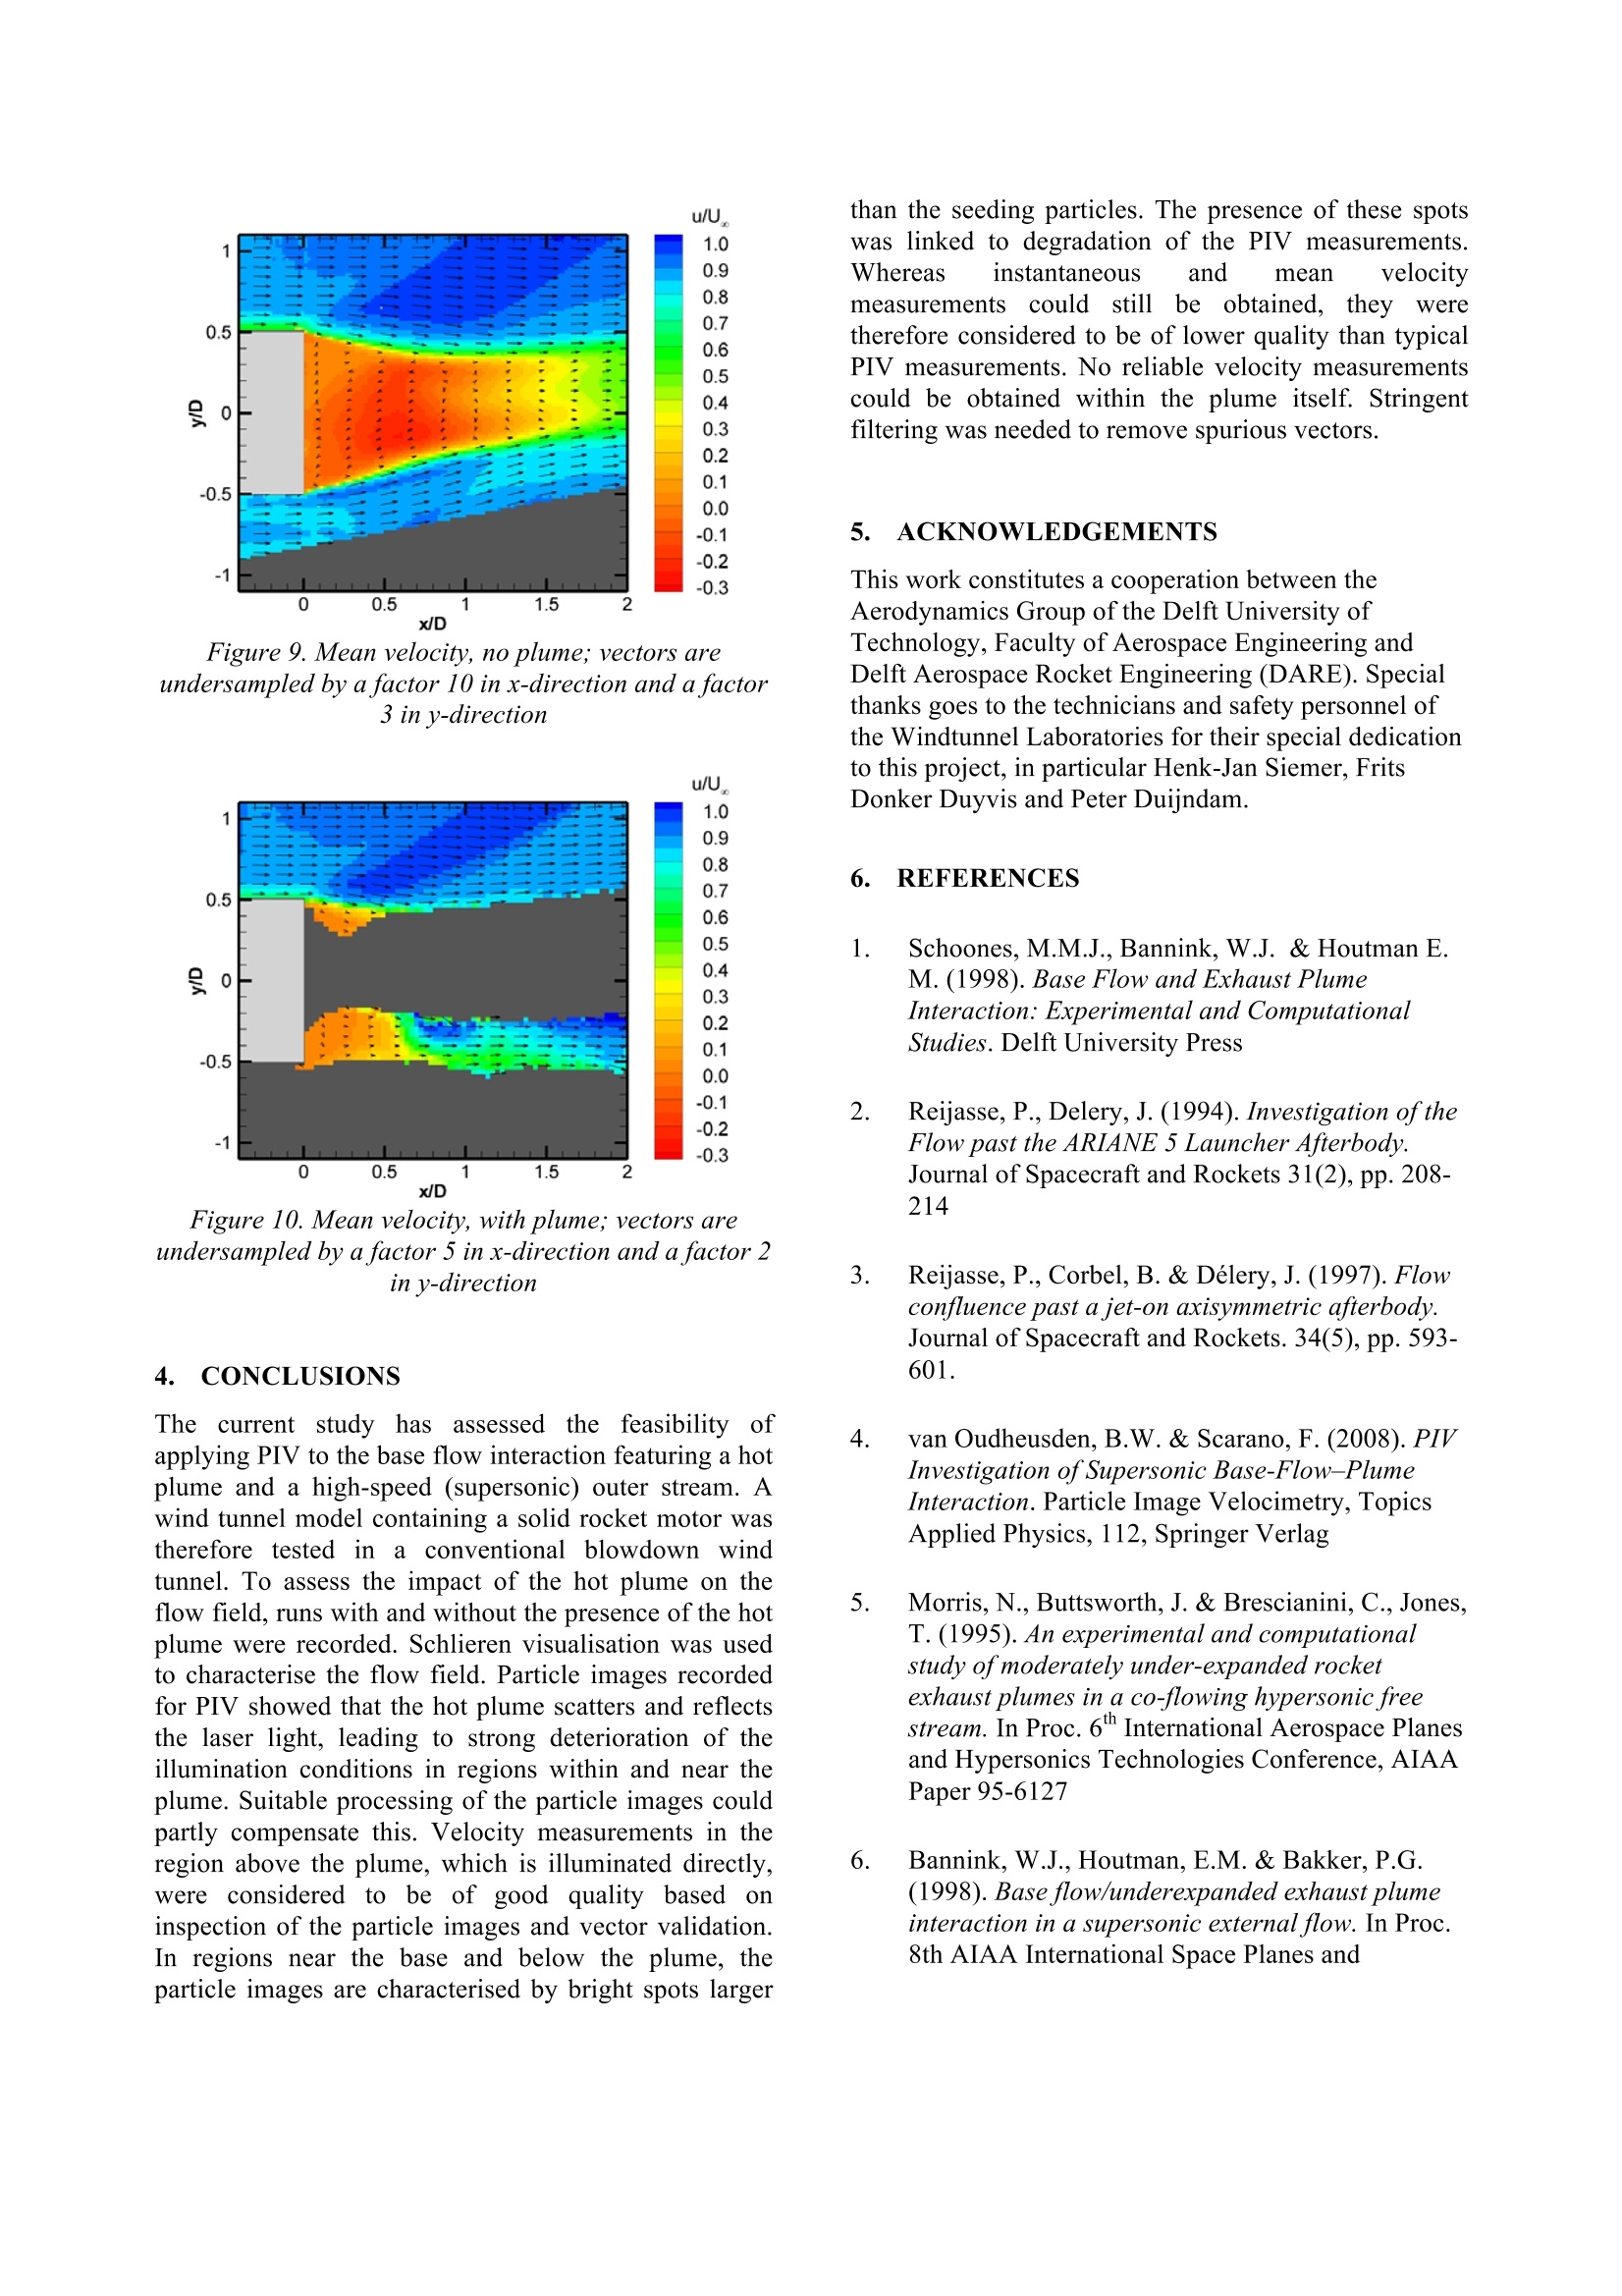
EXPERIMENTS ONAHOTPLUME BASE FLOW INTERACTION AT MACH 2 P.L. Blinde, F.F.J.Schrijer, S.J.Powell, R.M. Werner, B.W. van Oudheusden Delft University of Technology, The Netherlands, Email: p.l.blinde@tudelft.nl ABSTRACT A wind tunnel model containing a solid rocket motorwas tested at Mach 2 to assess the feasibility ofinvestigating the interaction between a hot plume and ahigh-speed outer stream. In addition to :Schlierenvisualisation, the feasibility of applying PIVwaSexplored. Recorded particle images revealed that the hotplume scatters and reflects laser light, leading to astrong deterioration of the illumination conditions inregions within and near the plume. Suitable processingof the particle images could partly compensate for thisand reliable velocity measurements could be obtained indirectly illuminated regions. In regions near the baseand below the plume, velocity measurements could stillbe obtained but were considered to be of lower quality.No reliable velocity measurements could be obtainedwithin the plume itself. 1. INTRODUCTION One of the critical areas in the design of launchers is themodelling of the complex flow that occurs in the baseregion during the ascent phase. The relatively lowpressure in this separated flow region contributes to theoverall drag of the vehicle. In addition, the unsteadyinteraction between the propulsive jet, the separatedbase flow and the external flow gives rise to fluctuatingpressure loads on nearby structural elements such as thenozzle. Furthermore due to the entrainment of hotgasses, significant heat loads may occur. In order to improve the understanding of the complexflow dynamics in the base region experimental andcomputational investigation are carried out. In windtunnel experiments, the presence of an exhaust plumehas often been simulated by means of a cold plume (e.g.[2-8]), generated by feeding pressurised gas to the windtunnel model. Notwithstanding the possibility to usegases with different specific heat ratios (Y) and gasconstants (R), only a limited similarity with a hot plumecan be achieved [1]. Others have therefore performedexperiments with actual hot plumes. Due to the practicalchallenges involved with generating hot jets in windtunnels, such experimental investigations have howeverbeen rare. Examples include Musial et al. [9] who testedfour 500-pound-thrust fuel-liquid-oxygen rocket motorsinstalled in the base of a 12-inch-diameter cylindricalmodel at free stream Mach numbers (M.) ranging from2.0 to3.5.Peters[10][11] investigatedisolatednozzle/afterbody configurations utilizing an air/ethylene burner to produce gas temperatures up to 1830 K at freestream Mach numbers from 0.6 to 1.5. Zapryagaev et al.[12] introduced a 800 K plume generated by hydrogen-fuelled combustion in a Mach 2 flow and recentlyStephan et al. [13] tested a jet simulation facility in aLudwieg tube that was shown to be capable ofgenerating a jet with a total temperature of 620 K and atotal pressure of 16 bar using heated, pressurised gas. The measurement techniques used in previous studiesincluded surface and field measurements using pressureprobes as well as Schlieren flow visualisations. Apromising addition to these measurement techniques isparticle image velocimetry (PIV), which is capable ofdelivering a detailed experimental characterization ofthe flow in terms of ensembles of instantaneous velocityfields, in an efficient and non-intrusive manner [14-16].PIV has already been successfully applied in theinvestigation of supersonic base flows with cold plumes(e.g.[5]). To the authors’knowledge it has however notbeen used in the combination of hot plumes with high-speed external flow. Using PIV in a high-speed flowfacility iiinthepresence of a hot plume requiresovercoming a number of specific technical challenges,in particular creating suitable illumination and flowseeding conditions. The current study therefore aims tocharacterisethese challengesandto assess thefeasibility of using PIV to investigate the interactionbetween a hot plume and a transonic or supersonic outerstream. A hot plume can be generated by using pressurised hotgas or with liquid, solid (or hybrid) propellants in a gasgeneratorr[1]. Experimental arrangements with hotplumes generated by hot gas or fuel supplied fromoutside the model offer the prospect of steady,controllable measurement conditions. The required gasor fuel feeding system however makes such test setupstechnically challenging to develop. When using solidpropellants on the other hand, all the propellants arestored inside the combustion chamber leading to a farless complex arrangement. This has motivated the useof a rocket motor with a solid propellant for the currentstudy. 2. EXPERIMENTAL ARRANGEMENTS 2.1. Facility and Experimental Conditions The experiments have been performed in the transonic-supersonic wind tunnel (TST-27) of the High-SpeedAerodynamicsLaboratoriessat Delft Universityyof Technology. The facility generates flows in the Machnumber range 0.5-4.2, in a test section of dimensions280 mm (width) 270mm(height). Hot-wireanemometry measurements performed in the test sectionfound a turbulence intensity of approximately 0.5% U.(based on [17]). In the present experiments, the windtunnel is operated at a free stream Mach number (M.) of2.0, a total pressure (Po) of 2.0×10'N m,and a totaltemperature (To) of 278 K. From these conditions, thefree stream velocity (U.)is estimated to be 512 msusing the isentropic flow relations. The Reynoldsnumber based on the model diameter (Rep) is 3.3 ×10° 2.2. Rocket Motor The wind tunnel model is shown in Fig. 1. The modelhas a length of 483.5 mm and a diameter of 50 mm. It ismounted on a sting that is held from the back. The aftpart of the model contains the solid rocket motor. Figure 1. Schematic of the wind tunnel model includingthe rocket motor The propellant, Kalinidex, is a mixture of KNO3 -Sorbitol with a 65 - 35 mass ratio. Two propellantgrains of 125 grams each are used in a Bates grainconfiguration. This configuration is used in order toachieve an approximately neutral burn curve as well asthe desired combustion chamber pressure. The burntime of the motor is approximately 2.5seconds.Experiments outside the wind tunnel found maximumpressures in the combustion chamber varying between 9and10.5 bar. The temperature in the combustionchamber was calculated to be about 1550 K based onchemical equilibrium models.S.The combustion gasesexit through a 15° conical nozzle with a throat diameterof 9.2 mm and an exit diameter of 17 mm, yielding anarea ratio of 3.4, which results in an exit Mach numberof 2.4. The exit pressure is 0.64 bar, which means thatthe flow is under-expanded considering that the staticpressure in the free stream is 0.25 bar. The presence ofan under-expanded jet is typical of launchers at higheraltitudes with relatively low atmospheric pressures. Themotor is ignited using a pyrotechnic igniter, consisting of a squib supported by 2.5 grams of blackpowder and0.5 grams of Ti powder. The grains were coated with apyrogen (Ti+KNO3, a binder and some charcoal) andsprinkled with rough blackpowder to further easeignition. A diagram of aluminium tape is placed at thenozzle exit to further aid ignition. In early tests, theigniter was housed inside a steel housing as shown inFig. 1. Several misfires occurred with this design andthe current experiment uses a consumable igniter placedinside the forward propellant grain. 2.3. Schlieren Visualisation The flow is visualized using a z-type Schlieren setupwith a continuous light source, a pinhole size of 2 mmand a vertically oriented Schlieren knife. Recording isperformed using a Photron FastCam SA1.1 cameraoperating at 500 Hz with an exposure time of 2 ms. Animage without flow is subtracted from all obtainedimages to correct for any non-uniformity of thebackground and scratches in the Schlieren windows. Amask is applied to increase the contrast between themodel and image frame and the flow. 2.4. Planar PIV PIV is used to obtain velocity fields in a streamwiseoriented plane downstream of the model with a size of125×125 mm(2.5D×2.5D) (see Fig.2). To assess theimpact of the hot plume on the flow field, runs with andwithout the presence of the hot plume are recorded. Figure 2. Location offield-of-view (black-dashed line),model (grey) and laser sheet (green) The flow in the wind tunnel is seeded with titaniumdioxide (TiO2) particles of the type Kemira P580 havinga primary crystal size of 30 nm (the actual particlesform agglomerates of approximately 500) nm), anominal density of 150 kg m’and a particle responsetime (tp) of 2.56 us [18]. The particles are introduced bya seeding rake placed in the settling chamber, which isconnected to a cyclone seeding generator. The seeded flow is illuminated by a Quantronix DarwinDuo Nd:YLF laser (maximum pulse energy 25 mJ at 1kHz.wavelength527 nm,typicalpulse duration190 ns). Laser light access into the tunnel is provided by a laser probe inserted downstream of the test section[19]. The laser beam is shaped into a sheet using opticsinsidee the probe.Thelightsheetthickness iisapproximately 1 mm. Images are recorded by a Photron FastCam SA1.1camera with a chip size of 1024× 1024 pixels, 12 bitdynamic range and a pixel pitch of 20 um. The camerais equipped with a Nikon objective of 105 mm operatedat an aperture of f/4, in combination with daylightfilters. The distance between the camera and the lasersheet is approximately 55 cm. The resulting digitalresolution is approximately 8.5 pixels mm Both the cameras and the laser are connected to acomputer with a LaVision programmable timing unit(PTU) to provide for the digital synchronization. DaVis8.1.2 software is used to control the PTU. Image pairsare acquired at a frequency of 300 Hz with a laser pulsetime separation of 3 us, which results in a particledisplacement corresponding to the free stream velocityof about 11 pixels (1.4 mm). In view of the applied dataacquisition rate, the subsequent instantaneous velocitymeasurements are uncorrelated in time. The particle image recordings are processed with DaVis8.1.4 software. Scattering of laser light by the plumeleads to local saturation of pixels and high intensitygradients within images. Particles images are thereforepre-processed by subtracting the minimum intensity inthe surrounding 5 snapshots, by disabling all saturatedpixels and by normalising intensities by a min-max filterhaving a 6x 6 kernel. Velocity vector fields areobtained by direct cross-correlation of the images usinga multi-grid approach with window deformation. Thefinal window size is 16×16 pixels for the case withoutplume and 24×24 pixels for the case with plume. Witha 50% overlap, this leads to a vector pitch of 1.0 mm (8pixels) and 1.5 mm (12 pixels) for the case without andwith plume, respectively. Spurious vectors are removedusing a universal median test [20] with a kernel size of3×3 vectors. For the case with plume, more rigorousfiltering was found to be necessary to remove spuriousvectors. Any vectors with a correlation peak ratio lowerthan 1.25 were considered to be of insufficient qualitybased on visual inspection and are removed. It is notedthat vectors are not replaced using linear interpolation orsmoothed to enable better assessment of the feasibilityof PIV under the present conditions. The quality of theparticle images and resulting vector fields will befurther discussed in section 3.2. The dataset for the case without hot plume consists of600 snapshots. For the run with hot plume a selection of450 snapshots was made during which combustion tookplace and particle images of sufficient quality for PIVprocessing could be obtained. Of these snapshots about75% of the resulting vector fields were found to be of sufficient quality based on visual inspection and wereused for further analysis. PIV recording parameters are summarized in Tab. 1. Parameter No plume With plume Field of view 125×125mm (2.5D×2.5D) Magnification 0.17 Resolution 8.5 pixel mm Window size 16×16 pixels 24×24 pixels Vector spacing 1.0×1.0 mm 1.5×1.5 mm Pulse separation 3 us Recording rate 300 Hz Size of dataset 600 325 Table 1. Parameters for PIV experiment 3. RESULTS AND DISCUSSION 3.1. Schlieren Visualisation Fig. 3 and Fig. 4 show typical Schlieren images of theflow around the model for the cases without and withplume, respectively.The flow is from left to right. Theblack rectangle on the left corresponds to the back of themodel. The horizontal block in the lower part of thefigure is a part of the sting that holds the model. Fig. 3 for the case without plume shows a number ofdistinct features. The image shows an expansion fan(bright region near A) and a shear layer (thin dark linenear B) on both sides of the model. Furthermore itshould be noted that the compression waves at the toprear of the model (dark like near C) do not originatefrom the base but are the results of a reflection of thecompression waves emanating from the model nose.The image also showsa compression shock (D)emanating from the model support. This shock wavecan be seen to interact with the shear layer. Fig. 4 for the case with plume clearly shows theprese6nncsef of the plume. When observing the plume closeto the nozzle exit, it can be seen that its diameterapproximately doubles which is a clear indication that itis underexpanded (as is expected from the nozzlepressure ratio). About one model diameter downstreamof the model a Mach disk is observed (E) inside theplume. In the flow surrounding the plume, similarfeatures are observed as in the case without plume(compare Fig.3). In addition, the image showscompression waves (F) that are generated by an outwarddeflection of the flow due to the expanding plumedownstream of the inward deflection by the expansionover the model base. Time series of Schlieren imagesshowed that the flow topology remains relatively stablefor about 2 seconds. Figure 3. Schlieren image, without plume Figure 4. Schlieren image, with plume 3.2. PIV Quality ofparticle images Before presenting the resulting vector fields, first thequality of the particle images in the presence of theplume is discussed. Fig. 5 and Fig. 6 show typicalparticle images for the case without and with plume,respectively (flow again from left to right). Left figuresdepict raw images and right figures show the processedimages after disabling saturated pixels, subtractingminimum intensities of surrounding snapshots andapplication of a min-max filter. The intensity scales arechosen such that the reflections, the plume and theparticles in the surrounding flow are all visible. Fig. 5 shows that for the case without plume theillumination and seeding are of reasonable quality in theregion of interest downstream of the model. The leftfigure shows an unwanted reflection from the model aswell as an arc-shape reflection further downstream,originating from the wind tunnel wall. These reflectionscould largely be compensated for by image pre-processing (compare right and left figure), leaving onlytwo vertical streaks at the streamwise location of thebase. Note that the laser sheet does not illuminate theentire field of view (compare Fig.2). Figure 5. Particle images, no plume; Raw image (left),Processed image (right) Figure 6. Particle images, with plume; Raw image(left), Processed image (right) Especially the lower edge of the laser sheet is clearlyvisible. The seeding is relatively uniform downstream ofthe model and can be seen to decrease towards the topof the field of view. Observations of multiple snapshotsshowed that towards that region the seeding alsobecomes increasingly intermittent. Fig. 6 shows that the quality of the particle imagesdeteriorates dcrastically iin the presence ofthecombustion plume. The plume scatters and reflects thelaser light, leading to saturation and loss of contrastwithin the image. Fortunately, by appropriate imagepre-processingtheseeeffectscouldpartiallybecompensated for (compare right and left figures). Theprocessed image (right) shows well-defined seedingparticles in the region above the plume. The regiondirectly downstream of the base and the region belowthe plume are characterised by the presence of brightstructures and spots that are several times larger than theimage of a typical seeding particle. This is attributed tothe presence of large particles originating from theplume and the degradation of illumination conditions incombination with the application of a min-max filterwith a relatively small kernel size. The presence ofrelatively large bright spots has a detrimental influenceon the accuracy of the PIV measurement for a numberof reasons. Where the spots represent particles in theexhaust plume, the relatively large inertia of thoseparticles will restrict their ability to faithfully follow theflow and use them for reliable velocity measurements.Also, particles with image sizes larger than two pixelsprevent accurate sub-pixel evaluation of the location ofthe correlation peak. Furthermore, since the spots can cover a substantial part of the interrogation window,their presence leaves less room for other particles. Thiseffectively reduces the number of particles per windowleading to an increase in the signal-to-noise ratio. Observations of multiplesnapshots showed thatmeasurement conditions very strongly between imagesdue to unsteadiness of the plume. Instantaneous velocity Fig. 7 and Fig. 8 show typical, good, instantaneousvelocity fields for the case without and with plume,respectively. The snapshots correspond to the particleimages shown in Fig. 5 and Fig. 6. The light regionindicates the location of the model. Dark grey indicatesregions in which no reliable velocity measurementcould be obtained. Vectors are undersampled for clarity.The discussion in this section is limited to the quality ofobtained velocity measurements. u/U Figure 7. Typical instantaneous velocity field, noplume; vectors are undersampled by a factor 10 in x-direction and a factor 3 in y-direction u/U Figure 8. Typical, relatively good instantaneous velocityfield, with plume; vectors are undersampled by a factor5 in x-direction and a factor 2 in y-direction Fig. 7 showsthatfor the casewithout plumeinstantaneous velocities could be obtained at almost allseeded and illuminated regions of the field of view. Only a small number of outliers has been removed bythe universal median filter used for vector validation Fig. 8 shows that for the case with plume, velocitymeasurements could be obtained in a large region abovethe plume. These measurements are considered to be ofgood quality based on earlier inspection of particleimages and comparison with the flow field observedfromSSchlieren images.Thisissconsistent withobservations from the particle images. As expected, noreliable measurements could be made within the plume.Near the edges of the plume, the correlation algorithmresulted in a large concentration of outliers, which havebeen removed byttheapplied filtersffor vectorvalidation. As discussed earlier, the quality of particleimages in the wake downstream of the model and belowthe plume further downstream was found to be low. ThefigureshowstthatVvelocity measurements couldnevertheless be obtained in parts of these regions. Mean velocity Fig. 9 and Fig. 10 show the mean velocity field in thecase without plume and with plume, respectively. Allvectors shown are based on at least 10 instantaneousvectors. Instantaneous vectors that deviated more thanthree root mean squared deviations (calculated from allavailable instantaneous vectors at a particular location)were disregarded. In the case without plume (see Fig. 9) a wake with areversed-flow region can be observed downstream ofthe base of the model. Further downstream the velocityin the wake increases but does not recover to free-stream conditions within the field of view. Note that thewake is not perfectly axisymmetric due to compressionwaves in the surrounding flow coming from the modeltip and support system. The flow above the wake can beseen .tc accelerateandtturnntowards themodelcenterline, which is consistent with the presence of anexpansion fan over the model base as observed in theSchlieren image of Fig. 3. Further downstream, the flowdecelerates 1by the compression that turns it backtowards the free-stream direction. The region below thewake shows a similar but less distinct topology. Fig. 10 shows that also in the case with plume, the flowabove the plume accelerates as a result of the expansionover the model base. The subsequent deceleration anddeflection away from the plume is more abrupt than inthe case without plume. This is consistent with thepresence of a shock wave as was inferred from theSchlieren image (see Fig. 4). Mean velocity vectorscould be obtained in a small part of the wake and theregion below the plume despite the low quality of theparticle images in these regions. u/U Figure 9. Mean velocity, no plume; vectors areundersampled by a factor 10 in x-direction and a factor3 in y-direction u/U Figure 10. Mean velocity, with plume, vectors areundersampled by a factor 5 in x-direction and a factor 2in y-direction 4. CONCLUSIONS The current study has assessed the feasibility ofapplying PIV to the base flow interaction featuring a hotplume and a high-speed (supersonic) outer stream. Awind tunnel model containing a solid rocket motor wastherefore tested in a conventional blowdown windtunnel. To assess the impact of the hot plume on theflow field, runs with and without the presence of the hotplume were recorded. Schlieren visualisation was usedto characterise the flow field. Particle images recordedfor PIV showed that the hot plume scatters and reflectsthe laser light, leading to strong deterioration of theillumination conditions in regions within and near theplume. Suitable processing of the particle images couldpartly compensate this. Velocity measurements in theregion above the plume, which is illuminated directly,were considered to be of good quality based oninspection of the particle images and vector validation.In regions near the base and below the plume, theparticle images are characterised by bright spots larger than the seeding particles. The presence of these spotswas linked to degradation of the PIV measurements.Whereas instantaneous and mean velocitymeasurementsScould still be obtained, they weretherefore considered to be of lower quality than typicalPIV measurements. No reliable velocity measurementscould be obtained within the plume itself. Stringentfiltering was needed to remove spurious vectors. 5. ACKNOWLEDGEMENTS This work constitutes a cooperation between theAerodynamics Group of the Delft University ofTechnology, Faculty of Aerospace Engineering andDelft Aerospace Rocket Engineering (DARE). Specialthanks goes to the technicians and safety personnel ofthe Windtunnel Laboratories for their special dedicationto this project, in particular Henk-Jan Siemer, FritsDonker Duyvis and Peter Duijndam. 6. REFERENCES 1. Schoones, M.M.J., Bannink, W.J. & Houtman EM. (1998). Base Flow and Exhaust PlumeInteraction: Experimental and ComputationalStudies. Delft University Press 2. Reijasse, P., Delery, J. (1994). Investigation of theFlow past the ARIANE 5 Launcher Afterbody.Journal of Spacecraft and Rockets 31(2), pp. 208-214 3. Reijasse, P., Corbel, B. & Delery,J. (1997). Flowconfluence past a jet-on axisymmetric afterbody.Journal of Spacecraft and Rockets. 34(5), pp. 593-601. 4. van Oudheusden, B.W. & Scarano, F. (2008). PIVInvestigation of Supersonic Base-Flow-PlumeInteraction. Particle Image Velocimetry, TopicsApplied Physics, 112, Springer Verlag 5. Morris, N., Buttsworth,J. & Brescianini, C., Jones,T. (1995). An experimental and computationalstudy ofmoderately under-expanded rocketexhaust plumes in a co-flowing hypersonic freestream. In Proc. 6" International Aerospace Planesand Hypersonics Technologies Conference, AIAAPaper 95-6127 6. Bannink, W.J., Houtman,E.M. & Bakker, P.G.(1998). Base flow/underexpanded exhaust plumeinteraction in a supersonic external flow. In Proc.8th AIAA International Space Planes and Hypersonic Systems and TechnologiesConference, AIAA Paper 98-1598 18. Ragni, D., Schrijer, F.F.J, van Oudheusden, B.W.& Scarano,F.(2010). Particle tracer responseacross shocks measured by PIV. Experiments inFluids (50) pp. 53-64 ( 7. Kumar, R., Viswanath, P. & Prabhu, A . (2002).Mean and fluctuating pressure in boat-tailseparated flows at transonic speeds. Journal ofSpacecraft and R ockets. 3 9(3), pp. 430-438 ) 19.1.DDonker Duyvis, F.J.(2005). Laser sheet probedesign for PIV in high speed wind tunnels. In Proc.PIVNET II International Workshop on theApplication of PIV in Compressible Flows, Delft,the Netherlands 8. Pindzola, M. (1963). Jet simulation in ground testfacilities. AGARDograph. 79 9. Musial, N.T. & Ward, J.J.(1961). Base FlowCharacteristics for Several Four-Clustered RocketConfigurations at Mach Numbers from 2.0 to 3.5.NASA TND-1063. 20. Westerweel, J. & Scarano, F. (2005). Universaloutlier detection for PIV data. Experiments inFluids (39), pp. 1096-1100 10. Peters, W.L. (1976). An evaluation ofjetsimulation parameters for nozzle afterbody testingat transonic Mach numbers. 17" AerospaceSciences Meeting, AIAA paper 77-106. 11.PPeters, W.L. (1979). Jet simulation techniques:Simulation oftemperature effects by altering gascomposition. 17 Aerospace Sciences Meeting,AIAA paper 79-327. 12. Zapryagaev,V., Lokotko, A.V., Nikiforov,S.V.,Pavlov, A.A., Tchernyshev, A.V., Bannink, W.J.& Muylaert, J.(2002). Experimental Investigationof Base Pressure with Hot Supersonic Jet forExternal Supersonic Flow. In Proc.4 Symposiumon Aerothermodynamics for Space Vehicles,Capua ,Italy 13.SStephan, S., Radespiel, R.& Muller-Eigner, R.(2013). Jet Simulation Facility using the LudwiegTube Principle. In Proc. 5" European Conferencefor Aeronautics and Space Sciences (EUCASS) 14. Raffel, M., Willert, C., Wereley S. &Kompenhans, J. (2007). Particle ImageVelocimetry, a practical guide. 2nd editon.Springer, Berlin 15. Adrian, R.J.& Westerweel, J. (2011). Particleimage velocimetry.Cambridge University Press 16. Adrian,R.J.(2005). Twenty years of particleimage velocimetry. Experiments in Fluids (39), pp.159-169 177..GCiepman,R.H.M., Schrijer, F.F.J. & vanOudheusden, B.W. (2014). High-resolution PIVmeasurements ofa transitional shock wave-boundary layer interaction. In Proc. 44th AIAAFluid Dynamics Conference A wind tunnel model containing a solid rocket motorwas tested at Mach 2 to assess the feasibility ofinvestigating the interaction between a hot plume and ahigh-speed outer stream. In addition to Schlierenvisualisation, the feasibility of applying PIV wasexplored. Recorded particle images revealed that the hotplume scatters and reflects laser light, leading to astrong deterioration of the illumination conditions inregions within and near the plume. Suitable processingof the particle images could partly compensate for thisand reliable velocity measurements could be obtained indirectly illuminated regions. In regions near the baseand below the plume, velocity measurements could stillbe obtained but were considered to be of lower quality.No reliable velocity measurements could be obtainedwithin the plume itself.
确定


还剩5页未读,是否继续阅读?

产品配置单

北京欧兰科技发展有限公司为您提供《固体火箭发动机中流体和热焰的相互作用检测方案(CCD相机)》,该方案主要用于航空中流体和热焰的相互作用检测,参考标准--,《固体火箭发动机中流体和热焰的相互作用检测方案(CCD相机)》用到的仪器有LaVision HighSpeedStar 高帧频相机、时间分辨粒子成像测速系统(TR-PIV)
推荐专场


相关方案
更多
该厂商其他方案
更多