


A stereo-μ-PIV system for the measurement of all three components of the velocity vector in a
measurement plane (2D-3C) in a closed microchannel has been developed and first test measurements have been
performed on the three-dimensional laminar flow in a T-shaped micromixer. Stereo-μ-PIV measurements in closed
microchannels require a calibration based on the self-calibration of the tracer particle images. In order to include the
effects of different refractive indices of the water in the microchannel, the glass of the entrance window, and the
surrounding air a three-media-model is included in the triangulation procedure of the self calibration. A preliminary
test case shows that the stereo-μ-PIV results deviate less than 5% from theoretical values. First measurements in the
mixing zone of a T-shaped micromixer show that three-dimensional flow in a microchannel can be resolved,
however, the accuracy of the measurements needs to be improved.
方案详情

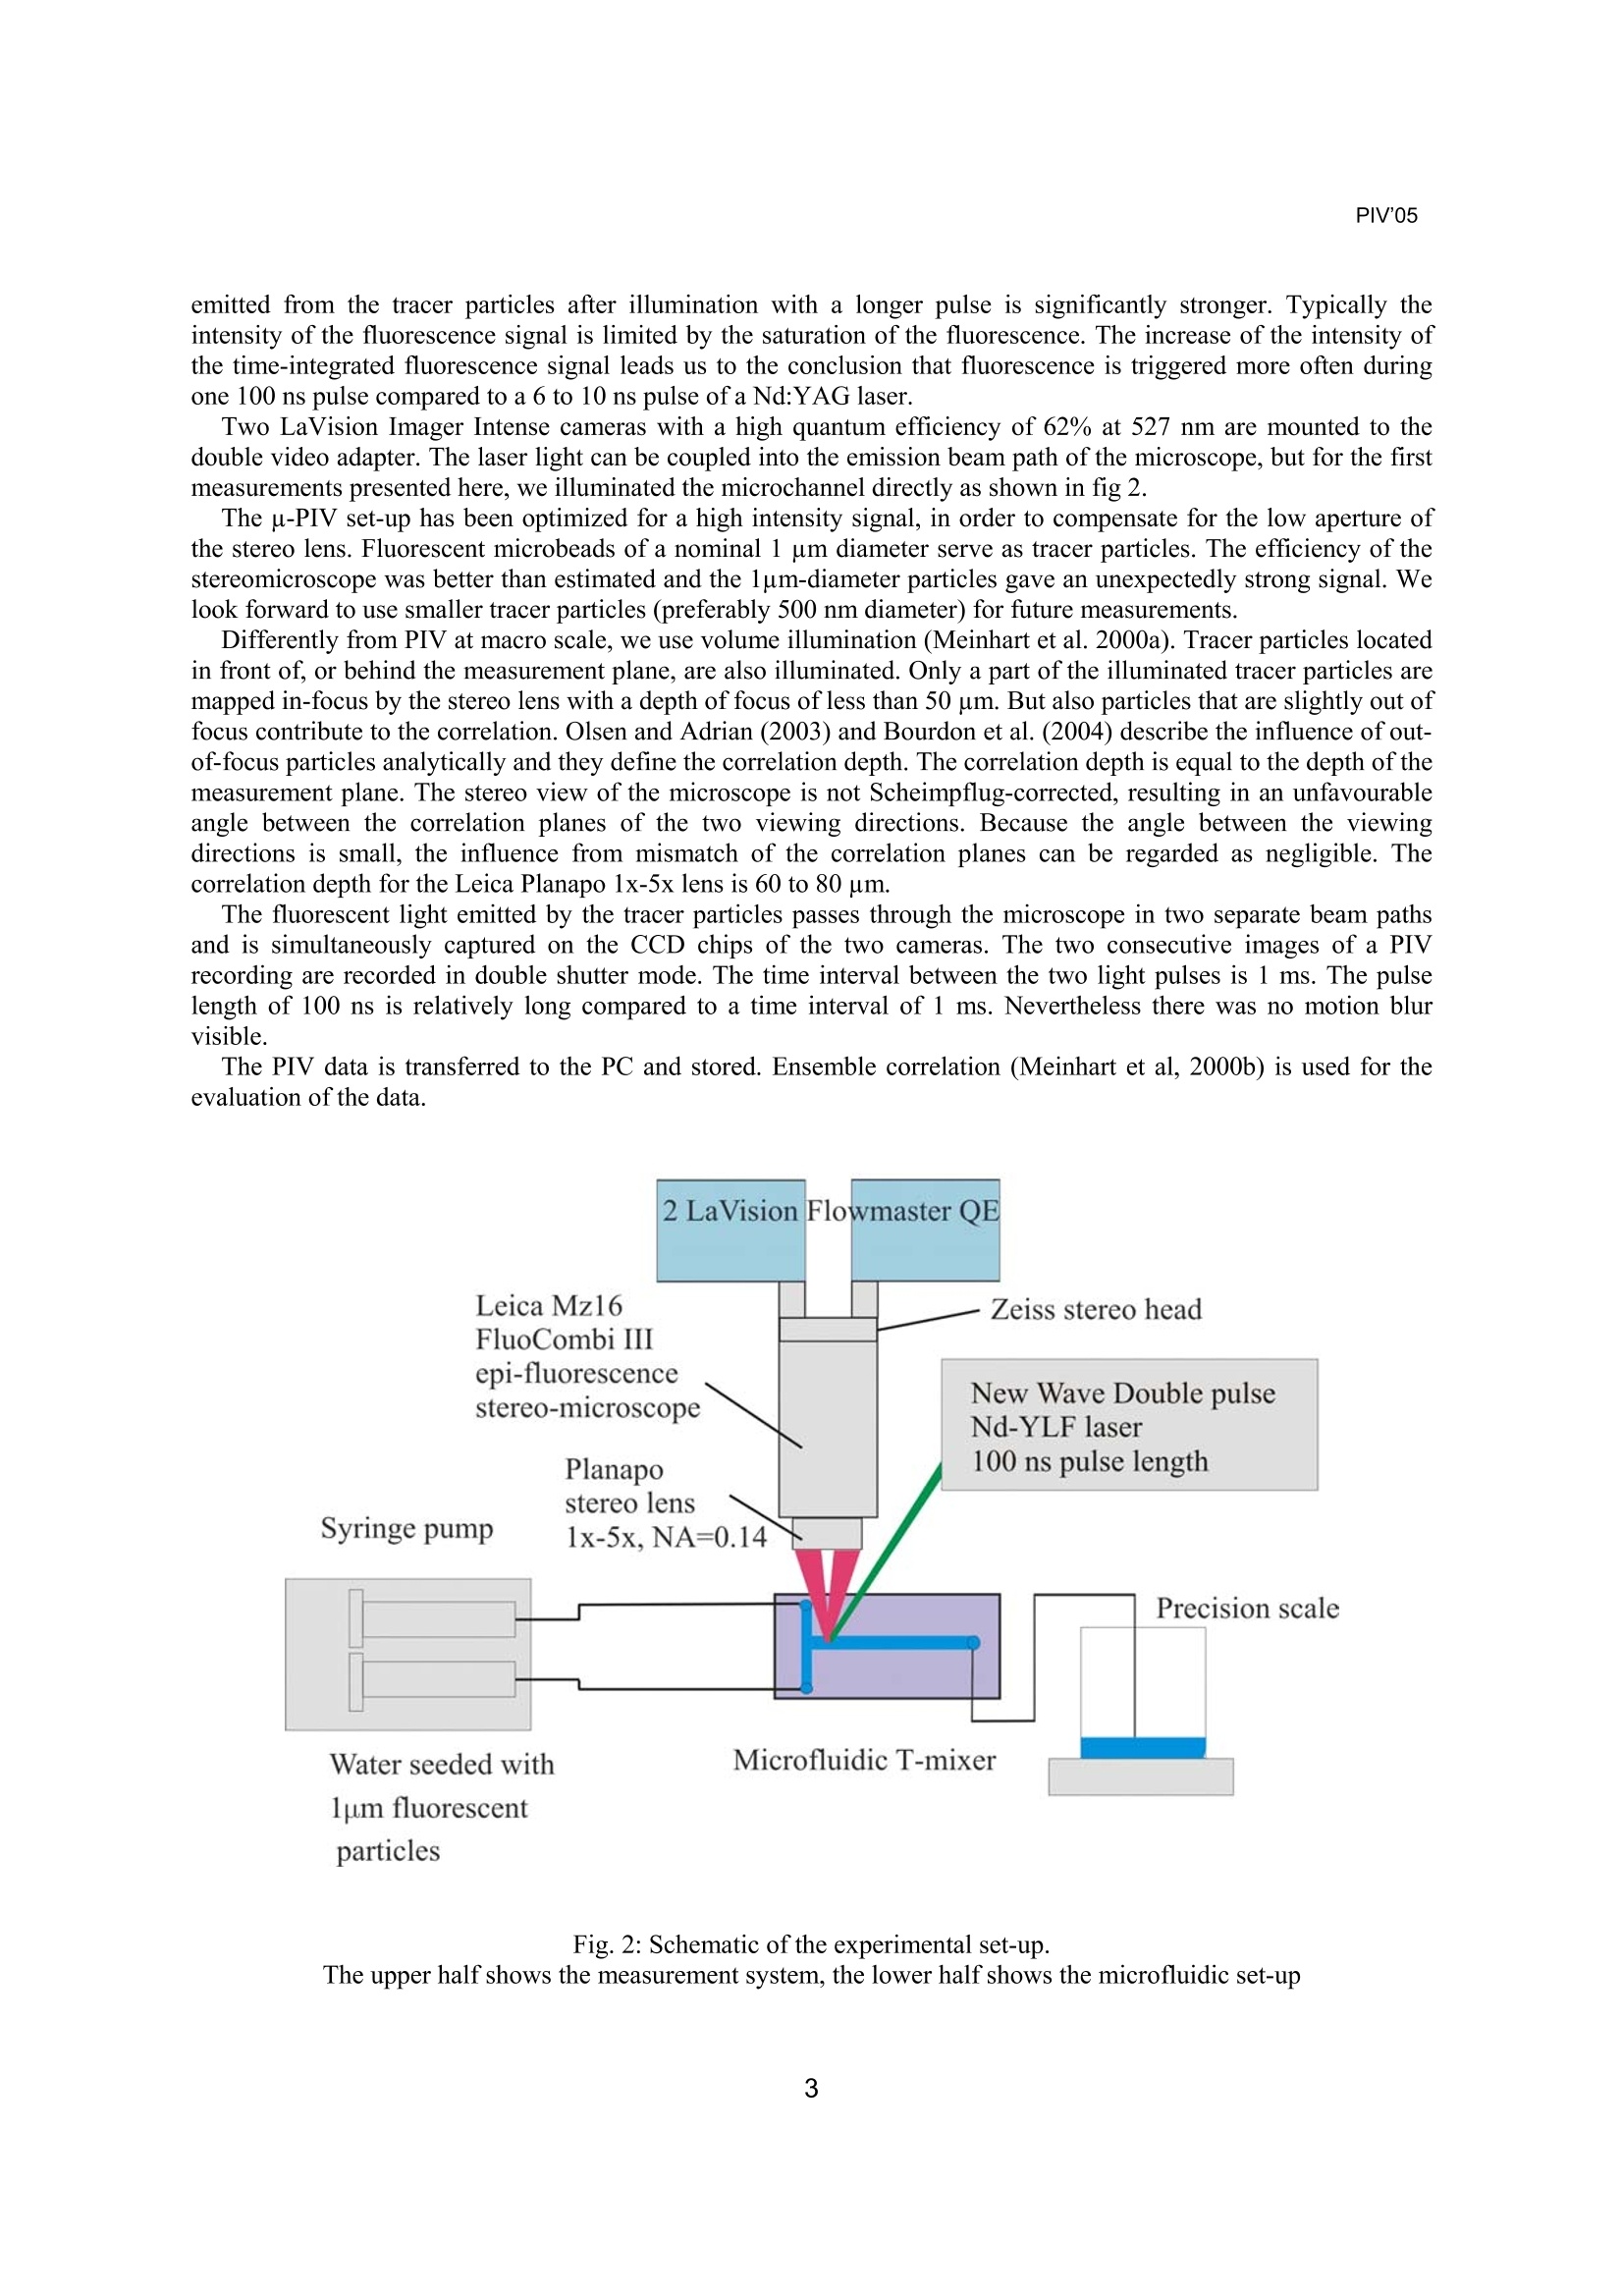
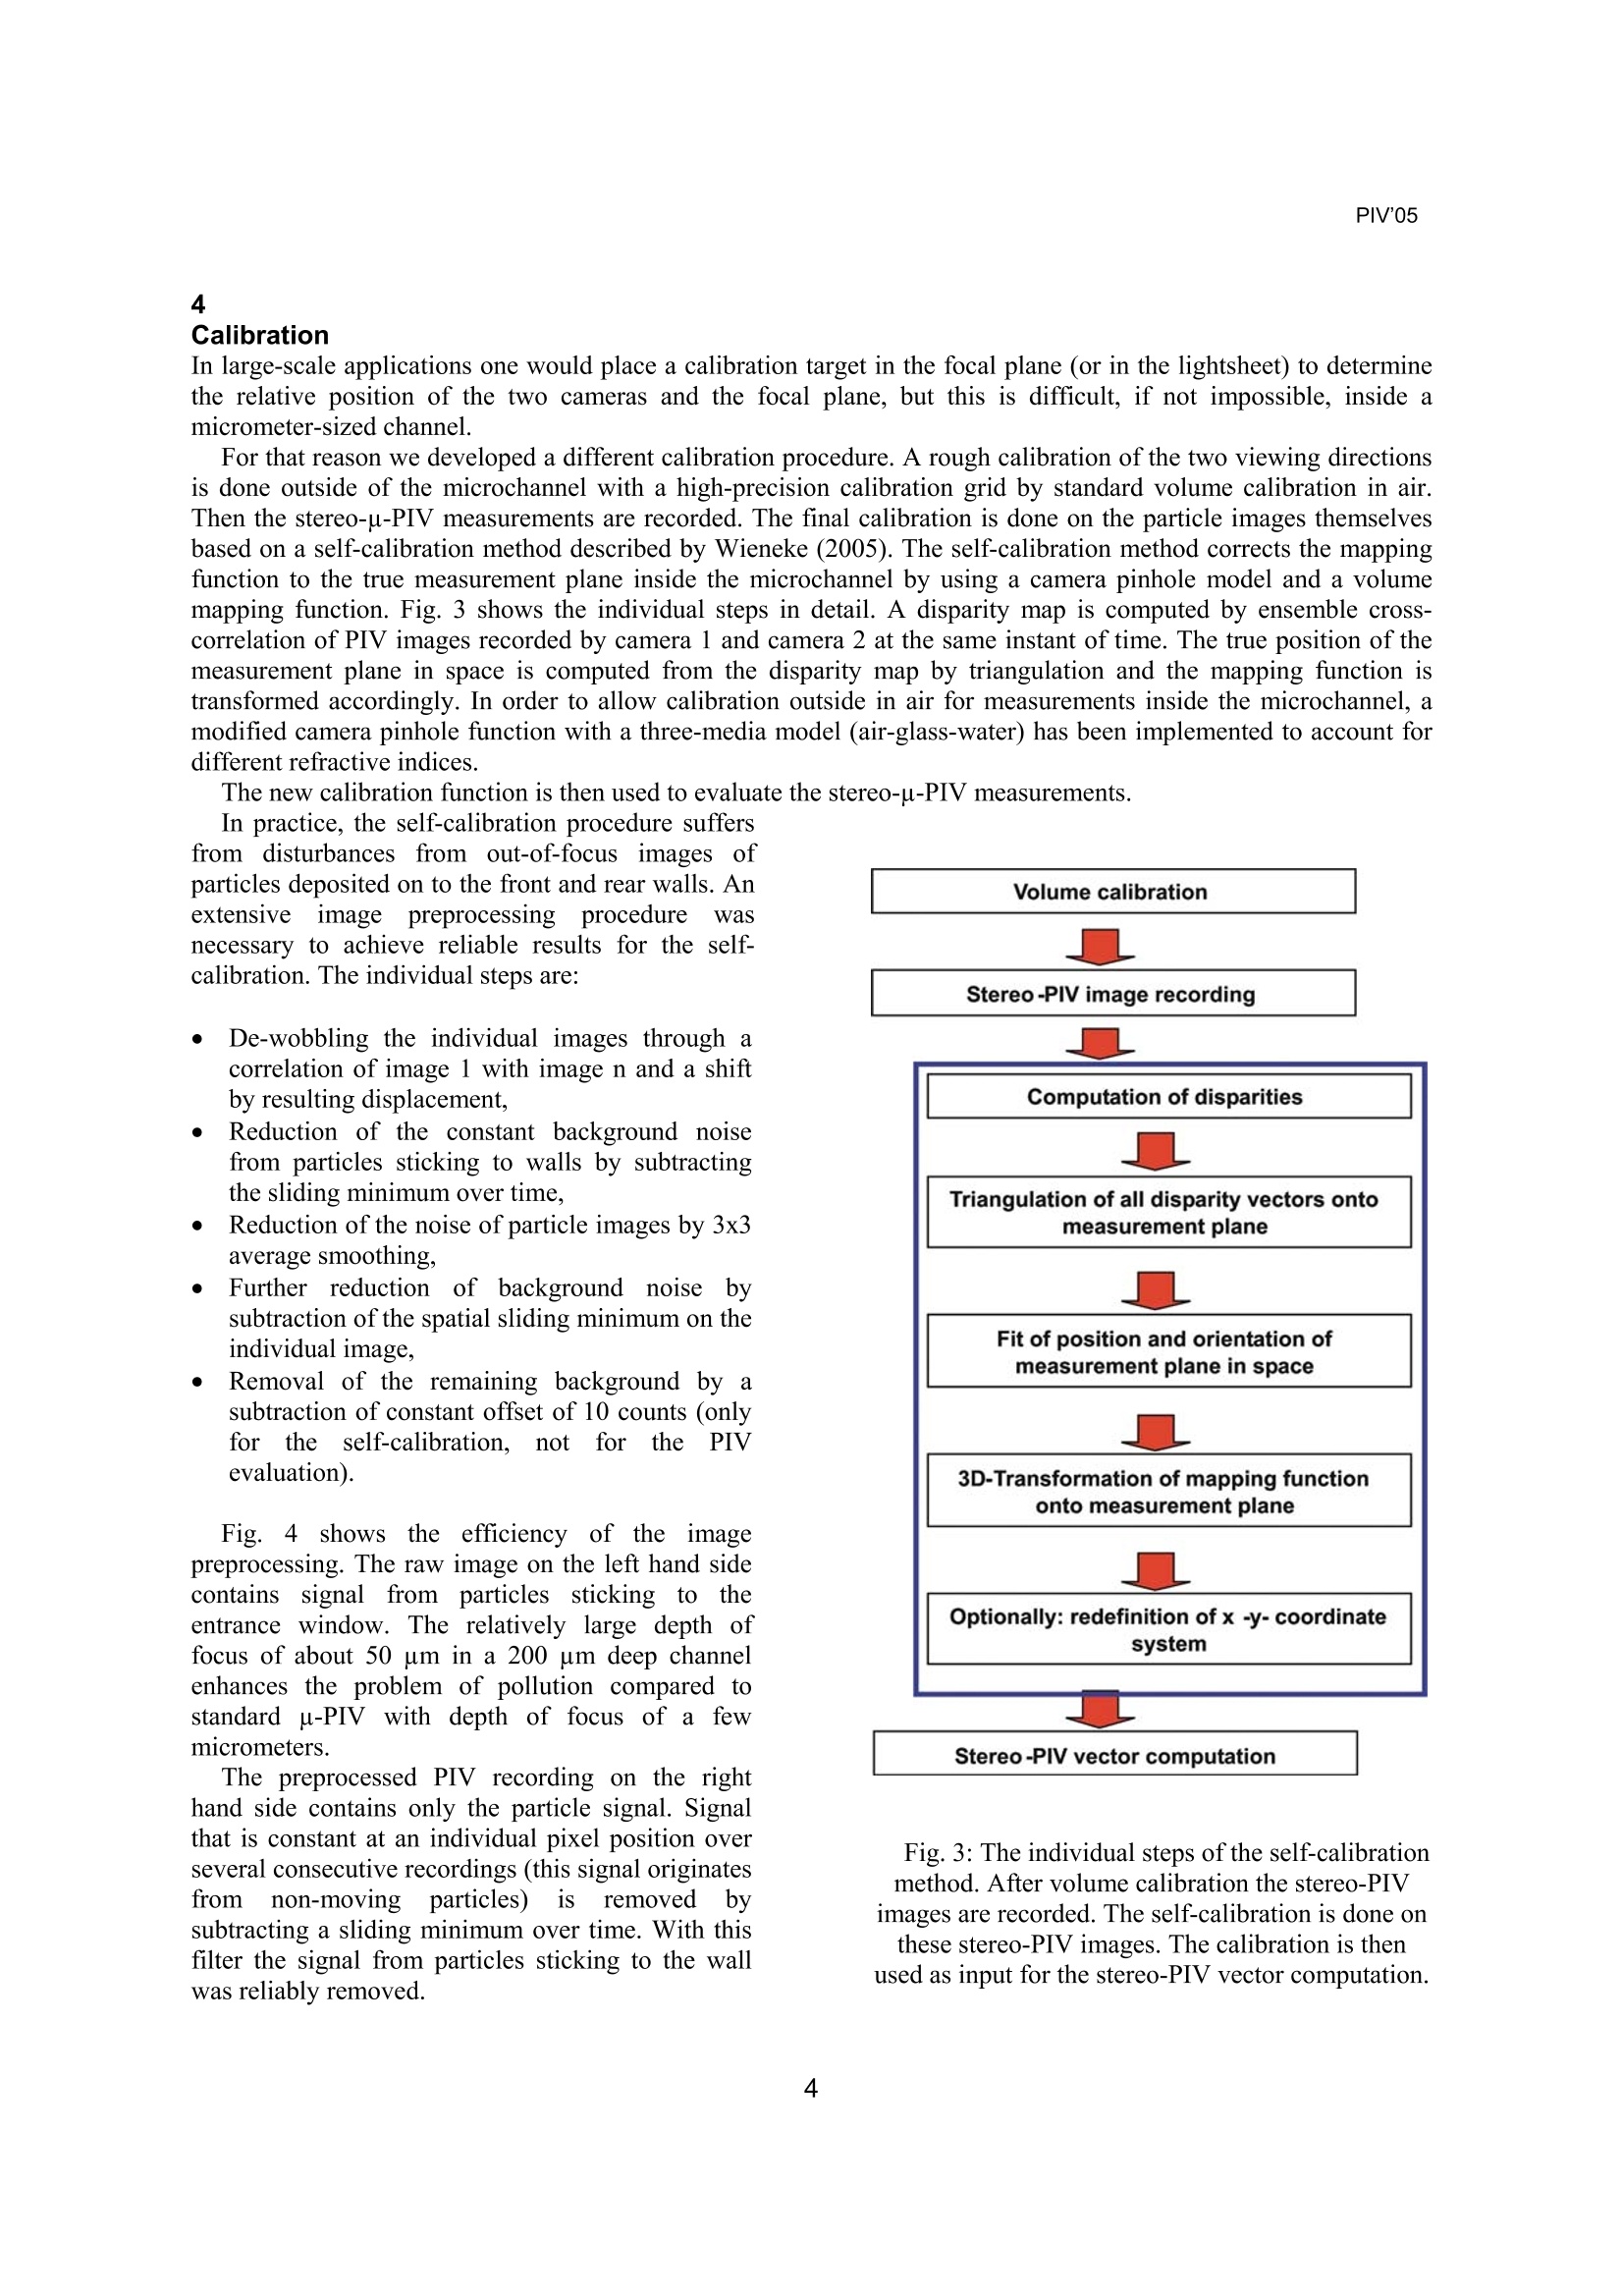
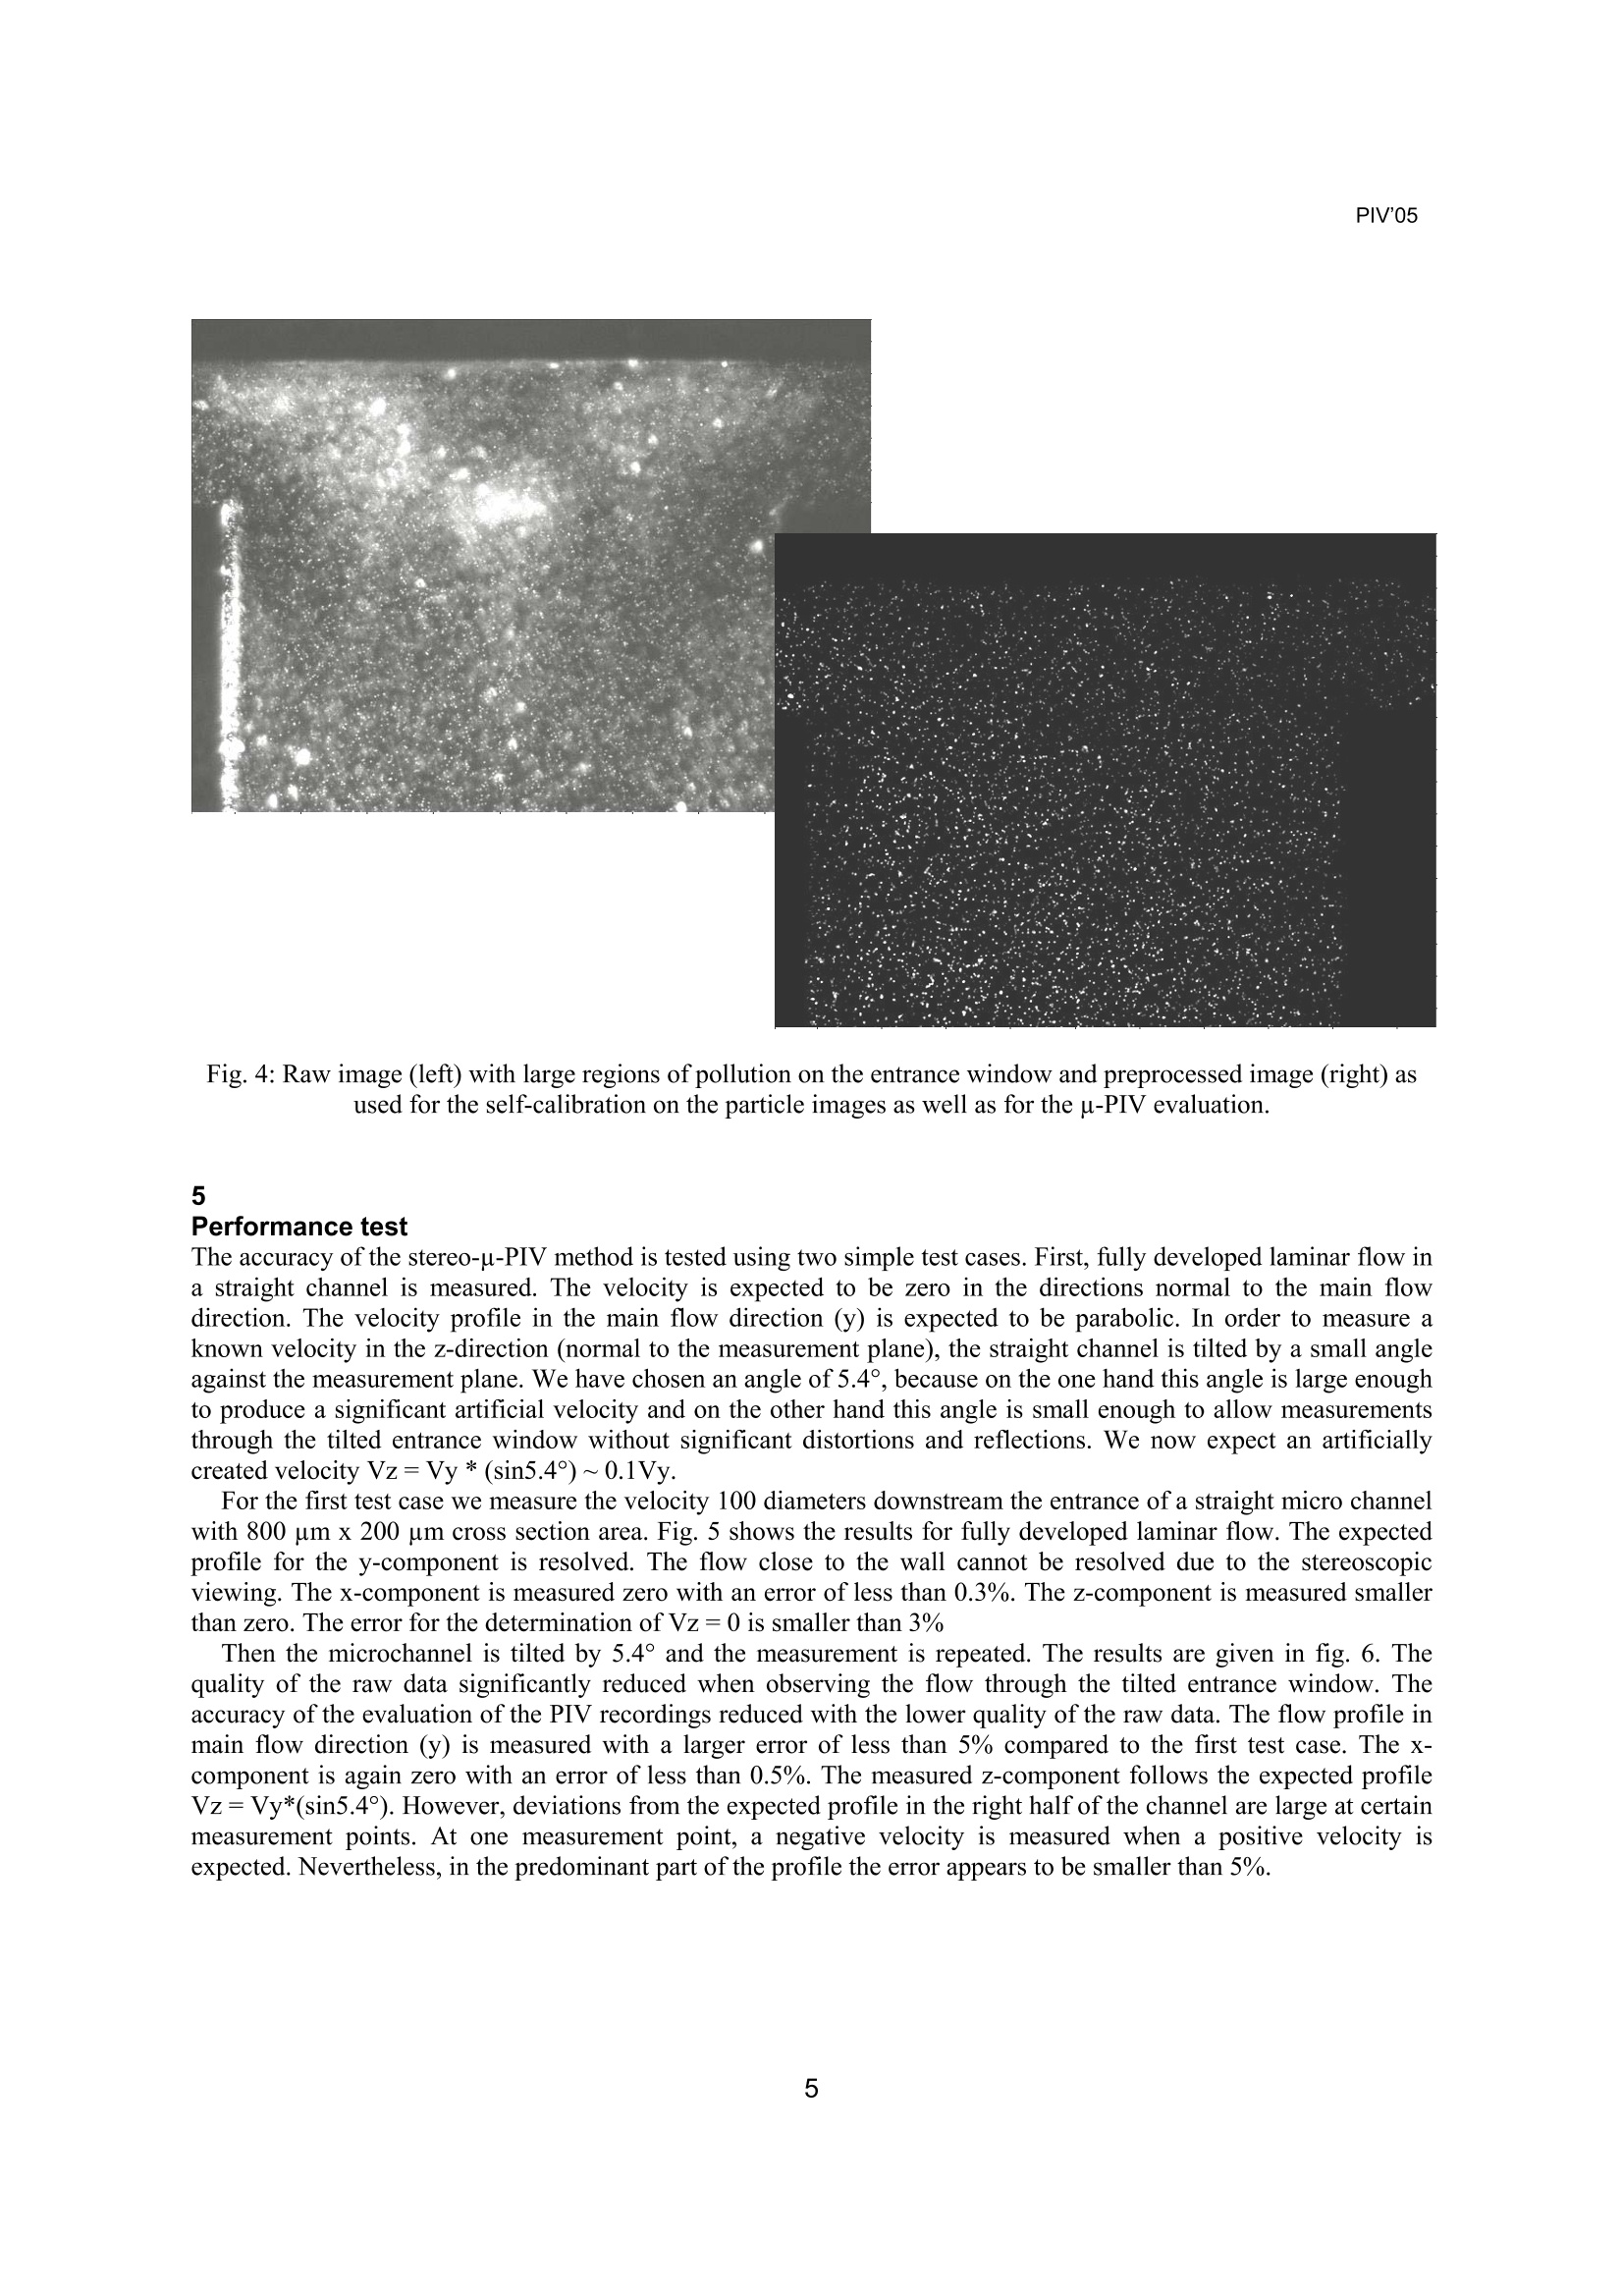
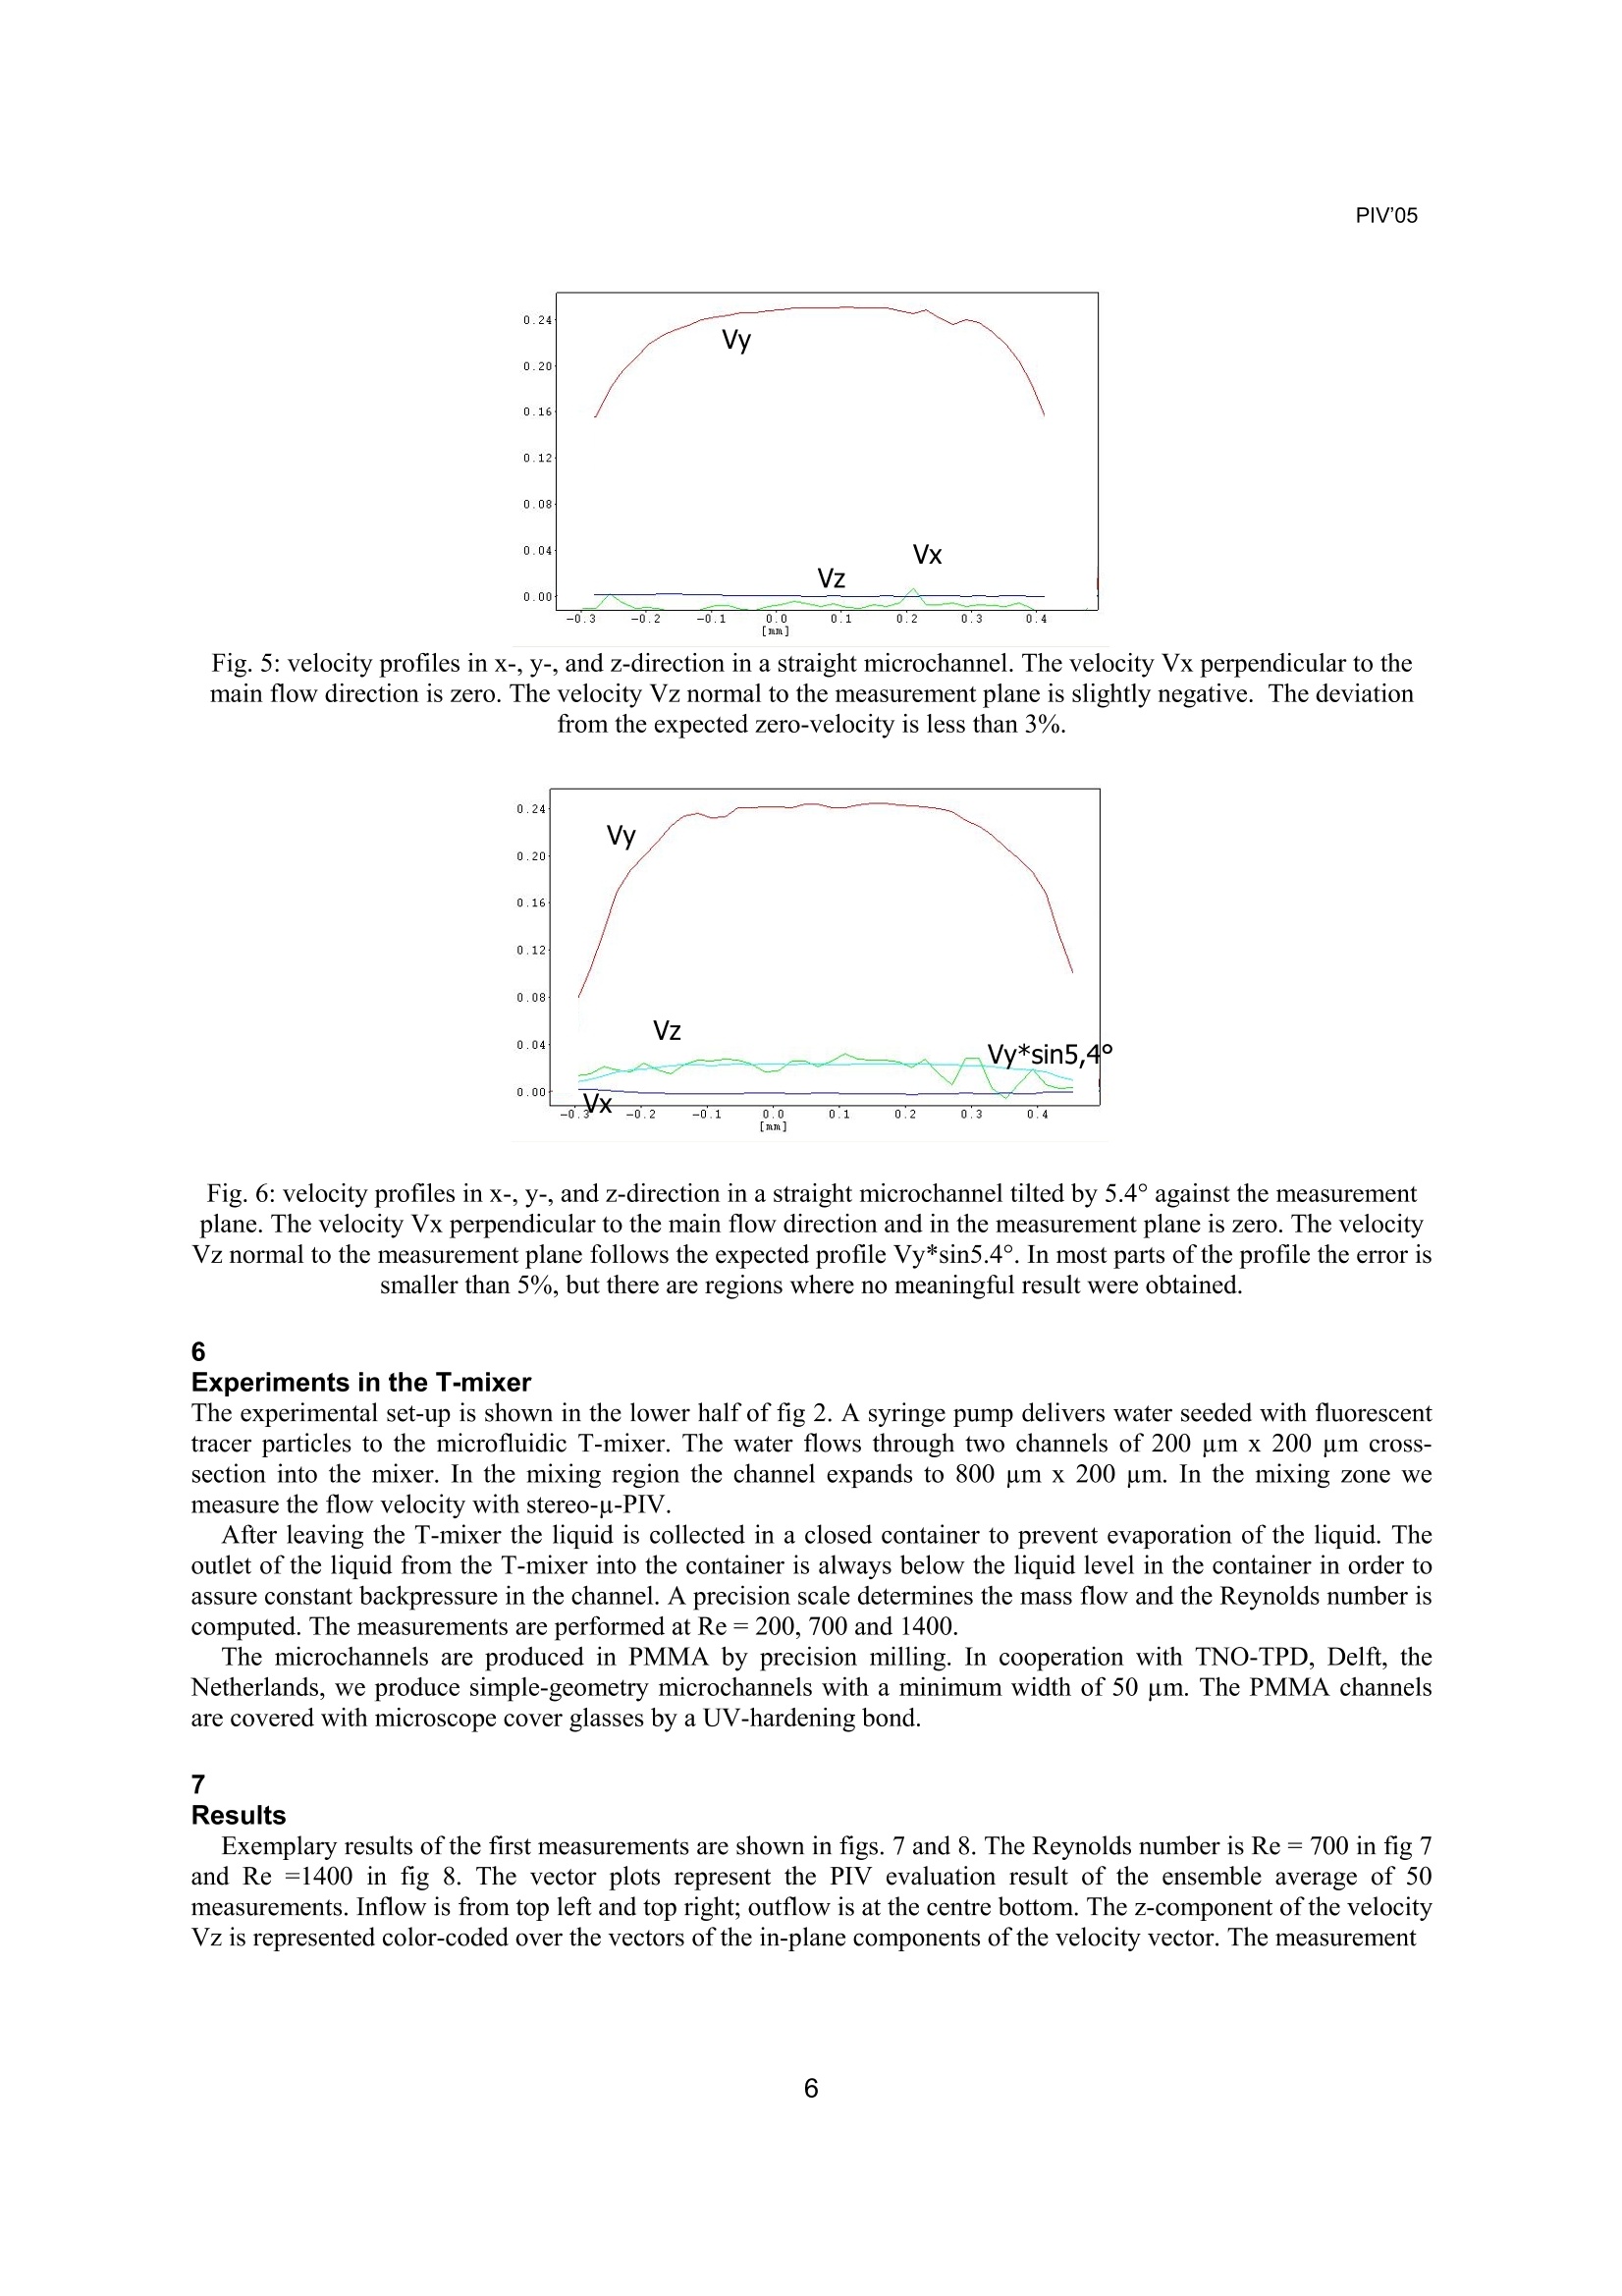
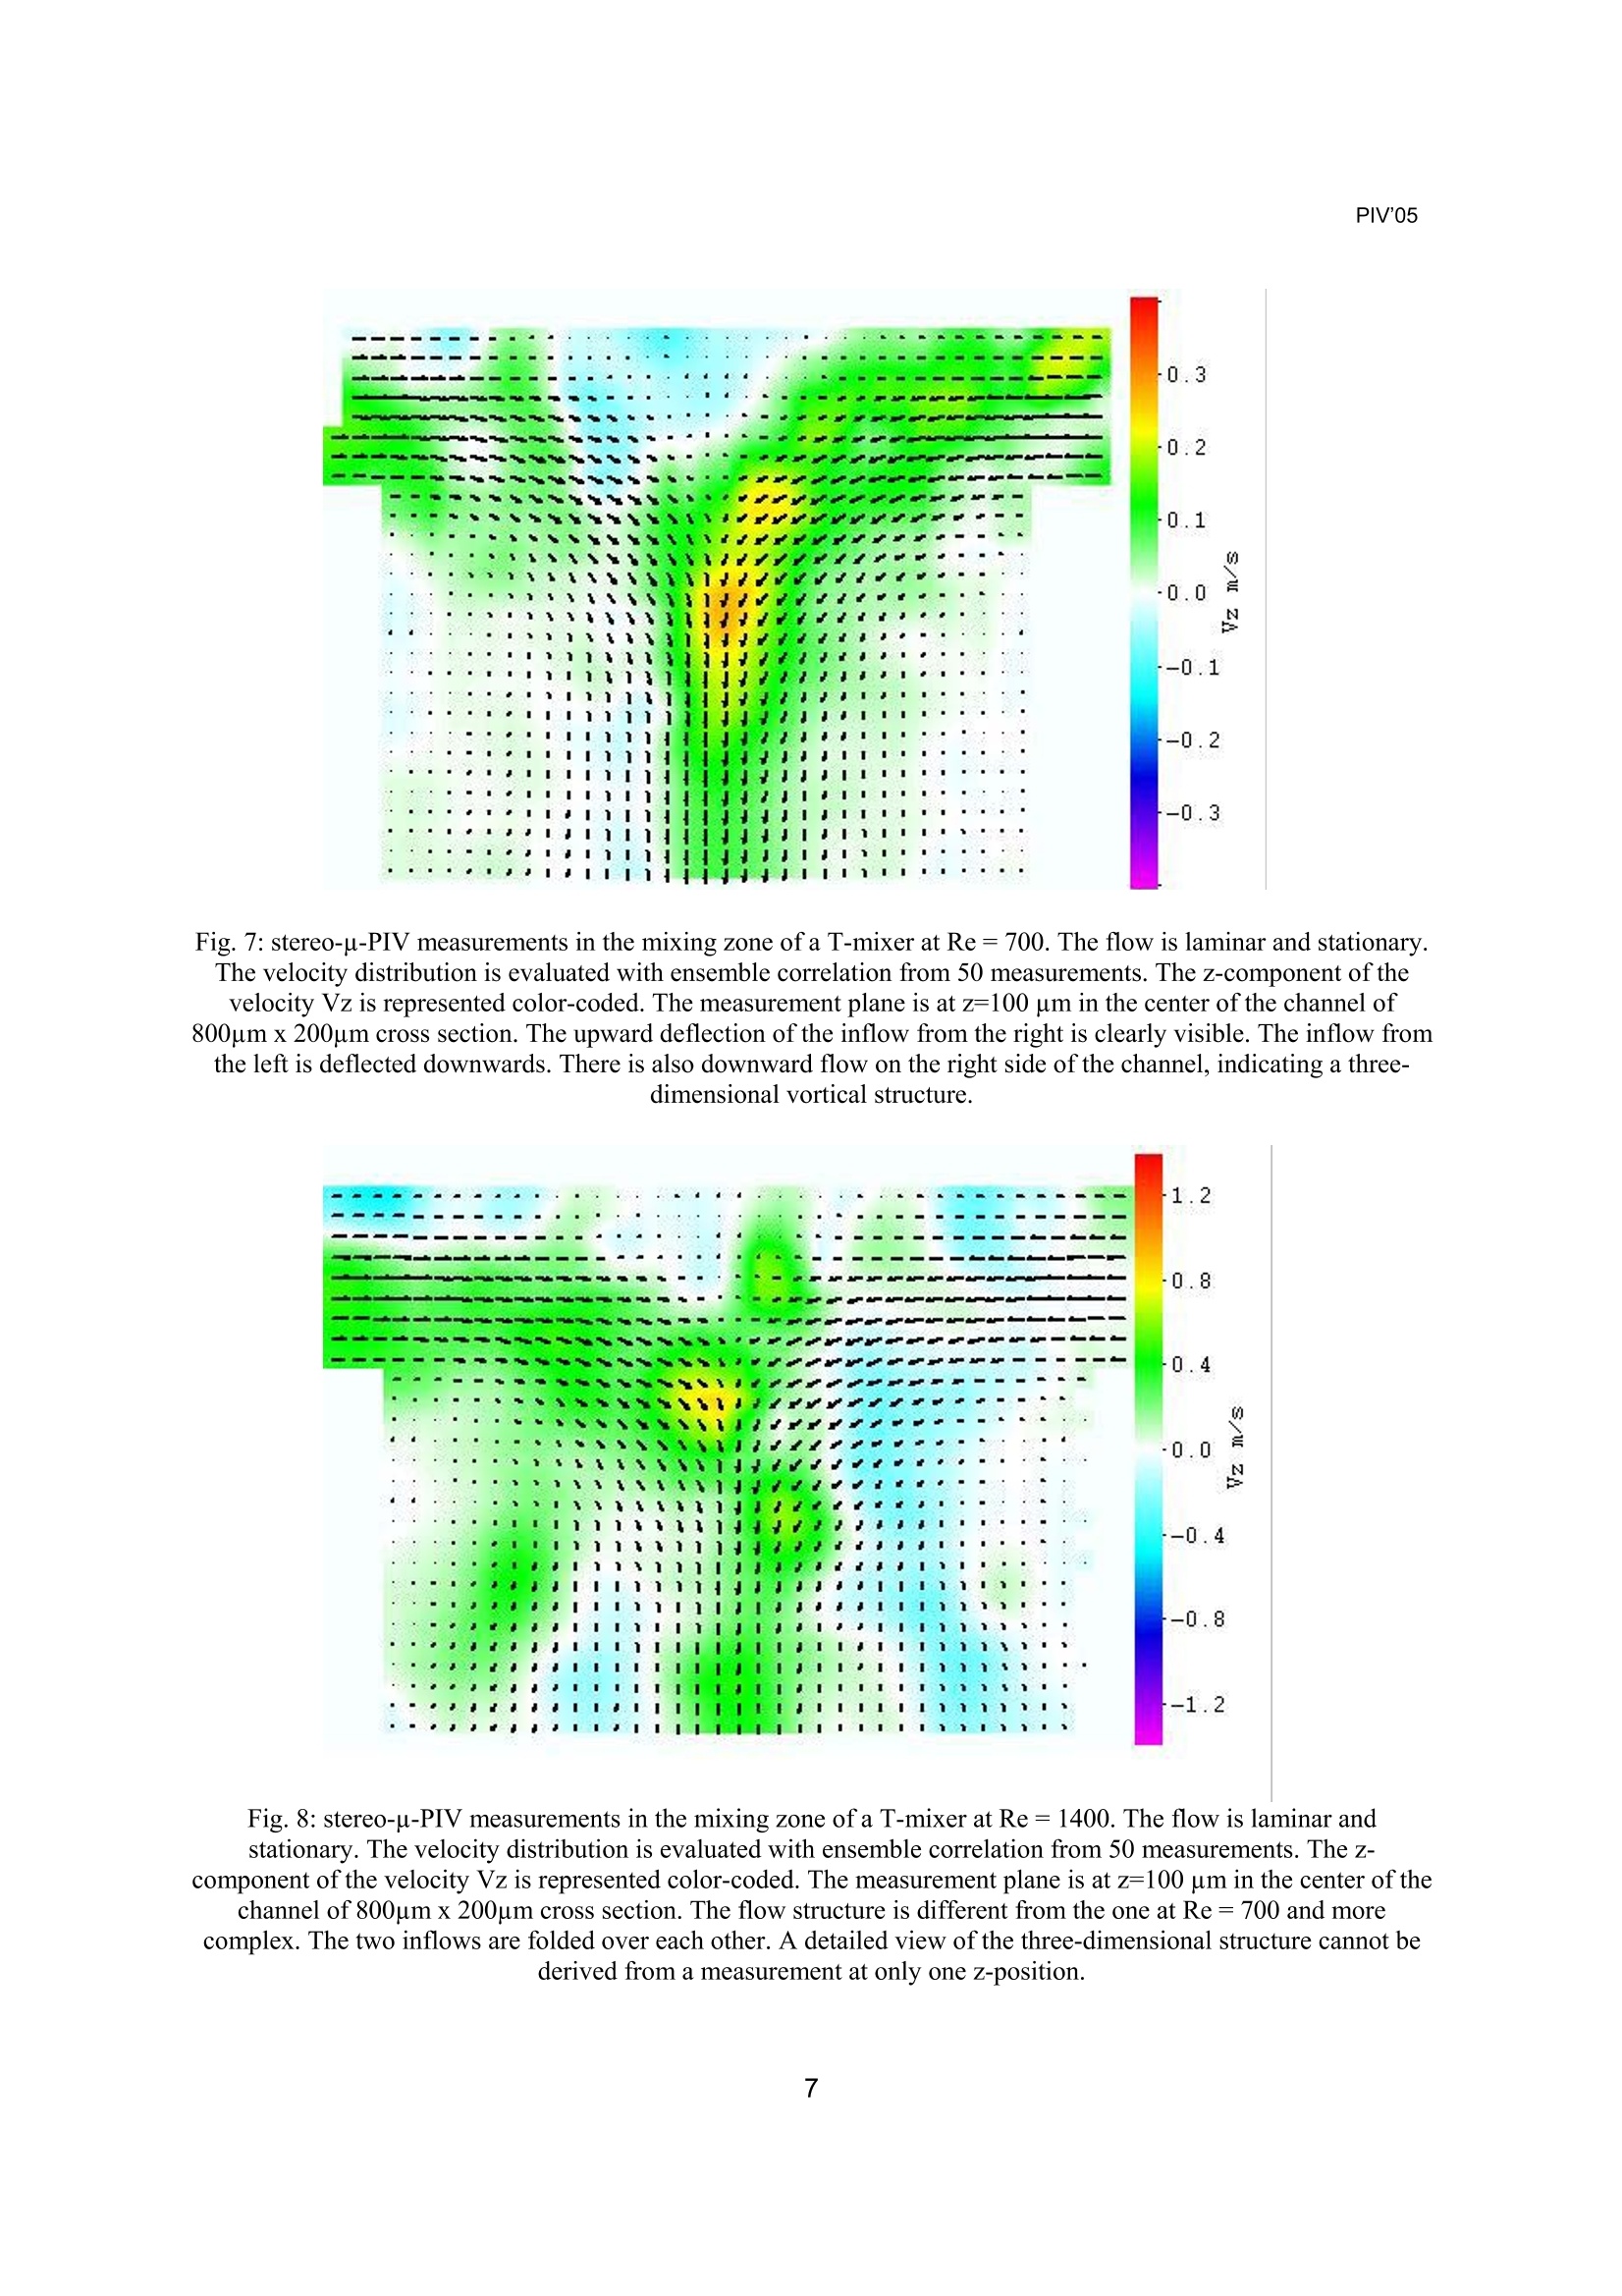
PIV'05 Paper nnnn6th International Symposium on Particle Image VelocimetryPasadena, California, USA, September 21-23, 2005 PIV'05 Development of a Self-Calibrating Stereo-p-PIV System and itsApplication to the Three-Dimensional Flow in a T-Shaped Mixer R. Lindken, J. Westerweel, B. Wieneke Abstract A stereo-u-PIV system for the measurement of all three components of the velocity vector in ameasurement plane (2D-3C) in a closed microchannel has been developed and first test measurements have beenperformed on the three-dimensional laminar flow in a T-shaped micromixer. Stereo-u-PIV measurements in closedmicrochannels require a calibration based on the self-calibration of the tracer particle images. In order to include theeffects of different refractive indices of the water in the microchannel, the glass of the entrance window, and thesurrounding air a three-media-model is included in the triangulation procedure of the self calibration. A preliminarytest case shows that the stereo-u-PIV results deviate less than 5% from theoretical values. First measurements in themixing zone of a T-shaped micromixer show that three-dimensional flow in a microchannel can be resolved,however, the accuracy of the measurements needs to be improved. 1 Introduction Several publications introduced microscopic methods for three-dimensional determination of the velocitydistribution in microchannels. Rohaly et al. (2001) obtained three-dimensional velocity data by changing the opticalset-up of the microscope. They placed an extra off-axis rotating aperture in the light path from the microscope lensto the camera. By shifting the aperture off-axis the defocus blur is sampled. The diameter of the defocus blur isproportional to the distance of the object point from the focal plane. This method works best for low particle imagedensity and large particle diameters of 5 um or more. Low light sensitivity limits application of this method to largeparticles. Lammerding (2002) used the set-up for microrheometry measurements. Yang and Chuang (2004, 2005) developed a holographic u-PIV, using multiplexing on a photopolymer plate. Theyobtain 3D-3C velocity data of a flow behind a backward facing step by means of a concise cross-correlationalgorithm. The authors use 1 um particles, but do not report a figure for the spatial resolution. Ikeda et al. (2005) introduce a digital holographic u-PIV set-up. The hologram is recorded on a CCD camera.They achieve a high, out of plane spatial resolution of 10 um. The particle diameter is limited to 1 um. Velocity datais obtained by means of 3D-PTV./. Park et al (2004a) use a fast confocal laser scanning microscope to map a PIV raw image multiple-pointwise in3D. The fast confocal scanning approach allows depth of focus down to 2.8 um. Although the data in one PIV imageis not recorded at the same instant of time, an optically sliced p-PIV (2C-3D) evaluation is possible. Due to the lowacquisition speed on the order of 25 frames/second and the low light sensitivity the method is restricted to slowflows and large tracer particles. Park et al (2004b) introduced Optical Serial Sectioning Microscopy to obtain 3Dvelocity data from the confocal laser scanning microscopy PIV images. The point spread function (PSF) of an out-of-focus particle is compared with theoretically predicted values for different defocus distances. The match ofpredicted and measured PSF leads to the position of the particle in depth. An alternative is the application of stereoscopic PIV to microscale applications. Klasen et al. (2005) adapt u-PIVas introduced by Meinhart et al. (1999) to a stereo microscope. They exclude the problem of the calibration of thestereo imagingsystem. Klank et al. (2003) circumv ent the calibration problem of the two measurement planes in stereoscopic imaging by applying an approach ofPrasad und Adrian (1993). Klank et al. measure the three-dimensional flow twice with a 2Du-PIV set-up. Thesecond measurement is slightly shifted sideward against the first measurement. The image planes of the two ( R. L i ndken,J. Westerweel ) ( Laboratory for Aero-and Hydrodynamics,Delft University of Technology, the Netherlands ) ( B. Wieneke ) ( LaVision G mbH,An n a-Vandenhoeck-Ring 19, 37081 Goe t t ingen, Germany ) Correspondence to: ( Dr. Ralph L indken, Laboratory for A ero-and Hydrodynamics, Delft University ofTechnology, Leeghwaterstraat 21, 2628CA Delft, the Net h erlands E-mail:r.lindken@wbmt.tudelft.nl ) measurements are parallel and partly overlap. The overlapping part of the measurement plane is measured twicefrom slightly different viewing directions. For non-telecentric microscope lenses both measurements have a verysmall error due to the three-dimensionality of the flow. From that error Klank et al. reconstruct the third componentof the velocity vector. This method is reliable only for perfectly stationary flow and error-free PIV measurements.The accuracy of this method is very low due to the extremely small angle between the viewing directions. In this publication we describe the development of a stereoscopic u-PIV system with calibration of the two imageplanes in a closed microchannel by means of self-calibration on the particle images, and test measurements of thelaminar, three-dimensional flow in a T-mixer. 2 Three-dimensional flow in a T-shaped micro mixer Micro reactors are important components for micro chemical engineering. Due to the large surface-to-volume ratioof miniaturized devices the processes in a micro reactor can be controlled very accurately. Problems arise from thefluid mixing efficiency as mixing at small scale is diffusion limited. A common passive micro mixer consists of T-shaped micro channels. Wong et al. (2004) report that mixing timesin T-mixers are reduced to less than a millisecond at high pressures. By means of dye visualization they detectuniform concentration across the mixing channel at Reynolds numbers of 400 to 500. Wong et al. also performednumerical simulations that identified secondary flow patterns. Although the geometry of the T-mixer is two-dimensional, the flow structure in such a mixer at Reynolds numbers Re > O(100) becomes strongly three- dimensional. Engler et al., (2004), Schliiter et al.(2005) and Hoffmann et al. (2005) investigated themixing theoretically and experimentally. Theyshowed that at low Reynolds numbers the flow islaminarr andtwo-dimensional.WithhigherReynolds numbers, vortical structures evolve inthe deflection region of the T-mixer. At Reynoldsnumbers below 100 the vortical structure consistsof a pair of counter rotating symmetric vortices. AtReynolds numbers of order 100 and1 1higher(depending on the width-to-height ratio of thechannel) the vortical structure becomesasymmetric and the two vortices interact. Bulk isentrained from one vortex into the other and thecontact surface of the two liquids is increased(Fig.1). At even higher Reynolds numbers at Reof order 1000 the flow becomes unstable. Fig. 1: Dye visualization of the flow structure in aT-mixer (with permission from Schliiter 2005) 3 Measurement Equipment The stereo u-PIV set-up is based on several commonly known components and procedures. In principle, these arethe u-PIV method as first introduced by Santiago et al. (1998) and developed to its current state by Meinhart et al.(1999), the stereo-PIV method (Prasad and Adrian 1993, Prasad 2000), and stereo-microscopy. Additionally a novelcalibration (Wieneke 2005) procedure has been applied for the integration of Prasad’s stereo-PIV method to astereomicroscope. The stereo u-PIV system consists of an epi-fluorescent stereomicroscope, a double-pulse laser, optics, fluorescenttracer particles, two digital cameras in double shutter mode, a programmable timing unit for synchronization of thecomponents and a PC for data acquisition and evaluation. The set-up is shown in fig.2. The microscope used in this measurement campaign is a Leica Mz16 FluoCombi ⅢI epi-fluorescentstereomicroscope with a Zeiss double video head (when we did the measurements the Leica double video head wasnot available) and a Leica Planapo 1x-5x stereo lens. The two optical beam paths penetrate the same stereo lens atdifferent off-centre positions, resulting in a small difference in viewing angle for the two viewing directions. Theangle is 10° to 20° for most stereomicroscope designs. A New Wave Pegasus double-pulse Nd:YLF laser with a pulse length of 100 ns serves as light course. Comparedto a flashlamp pumped Nd:YAG laser the diode pumped Nd:YLF laser has the advantage of a 10 to 20 times longerpulse length. The longer pulse length allows more laser power to be transferred through the glued optics of themicroscope without destroying the optics by high peak power. Also the time-integrated signal of fluorescent light emitted from the tracer particles after illumination with a longer pulse is significantly stronger. Typically theintensity of the fluorescence signal is limited by the saturation of the fluorescence. The increase of the intensity ofthe time-integrated fluorescence signal leads us to the conclusion that fluorescence is triggered more often duringone 100 ns pulse compared to a 6 to 10 ns pulse of a Nd:YAG laser. Two LaVision Imager Intense cameras with a high quantum efficiency of 62% at 527 nm are mounted to thedouble video adapter. The laser light can be coupled into the emission beam path of the microscope, but for the firstmeasurements presented here, we illuminated the microchannel directly as shown in fig 2. The u-PIV set-up has been optimized for a high intensity signal, in order to compensate for the low aperture ofthe stereo lens. Fluorescent microbeads of a nominal 1 um diameter serve as tracer particles. The efficiency of thestereomicroscope was better than estimated and the 1um-diameter particles gave an unexpectedly strong signal. Welook forward to use smaller tracer particles (preferably 500 nm diameter) for future measurements. Differently from PIV at macro scale, we use volume illumination (Meinhart et al. 2000a). Tracer particles locatedin front of, or behind the measurement plane, are also illuminated. Only a part of the illuminated tracer particles aremapped in-focus by the stereo lens with a depth of focus of less than 50 um. But also particles that are slightly out offocus contribute to the correlation.Olsen and Adrian (2003) and Bourdon et al. (2004) describe the influence of out-of-focus particles analytically and they define the correlation depth. The correlation depth is equal to the depth of themeasurement plane. The stereo view of the microscope is not Scheimpflug-corrected, resulting in an unfavourableangle between the correlation planes of the two viewing directions. Because the angle between the viewingdirections is small, the influence from mismatch of the correlation planes can be regarded as negligible. Thecorrelation depth for the Leica Planapo 1x-5x lens is 60 to 80 um. The fluorescent light emitted by the tracer particles passes through the microscope in two separate beam pathsand is simultaneously captured on the CCD chips of the two cameras. The two consecutive images of a PIVrecording are recorded in double shutter mode. The time interval between the two light pulses is 1 ms. The pulselength of 100 ns is relatively long compared to a time interval of 1 ms. Nevertheless there was no motion blurvisible. The PIV data is transferred to the PC and stored. Ensemble correlation (Meinhart et al, 2000b) is used for theevaluation of the data. Fig. 2: Schematic of the experimental set-up. The upper half shows the measurement system, the lower half shows the microfluidic set-up In large-scale applications one would place a calibration target in the focal plane (or in the lightsheet) to determinethe relative position of the two cameras and the focal plane, but this is difficult, if not impossible, inside amicrometer-sized channel. For that reason we developed a different calibration procedure. A rough calibration of the two viewing directionsis done outside of the microchannel with a high-precision calibration grid by standard volume calibration in air.Then the stereo-u-PIV measurements are recorded. The final calibration is done on the particle images themselvesbased on a self-calibration method described by Wieneke (2005). The self-calibration method corrects the mappingfunction to the true measurement plane inside the microchannel by using a camera pinhole model and a volumemapping function. Fig. 3 shows the individual steps in detail. A disparity map is computed by ensemble cross-correlation of PIV images recorded by camera 1 and camera 2 at the same instant of time. The true position of themeasurement plane in space is computed from the disparity map by triangulation and the mapping function istransformed accordingly. In order to allow calibration outside in air for measurements inside the microchannel, amodified camera pinhole function with a three-media model (air-glass-water) has been implemented to account fordifferent refractive indices. The new calibration function is then used to evaluate the stereo-u-PIV measurements. In practice, the self-calibration procedure suffersfrom disturbances from out-of-focus images ofparticles deposited on to the front and rear walls. Anextensiveimage preprocessingprocedurewasnecessary to achieve reliable results for the self-calibration. The individual steps are: e DLe-wobbling the individual images through acorrelation of image 1 with image n and a shiftby resulting displacement, Reduction of the constant background noisefrom particles sticking to walls by subtractingthe sliding minimum over time, ● Reduction of the noise of particle images by 3x3average smoothing, Furtherr reduction of background nioise bysubtraction of the spatial sliding minimum on theindividual image, Removal of the remaining background by asubtraction of constant offset of 10 counts (onlyfor theself-calibration.1,notforthe PIVevaluation). Figg.4showsISthe efficiency of the imagepreprocessing. The raw image on the left hand sidecontains signal from particles sticking to theentrance window. The relatively large depth offocus of about 50 um in a 200 um deep channelenhances the problem of pollution compared tostandard p-PIV with depth of focus of a fewmicrometers. The preprocessed PIV recording on the righthand side contains only the particle signal. Signalthat is constant at an individual pixel position overseveral consecutive recordings (this signal originatesfrom non-movingpparticles) is removed. bysubtracting a sliding minimum over time. With thisfilter the signal from particles sticking to the wallwas reliably removed. Volume calibration Stereo-PIV image recording Stereo -PIV vector computation Fig. 3: The individual steps of the self-calibrationmethod. After volume calibration the stereo-PIVimages are recorded. The self-calibration is done onthese stereo-PIV images. The calibration is thenused as input for the stereo-PIV vector computation. Fig. 4: Raw image (left) with large regions of pollution on the entrance window and preprocessed image (right) asused for the self-calibration on the particle images as well as for the u-PIV evaluation. 5 Performance test The accuracy of the stereo-u-PIV method is tested using two simple test cases. First, fully developed laminar flow ina straight channel is measured. The velocity is expected to be zero in the directions normal to the main flowdirection. The velocity profile in the main flow direction(y) is expected to be parabolic. In order to measure aknown velocity in the z-direction (normal to the measurement plane), the straight channel is tilted by a small angleagainst the measurement plane. We have chosen an angle of 5.4°, because on the one hand this angle is large enoughto produce a significant artificial velocity and on the other hand this angle is small enough to allow measurementsthrough the tilted entrance window without significant distortions and reflections. We now expect an artificiallycreated velocity Vz=Vy*(sin5.4°)~0.1Vy. For the first test case we measure the velocity 100 diameters downstream the entrance of a straight micro channelwith 800 um x 200 um cross section area. Fig. 5 shows the results for fully developed laminar flow. The expectedprofile for the y-component is resolved. The flow close to the wall cannot be resolved due to the stereoscopicviewing. The x-component is measured zero with an error of less than 0.3%. The z-component is measured smallerthan zero. The error for the determination of Vz =0 is smaller than 3% Then the microchannel is tilted by 5.4° and the measurement is repeated. The results are given in fig. 6. Thequality of the raw data significantly reduced when observing the flow through the tilted entrance window. Theaccuracy of the evaluation of the PIV recordings reduced with the lower quality of the raw data. The flow profile inmain flow direction (y) is measured with a larger error of less than 5% compared to the first test case. The x-component is again zero with an error of less than 0.5%. The measured z-component follows the expected profileVz=Vy*(sin5.4°). However, deviations from the expected profile in the right half of the channel are large at certainmeasurement points. At one measurement point, a negative velocity is measured when a positive velocity isexpected. Nevertheless, in the predominant part of the profile the error appears to be smaller than 5%. Fig. 5: velocity profiles in x-, y-, and z-direction in a straight microchannel. The velocity Vx perpendicular to themain flow direction is zero. The velocity Vz normal to the measurement plane is slightly negative. The deviationfrom the expected zero-velocity is less than 3%. Fig. 6: velocity profiles in x-, y-, and z-direction in a straight microchannel tilted by 5.4° against the measurementplane. The velocity Vx perpendicular to the main flow direction and in the measurement plane is zero. The velocityVz normal to the measurement plane follows the expected profile Vy*sin5.4°. In most parts of the profile the error issmaller than 5%, but there are regions where no meaningful result were obtained. 6Experiments in the T-mixer The experimental set-up is shown in the lower half of fig 2. A syringe pump delivers water seeded with fluorescenttracer particles to the microfluidic T-mixer. The water flows through two channels of 200 um x 200 um cross-section into the mixer. In the mixing region the channel expands to 800 um x 200 um. In the mixing zone wemeasure the flow velocity with stereo-u-PIV. After leaving the T-mixer the liquid is collected in a closed container to prevent evaporation of the liquid. Theoutlet of the liquid from the T-mixer into the container is always below the liquid level in the container in order toassure constant backpressure in the channel. A precision scale determines the mass flow and the Reynolds number iscomputed. The measurements are performed at Re=200, 700 and 1400. The microchannels are produced in PMMA by precision milling. In cooperation with TNO-TPD, Delft, theNetherlands, we produce simple-geometry microchannels with a minimum width of 50 um. The PMMA channelsare covered with microscope cover glasses by a UV-hardening bond. 7 Results Exemplary results of the first measurements are shown in figs. 7 and 8. The Reynolds number is Re= 700 in fig 7and Re =1400 in fig 8. The vector plots represent the PIV evaluation result of the ensemble average of 50measurements. Inflow is from top left and top right; outflow is at the centre bottom.The z-component of the velocityVz is represented color-coded over the vectors of the in-plane components of the velocity vector. The measurement Fig. 7: stereo-u-PIV measurements in the mixing zone of a T-mixer at Re =700. The flow is laminar and stationaryThe velocity distribution is evaluated with ensemble correlation from 50 measurements. The z-component of thevelocity Vz is represented color-coded. The measurement plane is at z=100 um in the center of the channel of 800um x 200um cross section. The upward deflection of the inflow from the right is clearly visible. The inflow fromthe left is deflected downwards. There is also downward flow on the right side of the channel,indicating a three-dimensional vortical structure. Fig. 8: stereo-u-PIV measurements in the mixing zone of a T-mixer at Re=1400. The flow is laminar andstationary. The velocity distribution is evaluated with ensemble correlation from 50 measurements. The z-component of the velocity Vz is represented color-coded. The measurement plane is at z=100 um in the center of the channel of 800um x 200um cross section. The flow structure is different from the one at Re=700 and more.complex. The two inflows are folded over each other. A detailed view of the three-dimensional structure cannot bederived from a measurement at only one z-position. plane is at z=100 um in the center of the channel of 800um x 200um cross section. The thickness of themeasurement plane is 60 to 80 um. That is equivalent to one third of the channel depth and obviously too large toresolve the flow in full detail in 3D. At Re=700 (fig7) the flow is laminar and stationary, but the inflows from right and left interact, creating astationary, large-scale three-dimensional flow pattern. The maximum out-of-plane velocities are of the same order asthe maximum in-plane velocities. The upward deflection of the inflow from the right is clearly visible. The inflowfrom the left is deflected downwards. The measured velocity distribution matches well with the dye visualizationpresented in fig. 1. The measured downward velocities are smaller than the upward velocities, indicating a largemeasurement error. We explain this measurement error with a mismatch of the measurement planes for the twoviewing directions by 5 um. This mismatch results in an error towards a higher Vz component. While the two inflows at Re =700 is deflected over each other, there is a different stationary flow pattern at Re =1400 (fig. 8). The flow pattern at Re= 1400 is more complex, resulting in various regions of upward and downwarddirected flow. From one measurement in the center of the channel it is difficult to derive a three-dimensional flowpattern. Measurements at different depth positions with a smaller depth of correlation are necessary. Nevertheless,the strong three-dimensionality of the flow that enhances mixing is visible. 8 Discussion We developed a stereo-u-PIV system for 2D3C velocity measurements inside closed microchannels. Thecalibration inside closed measurement volumes is possible by means of self-calibration on the particle images. Athree media model allows calibration through interfaces with refractive index change. First measurements demonstrated the potential of the technique. The accuracy of this method is determined bypreliminary test measurements in a tilted straight channel. The error in the determination of the velocity normal tothe measurement plane was below 10%. The accuracy of stereo-PIV at macro scale is significantly better. Forstereomicroscope applications the accuracy is limited by the small angle between the viewing directions. For themicroscope used in this measurement the angle is determined to 17°. We were not able to achieve a high accuracy for measurements in the mixing zone of the T-mixer. When the firstmeasurements were performed the only scientific grade stereo lens available was the Leica Planapo 1x-5x stereolens. The fitting parameters of the self calibration algorithm also contain geometry data of the imaging system. Bymeans of self calibration we determined the correlation depth of the lens to 70 um ±10 um, while the depth of themicrochannel is 200 um. A correlation depth of one third of the channel diameter is too large to resolve the stronglythree-dimensional flow with high accuracy. Meanwhile another lens Leica Planapo 2x with better aperture becameavailable. We will test this lens in future measurements. The geometry data obtained from the self-calibration showed that the focal planes of the two camera views had anoffset of 5 um. Because the flow changes significantly over a depth of 5 um, the small offset results in an error inthe determination of the Vz velocity. For future measurements we will eliminate this error source by fine adjustmentof the camera planes. The first measurements have shown that highly accurate measurements in closed microchannels are possible. Wewere able to detect several error sources: ·Pollution of the walls with tracer particles strongly disturbs the self calibration algorithm. The influence ofparticles sticking to the wall is more dominant with a larger depth of correlation of the imaging system. We havedemonstrated a reliable image preprocessing procedure to remove the signals of particles sticking to the wall. Weare currently testing the influence of hydrophobic and hydrophilic coatings of the cover plate, as well asPolyethylenglykol (PEG) coating of the tracer particles, on the particle deposition on the wall. Stereomicroscopy lenses have a larger depth of focus compared to standard high quality microscope lenses. Thisreduces the spatial resolution in the z-direction, as well as the accuracy if large gradients (Ov.z/0z) arepresent. · The small angle between the two camera views of 10° to 20° for most commercially available stereomicroscopeslimits the accuracy of the stereo-PIV method. References Bourdon CJ, Olsen MG, Gorby AD (2004) Validation of an analytical solution for depth of correlation inmicroscopic particle image velocimetry. Meas Sci Technol 15:318-327 Engler M, Kockmann N, Kiefer T, Woias P (2004) Numerical and experimental investigations on liquid mixing instatic micromixers. Chem Eng J101:315-322 Hoffmann M, Schluiter M, Rabiger N (2005) Experimental investigation of micromixing in T-shaped micromixersusing u-LIF and u-PIV, AIChE Spring National Meeting/IMRET 8-8th International Conference on MicroreactionTechnology, session 130 Ikeda K, Ooms T, Westerweel J (2005) Feasibility study on microscopic digital holographic PIV. Proceedings ofthe PIVNET2 International Workshop on uPIV and Applications in Microsystems, Delft, the Netherlands Klank H, Goranovic G, Kutter JP,Gjelstrup H, Michelsen J, Westergaard CH (2002) PIV measurements in a microfluidic 3D-sheathing structure with three-dimensional flow behaviour.J Micromech Microeng 12:862-869Klasen LG, Brede M, Leder A (2005) Design and development of a stereo micro PIV-system. Proceedings of thePIVNET2 International Workshop on uPIV and Applications in Microsystems, Delft, the Netherlands Lammerding J,Rohaly J, Hart DP (2002) Monocular 3-D magnetic bead microrheometry. Abstra 11th Int. Symp. Application of Laser Techniques to Fluid Mechanics, paper 1-1, Lisbon, PortugalLindken R, Westerweel J, Wieneke B (2005) Stereoscopic micro PIV applied to the three-dimensional flow in a T-mixer. Proceedings of the PIVNET2 International Workshop on uPIV and Applications in Microsystems, Delft, theNetherlands Maas HG(1992) Contributions of digital photogrammetry to 3D PTV. In: Three-Dimensional Velocity andVorticity. Measuring and Image Analysis Techniques. (ed Dracos T) 191-208, Kluwer, NL ( Meinhart CD, Wereley ST, Santiago JG (1999) PIV mea s urements of a microchannel flow. Exp Fluids 27:414- 419 ) ( Meinhart CD, Wereley ST, Gray HB ( 2 000a) Volume illumination for tw o -dimensional particle imagevelocimetry, Meas Sci Techn 11:809-814 ) ( Meinhart CD, Wereley ST, Santiago JG (2000b) A PIV algorithm for estimating time-averaged veloc i ty fields. J Fluids Engineering 122:285-289 ) Olsen MG, Adrian RJ(2000) Out-of-focus effects on particle image visibility and correlation in microscopicparticle image velocimetry. Exp Fluids 29:166-174 Park JS, Choi CK, Kihm KD (2004a) Optically sliced micro-PIV using confocal laser scanning microscopy(CLSM). Exp Fluids,37:105-119 ( Park JS, Choi CK, Kihm KD (2004b) Nanoparticle tracking using CLSM (confocal laser scanning microscopy) & OSSM (optical serial sectioning microscopy) imaging. J Heat Transfer 126:504 ) ( Prasad AK, Adrian RJ (1993) Stereoscopic particle image velocimetry applied to liquid flows. Exp F luids 15:49- 60 ) Prasad AK (2000) Stereoscopic particle image velocimetry. Exp Fluids 29:103-116 Rohaly J,Lammerding J, Frigerio F, Hart DP (2001) Monocular 3-D active micro-PTV. Proceedings of the 4"International Symposium on Particle Image Velocimetry, paper 1147 ( Santiago JG, Wereley ST, Meinhart CD, Beebe DJ, Adrian RJ (1998) A particle image velocimetry system fo r microfluidics. Exp Fluids 25:316-319 ) Schliiter M, Hoffmann M, Rabiger N (2005) Investigations on micromixing in T-shaped micromixers using u-LIFand u-PIV. Proceedings of the PIVNET2 International Workshop on uPIV and Applications in Microsystems.Wieneke B (2005) Stereo-PIV using self-calibration on particle images. Exp Fluids 39, published online firstWong SH, Ward MCL,Wharton CW (2004) Micro T-mixer as a rapid mixing micromixer. Sensors and ActuatorsB 100:359-379 Yang CT, Chuang HS (2004) Three-dimensional microflow measurement by using hybrid multiplexed holography.Abstracts of the 12th Int. Symp. Application of Laser Techniques to Fluid Mechanics, paper 6-1, Lisbon, Portugal. Yang CT, Chuang HS (2005) Measurement of a microchamber flow by using a hybrid multiplexing holographicvelocimetry. Exp Fluids 39, published online first
确定
还剩7页未读,是否继续阅读?

产品配置单

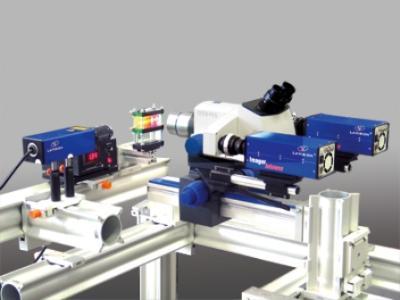
北京欧兰科技发展有限公司为您提供《T型混合器中三维流动,速度场,速度矢量场,2D3C显微速度矢量场检测方案(粒子图像测速)》,该方案主要用于其他中三维流动,速度场,速度矢量场,2D3C显微速度矢量场检测,参考标准--,《T型混合器中三维流动,速度场,速度矢量场,2D3C显微速度矢量场检测方案(粒子图像测速)》用到的仪器有显微粒子成像测速系统(Micro PIV)、PLIF平面激光诱导荧光火焰燃烧检测系统
推荐专场


相关方案
更多
该厂商其他方案
更多