


方案详情
文
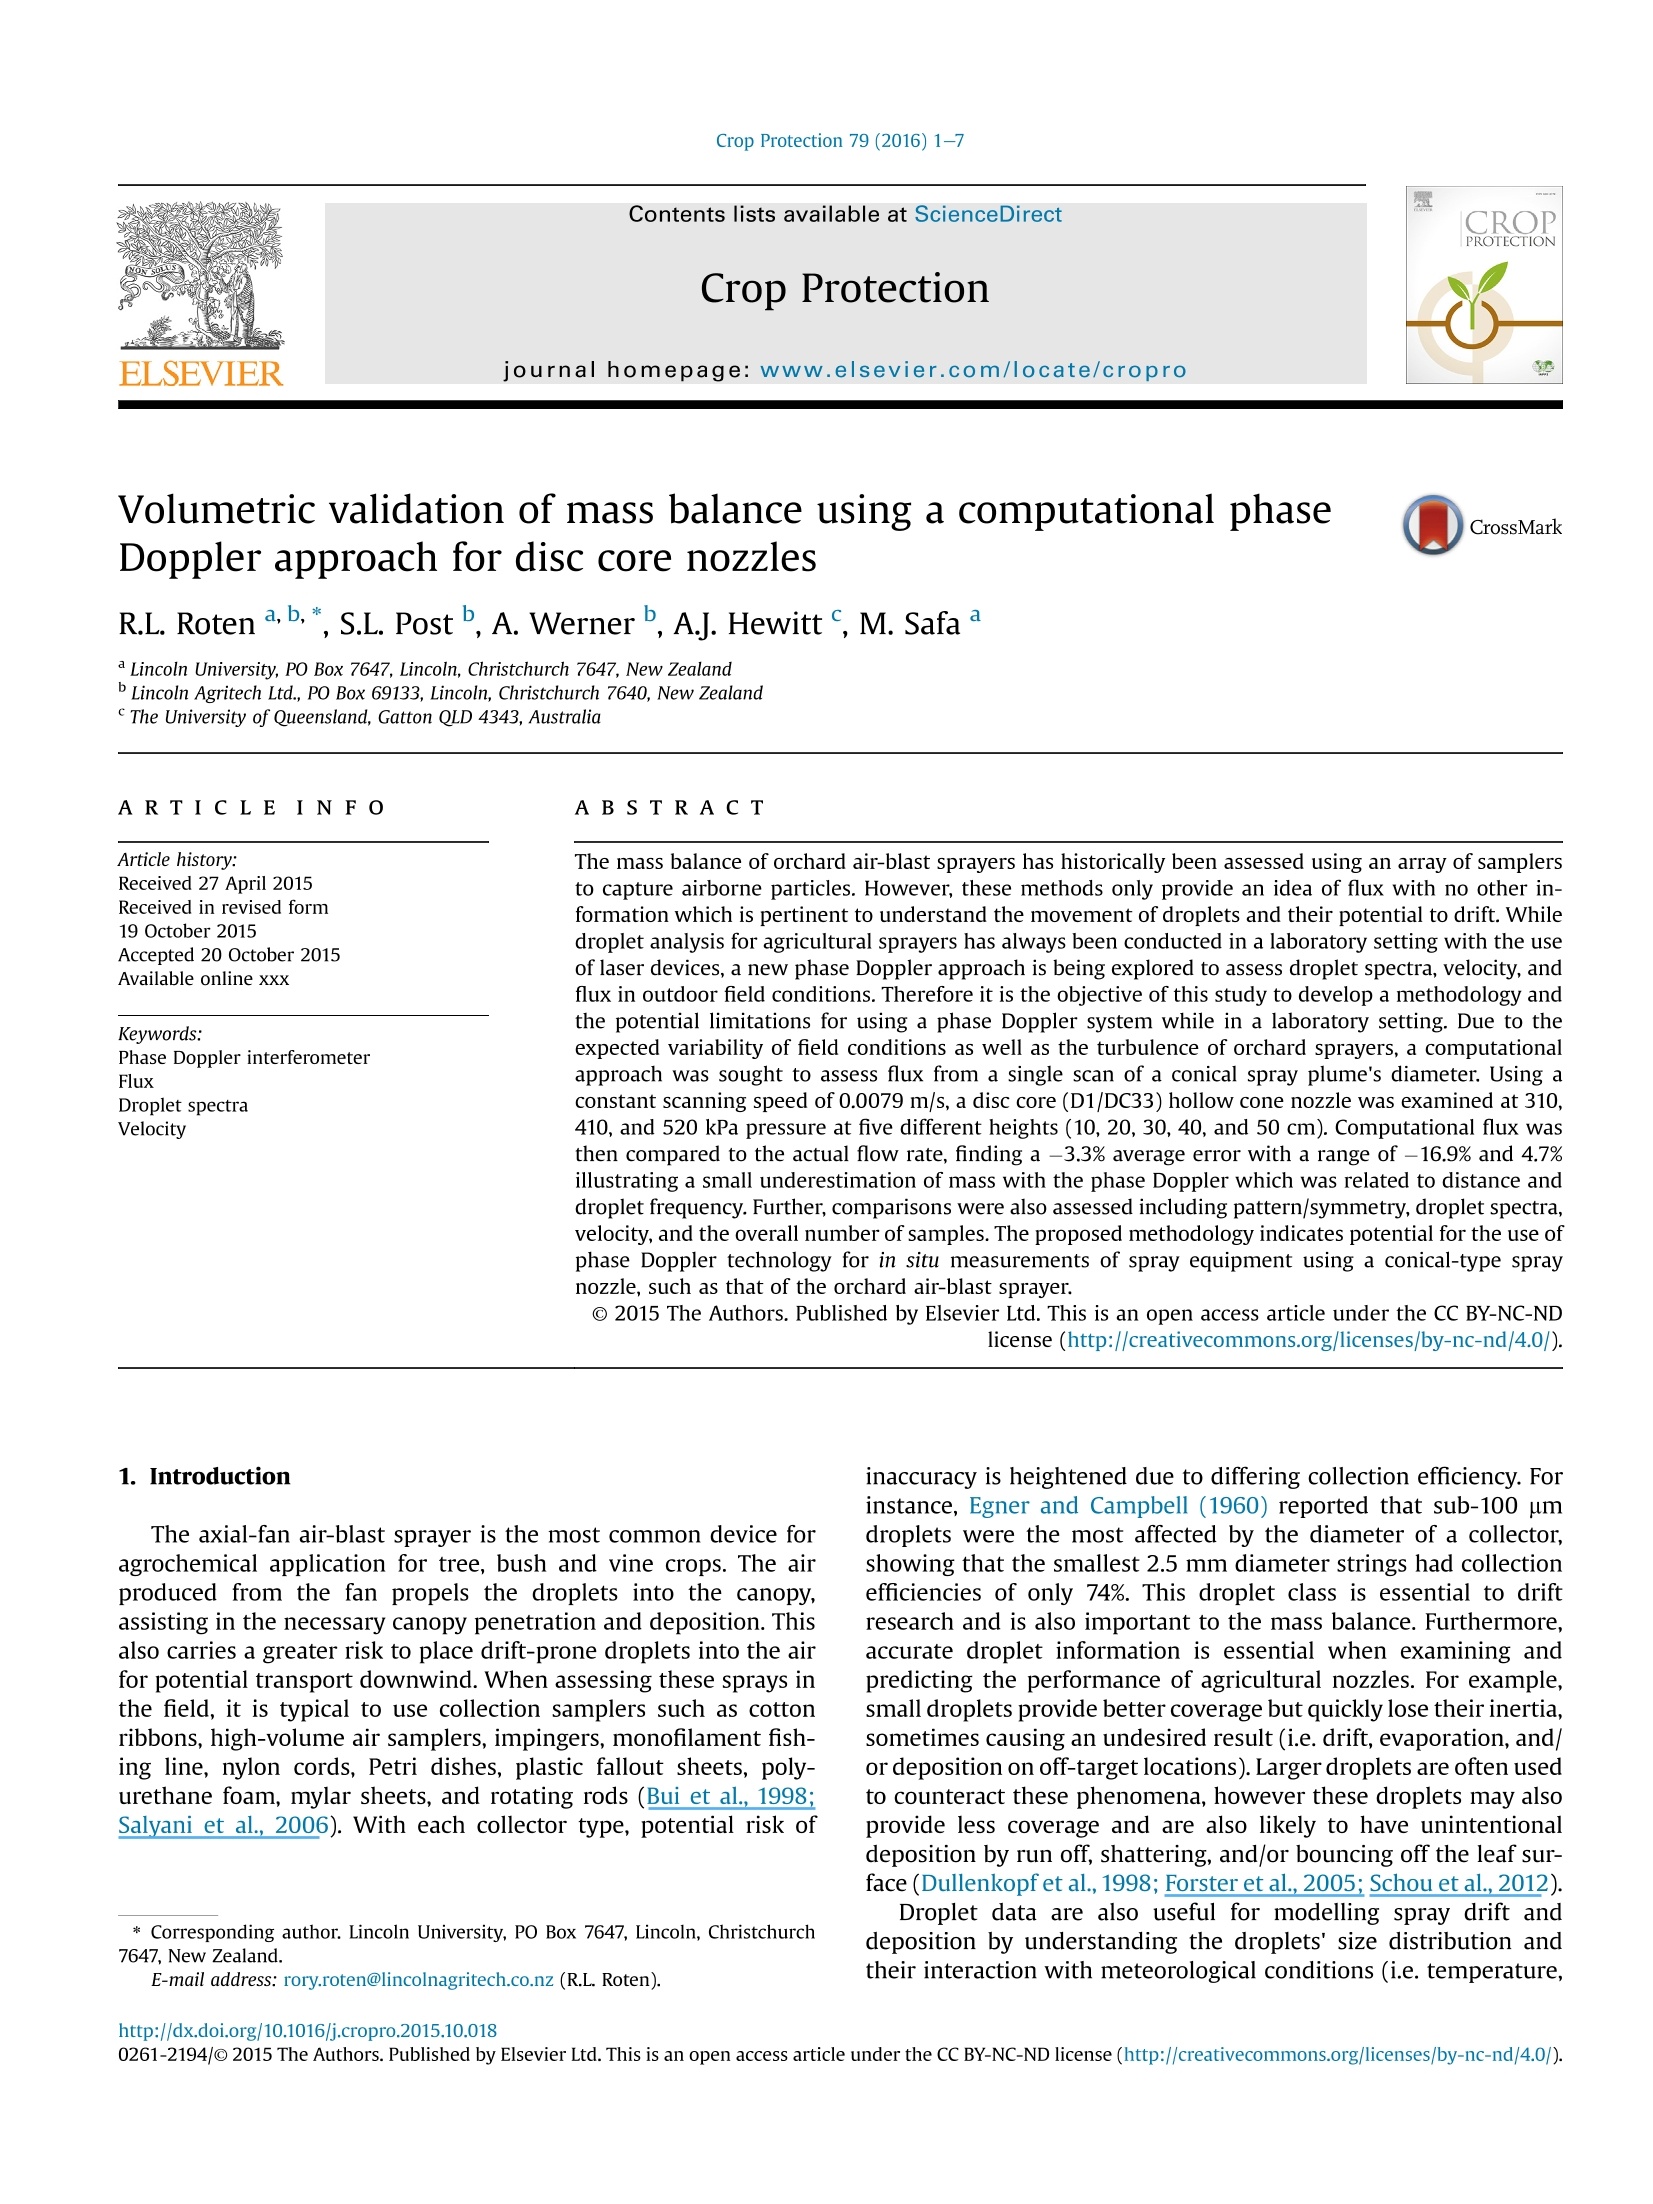
The mass balance of orchard air-blast sprayers has historically been assessed using an array of samplers
to capture airborne particles. However, these methods only provide an idea of flux with no other information
which is pertinent to understand the movement of droplets and their potential to drift. While
droplet analysis for agricultural sprayers has always been conducted in a laboratory setting with the use
of laser devices, a new phase Doppler approach is being explored to assess droplet spectra, velocity, and
flux in outdoor field conditions. Therefore it is the objective of this study to develop a methodology and
the potential limitations for using a phase Doppler system while in a laboratory setting. Due to the
expected variability of field conditions as well as the turbulence of orchard sprayers, a computational
approach was sought to assess flux from a single scan of a conical spray plume's diameter. Using a
constant scanning speed of 0.0079 m/s, a disc core (D1/DC33) hollow cone nozzle was examined at 310,
410, and 520 kPa pressure at five different heights (10, 20, 30, 40, and 50 cm). Computational flux was
then compared to the actual flow rate, finding a 3.3% average error with a range of 16.9% and 4.7%
illustrating a small underestimation of mass with the phase Doppler which was related to distance and
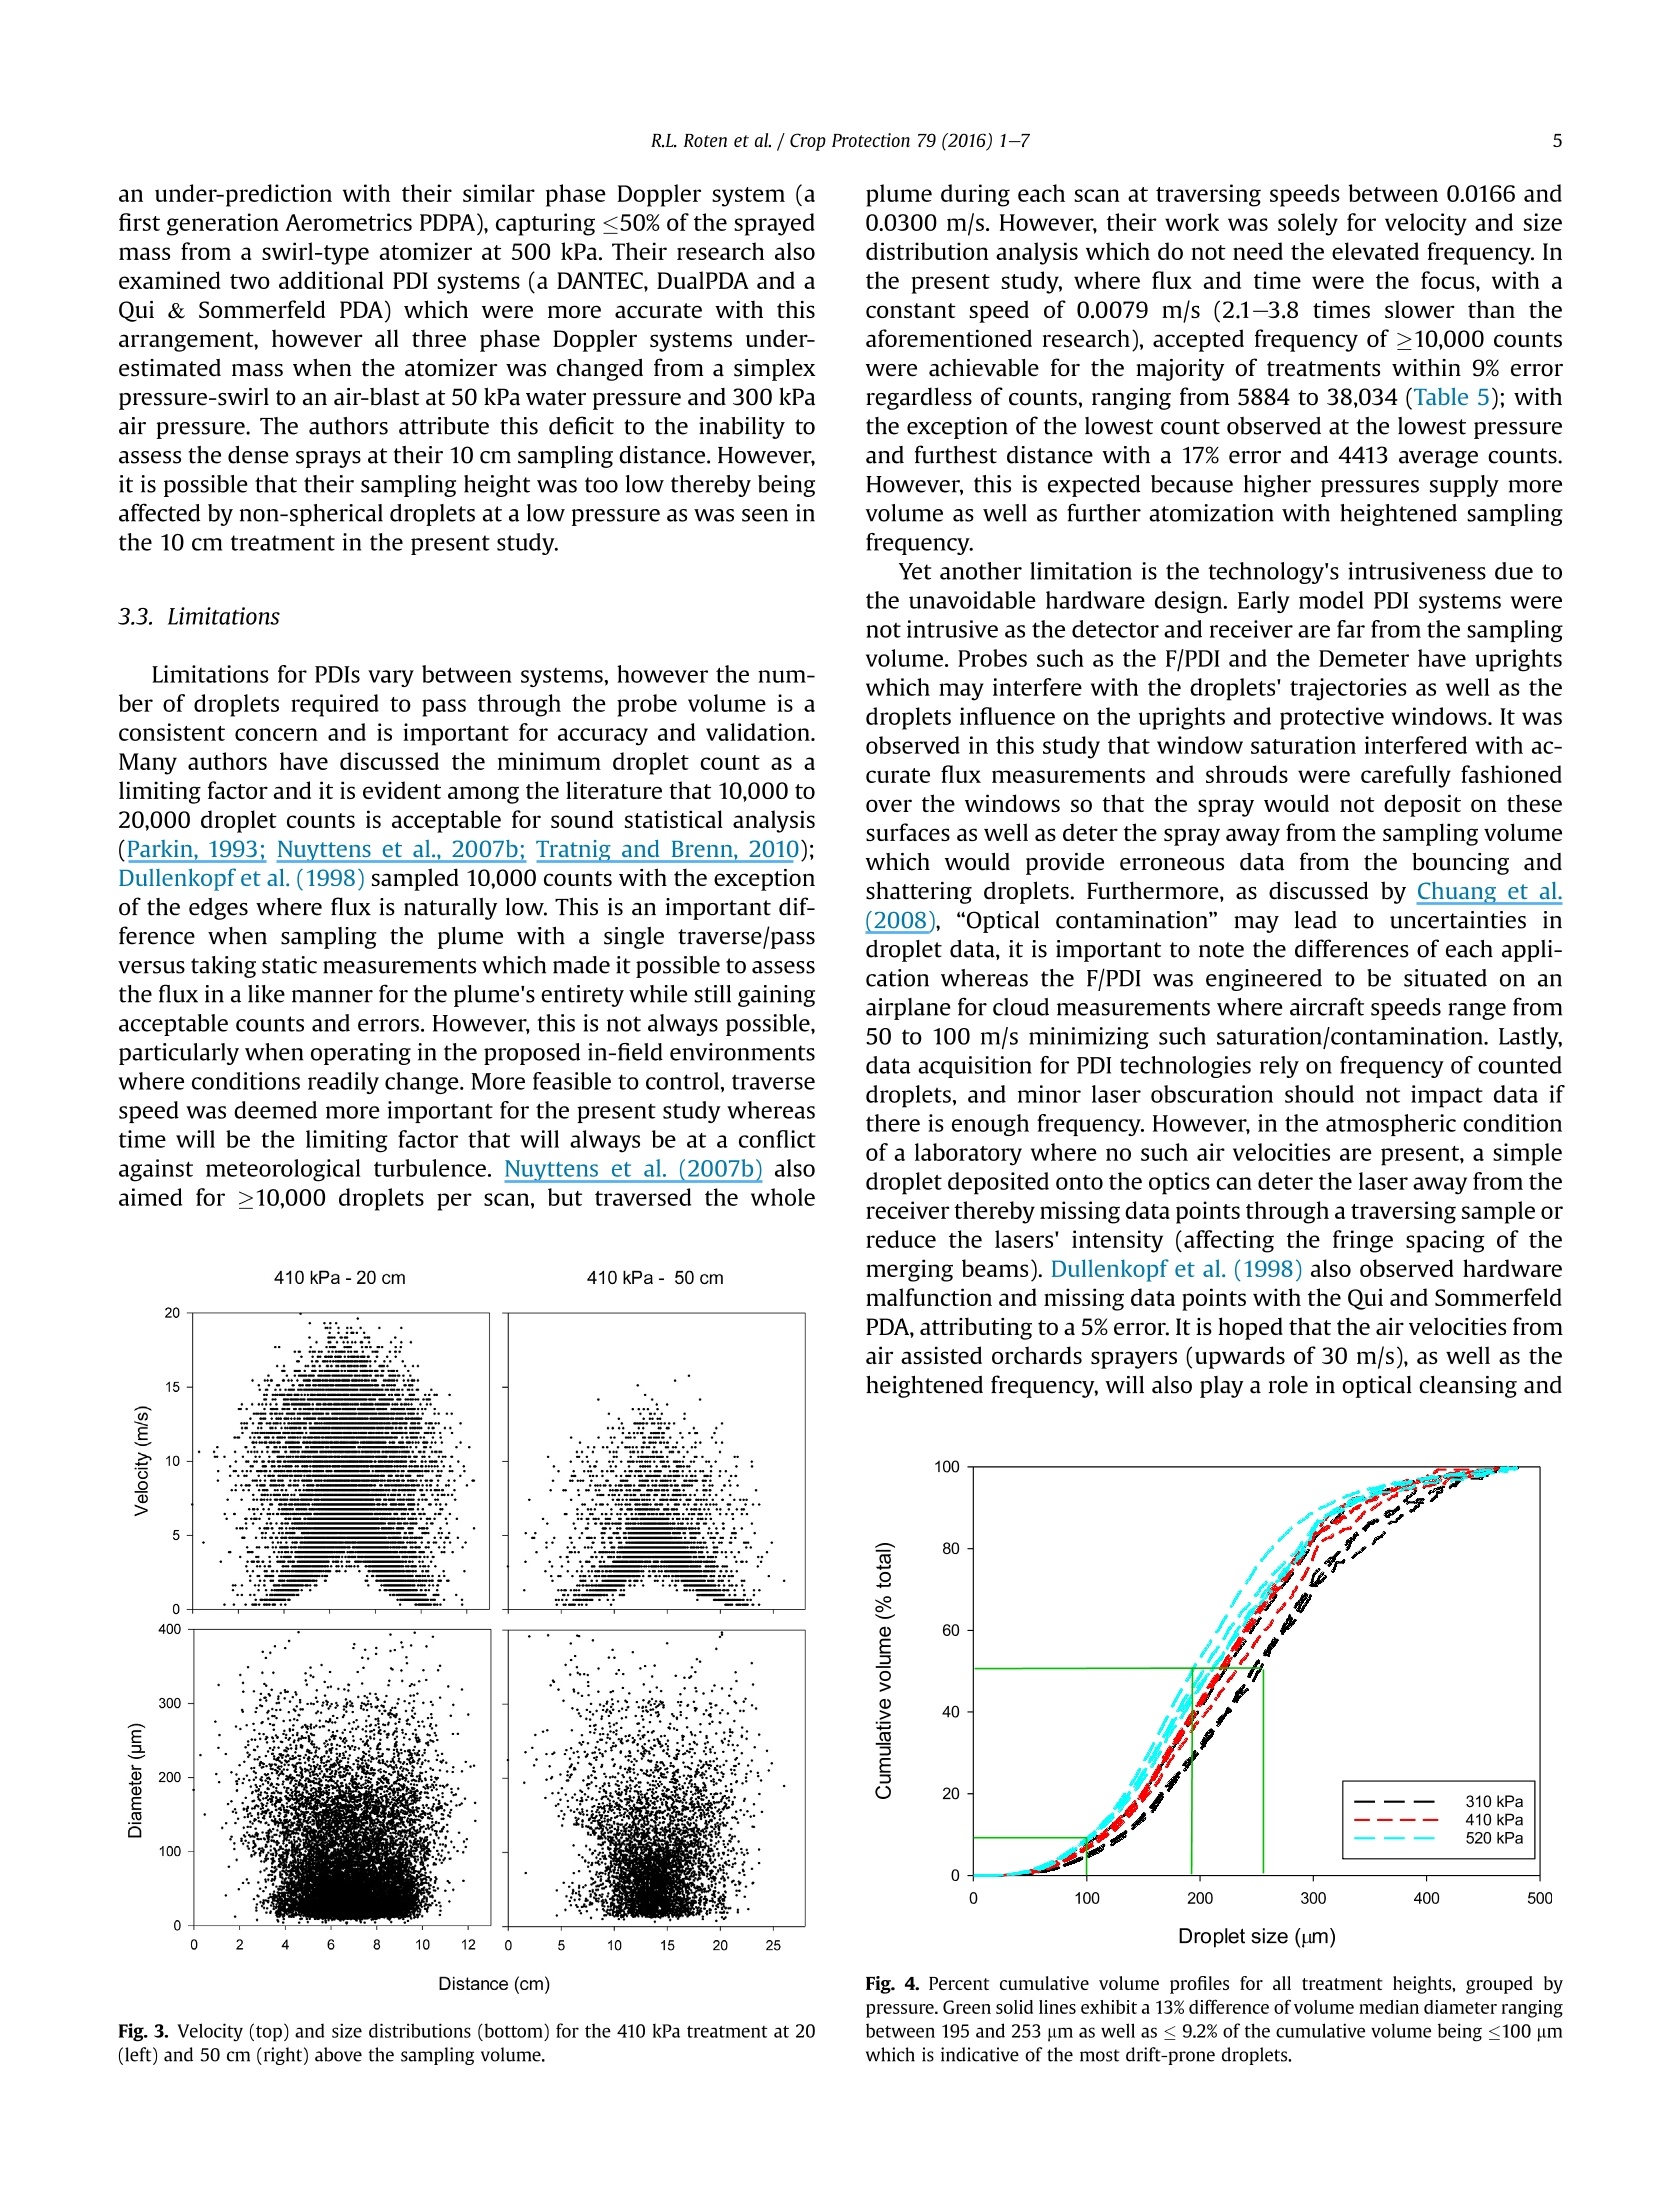
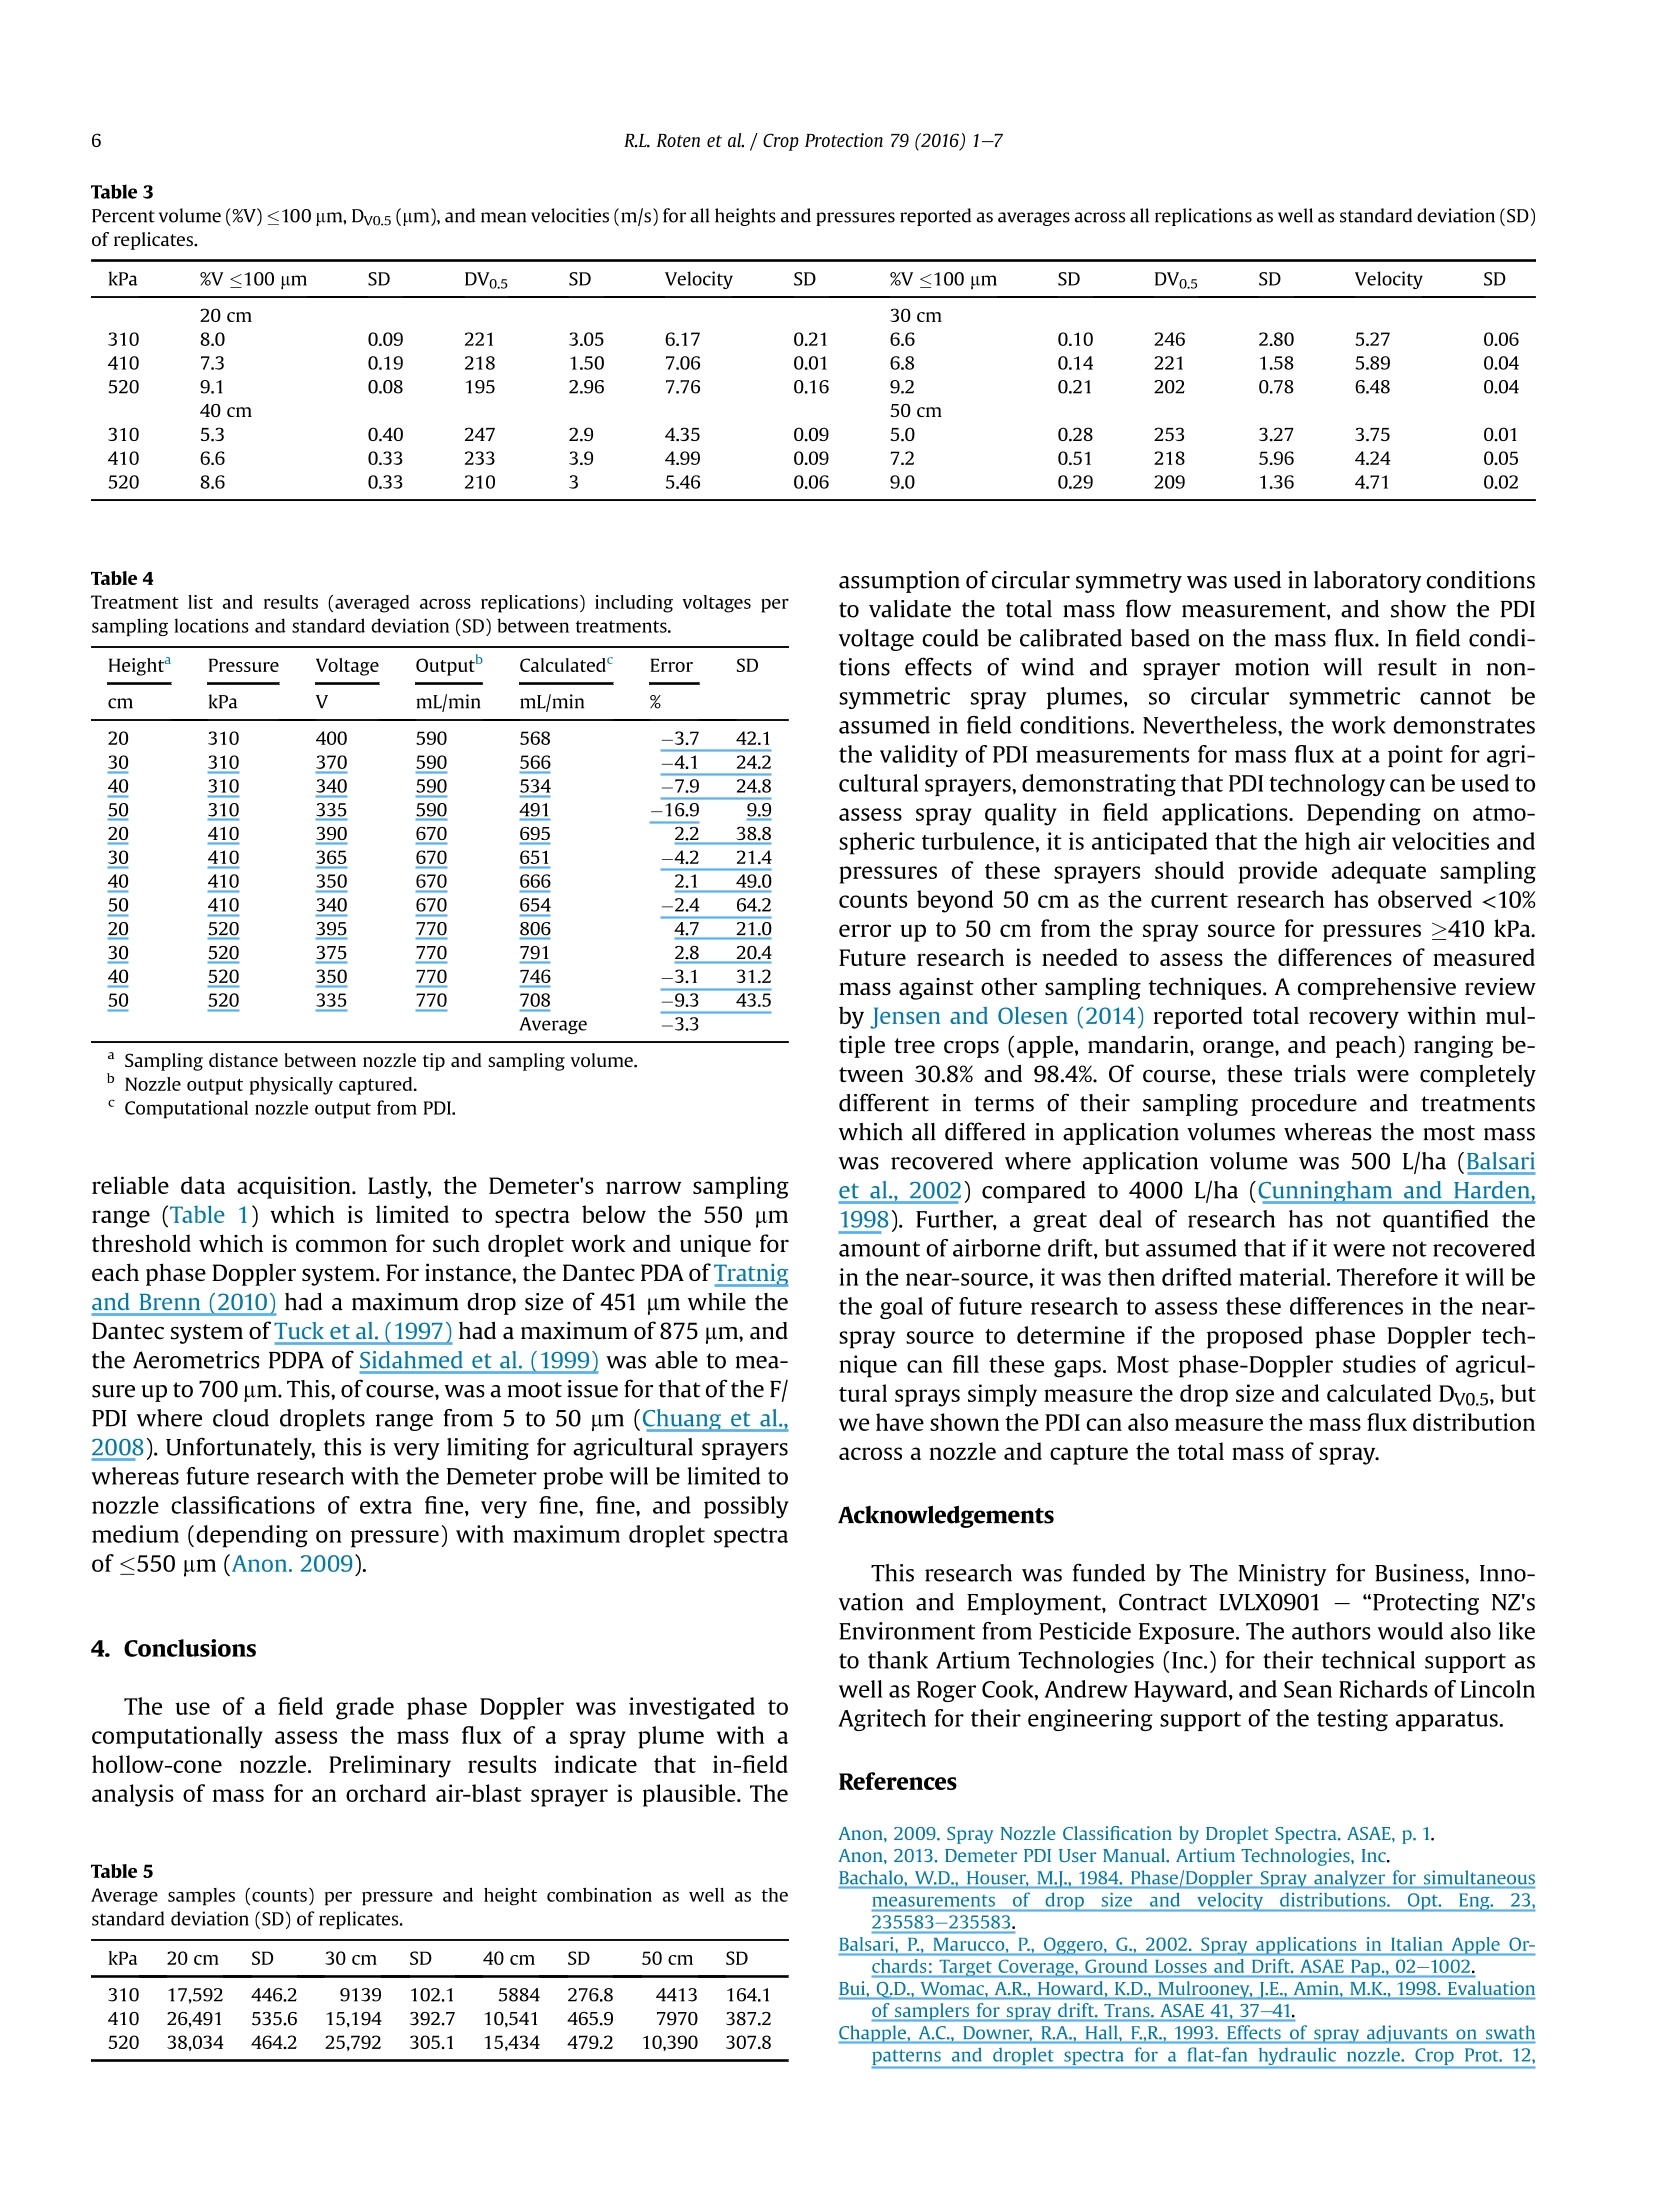
droplet frequency. Further, comparisons were also assessed including pattern/symmetry, droplet spectra,
velocity, and the overall number of samples. The proposed methodology indicates potential for the use of
phase Doppler technology for in situ measurements of spray equipment using a conical-type spray
nozzle, such as that of the orchard air-blast sprayer.
方案详情

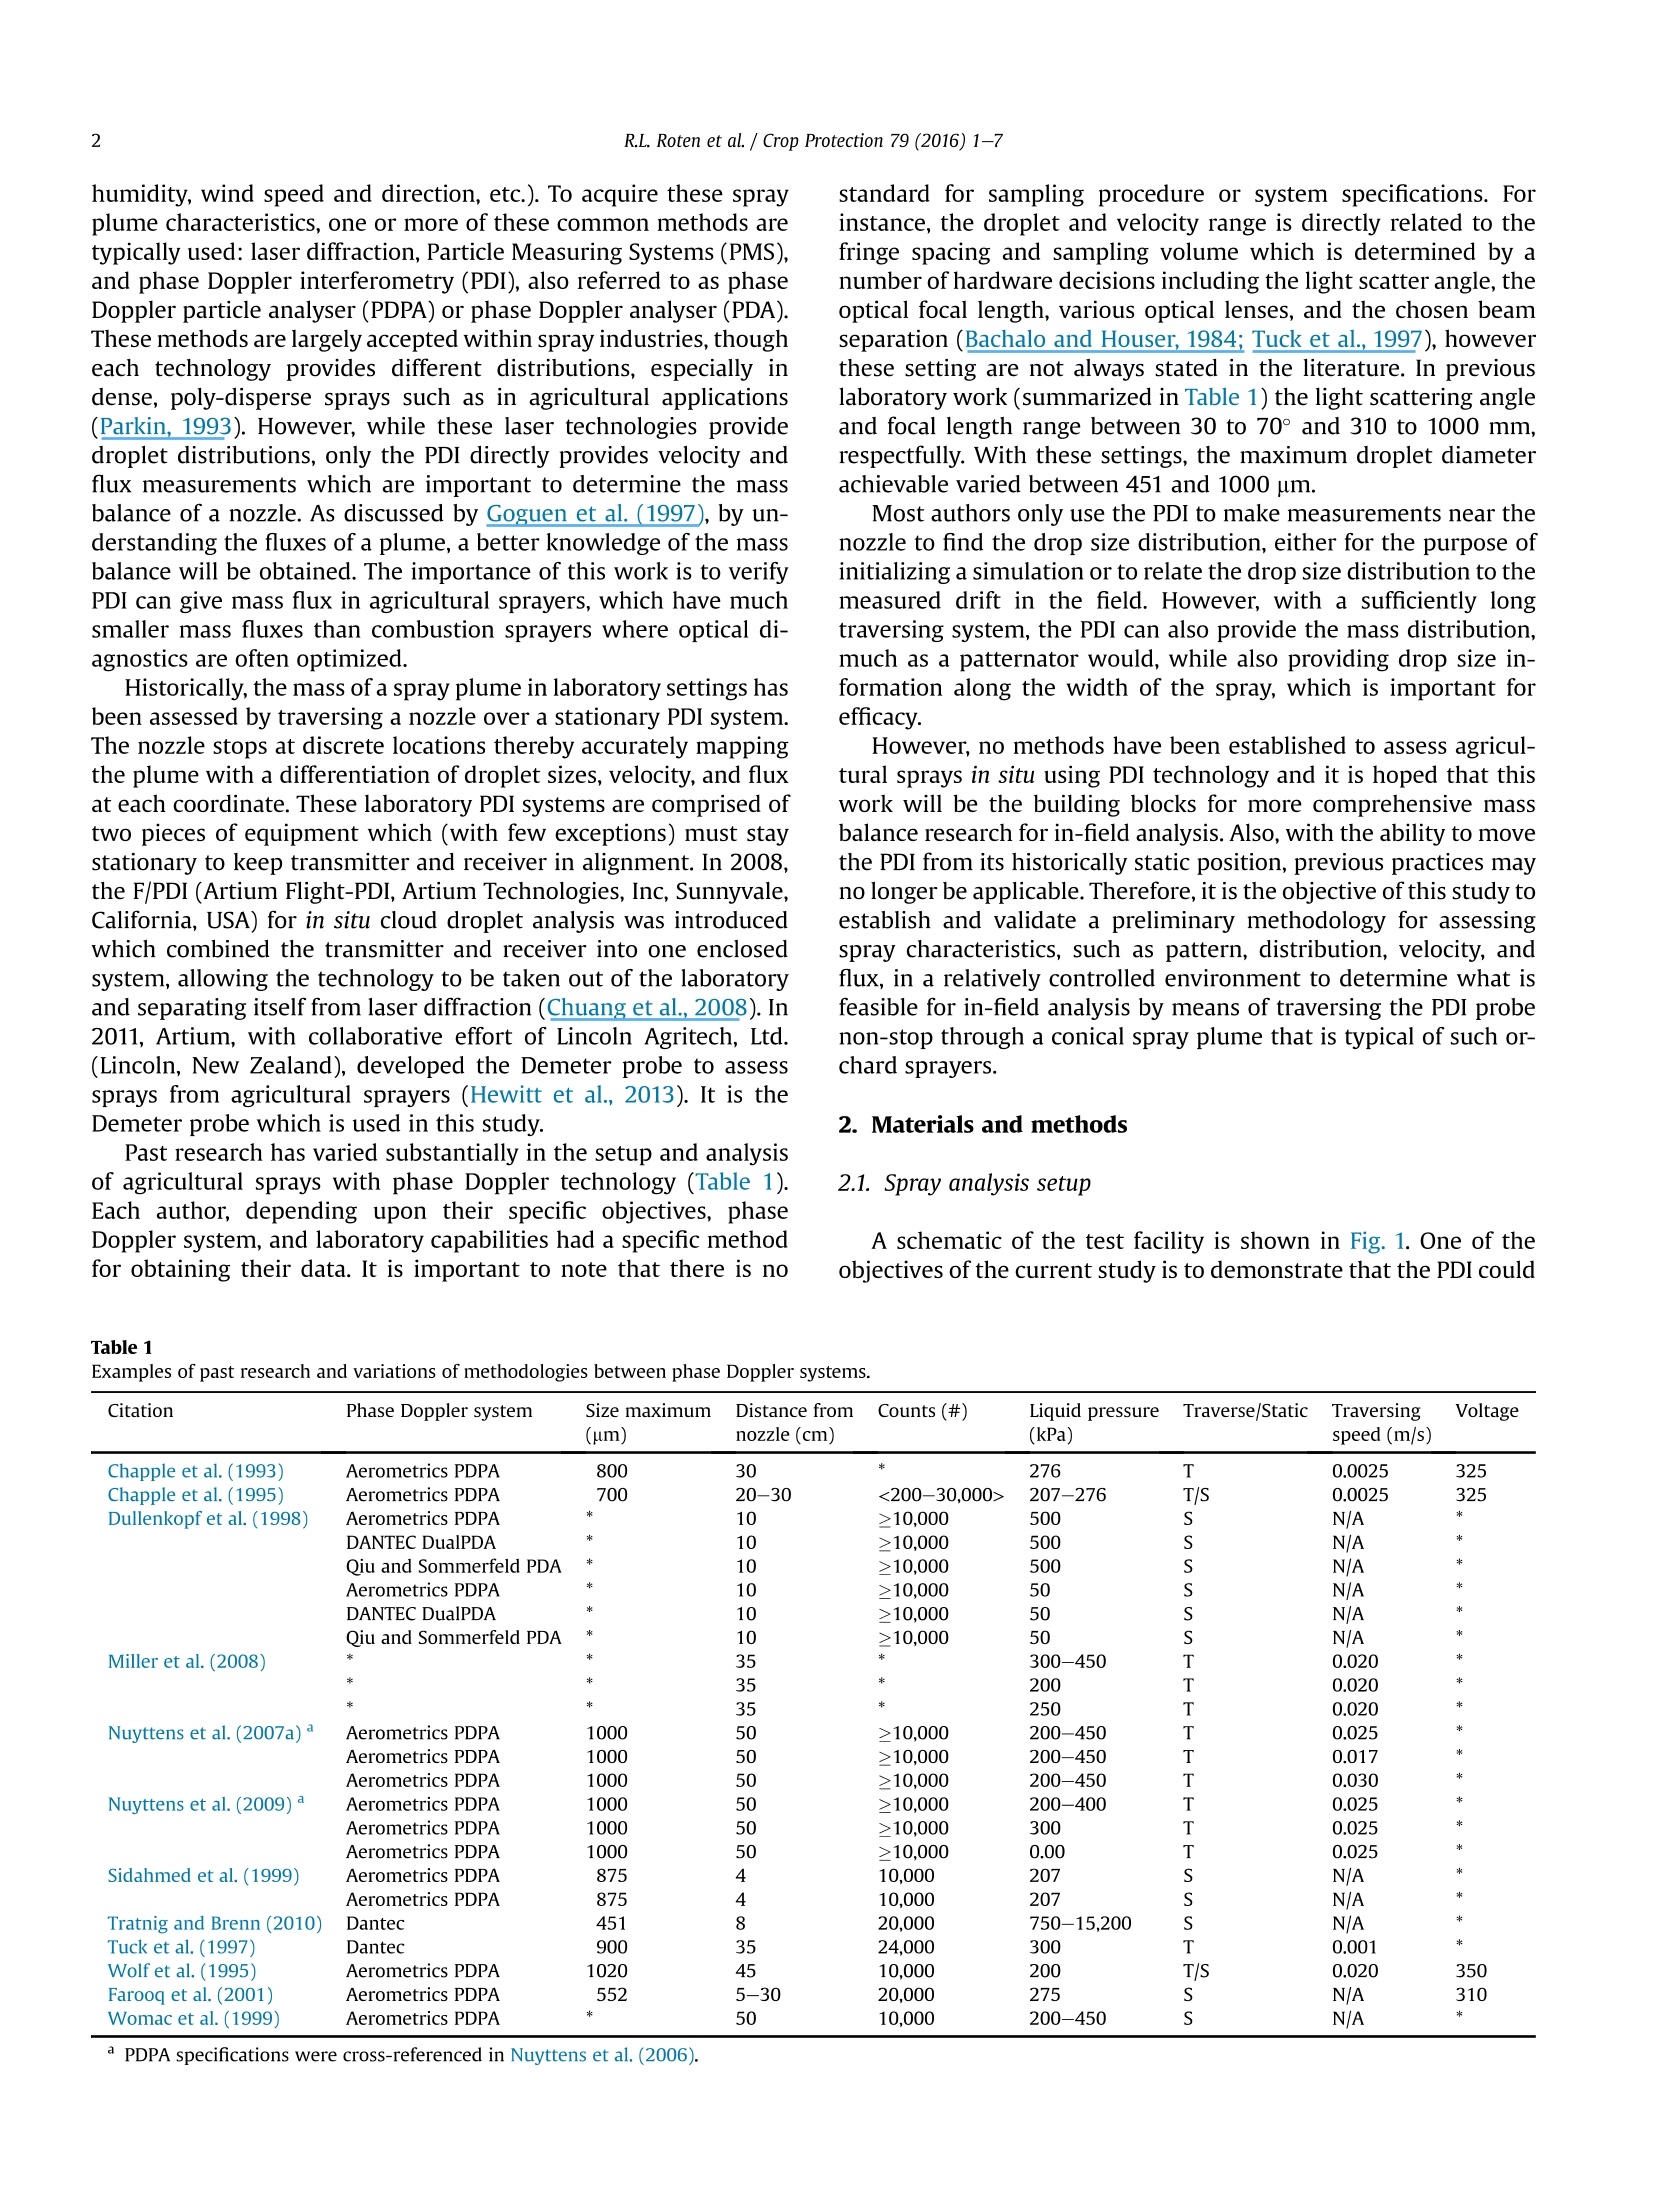
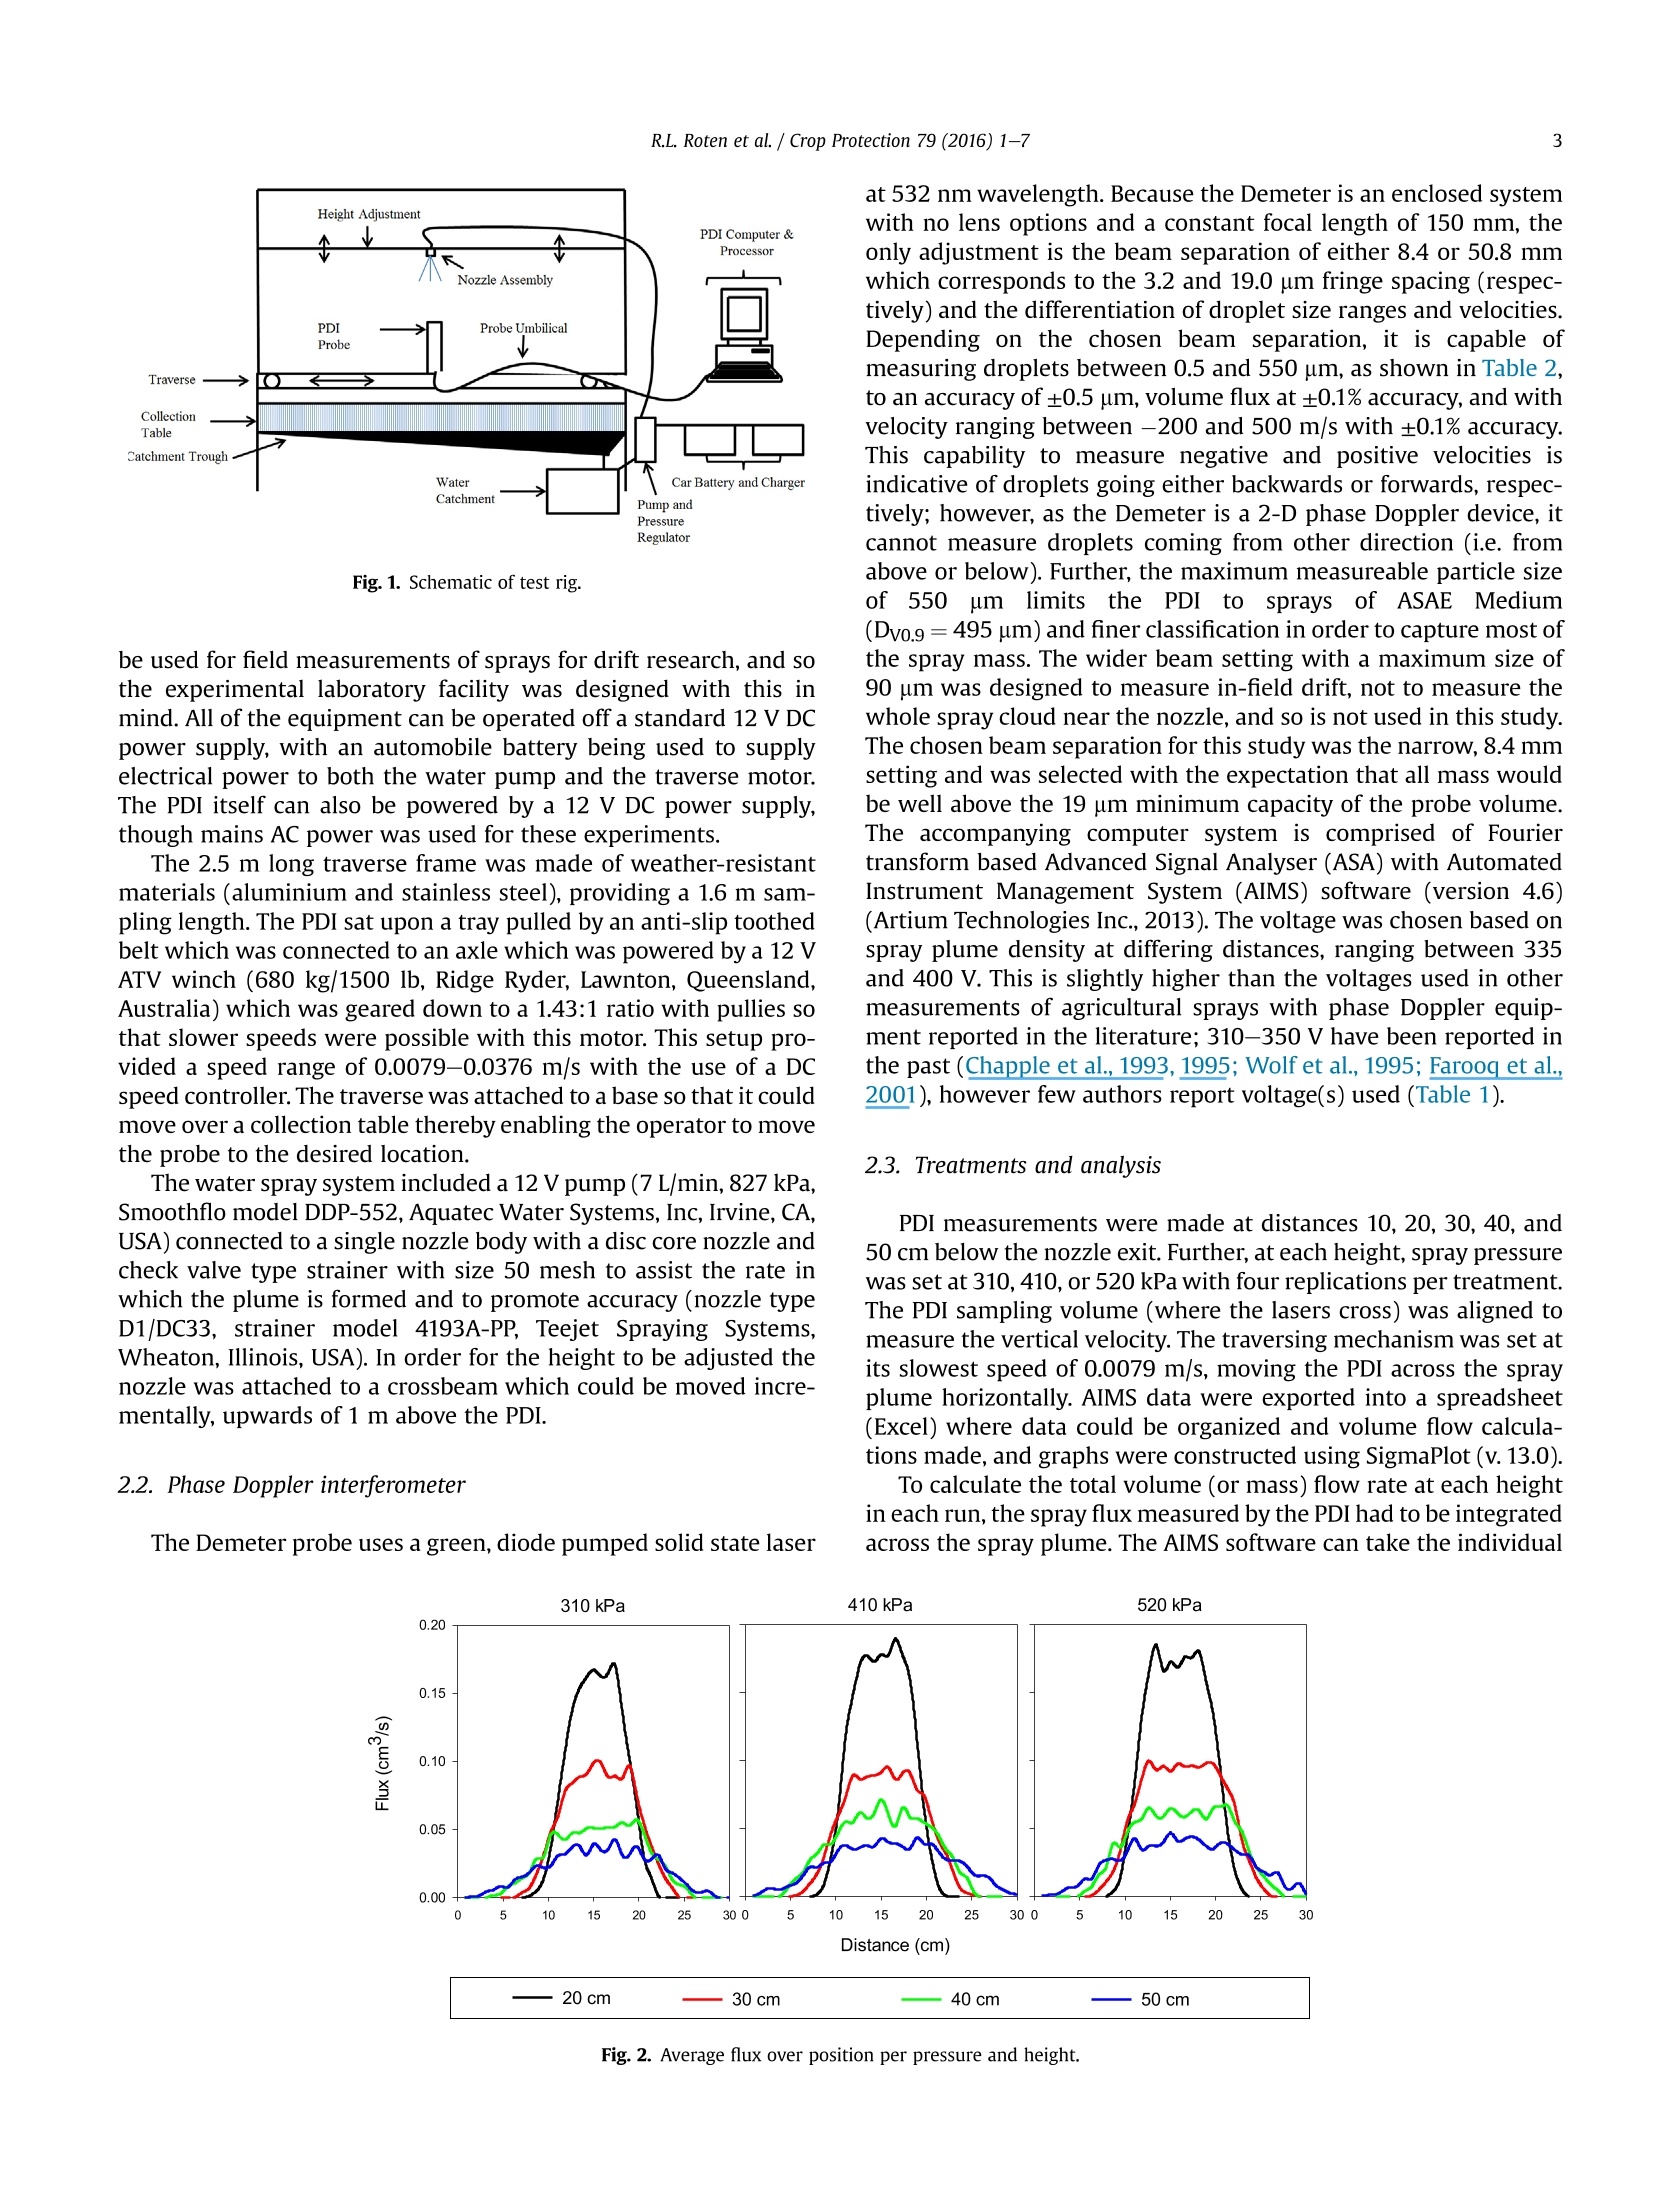
ResearchGate Crop Protection 79 (2016) 1-7 See discussions, stats, and author profiles for this publication at: https://www.researchgate.net/publication/284038739 Crop Protection Article in Crop Protection· January 2016 DOl:10.1016/j.cropro.2015.10.018 READS CITATIONS042 5authors, including: Rory Roten Scott Leon Post Lincoln Agritech Ltd. LincolnAgritech Ltd. 11 PUBLICATIONS 17 CITATIONS 24 PUBLICATIONS 212 CITATIONS SEE PROFILE SEE PROFILE Crop Protection ELSEVIER journal homepage: www.elsevier.com/locate/cropro Volumetric validation of mass balance using a computational phaseDoppler approach for disc core nozzles R.L. Rotena.b*, S.L. Post, A. Werner, A.J. Hewitt , M. Safa Lincoln University, PO Box 7647, Lincoln, Christchurch 7647, New Zealand DLincoln Agritech Ltd., PO Box 69133, Lincoln, Christchurch 7640, New Zealand The University of Queensland, Gatton QLD 4343, Australia ARTICLEINFO ABSTRACT Article history:Received 27 April 2015Received in revised form19 October 2015Accepted 20 October 2015Available online xxx Keywords: Phase Doppler interferometerFluxDroplet spectraVelocity The mass balance of orchard air-blast sprayers has historically been assessed using an array of samplersto capture airborne particles. However, these methods only provide an idea of flux with no other in-formation which is pertinent to understand the movement of droplets and their potential to drift. Whiledroplet analysis for agricultural sprayers has always been conducted in a laboratory setting with the useof laser devices, a new phase Doppler approach is being explored to assess droplet spectra, velocity, andflux in outdoor field conditions. Therefore it is the objective of this study to develop a methodology andthe potential limitations for using a phase Doppler system while in a laboratory setting. Due to theexpected variability of field conditions as well as the turbulence of orchard sprayers, a computationalapproach was sought to assess flux from a single scan of a conical spray plume's diameter. Using aconstant scanning speed of 0.0079 m/s, a disc core (D1/DC33) hollow cone nozzle was examined at 310,410, and 520 kPa pressure at five different heights (10, 20,30, 40, and 50 cm). Computational flux wasthen compared to the actual flow rate, finding a -3.3% average error with a range of -16.9% and 4.7%illustrating a small underestimation of mass with the phase Doppler which was related to distance anddroplet frequency. Further,comparisons were also assessed including pattern/symmetry,droplet spectra,velocity, and the overall number of samples. The proposed methodology indicates potential for the use ofphase Doppler technology for in situ measurements of spray equipment using a conical-type spraynozzle, such a that of the orchard air-blast sprayer.o 2015 The Authors. Published by Elsevier Ltd. This is an open access article under the CC BY-NC-ND 1. Introduction The axial-fan air-blast sprayer is the most common device foragrochemical application for tree, bush and vine crops. The airproduced from the fan propels the droplets into the canopy,assisting in the necessary canopy penetration and deposition. Thisalso carries a greater risk to place drift-prone droplets into the airfor potential transport downwind. When assessing these sprays inthe field, it is typical to use collection samplers such as cottonribbons, high-volume air samplers, impingers, monofilament fish-ing line, nylon cords, Petri dishes, plastic fallout sheets, poly-urethane foam, mylar sheets, and rotating rods (Bui et al., 1998;Salyani et al., 2006). With each collector type, potential risk of ( * C orresponding au t hor. Li n coln Un i versity, PO Box 7647, Lincoln, Christchurch 7647,New Zealand. ) ( E -mail address: r o ry . r o te n@ linc o l n a g ritech.co.nz (R. L. Ro t en). ) inaccuracy is heightened due to differing collection efficiency. Forinstance, Egner and Campbell (1960) reported that sub-100 umdroplets were the most affected by the diameter of a collector,showing that the smallest 2.5 mm diameter strings had collectionefficiencies of only 74%. This droplet class is essential to driftresearch and is also important to the mass balance. Furthermore,accurate droplet information is essential when examining andpredicting the performance of agricultural nozzles. For example,small droplets provide better coverage but quickly lose their inertia,sometimes causing an undesired result (i.e. drift, evaporation, and/or deposition on off-target locations). Larger droplets are often usedto counteract these phenomena, however these droplets may alsoprovide less coverage and are also likely to have unintentionaldeposition by run off, shattering, and/or bouncing off the leaf sur-face (Dullenkopfet al., 1998; Forster et al., 2005; Schou et al., 2012). Droplet data are also useful for modelling spray drift anddeposition by understanding the droplets’ size distribution andtheir interaction with meteorological conditions (i.e. temperature, ( 0261-2194/◎ 2015 The Authors. Published by Elsevier Ltd. This is an open access article under the CC BY-N C -ND license (http:/ / c reativecommons.org/li c enses/b y -nc-nd/ 4 .0/). ) humidity, wind speed and direction, etc.). To acquire these sprayplume characteristics,one or more of these common methods aretypically used: laser diffraction, Particle Measuring Systems (PMS),and phase Doppler interferometry (PDI), also referred to as phaseDoppler particle analyser (PDPA) or phase Doppler analyser (PDA).These methods are largely accepted within spray industries, thougheach technology provides different distributions, especially indense, poly-disperse sprays such as in agricultural applications(Parkin, 1993). However, while these laser technologies providedroplet distributions, only the PDI directly provides velocity andflux measurements which are important to determine the massbalance of a nozzle. As discussed by Goguen et al. (1997), by un-derstanding the fluxes of a plume, a better knowledge of the massbalance will be obtained. The importance of this work is to verifyPDI can give mass flux in agricultural sprayers, which have muchsmaller mass fluxes than combustion sprayers where optical di-agnostics are often optimized. Historically, the mass of a spray plume in laboratory settings hasbeen assessed by traversing a nozzle over a stationary PDI system.The nozzle stops at discrete locations thereby accurately mappingthe plume with a differentiation of droplet sizes, velocity, and fluxat each coordinate. These laboratory PDI systems are comprised oftwo pieces of equipment which (with few exceptions) must staystationary to keep transmitter and receiver in alignment. In 2008,the F/PDI (Artium Flight-PDI, Artium Technologies, Inc, Sunnyvale,California, USA) for in situ cloud droplet analysis was introducedwhich combined the transmitter and receiver into one enclosedsystem, allowing the technology to be taken out of the laboratoryand separating itself from laser diffraction (Chuang et al., 2008). In2011, Artium, with collaborative effort of Lincoln Agritech, Ltd.(Lincoln, New Zealand), developed the Demeter probe to assesssprays from agricultural sprayers (Hewitt et al., 2013). It is theDemeter probe which is used in this study. Past research has varied substantially in the setup and analysisof agricultural sprays with phase Doppler technology (Table 1).Each author, depending upon their specific objectives, phaseDoppler system, and laboratory capabilities had a specific methodfor obtaining their data. It is important to note that there is no Most authors only use the PDI to make measurements near thenozzle to find the drop size distribution, either for the purpose ofinitializing a simulation or to relate the drop size distribution to themeasured drift in the field. However, with a sufficiently longtraversing system, the PDI can also provide the mass distribution,much as a patternator would, while also providing drop size in-formation along the width of the spray, which is important forefficacy. However,no methods have been established to assess agricul-tural sprays in situ using PDI technology and it is hoped that thiswork will be the building blocks for more comprehensive massbalance research for in-field analysis. Also, with the ability to movethe PDI from its historically static position, previous practices mayno longer be applicable. Therefore, it is the objective of this study toestablish and validate a preliminary methodology for assessingspray characteristics, such as pattern, distribution, velocity, andflux, in a relatively controlled environment to determine what isfeasible for in-field analysis by means of traversing the PDI probenon-stop through a conical spray plume that is typical of such or-chard sprayers. 2. Materials and methods 2.1. Spray analysis setup A schematic of the test facility is shown in Fig. 1. One of theobjectives of the current study is to demonstrate that the PDI could Table1Examples of past research and variations of methodologies between phase Doppler systems. Citation Phase Doppler system Size maximum Distance from C Counts (#) Liquid pressure Traverse/Static Traversing Voltage (um) nozzle (cm) (kPa) speed (m/s) Chapple et al. (1993) Aerometrics PDPA 800 30 * 276 T 0.0025 325 Chapple et al. (1995) Aerometrics PDPA 700 20-30 <200-30,000> 207-276 T/S 0.0025 325 Dullenkopfet al.(1998) Aerometrics PDPA * 10 >10,000 500 S N/A * DANTEC DualPDA * 10 ≥10,000 500 S N/A * Qiu and Sommerfeld PDA 10 ≥10,000 500 S N/A * Aerometrics PDPA 10 ≥10,000 50 S N/A * DANTEC DualPDA 10 ≥10,000 50 S N/A Miller et al.(2008) Qiu and Sommerfeld PDA 10 ≥10,000 50 S N/A * * 35 * 300-450 T 0.020 * * * 35 * 200 T 0.020 * * * 35 * 250 T 0.020 * Nuyttens et al.(2007a) Aerometrics PDPA 1000 50 ≥10,000 200-450 T 0.025 * Aerometrics PDPA 1000 50 >10,000 200-450 T 0.017 * Aerometrics PDPA 1000 50 ≥10,000 200-450 T 0.030 * Nuyttens et al. (2009) Aerometrics PDPA 1000 50 ≥10,000 200-400 T 0.025 * Aerometrics PDPA 1000 50 >10,000 300 T 0.025 * Aerometrics PDPA 1000 50 ≥10,000 0.00 T 0.025 * Sidahmed et al.(1999) Aerometrics PDPA 875 4 10,000 207 S N/A * Aerometrics PDPA 875 4 10,000 207 S N/A * Tratnig and Brenn (2010) Dantec 451 8 20,000 750-15,200 S N/A Tuck et al. (1997) Dantec 900 35 24,000 300 T 0.001 * Wolf et al.(1995) Aerometrics PDPA 1020 45 10,000 200 T/S 0.020 350 Farooq et al. (2001) Aerometrics PDPA 552 5-30 20,000 275 S N/A 310 Womac et al.(1999) Aerometrics PDPA 50 10,000 200-450 S N/A * Regulator Fig. 1. Schematic of test rig. be used for field measurements of sprays for drift research,and sothe experimental laboratory facility was designed with this inmind.All of the equipment can be operated off a standard 12 V DCpower supply, with an automobile battery being used to supplyelectrical power to both the water pump and the traverse motor.The PDI itself can also be powered by a 12 V DC power supply,though mains AC power was used for these experiments. The 2.5 m long traverse frame was made of weather-resistantmaterials (aluminium and stainless steel), providing a 1.6 m sam-pling length. The PDI sat upon a tray pulled by an anti-slip toothedbelt which was connected to an axle which was powered by a 12 VATV winch (680 kg/1500 lb, Ridge Ryder, Lawnton, Queensland,Australia) which was geared down to a 1.43:1 ratio with pullies sothat slower speeds were possible with this motor. This setup pro-vided a speed range of 0.0079-0.0376 m/s with the use of a DCspeed controller. The traverse was attached to a base so that it couldmove over a collection table thereby enabling the operator to movethe probe to the desired location. The water spray system included a 12 Vpump (7L/min, 827 kPa,Smoothflo model DDP-552, Aquatec Water Systems, Inc, Irvine, CA,USA) connected to a single nozzle body with a disc core nozzle andcheck valve type strainer with size 50 mesh to assist the rate inwhich the plume is formed and to promote accuracy (nozzle typeD1/DC33, strainer model 4193A-PP, Teejet Spraying Systems,Wheaton, Illinois, USA). In order for the height to be adjusted thenozzle was attached to a crossbeam which could be moved incre-mentally, upwards of 1 m above the PDI. 2.2. Phase Doppler interferometer The Demeter probe uses a green, diode pumped solid state laser at 532 nm wavelength. Because the Demeter is an enclosed systemwith no lens options and a constant focal length of 150 mm, theonly adjustment is the beam separation of either 8.4 or 50.8 mmwhich corresponds to the 3.2 and 19.0 um fringe spacing (respec-tively) and the differentiation of droplet size ranges and velocities.Depending on the chosen beam separation, it is capable ofmeasuring droplets between 0.5 and 550 um, as shown in Table 2,to an accuracy of +0.5 pm, volume flux at ±0.1% accuracy, and withvelocity ranging between -200 and 500 m/s with ±0.1% accuracy.This capability to measure negative and positive velocities isindicative of droplets going either backwards or forwards, respec-tively; however, as the Demeter is a 2-D phase Doppler device, itcannot measure droplets coming from other direction (i.e. fromabove or below). Further, the maximum measureable particle sizeof 550umlimits the PDI to sprays of ASAEEMedium(Dvo.9=495 pm)and finer classification in order to capture most ofthe spray mass. The wider beam setting with a maximum size of90 um was designed to measure in-field drift, not to measure thewhole spray cloud near the nozzle, and so is not used in this study.The chosen beam separation for this study was the narrow, 8.4 mmsetting and was selected with the expectation that all mass wouldbe well above the 19 pm minimum capacity of the probe volume.The accompanying computer system is comprised of Fouriertransform based Advanced Signal Analyser (ASA) with AutomatedInstrument Management System (AIMS) software (version 4.6)(Artium Technologies Inc., 2013). The voltage was chosen based onspray plume density at differing distances, ranging between 335and 400 V. This is slightly higher than the voltages used in othermeasurements of agricultural sprays with phase Doppler equip-ment reported in the literature;310-350 V have been reported inthe past (Chapple et al., 1993, 1995; Wolf et al., 1995; Farooq et al.,2001), however few authors report voltage(s) used (Table 1). 2.3. Treatments and analysis PDI measurements were made at distances 10, 20, 30, 40, and50 cm below the nozzle exit. Further, at each height, spray pressurewas set at 310, 410, or 520 kPa with four replications per treatment.The PDI sampling volume (where the lasers cross) was aligned tomeasure the vertical velocity. The traversing mechanism was set atits slowest speed of 0.0079 m/s, moving the PDI across the sprayplume horizontally. AIMS data were exported into a spreadsheet(Excel) where data could be organized and volume flow calcula-tions made, and graphs were constructed using SigmaPlot (v.13.0). To calculate the total volume (or mass) flow rate at each heightin each run, the spray flux measured by the PDI had to be integratedacross the spray plume. The AIMS software can take the individual Fig. 2. Average flux over position per pressure and height. Table 2Specifications ofDemeter probe by beam separation (Anon.2013). Beam separation Transmitter focal length Receiver focal length Fringe spacing Focused beam diameter Velocity range Droplet diameter range mm mm mm um um m/s um 50.8 300 150 3.2 156 -200 to 200 0.5-90 8.4 300 150 19.0 1594 -300 to 350 3.0-550 measurements of drop size and velocity, and using the cross-sectional area of the laser probe volume, provide vertical volumeflux values calculated over a specified interval of time. For thesestudies, a calculation window of 1.0 s was used. At the traversingspeed of 0.0079 m/s, this corresponds to a spatial distance of0.0079 m=0.79 cm.That is to say, flux values were averaged over a0.79 cm distance. This selection provided a reasonable compromisebetween fine spatial resolution and having a large enough numberof drop counts sampled for good statistics for each flux value. Theseindividual flux values at different spatial locations were then in-tegrated numerically to find the total mass flow rate of spray. Cir-cular symmetry was assumed, with the traversing path intersectingthe spray centerline. At each measurement location, r (cm), thecross section of the spray is a ring-shaped section of width Ar,whose area is given in Equation (1). Here the ring thickness Ar isequal to the distance between data points of 0.79 cm. The AIMSsoftware provides flux values in units of cm’of water volume percm"of probe area per second. When the volume flux (cm /cm-/s) ismultiplied by the cross sectional area of each ring segment (cm)and summed over the entire cross-section of the spray, the totalvolume flow rate in units of mL/s is obtained, as in Equation (2).From this calculation, the mass can be compared to the physicalcollection. Finally, the physical capture was acquired using a grad-uated cylinder and stopwatch; this data was used to calculate theflow rate in L/min. 3. Results and discussion 3.1. Spray characterisation Inconsistent PDI data was obtained for all 10 cm treatmentswhich were determined to be a result of non-spherical droplets stillundergoing atomization. Therefore, these treatments were elimi-nated from the original treatment list. It is important to note,however, that the closeness of measurement is a factor of sprayer/nozzle technology and will change accordingly: sprayers that pro-duce low droplet spectra at high pressures hasten the atomisationprocess which will alter the near-source sampling procedure. Forexample,Tratnig and Brenn (2010) found that 8 cm was a suitabledistance for a similar nozzle (Delavan type SDX) at pressuresranging between 750 and 15,200 kPa; this distance was alsothought to be the more applicable distance for such researchbecause it was the nearest point that ensured spherical dropletsstill undergoing atomization to avoid evaporation and coalescence.These high pressures (compared to 310-520 kPa in the currentstudy) will result in more rapid atomization of the liquid sheet intodrops closer to the nozzle. It should also be noted that the PDI willgive drop size data at close distances, but the flux will be incomplete due to validation requirements. The shape of the spray plume at the five sampling heights isillustrated in Fig.2. As can be expected, the closer the PDI is to thenozzle, the narrower the plume and vice versa. This shows a po-tential for assessing spray patterns as well as flux: at the 20 cmsamplings, a concave apex can be observed which is indicative ofthe hollow cone nozzle used; as the sampling distance increases,the breakdown of the plume is apparent and by 50 cm exhibits auniform distribution across the axes' entirety. This side-by-sidecomparison also displays the possibility to assess the initial dif-ferences of flux between pressures as well as the nozzles' sym-metry. Disc core nozzles, which work from a binary disc, swirl thespray solution before exiting the secondary orifice; this can also beseen with the lack of symmetry at the apexes of the 20 cm mea-surements and is most evident at the 320 kPa treatment as the 40and 50 cm distance is slightly skewed right of center which couldalso be partially due to the physical turbulence of the solution fromthe 90°elbow which preceded the nozzle. The velocity and dropletdistribution comparisons (Fig.3) illustrate the spray pattern indetail, exhibiting the decay of droplet speed over position, thecentral targeted spray area, and providing insight to the most drift-prone mass (≤100 um) which, in this situation is approximately10% of the cumulative volume illustrated in Fig. 4. The cumulative volume profiles (Fig. 4) across all heights andpressures followed a similar trend as well as illustrates the shift forfiner particle sizes as pressures increase. Volume median diameter(Dvo.5) differed 13% ranging from 195 to 253 um which also in-dicates the most opposite treatments of the 520 kPa at 20 cm to310 kPa at 50 cm (Table 3). Tuck et al.(1997) discuss the differencesin droplet distributions as sampling height changes in theirresearch as compared with others; with another laser systemwhich works using imaging processes, the particle measuringsystem (PMS). The PMS showed that Dvo.5 has a potential to stay thesame or decrease with decreasing sampling heights (Lake and Dix,1985; Young,1990). The data from the present study (Table 3) alsoindicates that there exists a relationship of Dvo.5 and samplingheight for all three pressures. However this is possibly due to abiasing of the sampling as the smaller droplets, with faster losses ofinertia, will not get sampled with larger droplets as well as thepotential for smaller droplets to coalesce as they descend. But it isimportant to take into consideration that the volume profile ismostly decided by the large droplet classes and the small dropletsplay a less significant role. Lastly, droplets ≤100 pm are consideredto be the most prone to drift (Nuyttens et al, 2007a). The testedparameters exhibited 5.0-9.2% cumulative volume beneath the100 um threshold which increased with increasing pressure(Table 3). 3.2. Mass flux validation Application volume for the 310, 410, and 520 kPa treatmentsiwere 590, 670, and 770 mL/min, respectively, following the ex-pected trend of flow increasing with the square root of pressure.The calculated mass flux error ranged between -1-16.9 and 4.7% witha trend to under-predict mass, especially as the nozzle distance tothe PDI increased (Table 4). Dullenkopf et al. (1998) also observed an under-prediction with their similar phase Doppler system (afirst generation Aerometrics PDPA), capturing ≤50% of the sprayedmass from a swirl-type atomizer at 500 kPa. Their research alsoexamined two additional PDI systems (a DANTEC, DualPDA and aQui & Sommerfeld PDA) which were more accurate with thisarrangement, however all three phase Doppler systems under-estimated mass when the atomizer was changed from a simplexpressure-swirl to an air-blast at 50 kPa water pressure and 300 kPaair pressure. The authors attribute this deficit to the inability toassess the dense sprays at their 10 cm sampling distance.However,it is possible that their sampling height was too low thereby beingaffected by non-spherical droplets at a low pressure a was seen inthe 10 cm treatment in the present study. 3.3. Limitations Limitations for PDIs vary between systems, however the num-ber of droplets required to pass through the probe volume is aconsistent concern and is important for accuracy and validation.Many authors have discussed the minimum droplet count as alimiting factor and it is evident among the literature that 10,000 to20,000 droplet counts is acceptable for sound statistical analysis(Parkin, 1993; Nuyttens et al., 2007b; Tratnig and Brenn, 2010);Dullenkopfet al.(1998) sampled 10,000 counts with the exceptionof the edges where flux is naturally low. This is an important dif-ference when sampling the plume with a single traverse/passversus taking static measurements which made it possible to assessthe flux in a like manner for the plume's entirety while still gainingacceptable counts and errors. However, this is not always possible,particularly when operating in the proposed in-field environmentswhere conditions readily change. More feasible to control, traversespeed was deemed more important for the present study whereastime will be the limiting factor that will always be at a conflictagainst meteorological turbulence. Nuyttens et al. (2007b) alsoaimed for ≥10,000 droplets per scan, but traversed the whole Fig. 3. Velocity (top) and size distributions (bottom) for the 410 kPa treatment at 20(left) and 50 cm (right) above the sampling volume. plume during each scan at traversing speeds between 0.0166 and0.0300 m/s. However, their work was solely for velocity and sizedistribution analysis which do not need the elevated frequency. Inthe present study, where flux and time were the focus, with aconstant speed of 0.0079 m/s (2.1-3.8 times slower than theaforementioned research), accepted frequency of ≥10,000 countswere achievable for the majority of treatments within 9% errorregardless of counts, ranging from 5884 to 38,034 (Table 5); withthe exception of the lowest count observed at the lowest pressureand furthest distance with a 17% error and 4413 average counts.However this is expected because higher pressures supply morevolume as well as further atomization with heightened samplingfrequency. Yet another limitation is the technology's intrusiveness due tothe unavoidable hardware design. Early model PDI systems werenot intrusive as the detector and receiver are far from the samplingvolume. Probes such as the F/PDI and the Demeter have uprightswhich may interfere with the droplets' trajectories as well as thedroplets influence on the uprights and protective windows. It wasobserved in this study that window saturation interfered with ac-curate flux measurements and shrouds were carefully fashionedover the windows so that the spray would not deposit on thesesurfaces as well as deter the spray away from the sampling volumewhich would provide erroneous data from the bouncing andshattering droplets. Furthermore, as discussed by Chuang et al.(2008),“Optical contamination”may lead to uncertainties indroplet data, it is important to note the differences of each appli-cation whereas the F/PDI was engineered to be situated on anairplane for cloud measurements where aircraft speeds range from50 to 100 m/s minimizing such saturation/contamination. Lastly,data acquisition for PDI technologies rely on frequency of counteddroplets, and minor laser obscuration should not impact data ifthere is enough frequency. However, in the atmospheric conditionof a laboratory where no such air velocities are present, a simpledroplet deposited onto the optics can deter the laser away from thereceiver thereby missing data points through a traversing sample orreduce the lasers’intensity (affecting the fringe spacing of themerging beams). Dullenkopf et al.(1998) also observed hardwaremalfunction and missing data points with the Qui and SommerfeldPDA, attributing to a 5%error. It is hoped that the air velocities fromair assisted orchards sprayers (upwards of 30 m/s), as well as theheightened frequency, will also play a role in optical cleansing and Fig. 4. Percent cumulative volume profiles for all treatment heights, grouped bypressure. Green solid lines exhibit a 13% difference of volume median diameter rangingbetween 195 and 253 um as well as ≤9.2% of the cumulative volume being ≤100 umwhich is indicative of the most drift-prone droplets. Table 3 Percent volume(%V)≤100 um, Dvo.5(um), and mean velocities (m/s) for all heights and pressures reported as averages across all replications as well as standard deviation (SD)of replicates. kPa %V≤100 um SD DV0.5 SD Velocity SD %V≤100 pm SD DV0.5 SD Velocity SD 20cm 30 cm 310 8.0 0.09 221 3.05 6.17 0.21 6.6 0.10 246 2.80 5.27 0.06 410 7.3 0.19 218 1.50 7.06 0.01 6.8 0.14 221 1.58 5.89 0.04 520 9.1 0.08 195 2.96 7.76 0.16 9.2 0.21 202 0.78 6.48 0.04 40 cm 50 cm 310 5.3 0.40 247 2.9 4.35 0.09 5.0 0.28 253 3.27 3.75 0.01 410 6.6 0.33 233 3.9 4.99 0.09 7.2 0.51 218 5.96 4.24 0.05 520 8.6 0.33 210 3 5.46 0.06 9.0 0.29 209 1.36 4.71 0.02 Table4 Treatment list and results (averaged across replications) including voltages persampling locations and standard deviation (SD) between treatments. Height Pressure Voltage Output” Calculated Error SD Cm kPa V mL/min mL/min % 20 310 400 590 568 -3.7 42.1 30 310 370 590 566 4.1 24.2 40 310 340 590 534 -7.9 24.8 50 310 335 590 491 16.9 9.9 20 410 390 670 695 2.2 38.8 30 410 365 670 651 4.2 21.4 40 410 350 670 666 2.1 49.0 50 410 340 670 654 -2.4 64.2 20 520 395 770 806 4.7 21.0 30 520 375 770 791 2.8 20.4 40 520 350 770 746 -3.1 31.2 50 520 335 770 708 -9.3 43.5 Average -3.3 Sampling distance between nozzle tip and sampling volume." Nozzle output physically captured. Computational nozzle output from PDI. reliable data acquisition. Lastly, the Demeter's narrow samplingrange (Table 1) which is limited to spectra below the 550 umthreshold which is common for such droplet work and unique foreach phase Doppler system. For instance, the Dantec PDA of Tratnigand Brenn (2010) had a maximum drop size of 451 um while theDantec system of Tuck et al.(1997) had a maximum of 875 um, andthe Aerometrics PDPA of Sidahmed et al.(1999) was able to mea-sure up to 700 um.This, of course, was a moot issue for that of the F/PDI where cloud droplets range from 5 to 50 um (Chuang et al.,2008). Unfortunately, this is very limiting for agricultural sprayerswhereas future research with the Demeter probe will be limited tonozzle classifications of extra fine, very fine, fine, and possiblymedium (depending on pressure) with maximum droplet spectraof ≤550 um (Anon. 2009). 4. Conclusions The use of a field grade phase Doppler was investigated tocomputationally assess the mass flux of a spray plume with ahollow-cone nozzle. Preliminary results indicate that in-fieldanalysis of mass for an orchard air-blast sprayer is plausible. The Table 5 Average samples (counts) per pressure and height combination as well as thestandard deviation (SD) of replicates. kPa 20 cm SD 30 cm SD 40 cm SD 50 cm SD 310 17,592 446.2 9139 102.1 5884 276.8 4413 164.1 410 26,491 535.6 15,194 392.7 10,541 465.9 7970 387.2 520 38,034 464.2 25,792 305.1 15,434 479.2 10,390 307.8 assumption of circular symmetry was used in laboratory conditionsto validate the total mass flow measurement, and show the PDIvoltage could be calibrated based on the mass flux. In field condi-tions effects of wind and sprayer motion will result in non-symmetric spray plumes, so circular symmetric cannot beassumed in field conditions. Nevertheless, the work demonstratesthe validity of PDI measurements for mass flux at a point for agri-cultural sprayers, demonstrating that PDI technology can be used toassess spray quality in field applications. Depending on atmo-spheric turbulence, it is anticipated that the high air velocities andpressures of these sprayers should provide adequate samplingcounts beyond 50 cm as the current research has observed <10%error up to 50 cm from the spray source for pressures ≥410 kPa.Future research is needed to assess the differences of measuredmass against other sampling techniques. A comprehensive reviewby Jensen and Olesen (2014) reported total recovery within mul-tiple tree crops (apple, mandarin, orange, and peach) ranging be-tween 30.8% and 98.4%. Of course, these trials were completelydifferent in terms of their sampling procedure and treatmentswhich all differed in application volumes whereas the most masswas recovered where application volume was 500 L/ha (Balsariet al, 2002) compared to 4000 L/ha (Cunningham and Harden,1998). Further, a great deal of research has not quantified theamount of airborne drift, but assumed that if it were not recoveredin the near-source, it was then drifted material. Therefore it will bethe goal of future research to assess these differences in the near-spray source to determine if the proposed phase Doppler tech-nique can fill these gaps. Most phase-Doppler studies of agricul-tural sprays simply measure the drop size and calculated Dvo.5, butwe have shown the PDI can also measure the mass flux distributionacross a nozzle and capture the total mass of spray. Acknowledgements This research was funded by The Ministry for Business, Inno-vation and Employment, Contract LVLX0901 -“Protecting NZ'sEnvironment from Pesticide Exposure. The authors would also liketo thank Artium Technologies (Inc.) for their technical support aswell as Roger Cook, Andrew Hayward, and Sean Richards of LincolnAgritech for their engineering support of the testing apparatus. References ( 579-590 . ) Chapple, A.C.. Taylor, R.A.L, Hall, F.R., 1995. The transformation of spatially deter-mined drop sizes to their temporal equivalents for agricultural sprays. I. Agric.Eng. Res.60,49-56. Chuang. P.Y., Saw, E.W.. Small, J.D., Shaw, R.A., Sipperley, C.M., Payne, G.A.Bachalo, W.D.. 2008. Airborne phase Doppler interferometry for cloud micro-physical measurements. Aerosol Sci. Technol.42,685-703. Cunningham, G.P. Harden, L, 1998. Reducing spray volumes applied to maturecitrus trees. Crop Prot.17, 289-292. Dullenkopf, K., Willmann, M., Wittig, S., Schone, F, Stieglmeier, M., Tropea, C.,Mundo, C., 1998. Comparative mass flux measurements in sprays using a pat-ternator and the phase-Doppler technique. Part. Part. Syst. Charact. 15, 81-89. Egner, D.,O., Campbell, D., 1960. In: Army US (Ed.), Aerosol Impaction on SmallDiameter Collectors (No. 2352). U.S. Army Chemical Warfare Laboratiories,p. 24. Farooq,M.. Balachandar. R.. Wolf, T.. 2001. Assessment of an agricultural Spray in anon-uniform cross-flow. Trans. ASAE 44, 1455-1460. Forster, W.A., Kimberley, M.O.. Zabkiewicz, J.A., 2005. A universal spary dropletadhesion model. Trans. ASAE 48, 1321-1330. Goguen, R.J., Saunders, B.A.J, Picot, J.J.C., 1997. Flux-based measurements with theMalvern spectrometer. Trans. ASAE 40, 1233-1236. Hewitt, A.J., Roten, R.L., Giles, D.K., Bachalo, W., Connell, R., 2013. A new phaseDoppler interferometer system for evaluation of pesticide sprays in the field. In:ILASS Americas (Ed.), 25th Annual Conference of Liquied Atomization and SpraySystems, Pittsburgh, PA. Jensen, P.K., Olesen, M.H., 2014. Spray mass balance in pesticide application: a re-view. Crop Prot. 61,23-31. Lake, I.R., Dix, A.L,1985. Measurement of droplet size with a PMS optical arrayprobe using an X-Y nozzle transporter. Crop Prot. 4,464-472. Miller, P.C., Tuck, C.R., Murphy, S., da Costa Ferreira, M.,2008. Measurements of thedroplet velocities in sprays produced by different designs of agricultural spraynozzle. In: European Conference on Liquid Atomization and Spray Systems,Como Lake, Italy, pp. 8-10. Nuyttens, D., Baetens, K., De Schampheleire, M., Sonck, B., 2006. PDPA laser-basedcharacterization of agricultural Spray nozzles. CIGR E J. 8. Nuyttens, D.. Baetens, K.. De Schampheleire,M.. Sonck, B.. 2007a. Effect of nozzletype, size and pressure on spray droplet characteristics. Biosyst. Eng. 97,333-345. Nuyttens, D.. De Schampheleire, M.. Baetens, K.. Sonck,B.. 2007b. The influence ofoperator-controlled variables on spray drift from field crop sprayers. Trans.ASABE 50, 1129-1140. Nuyttens,D., De Schampheleire, M.,Verboven, P.,Brusselman,E., Dekeyser, D.,2009.Droplet size and velocity characteristics of agricultural sprays. Trans. ASAE 52,1471-1480. Parkin, C.S., 1993.Methods for measuring spray droplet sizes. Appl. Technol. cropProt. 23.57-84. Salyani, M.. Sweeb, R.D., Farooq, M., 2006. Comparison of string and ribbon sam-plers in orchard spray applications. Trans. ASABE 49, 1705-1710. Schou, W.C.. Forster. W.A.. Mercer, G.N.. Teske, M.E. Thistle, H.W.. 2012. Buildingcanopy retention into AGDISP: preliminary models and results. Trans.ASABE55,2059-2066. Sidahmed,M.M., Brown.R.B.,Darvishvand,M.,1999. Drop-size/velocity correlationsat formation of sprays from fan nozzles.Trans. ASAE 42, 1557-1564. Tratnig, A., Brenn, G., 2010. Drop size spectra in sprays from pressure-swirl atom-izers. Int. J.Multiph. Flow 36, 349-363. Tuck, C.R., Butler-Ellis, M.C., Miller, P.C.H., 1997. Techniques for measurement ofdroplet size and velocity distributions in agricultural sprays. Crop Prot. 16,619-628. Wolf, T., Stumborg, M., Caldwell, B., Grover, R., 1995. A chamber for scanning sprayfrom agricultural nozzles using an Aerometrics phase/doppler particle analyzer.Can. Agric. Eng. 37,305-310. Womac, A.R., Maynard I, R.A., Kirk,I.W.,1999. Measurement variation in referencesprays for nozzle classification. Trans. ASAE 42, 609-616. Young, B.W., 1990. Droplet dynamics in hydraulic nozzle spray clouds. Pesticideformulations and application Systems, 10th Volume. ASTM STP 1078,142-155. Available from: Rory RotenRetrieved on: August ll in-text references underlined in blue are linked to publications on ResearchGate,letting you access and read them immediately. http://dx.doi.org/j.cropro.
确定

还剩6页未读,是否继续阅读?

产品配置单
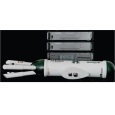
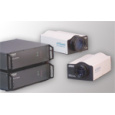
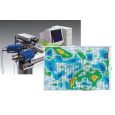
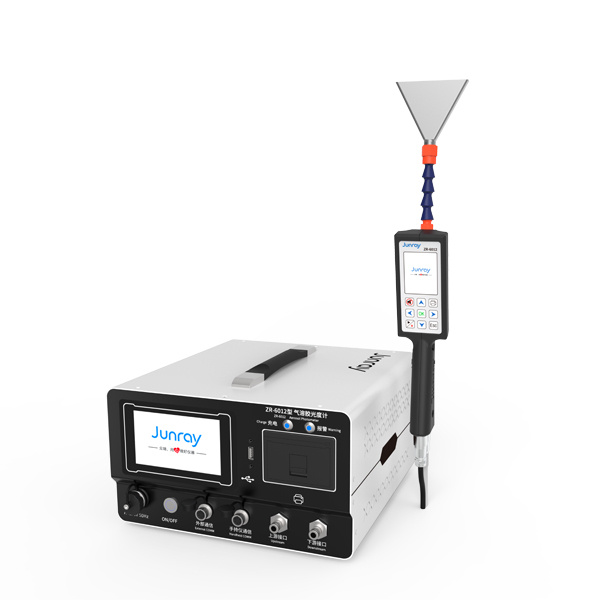
北京欧兰科技发展有限公司为您提供《盘芯喷嘴质量平衡中体积有效性判定检测方案(气溶胶)》,该方案主要用于其他中体积有效性判定检测,参考标准--,《盘芯喷嘴质量平衡中体积有效性判定检测方案(气溶胶)》用到的仪器有Artium PDI-FP 双量程可机载飞行探头、激光相位多普勒干涉仪LDV,PDI,PDPA,PDA、自适应粒子成像测速场仪(PIV)
推荐专场


相关方案
更多
该厂商其他方案
更多