


The results of flow experiments performed in a cylinder array designed to mimica Next Generation Nuclear Plant lower plenum design are presented. Pressure drop and velocity field measurements are made. Based on these measurements, five regimes of behavior are identified that are found to depend on Reynolds number. It is found
that the recirculation region behind the cylinders is shorter than that of half cylinders placed on the wall representing the symmetry plane.
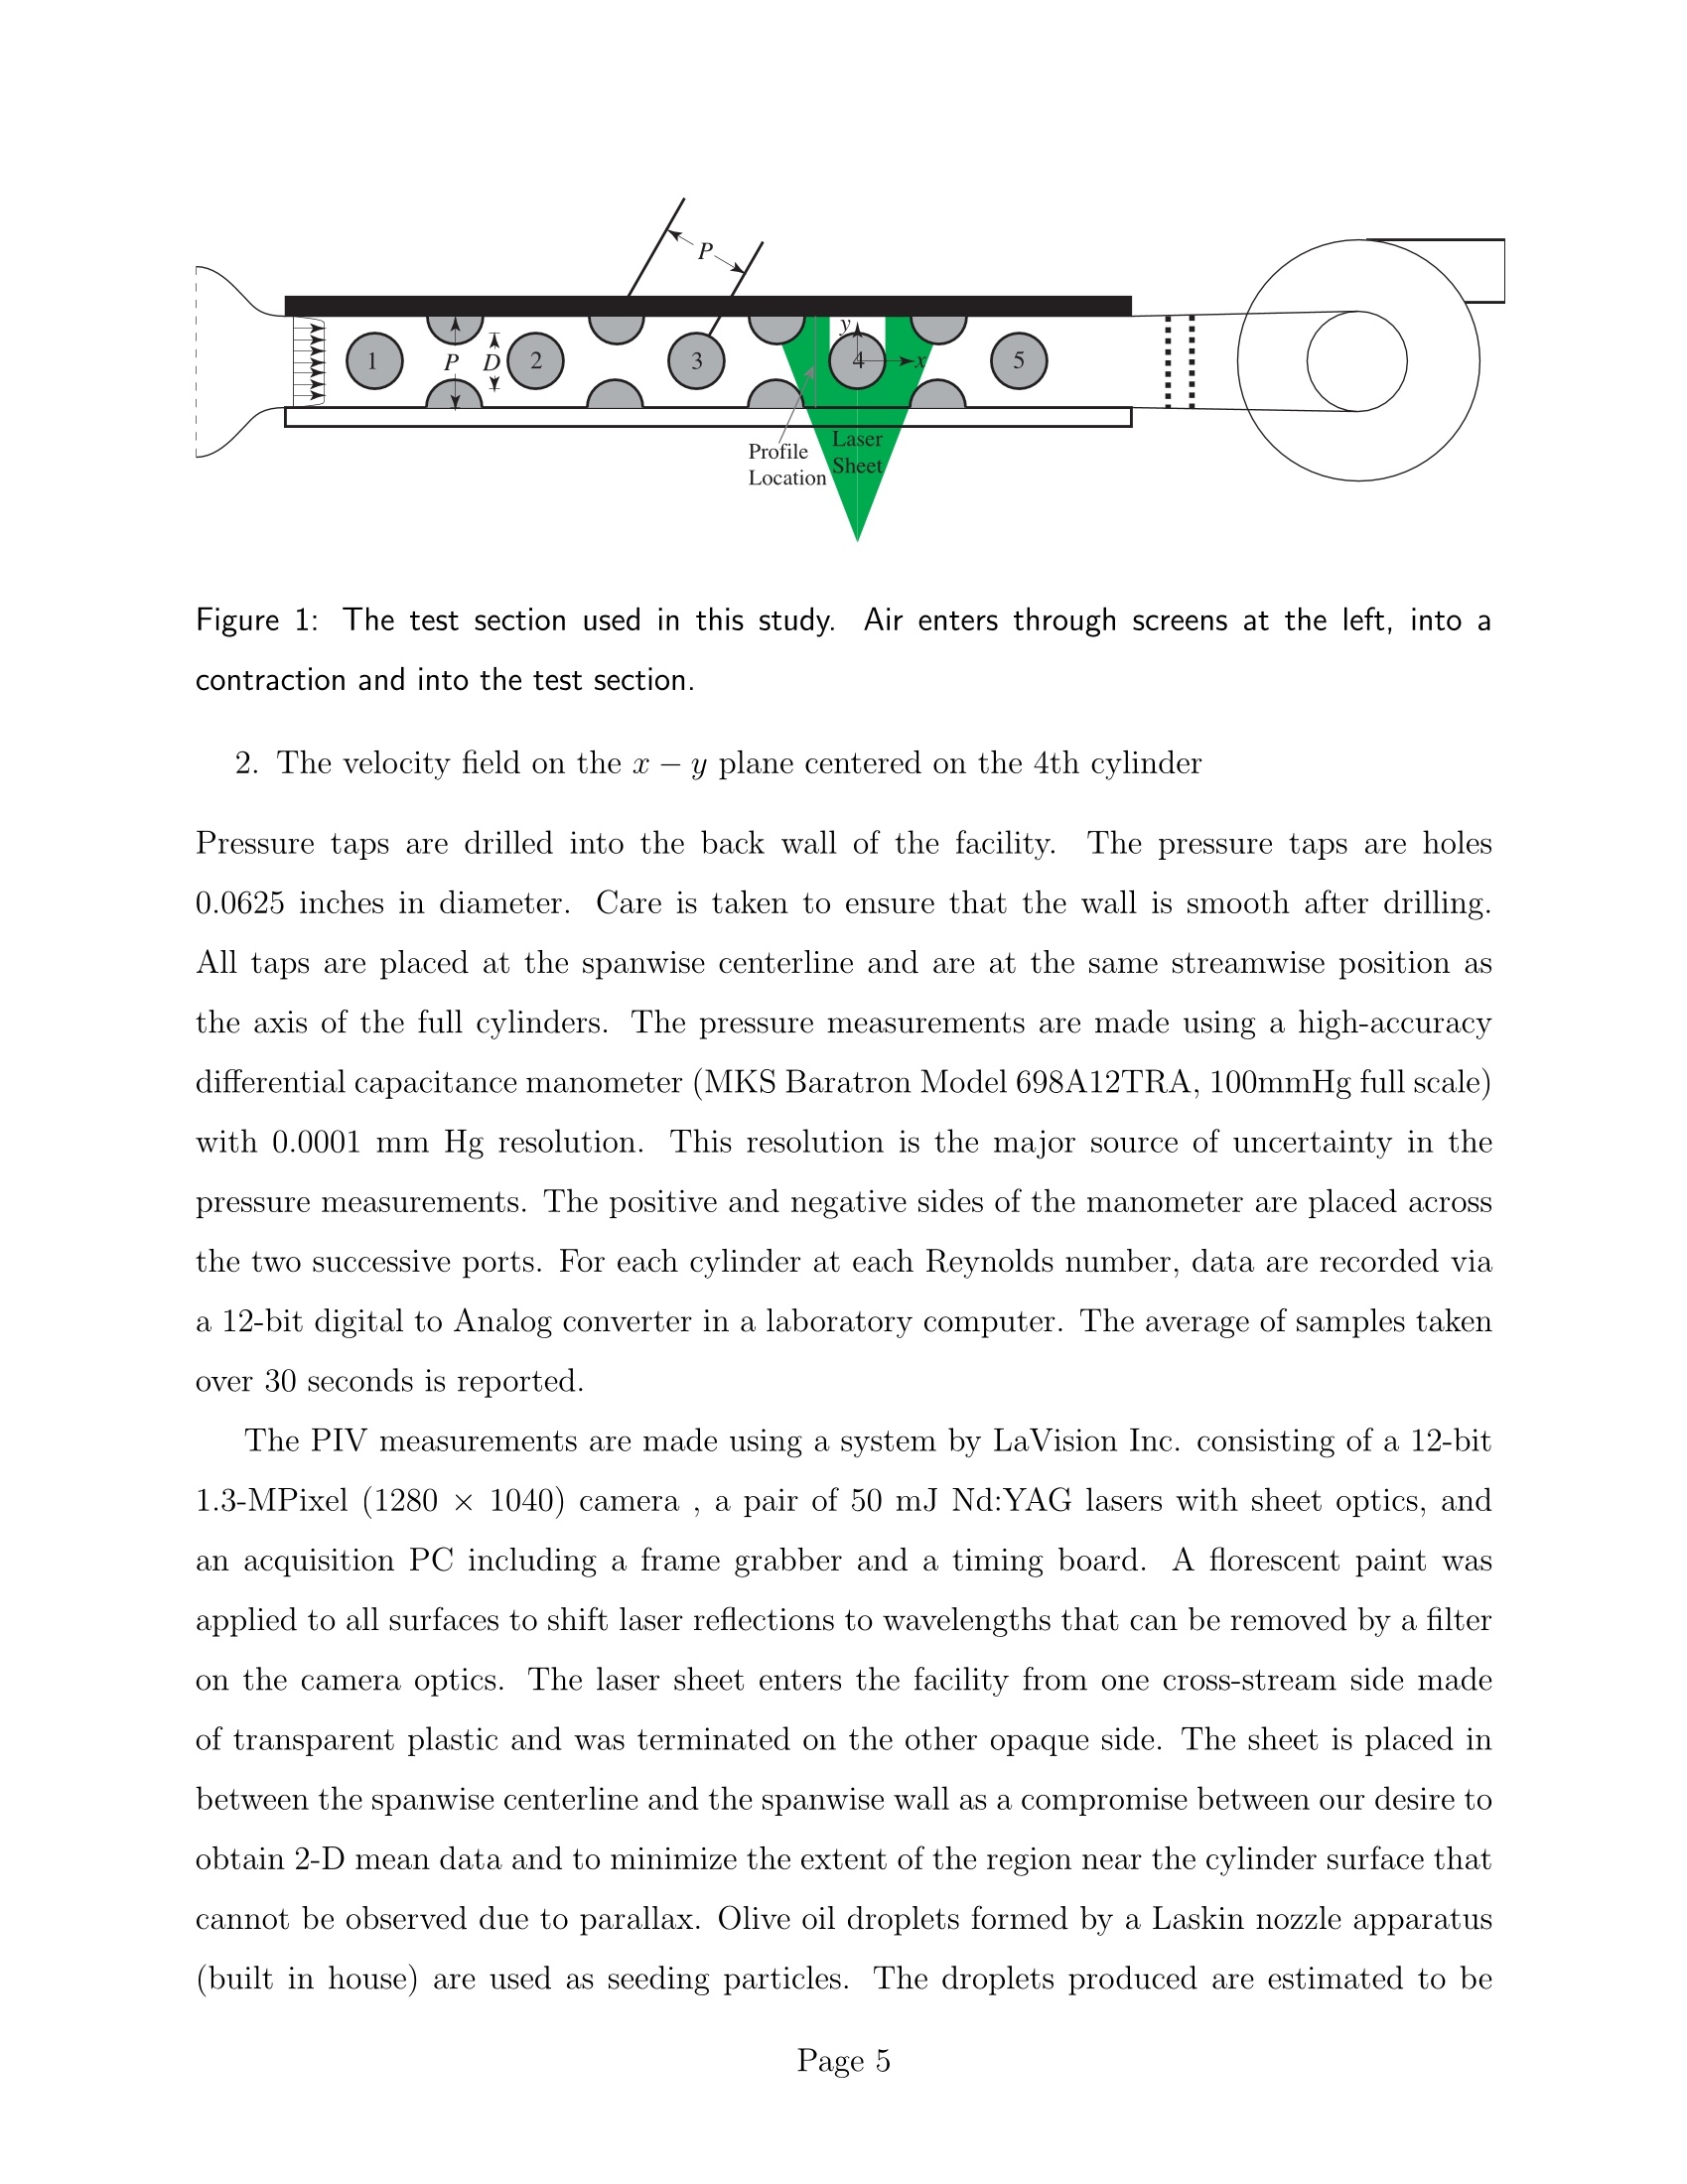
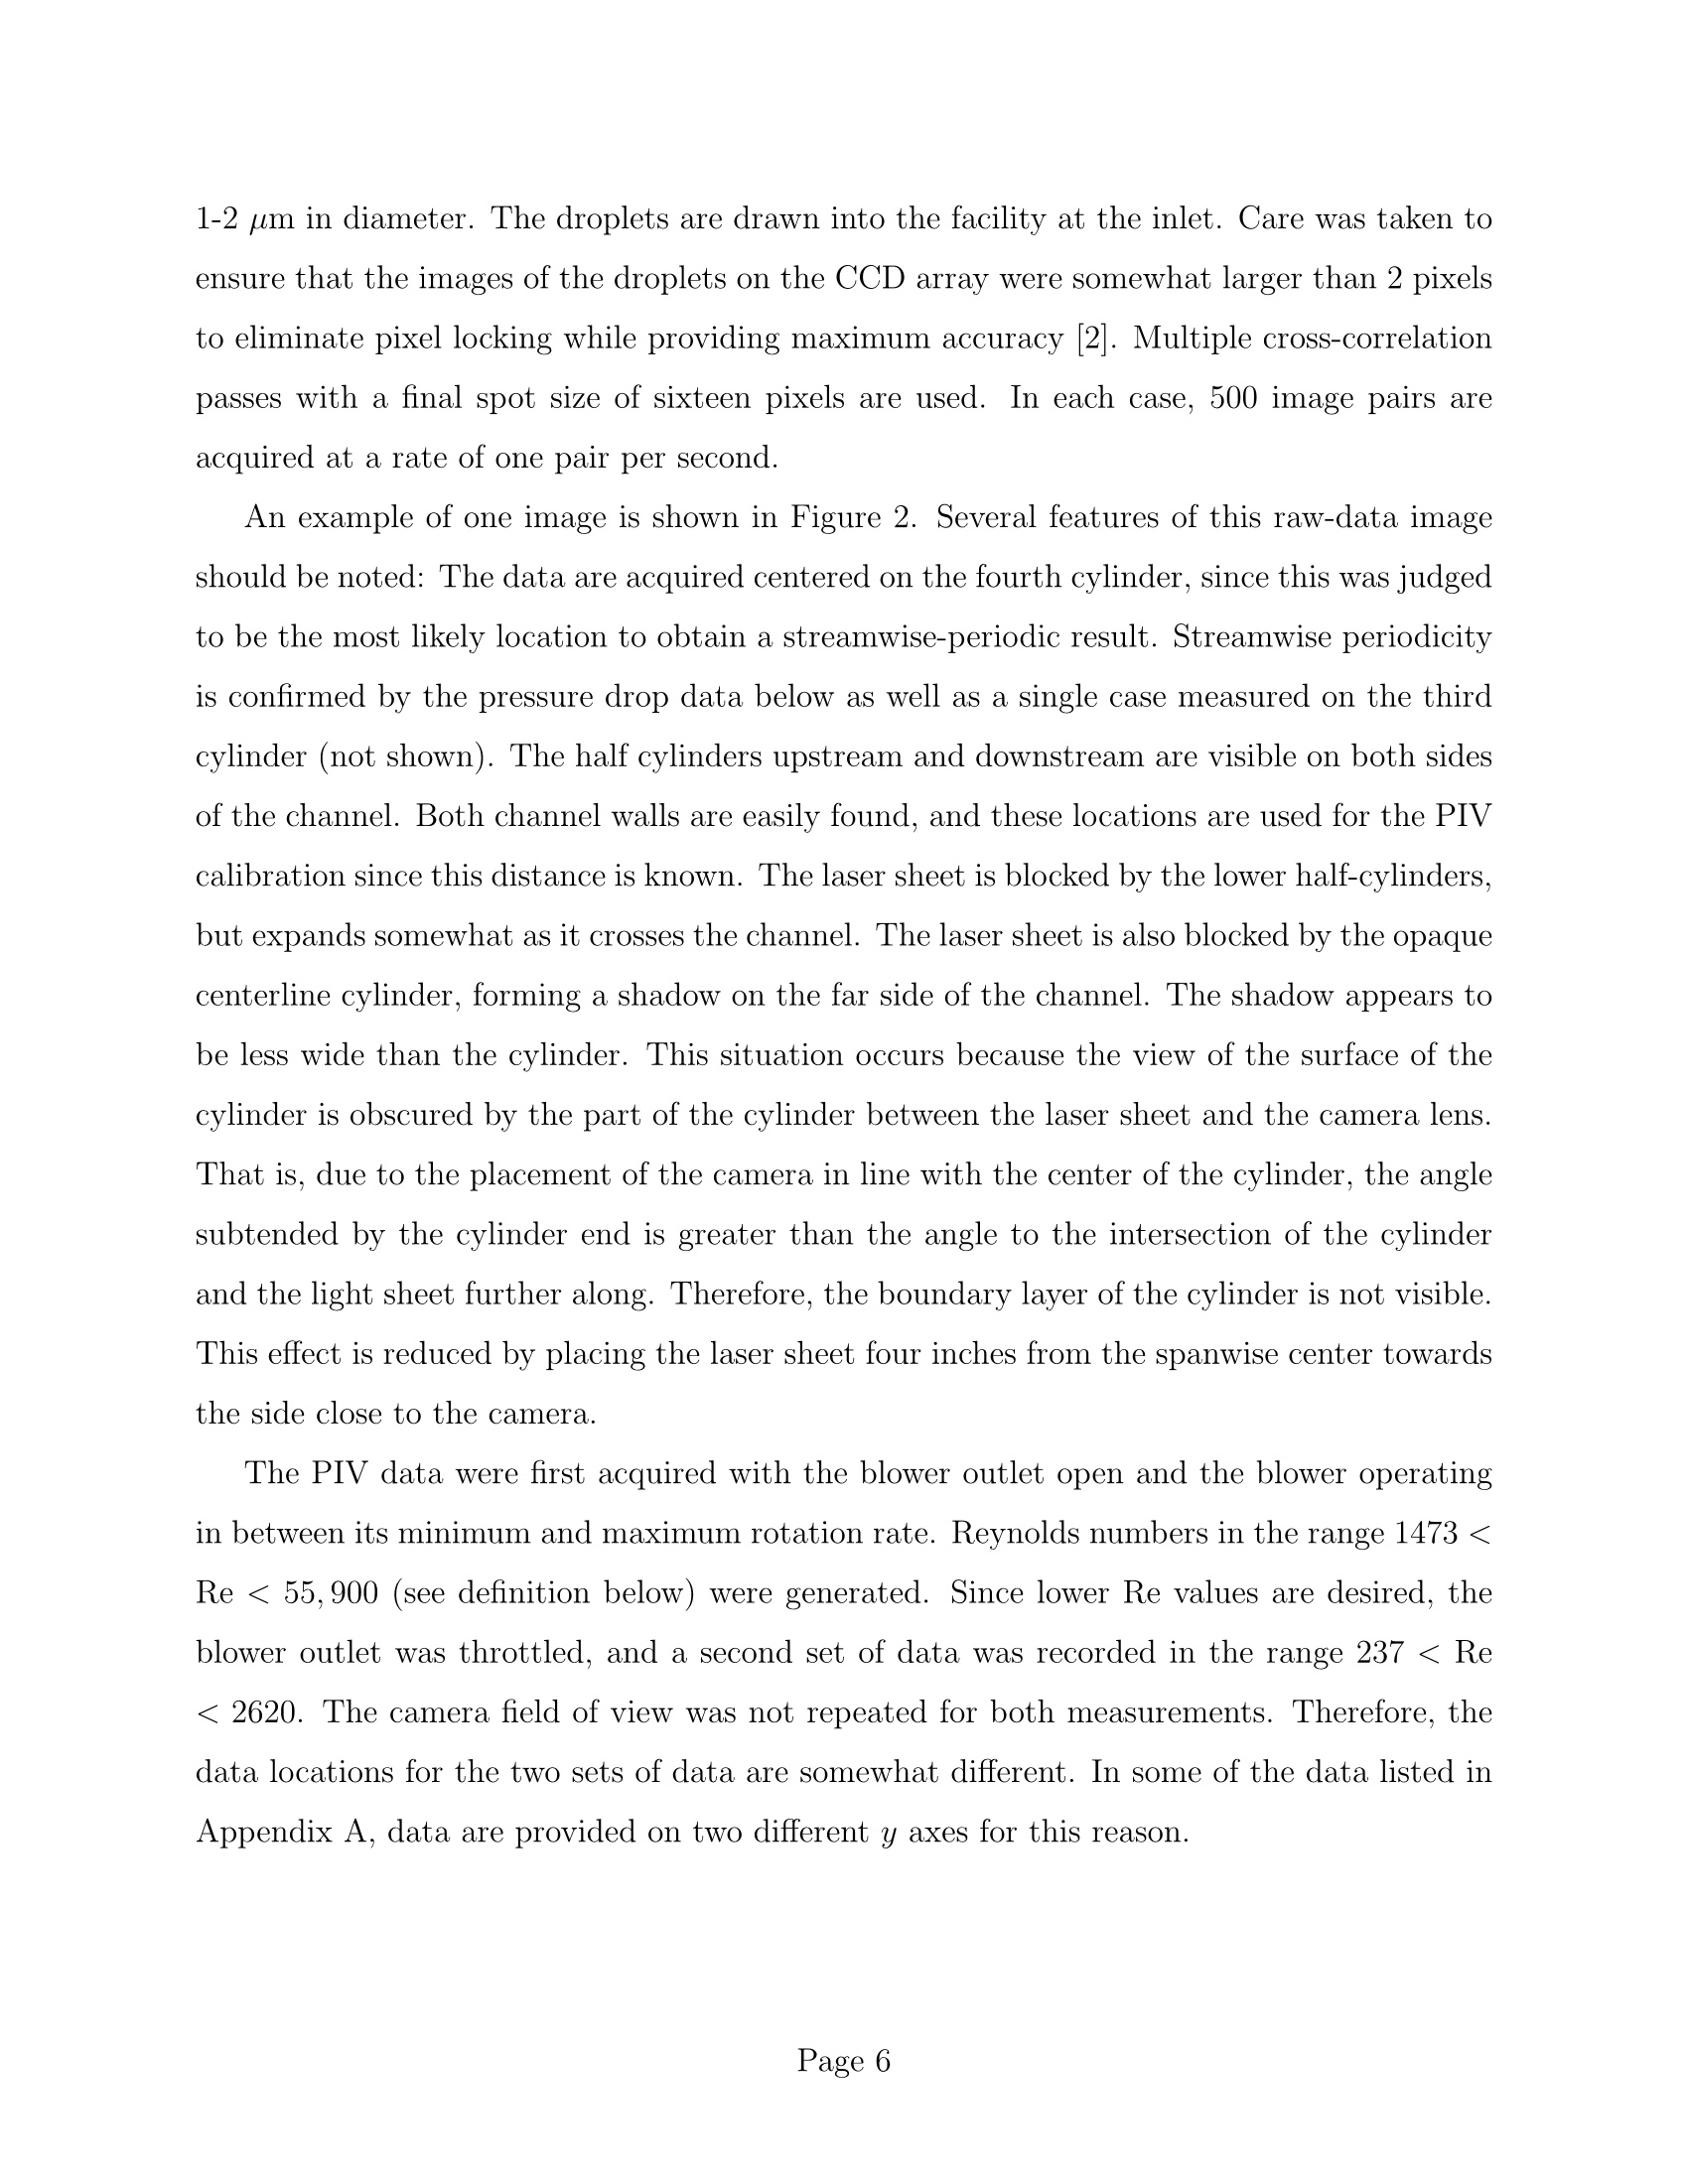
方案详情

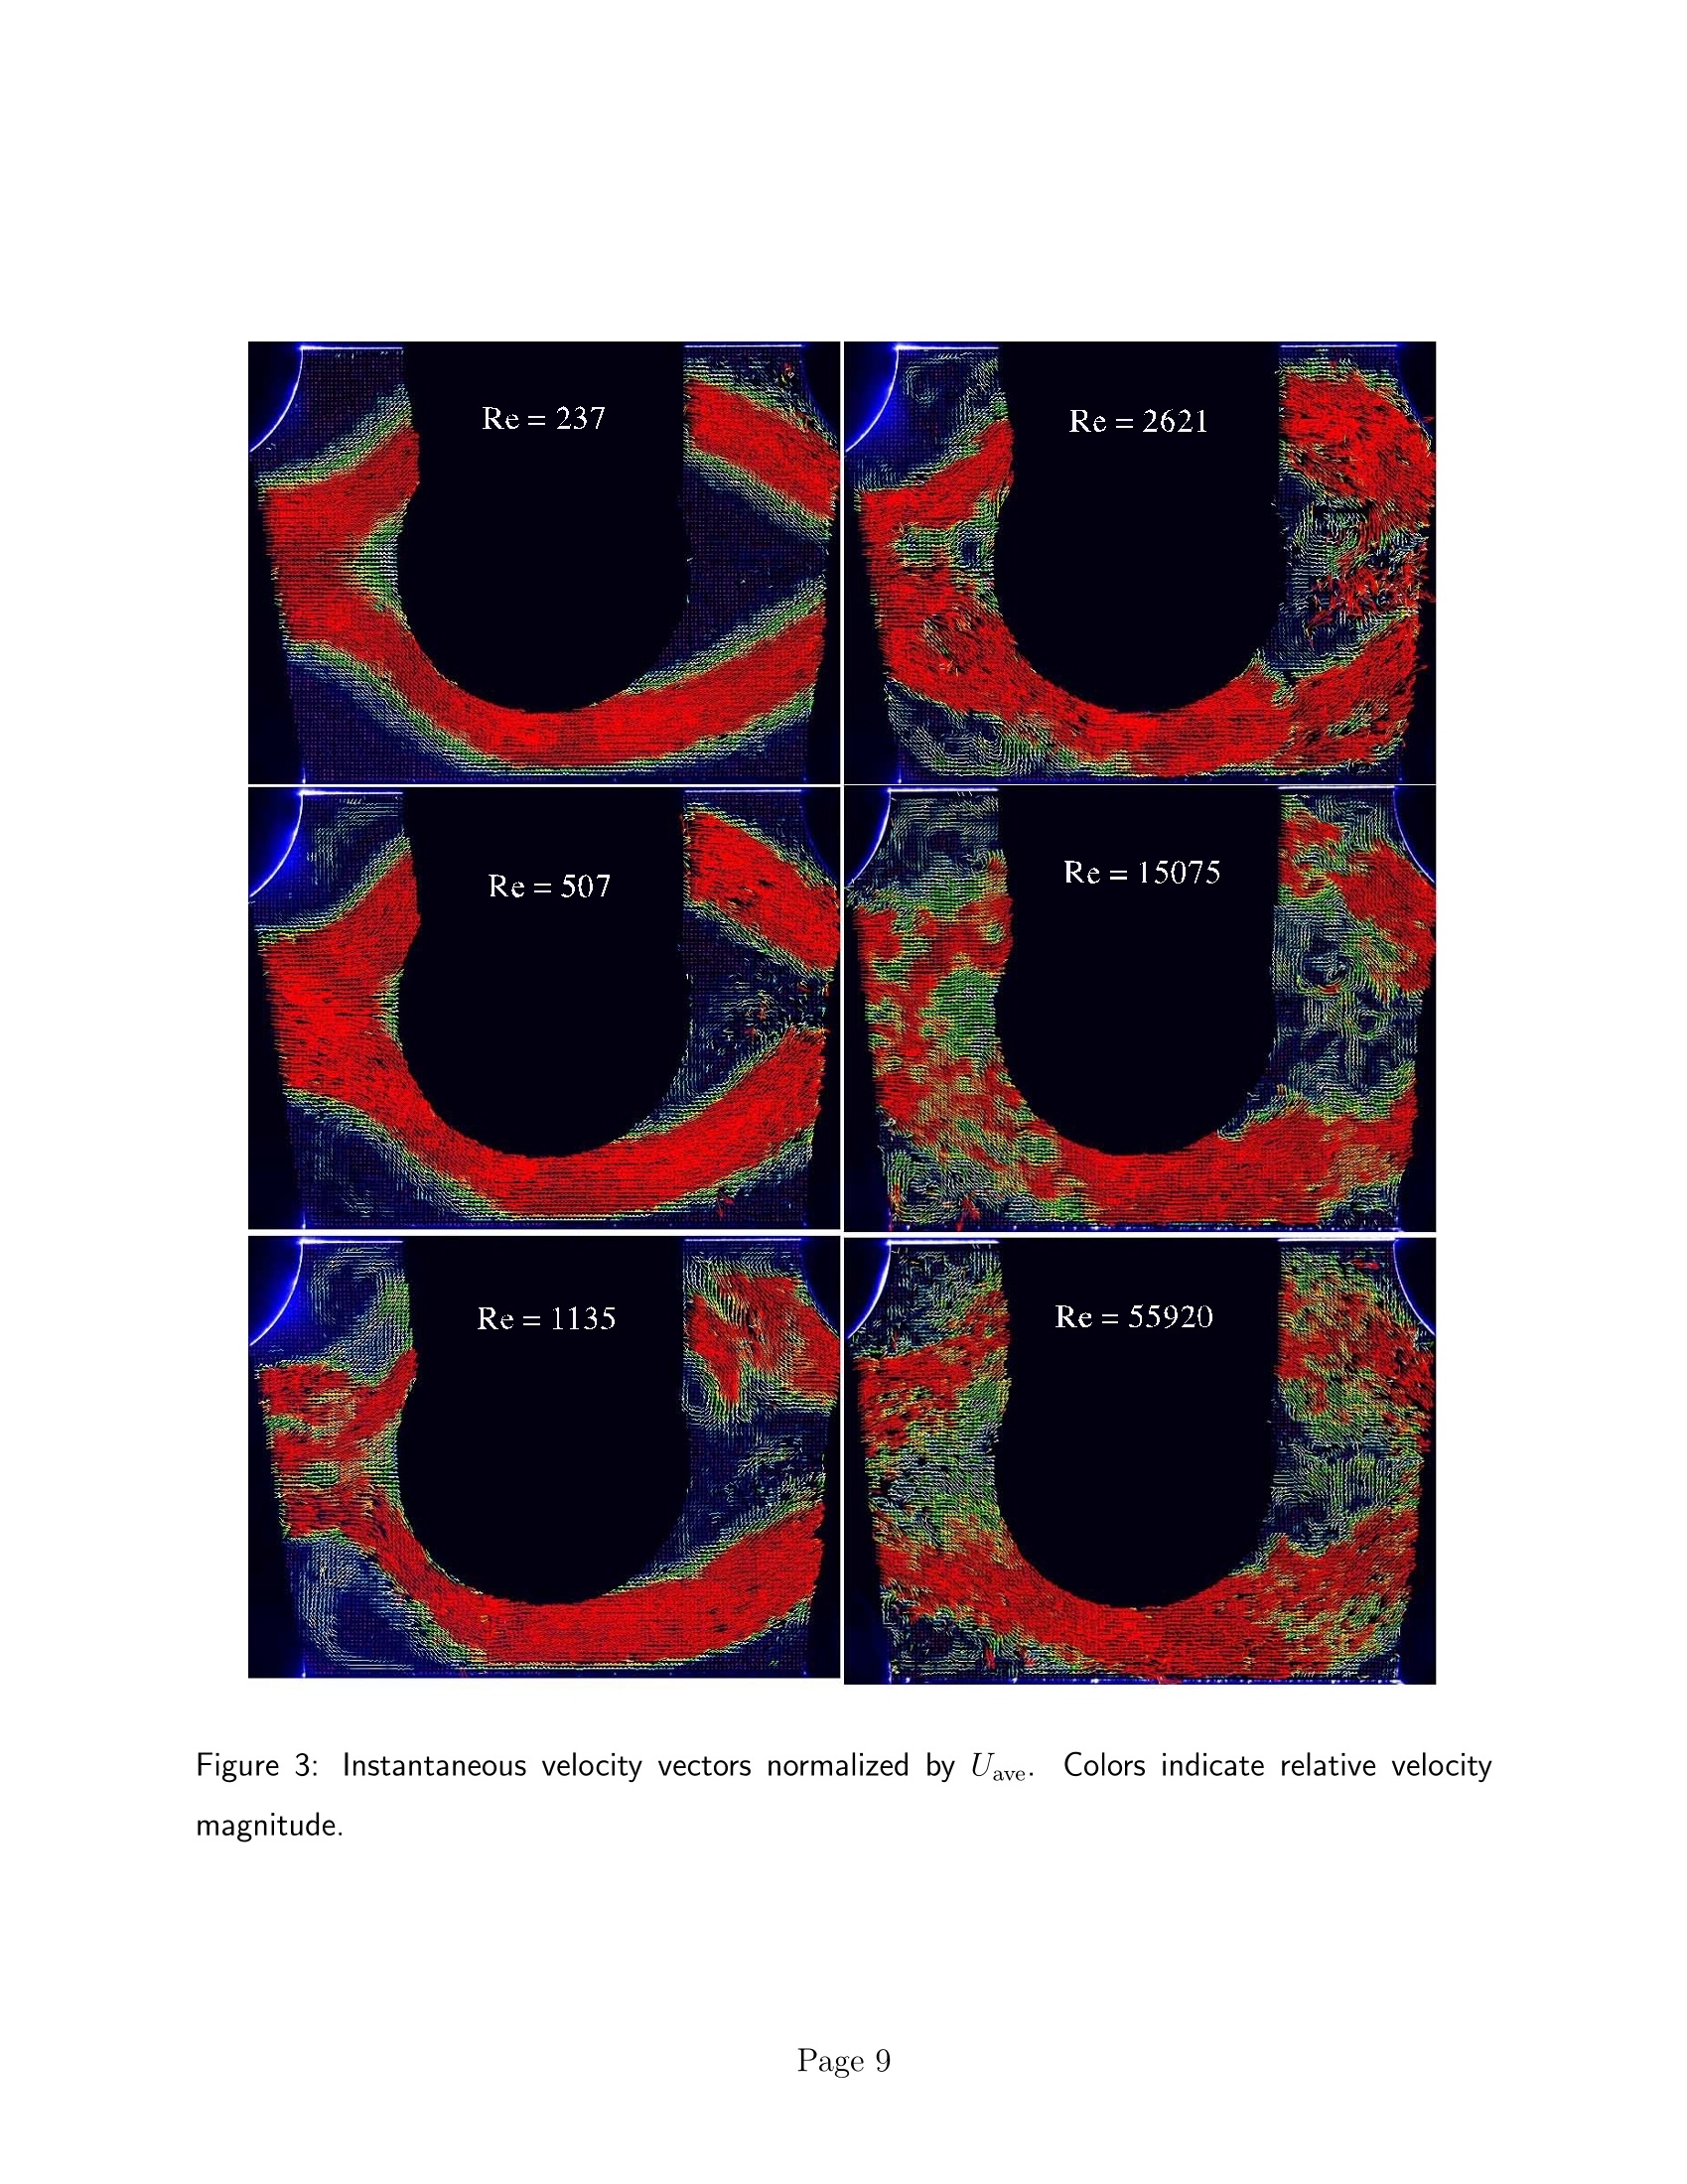
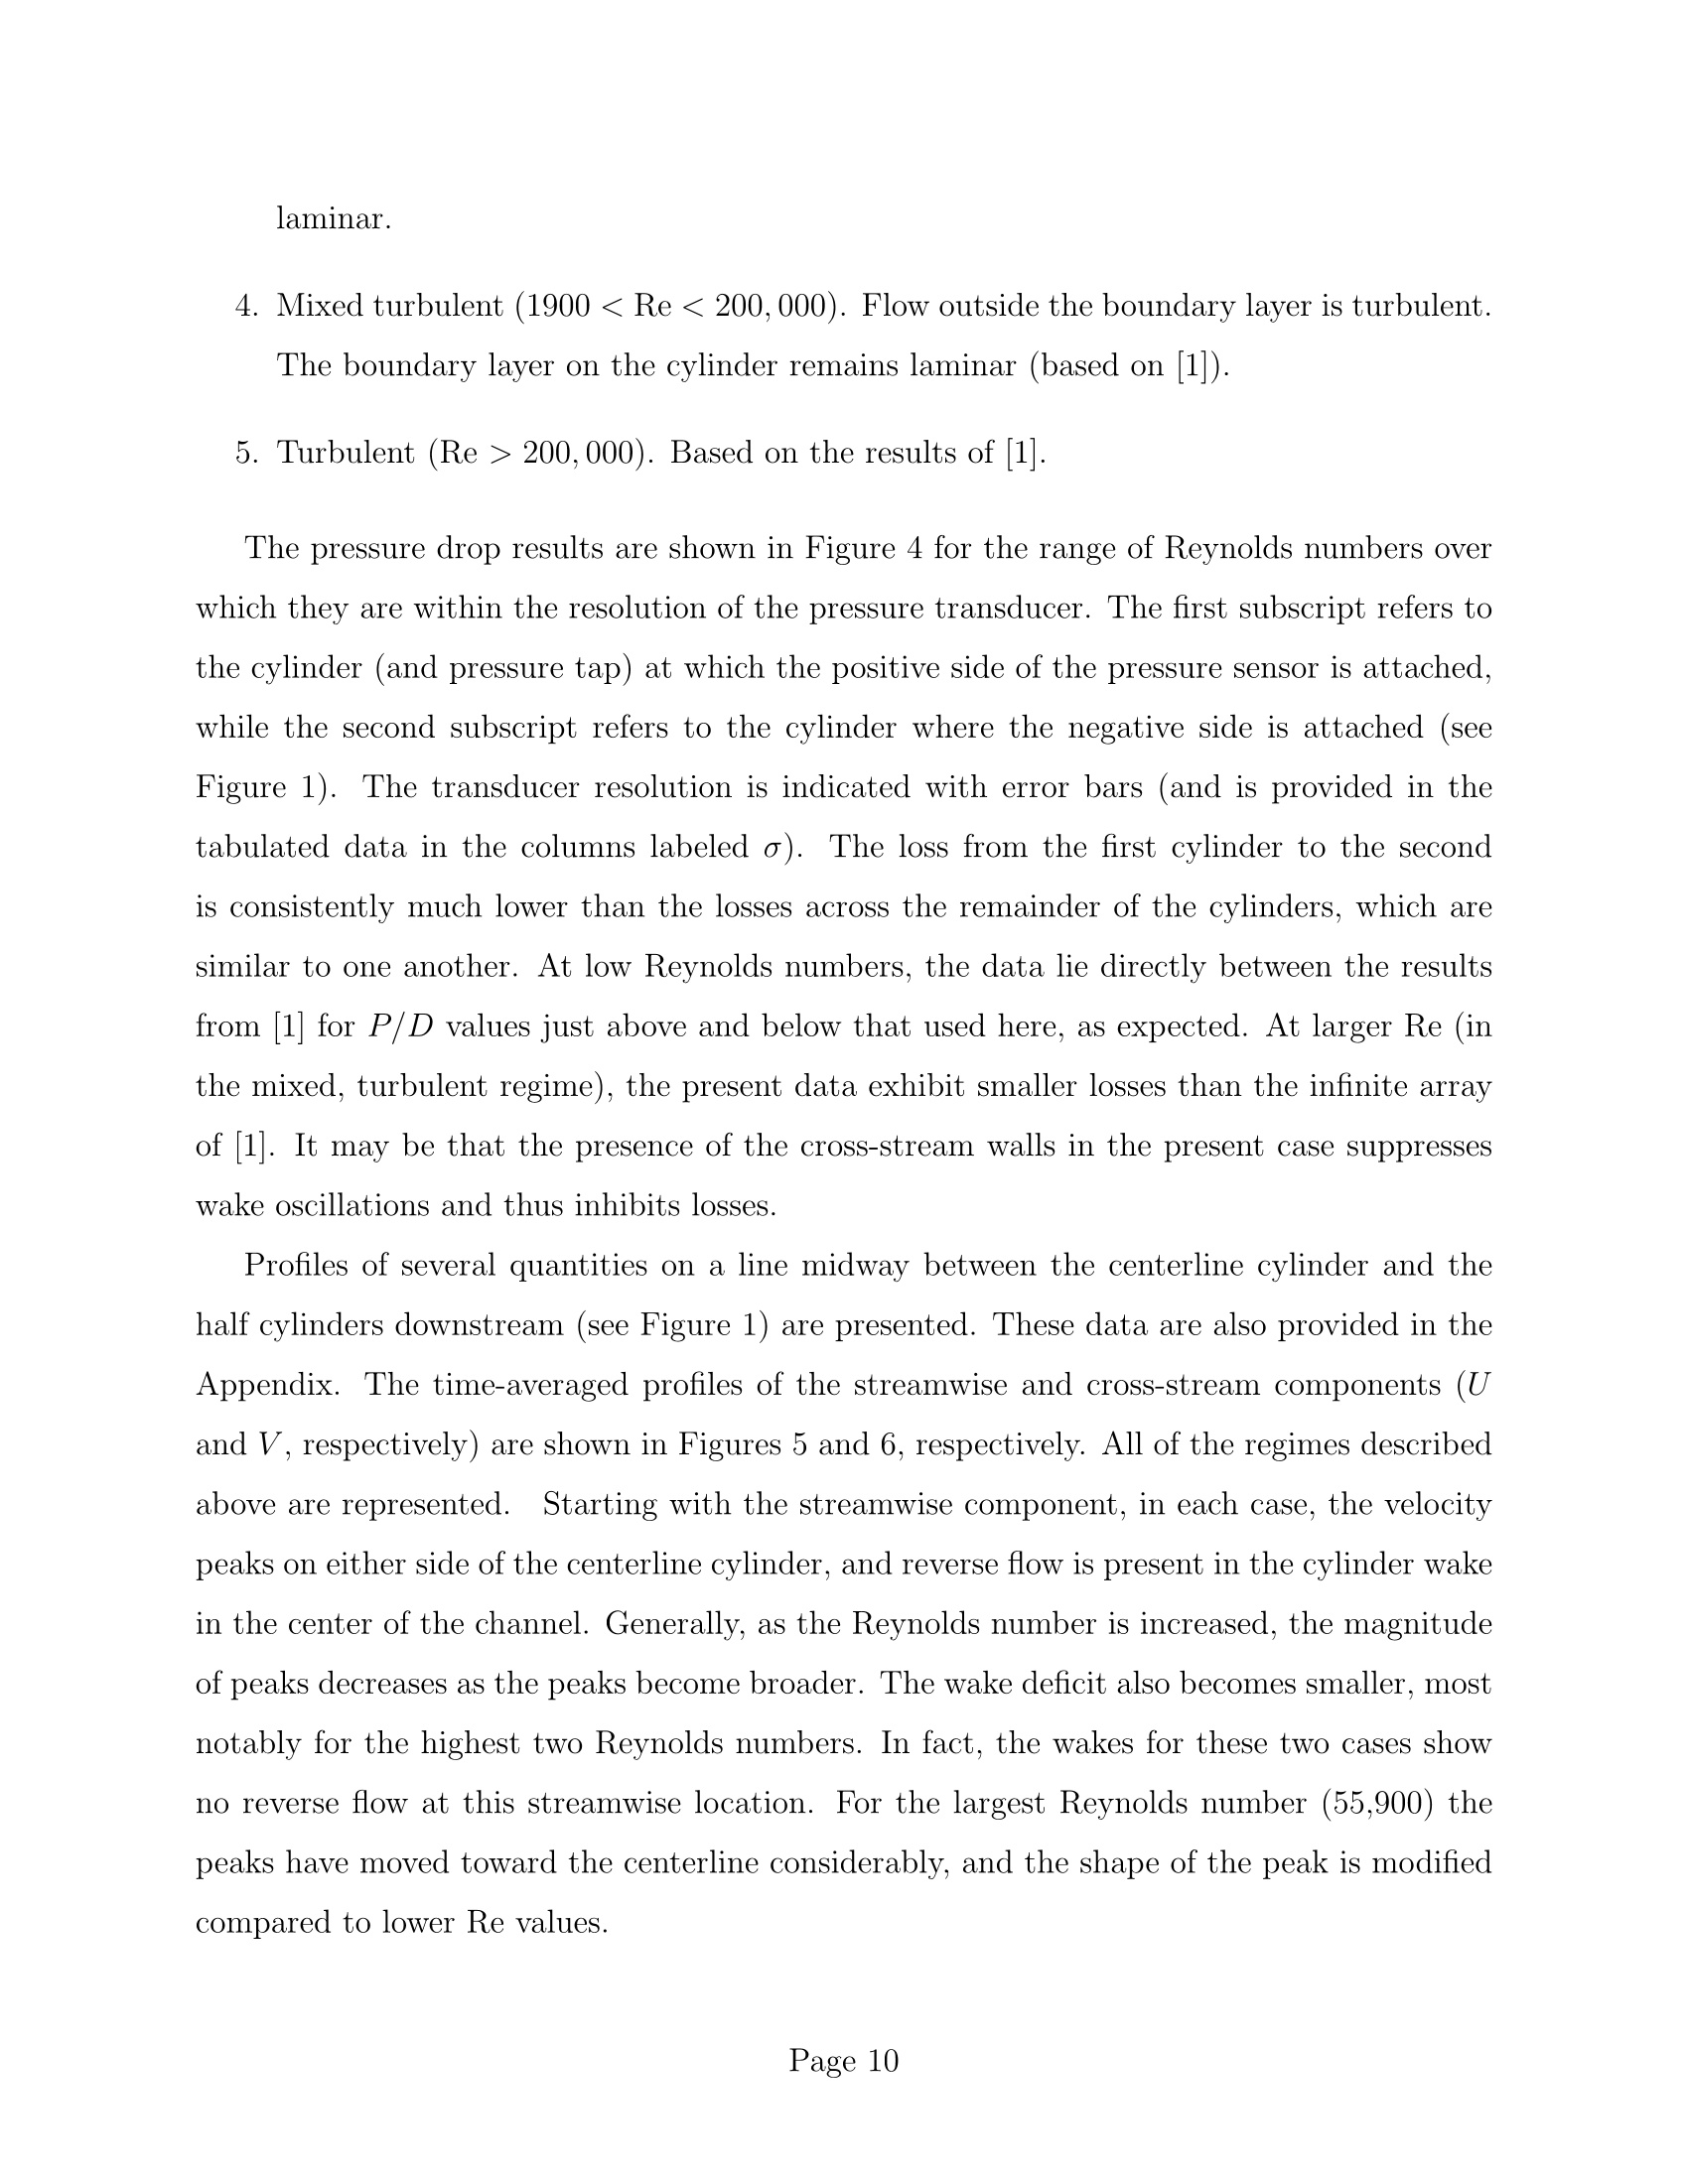
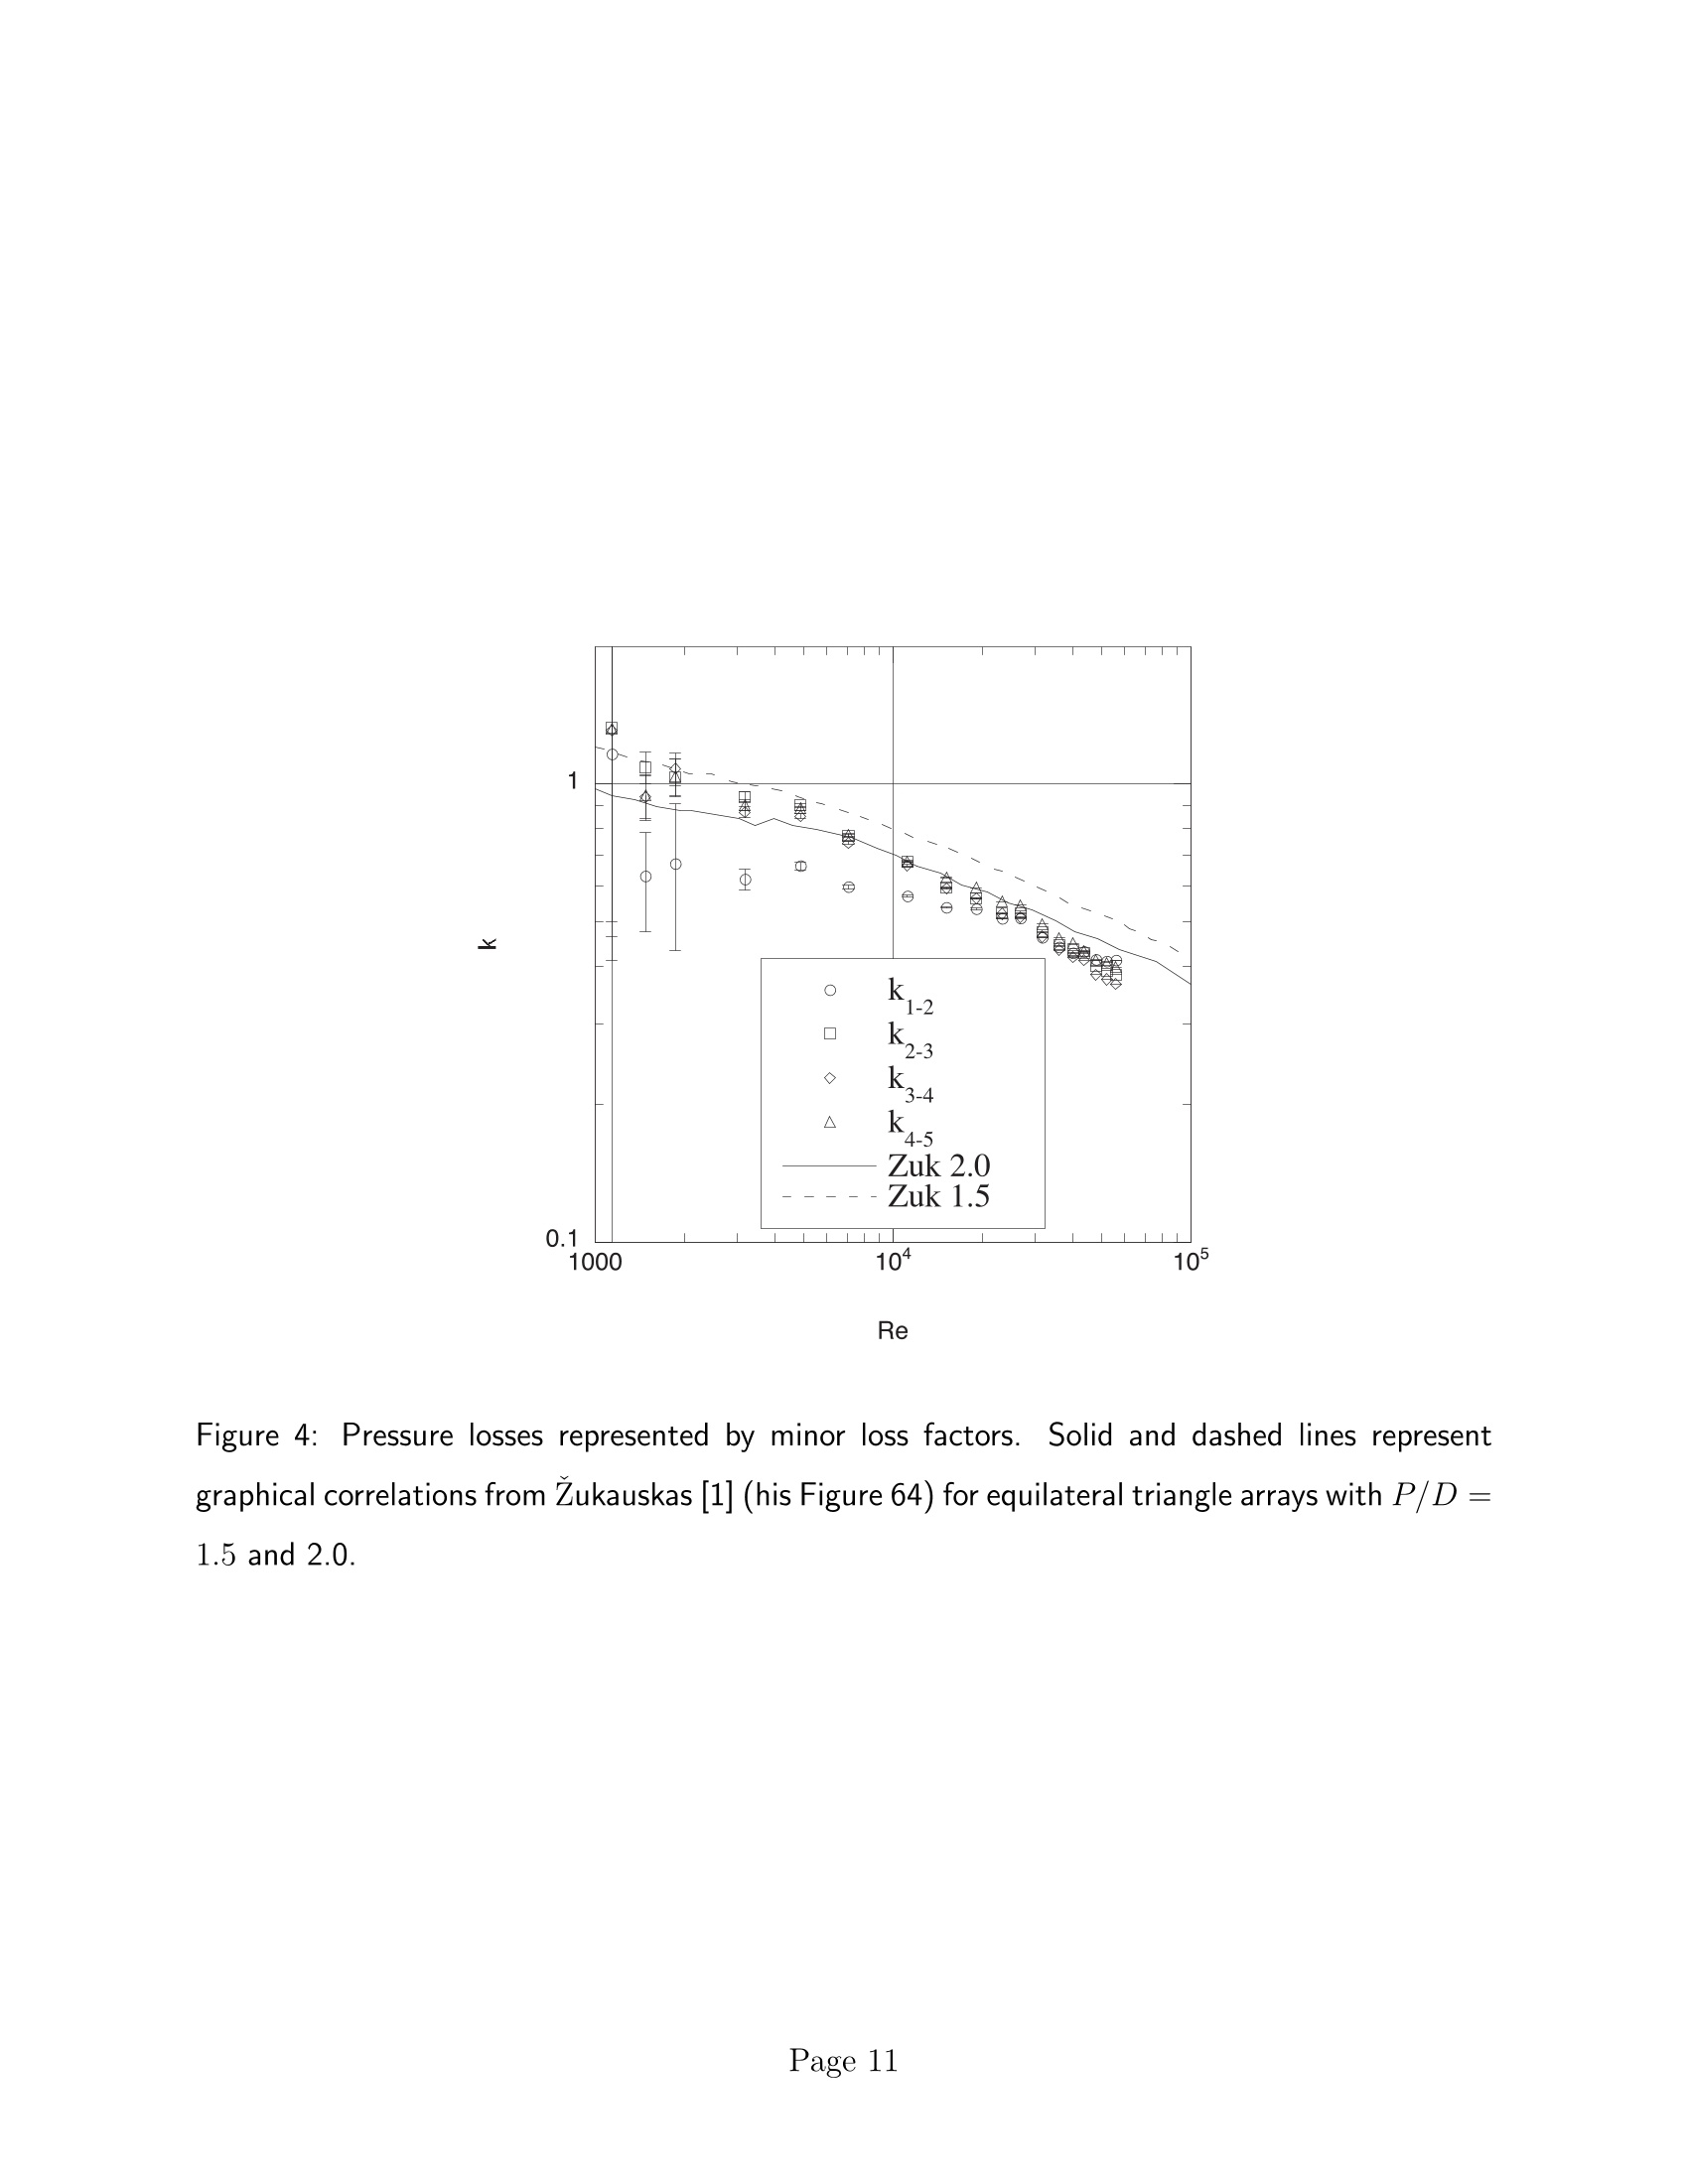
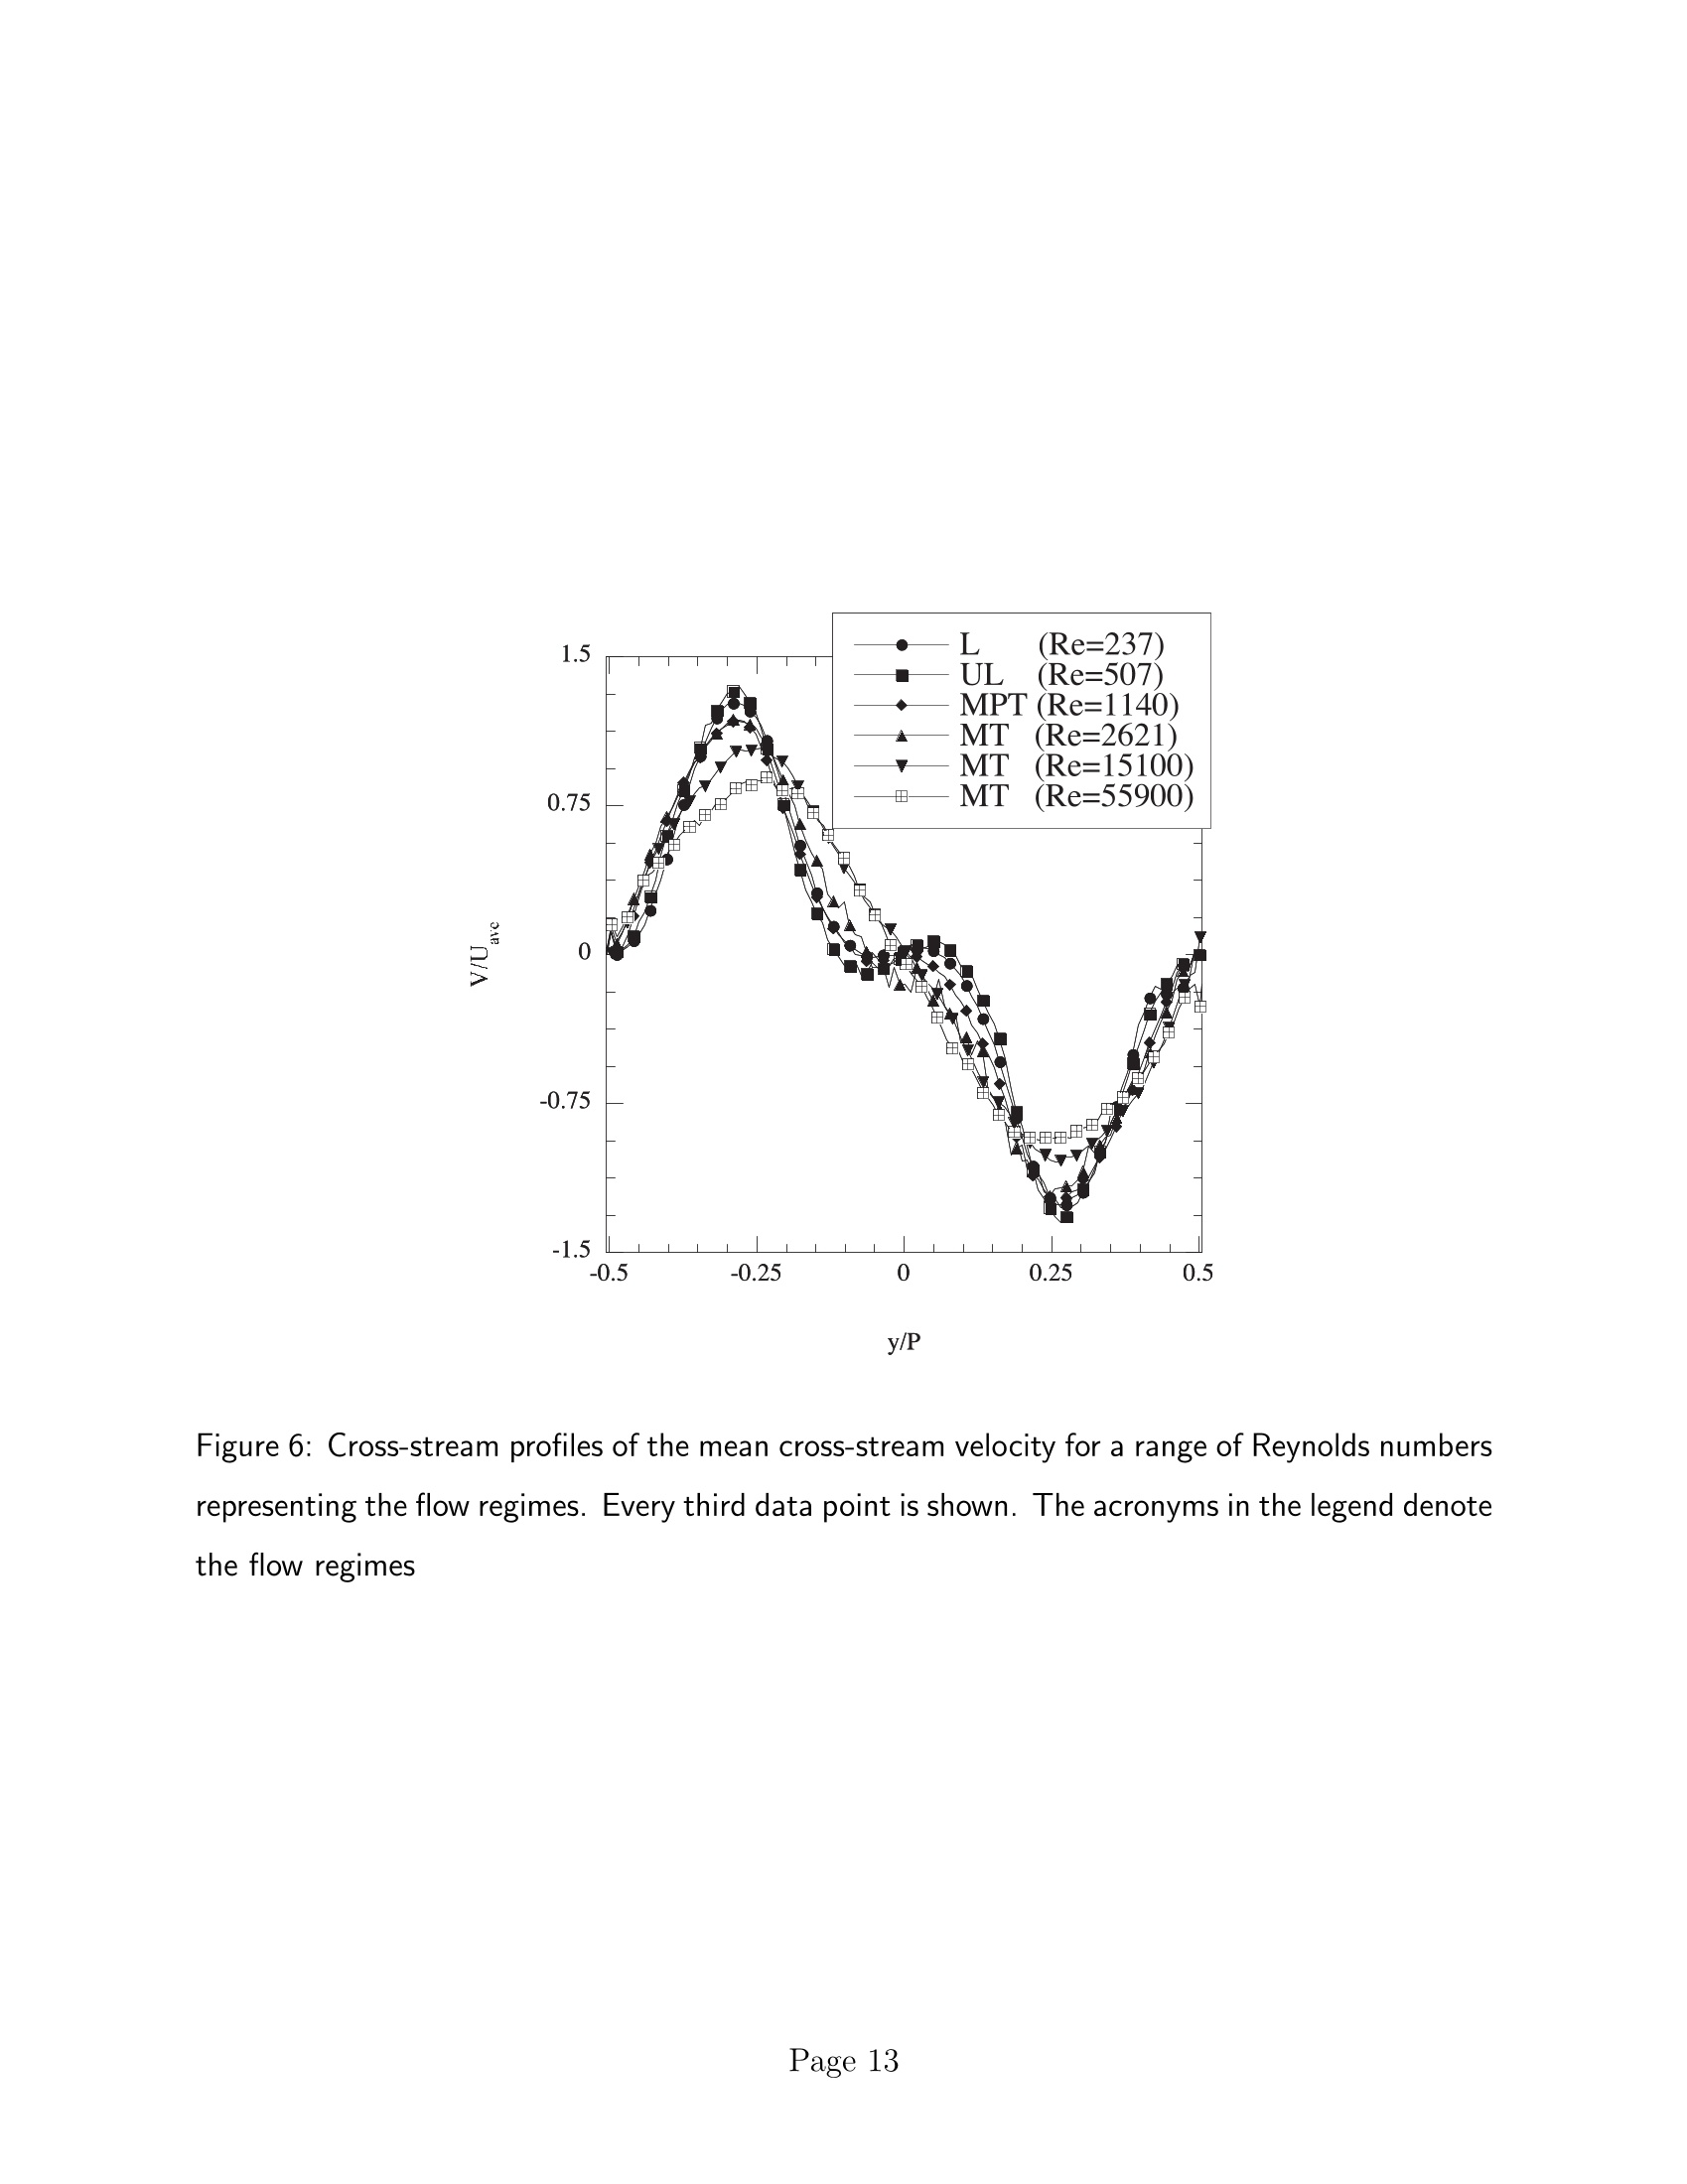
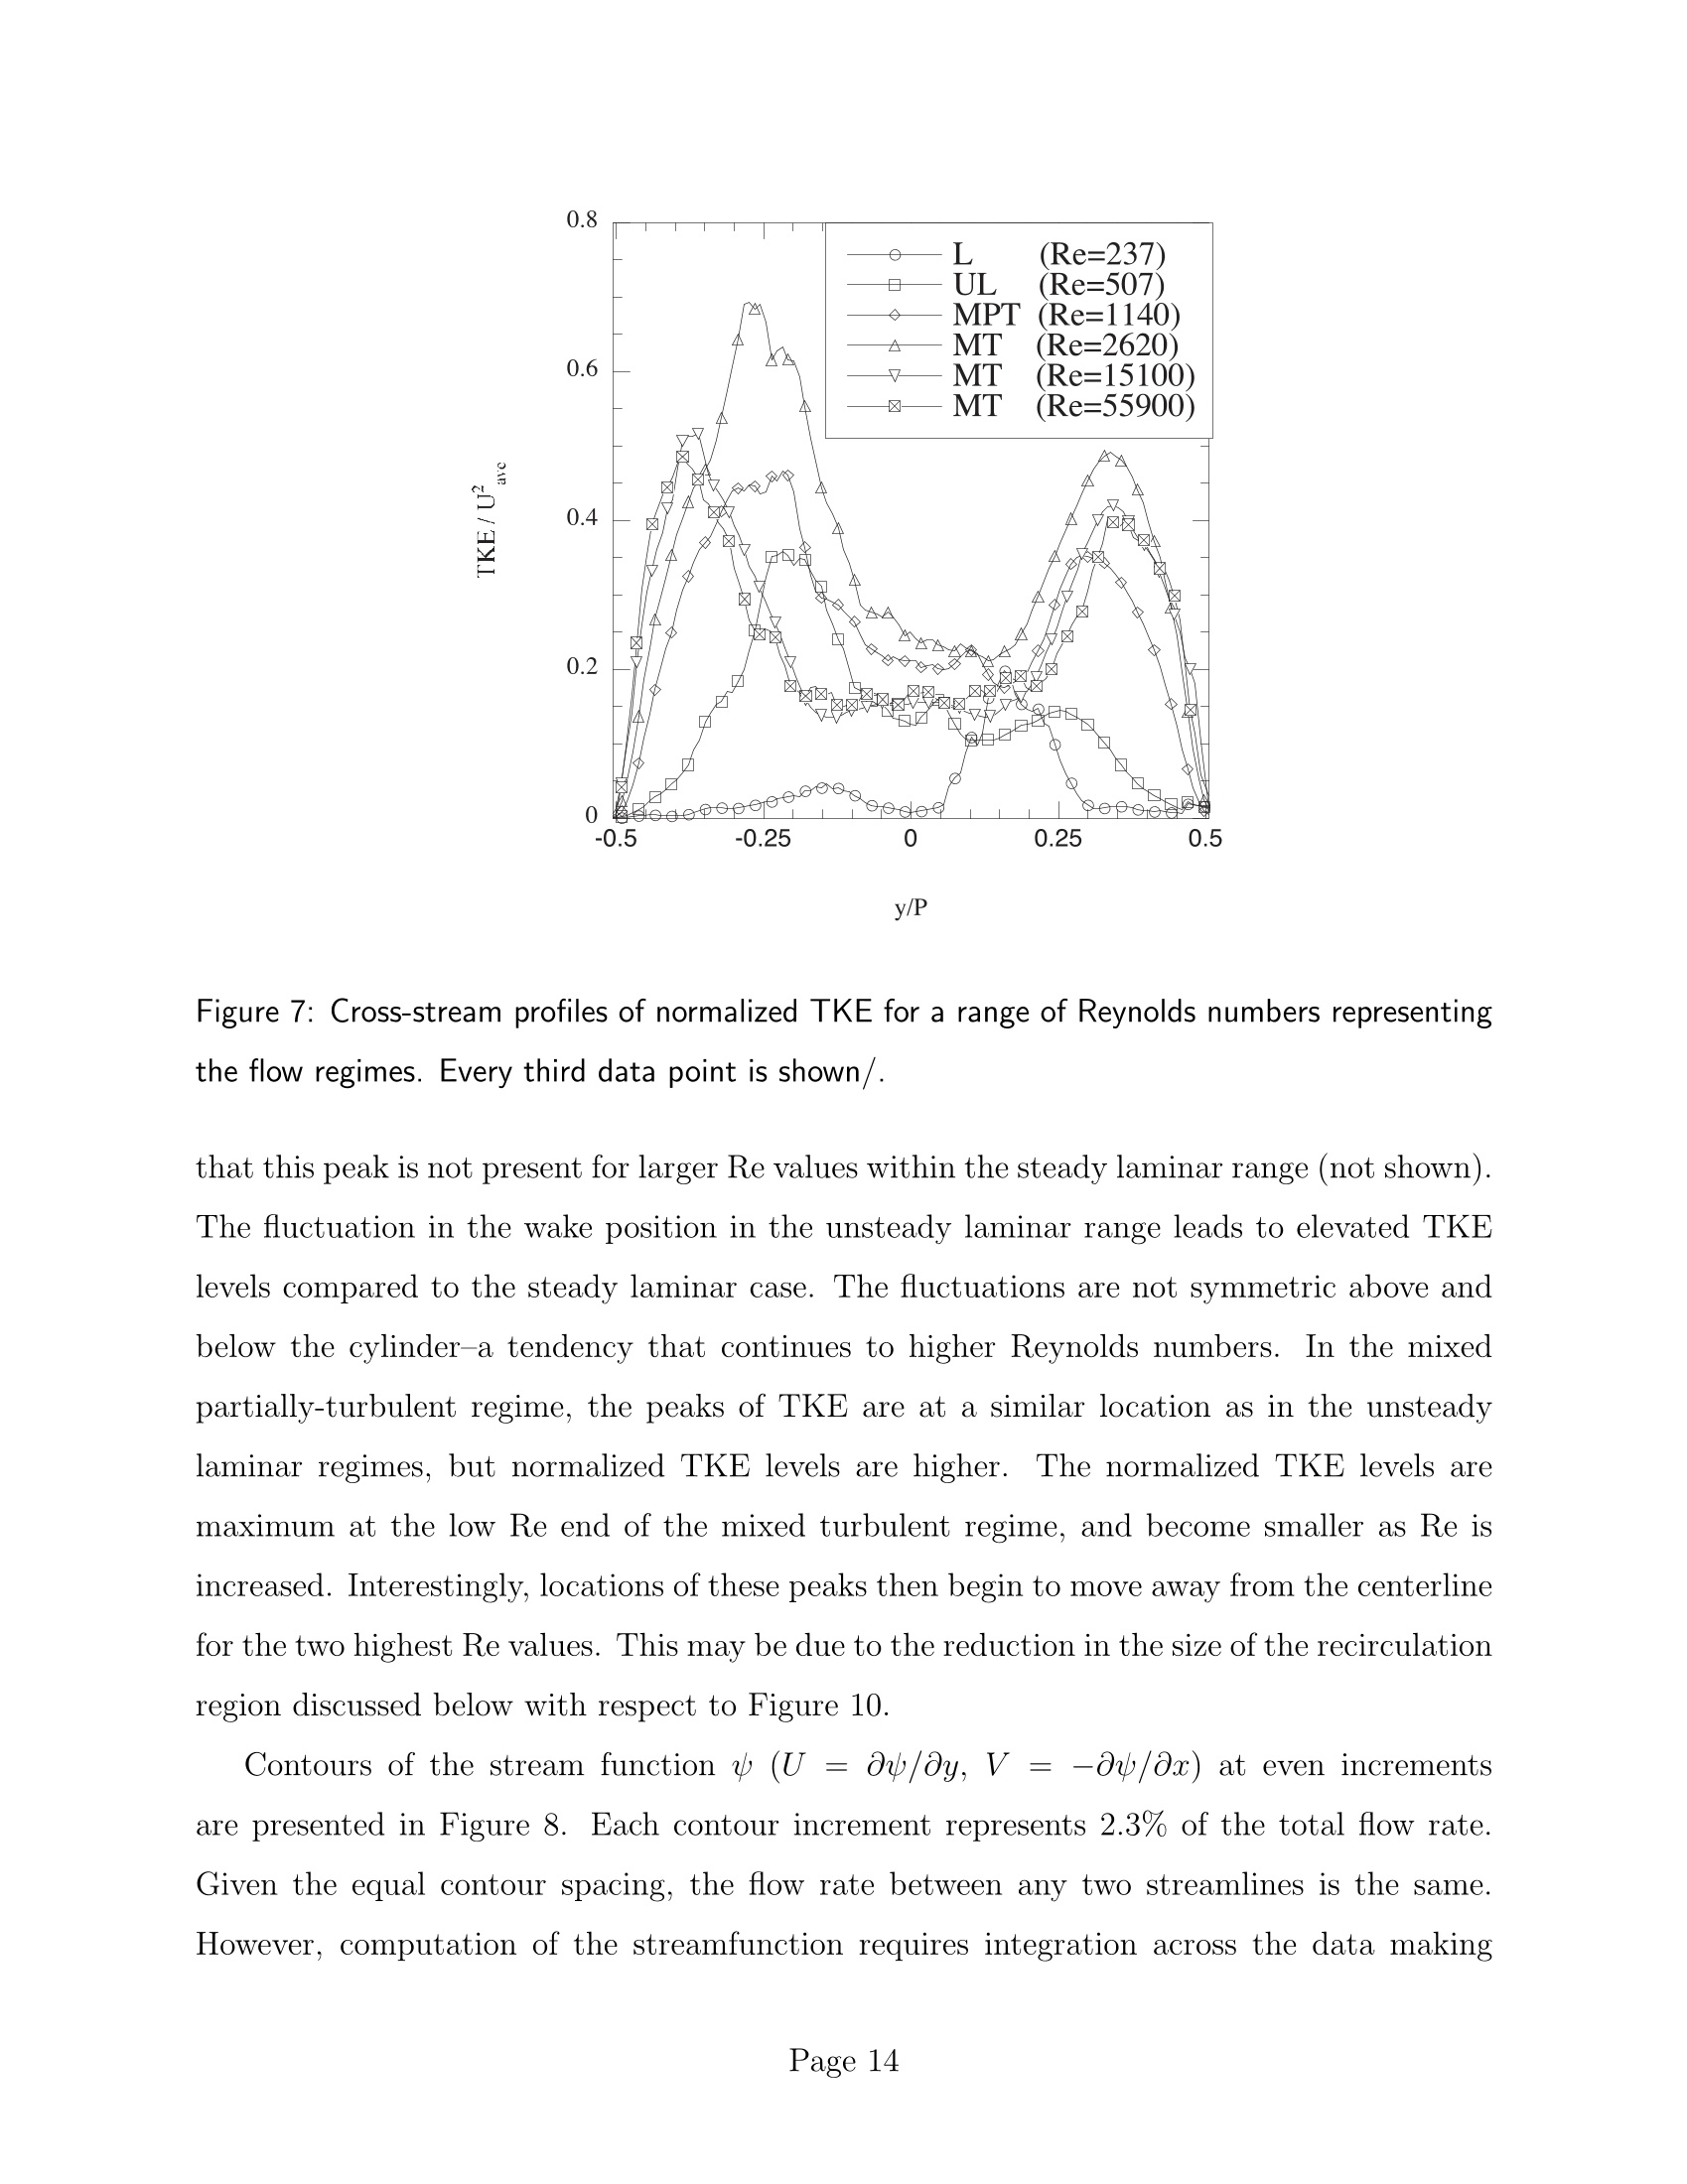
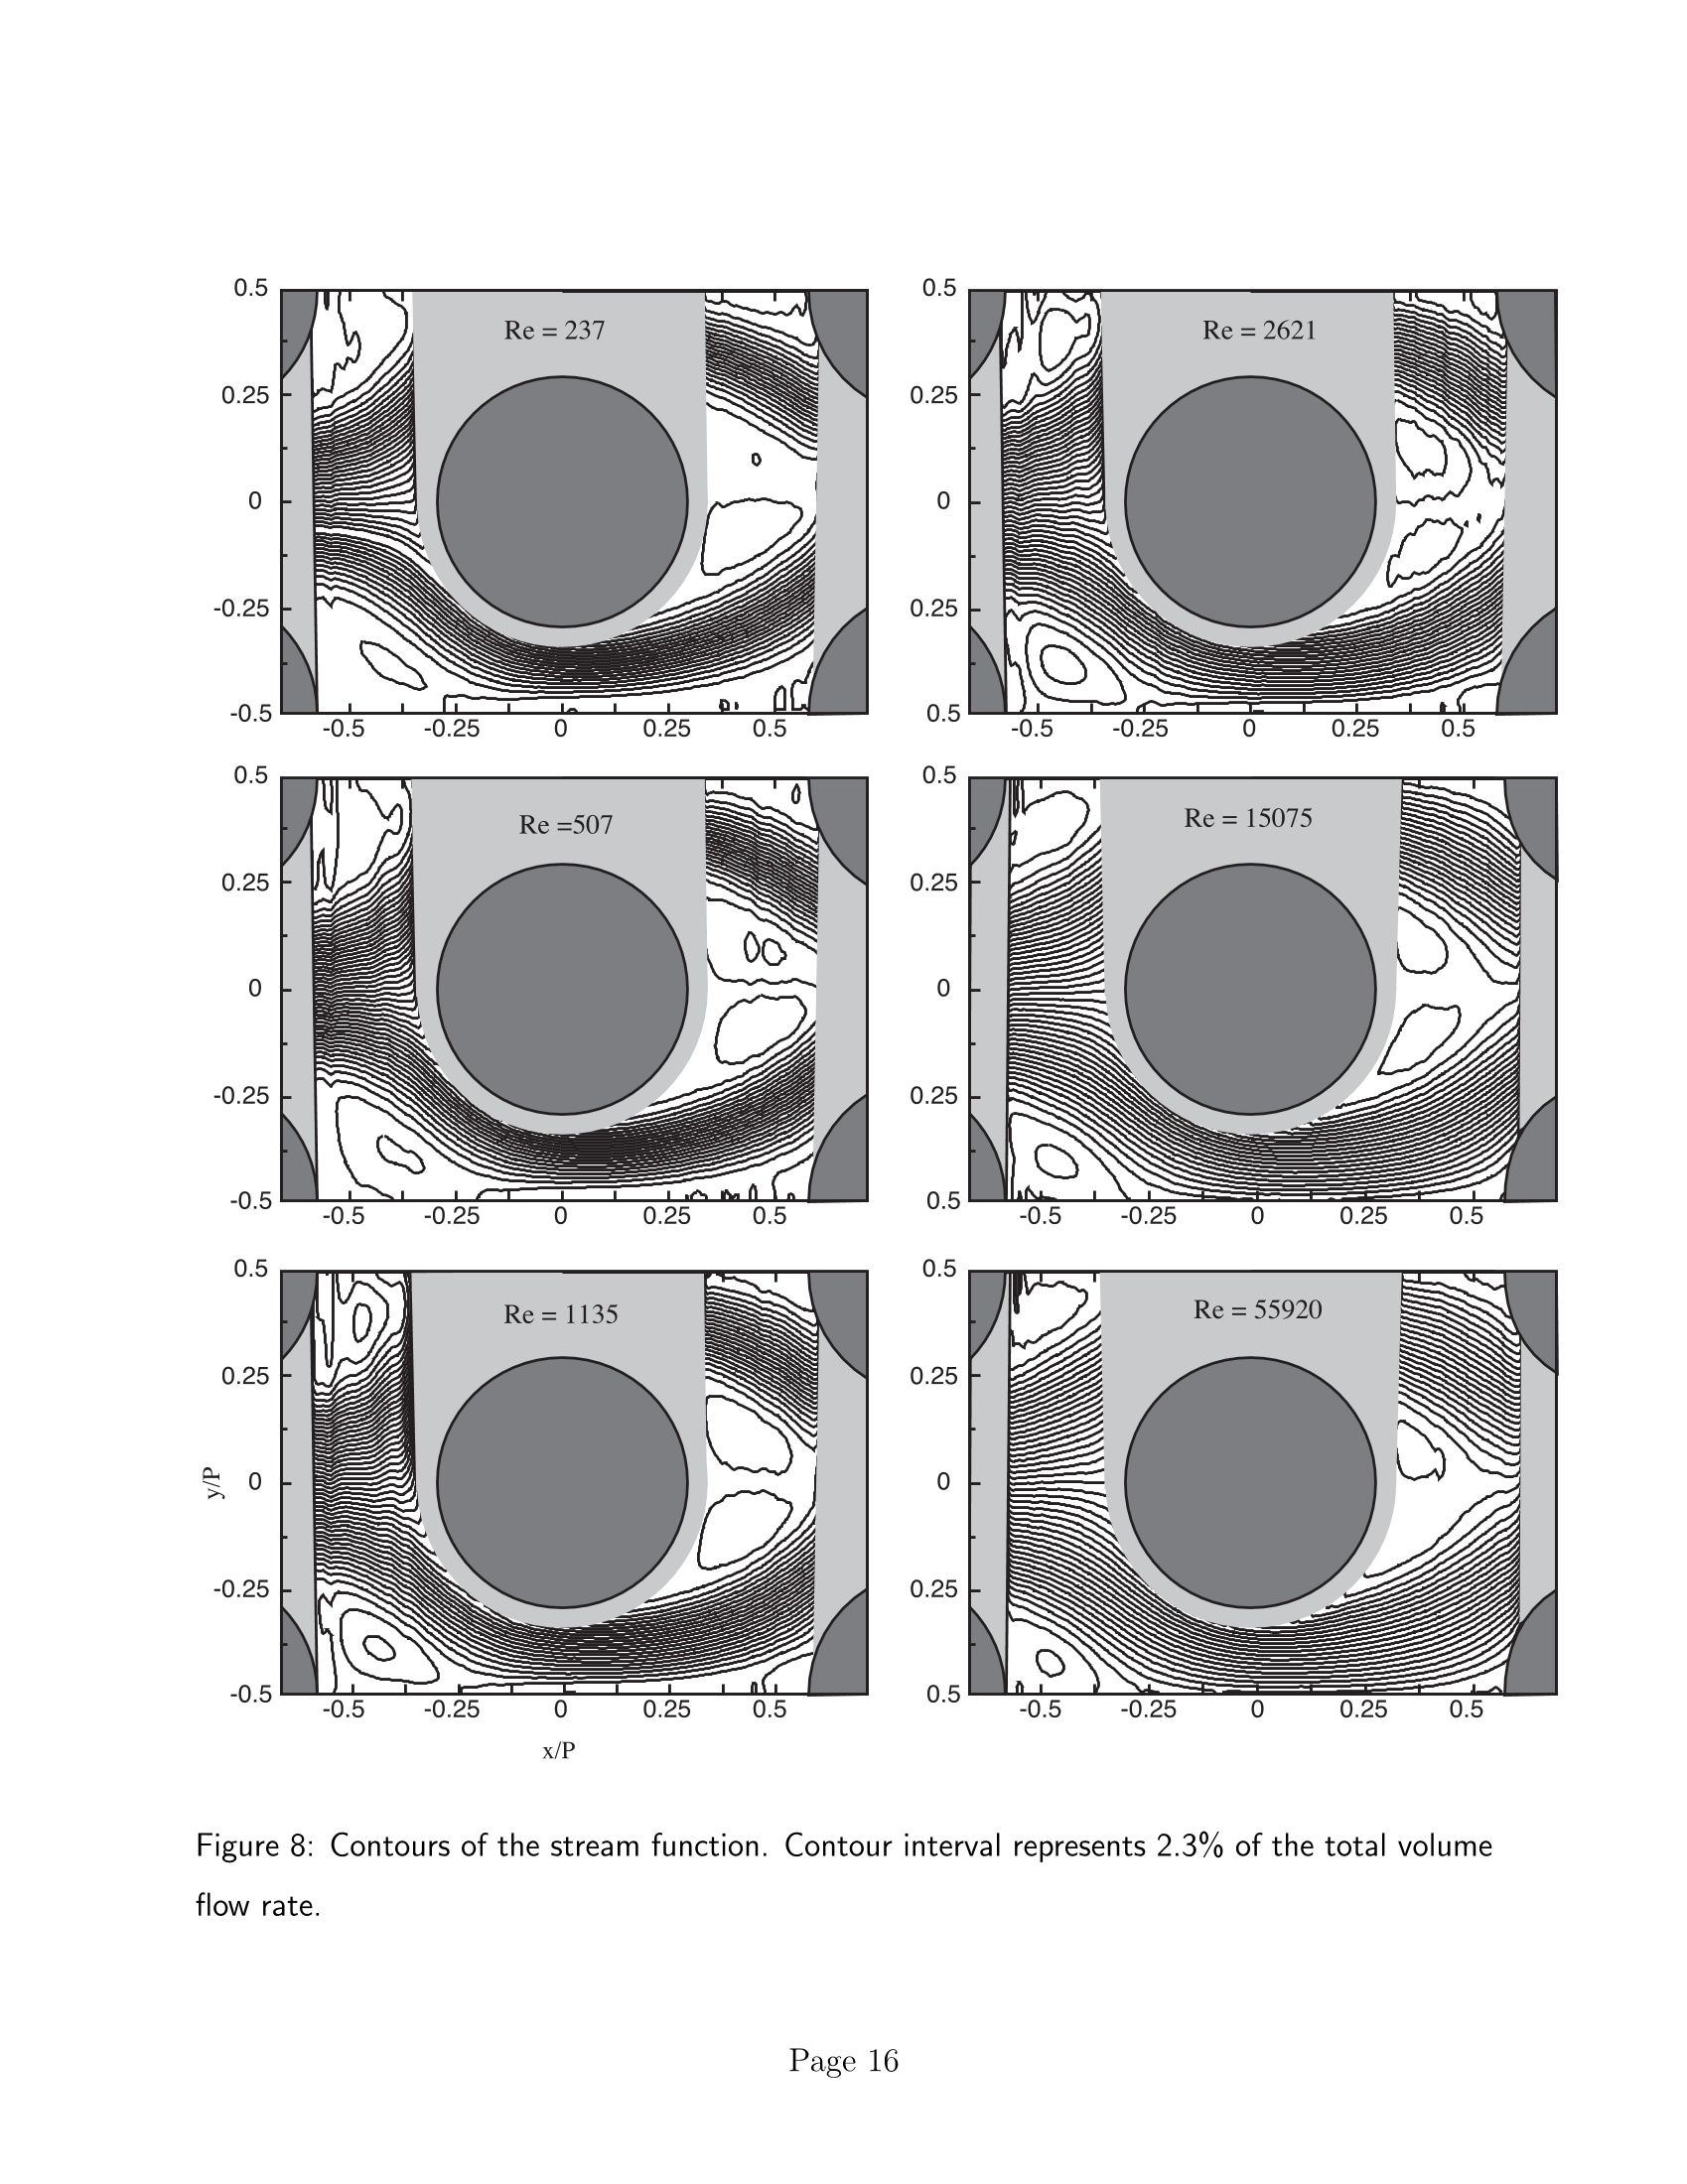
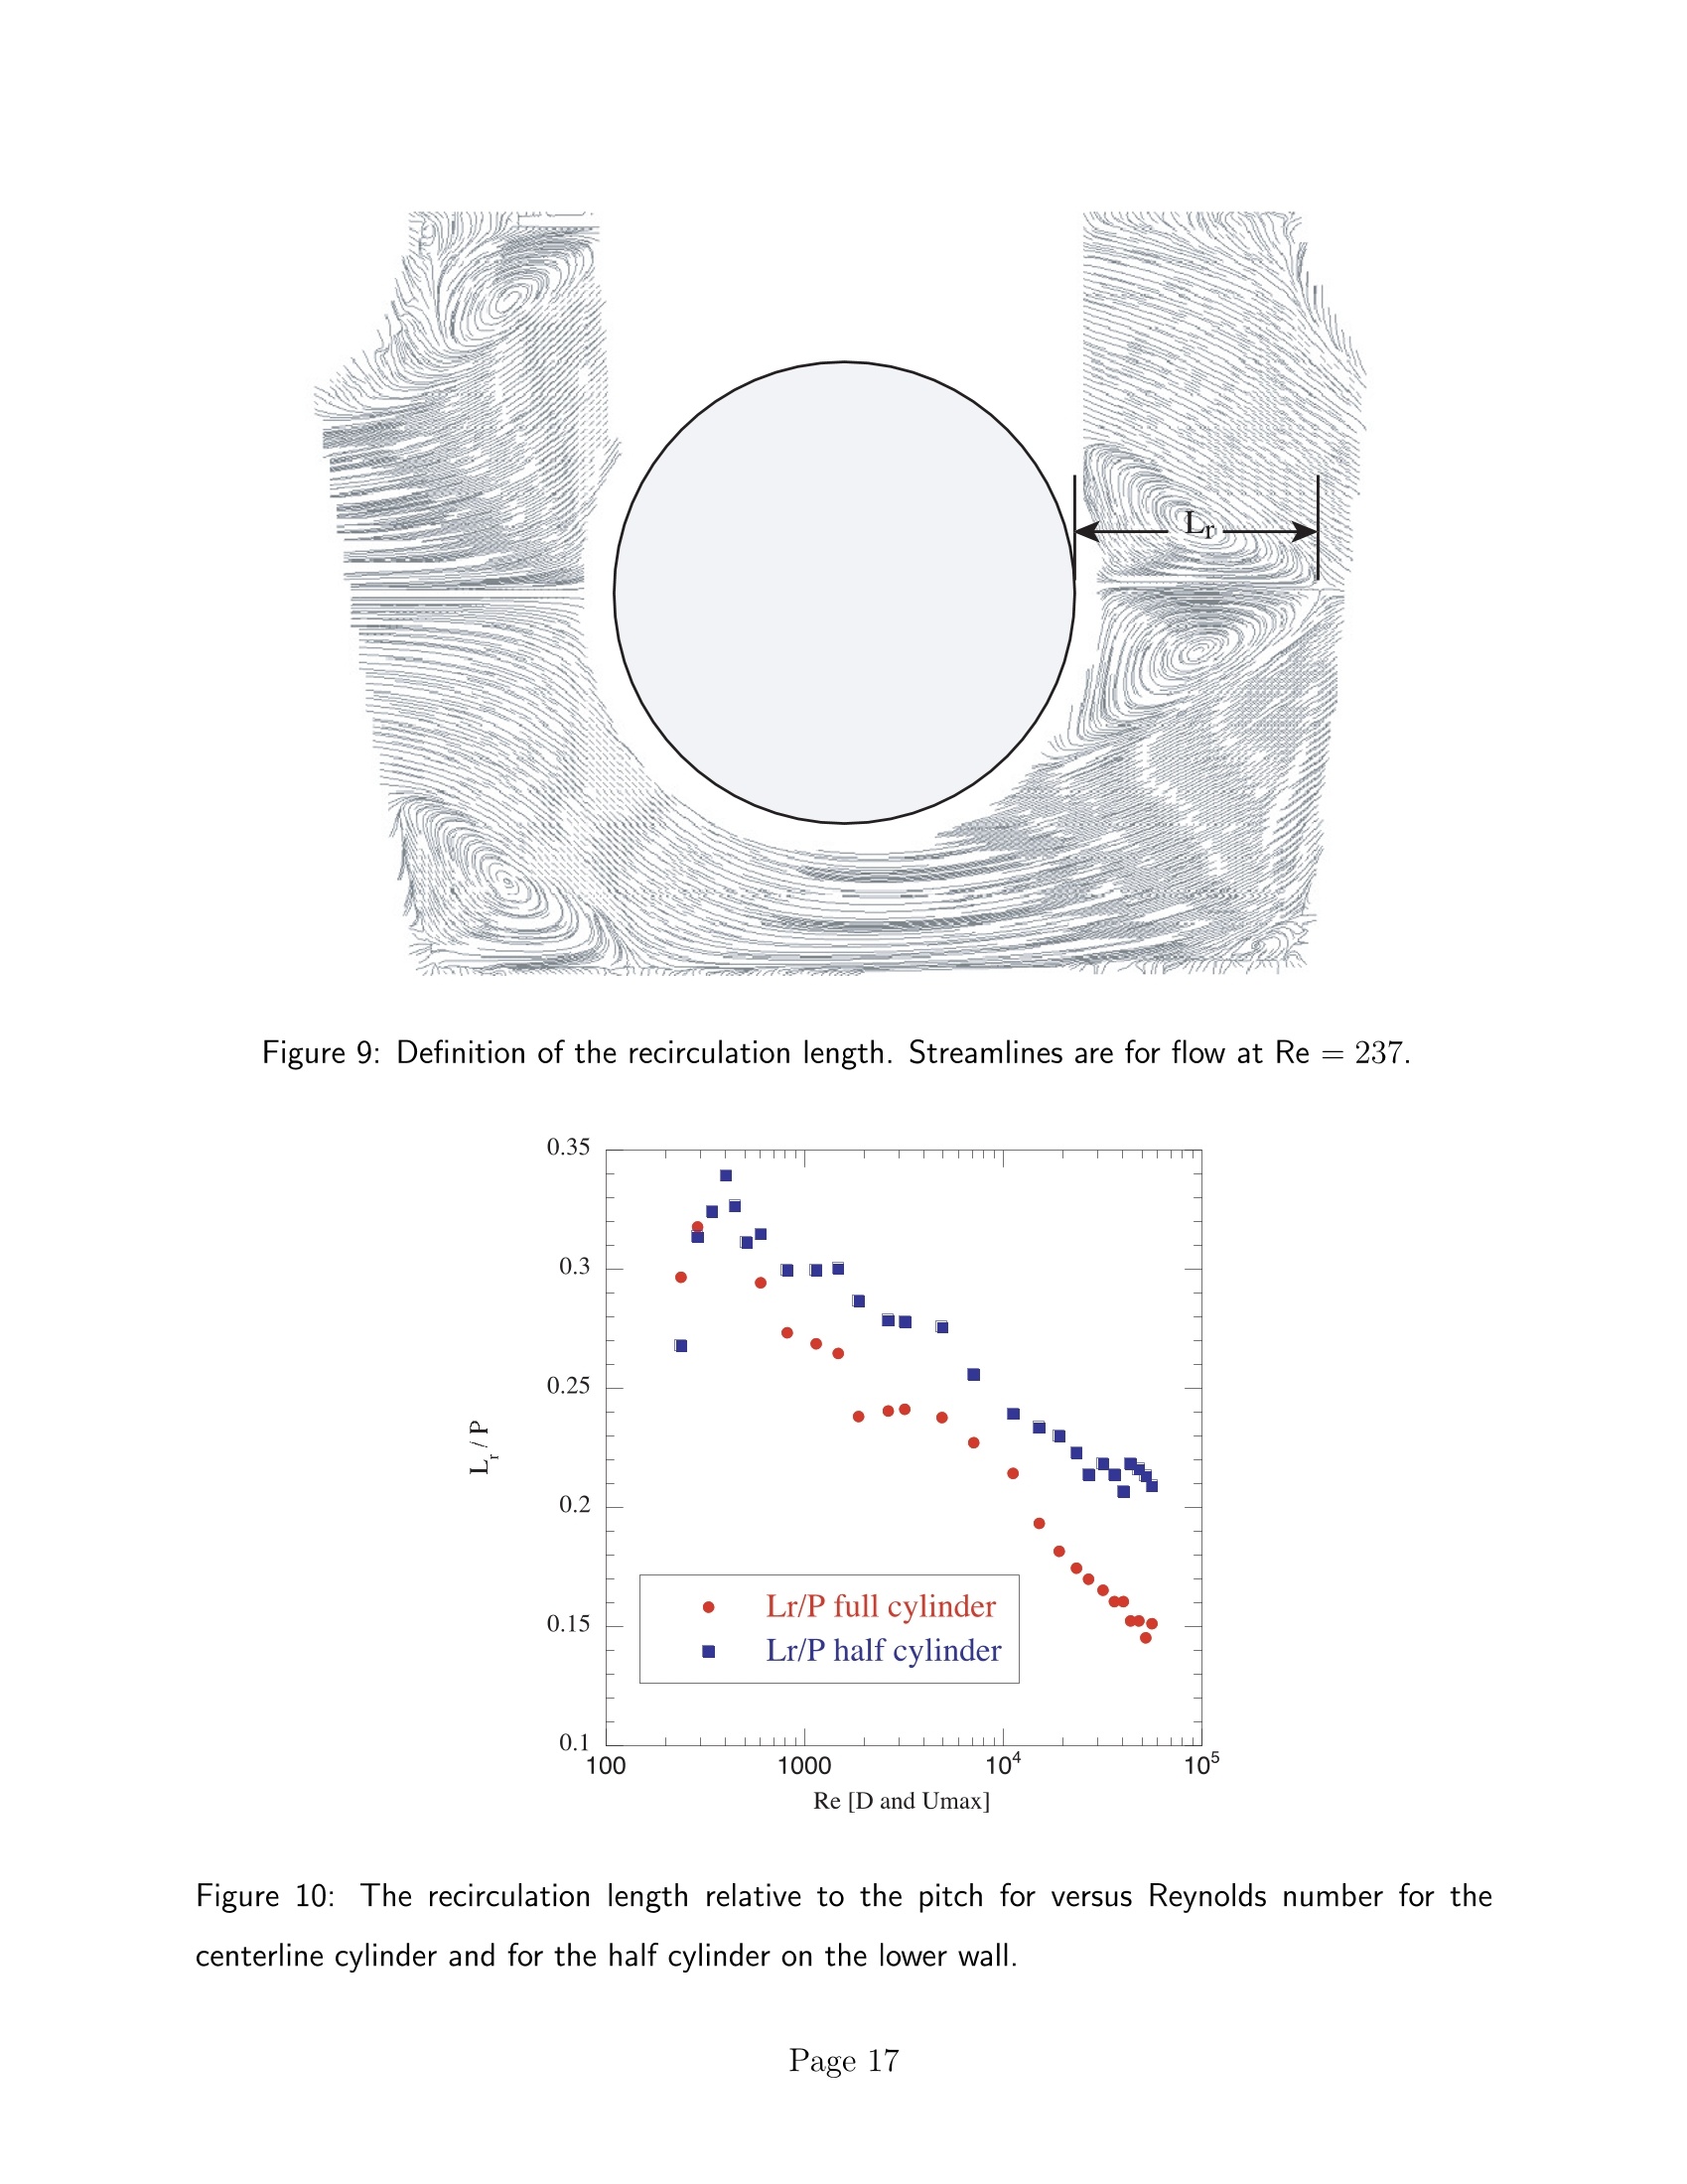
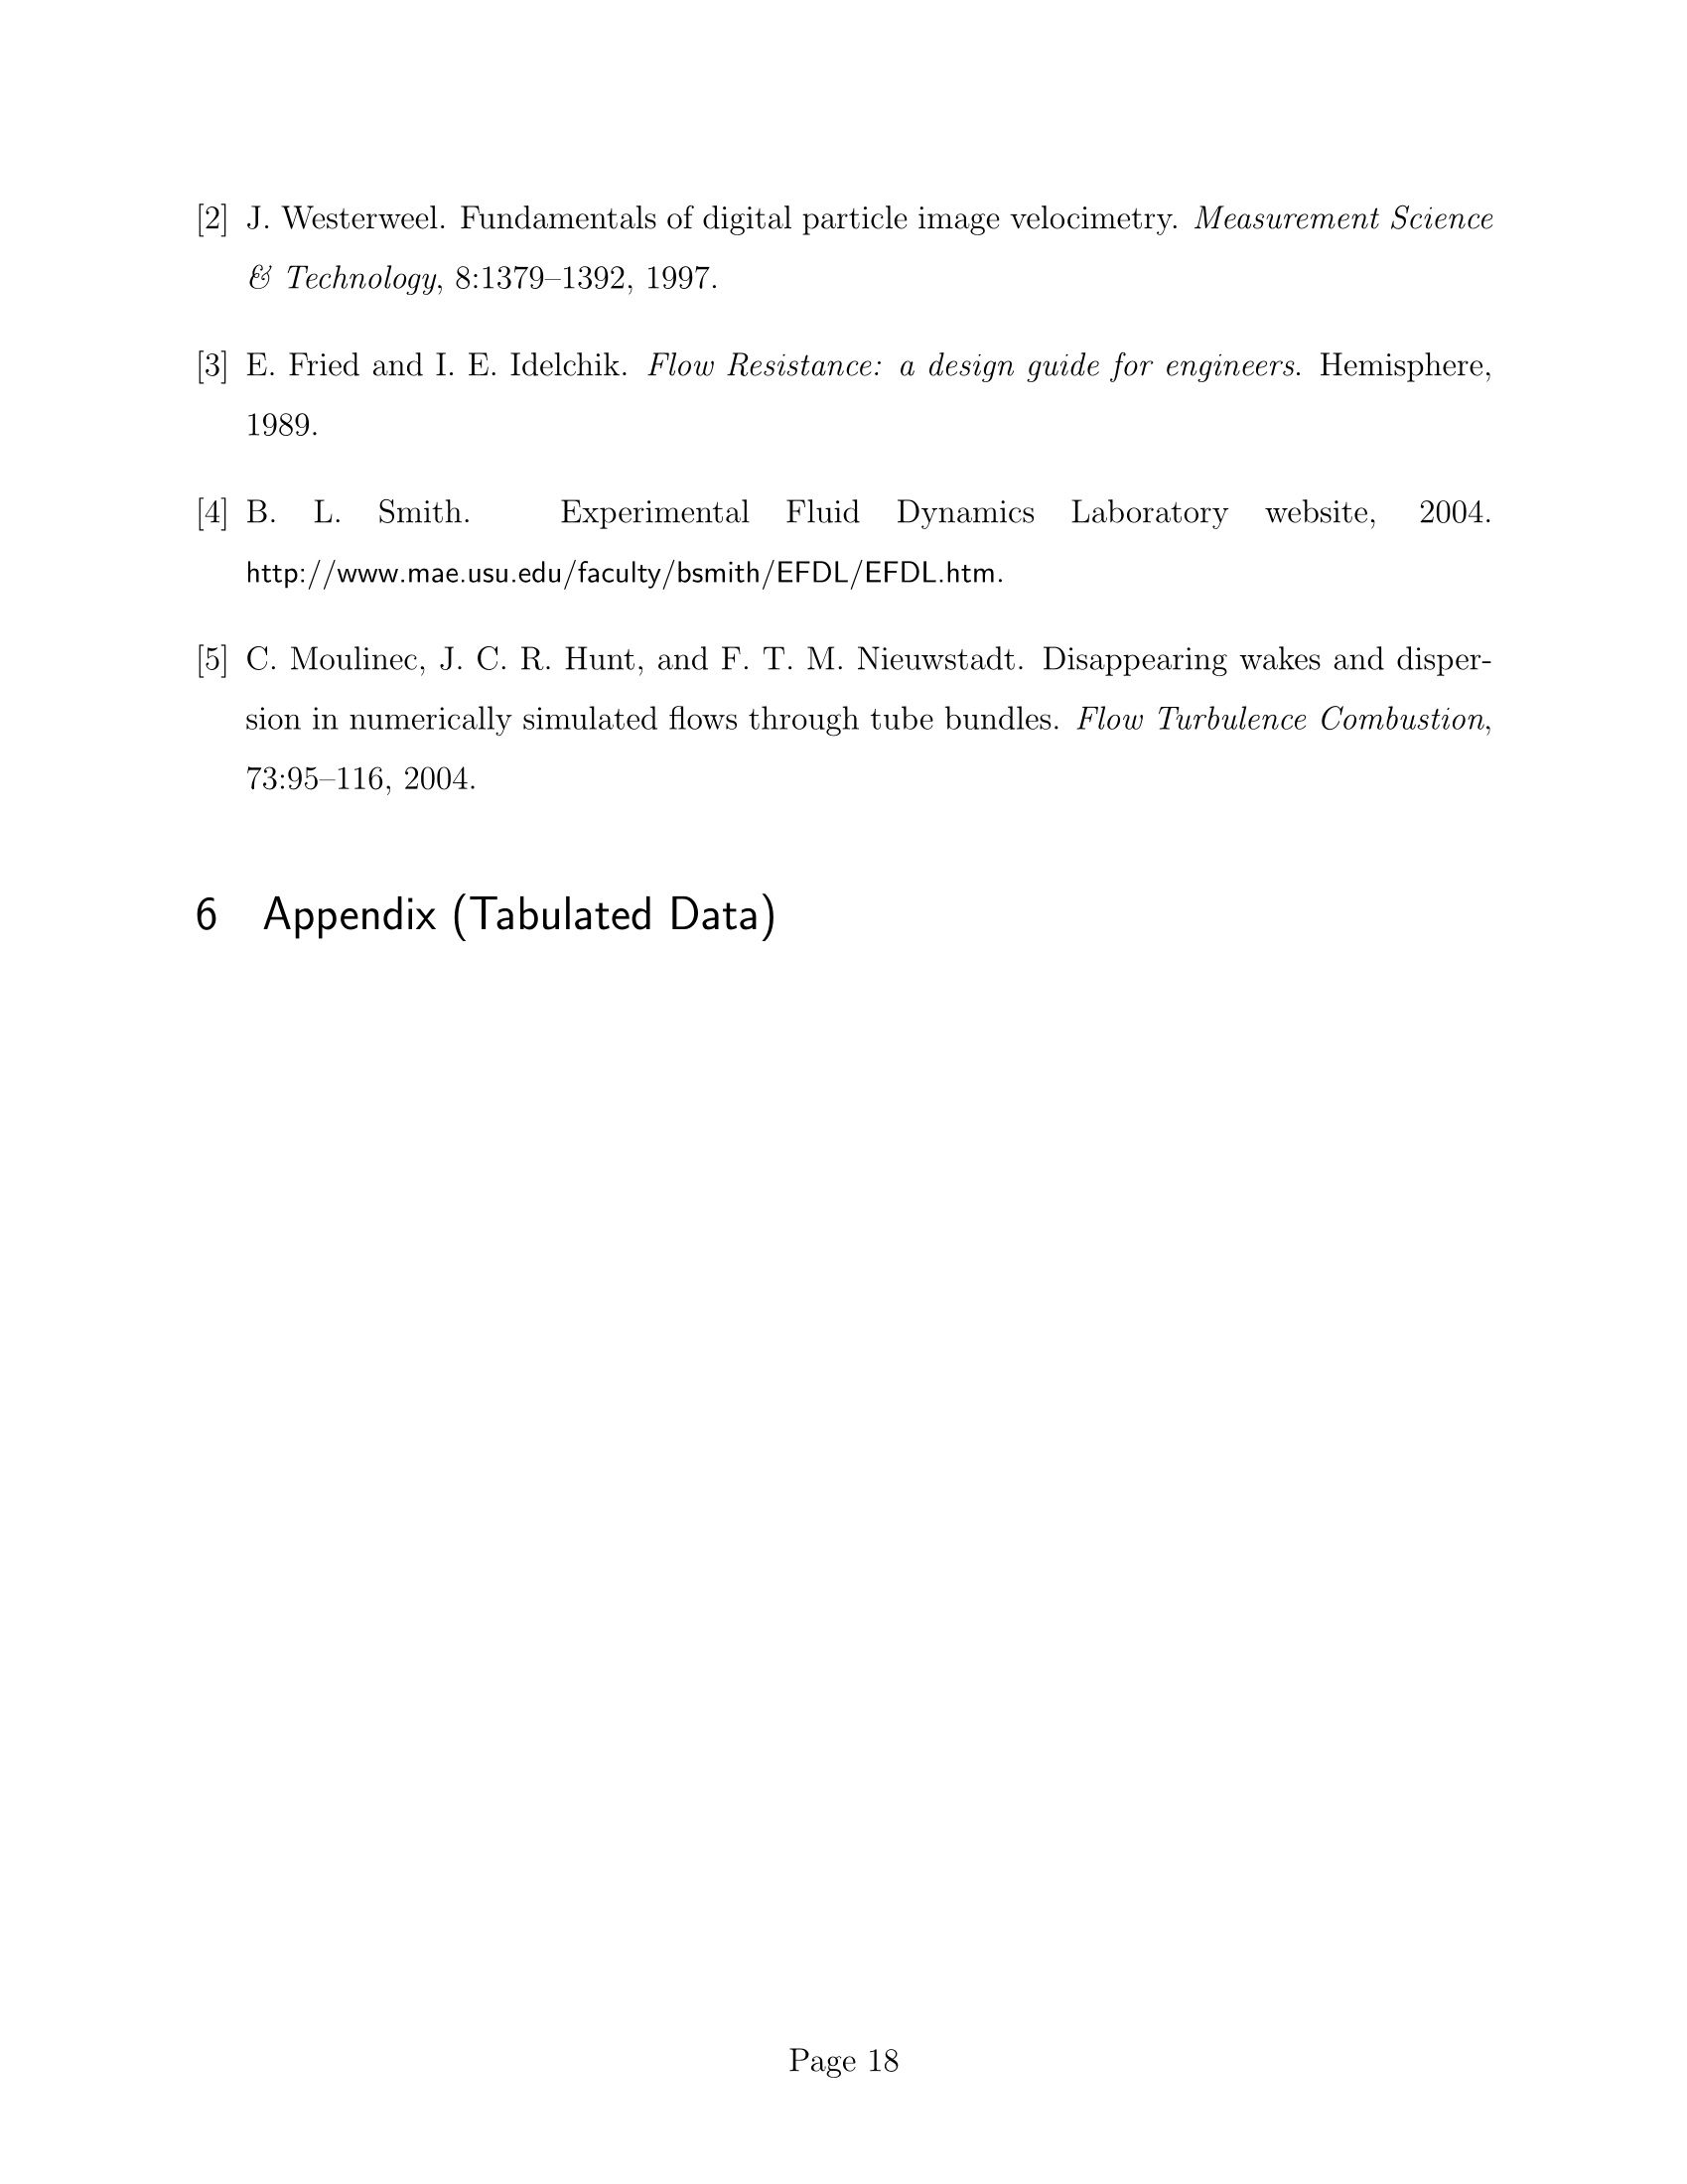
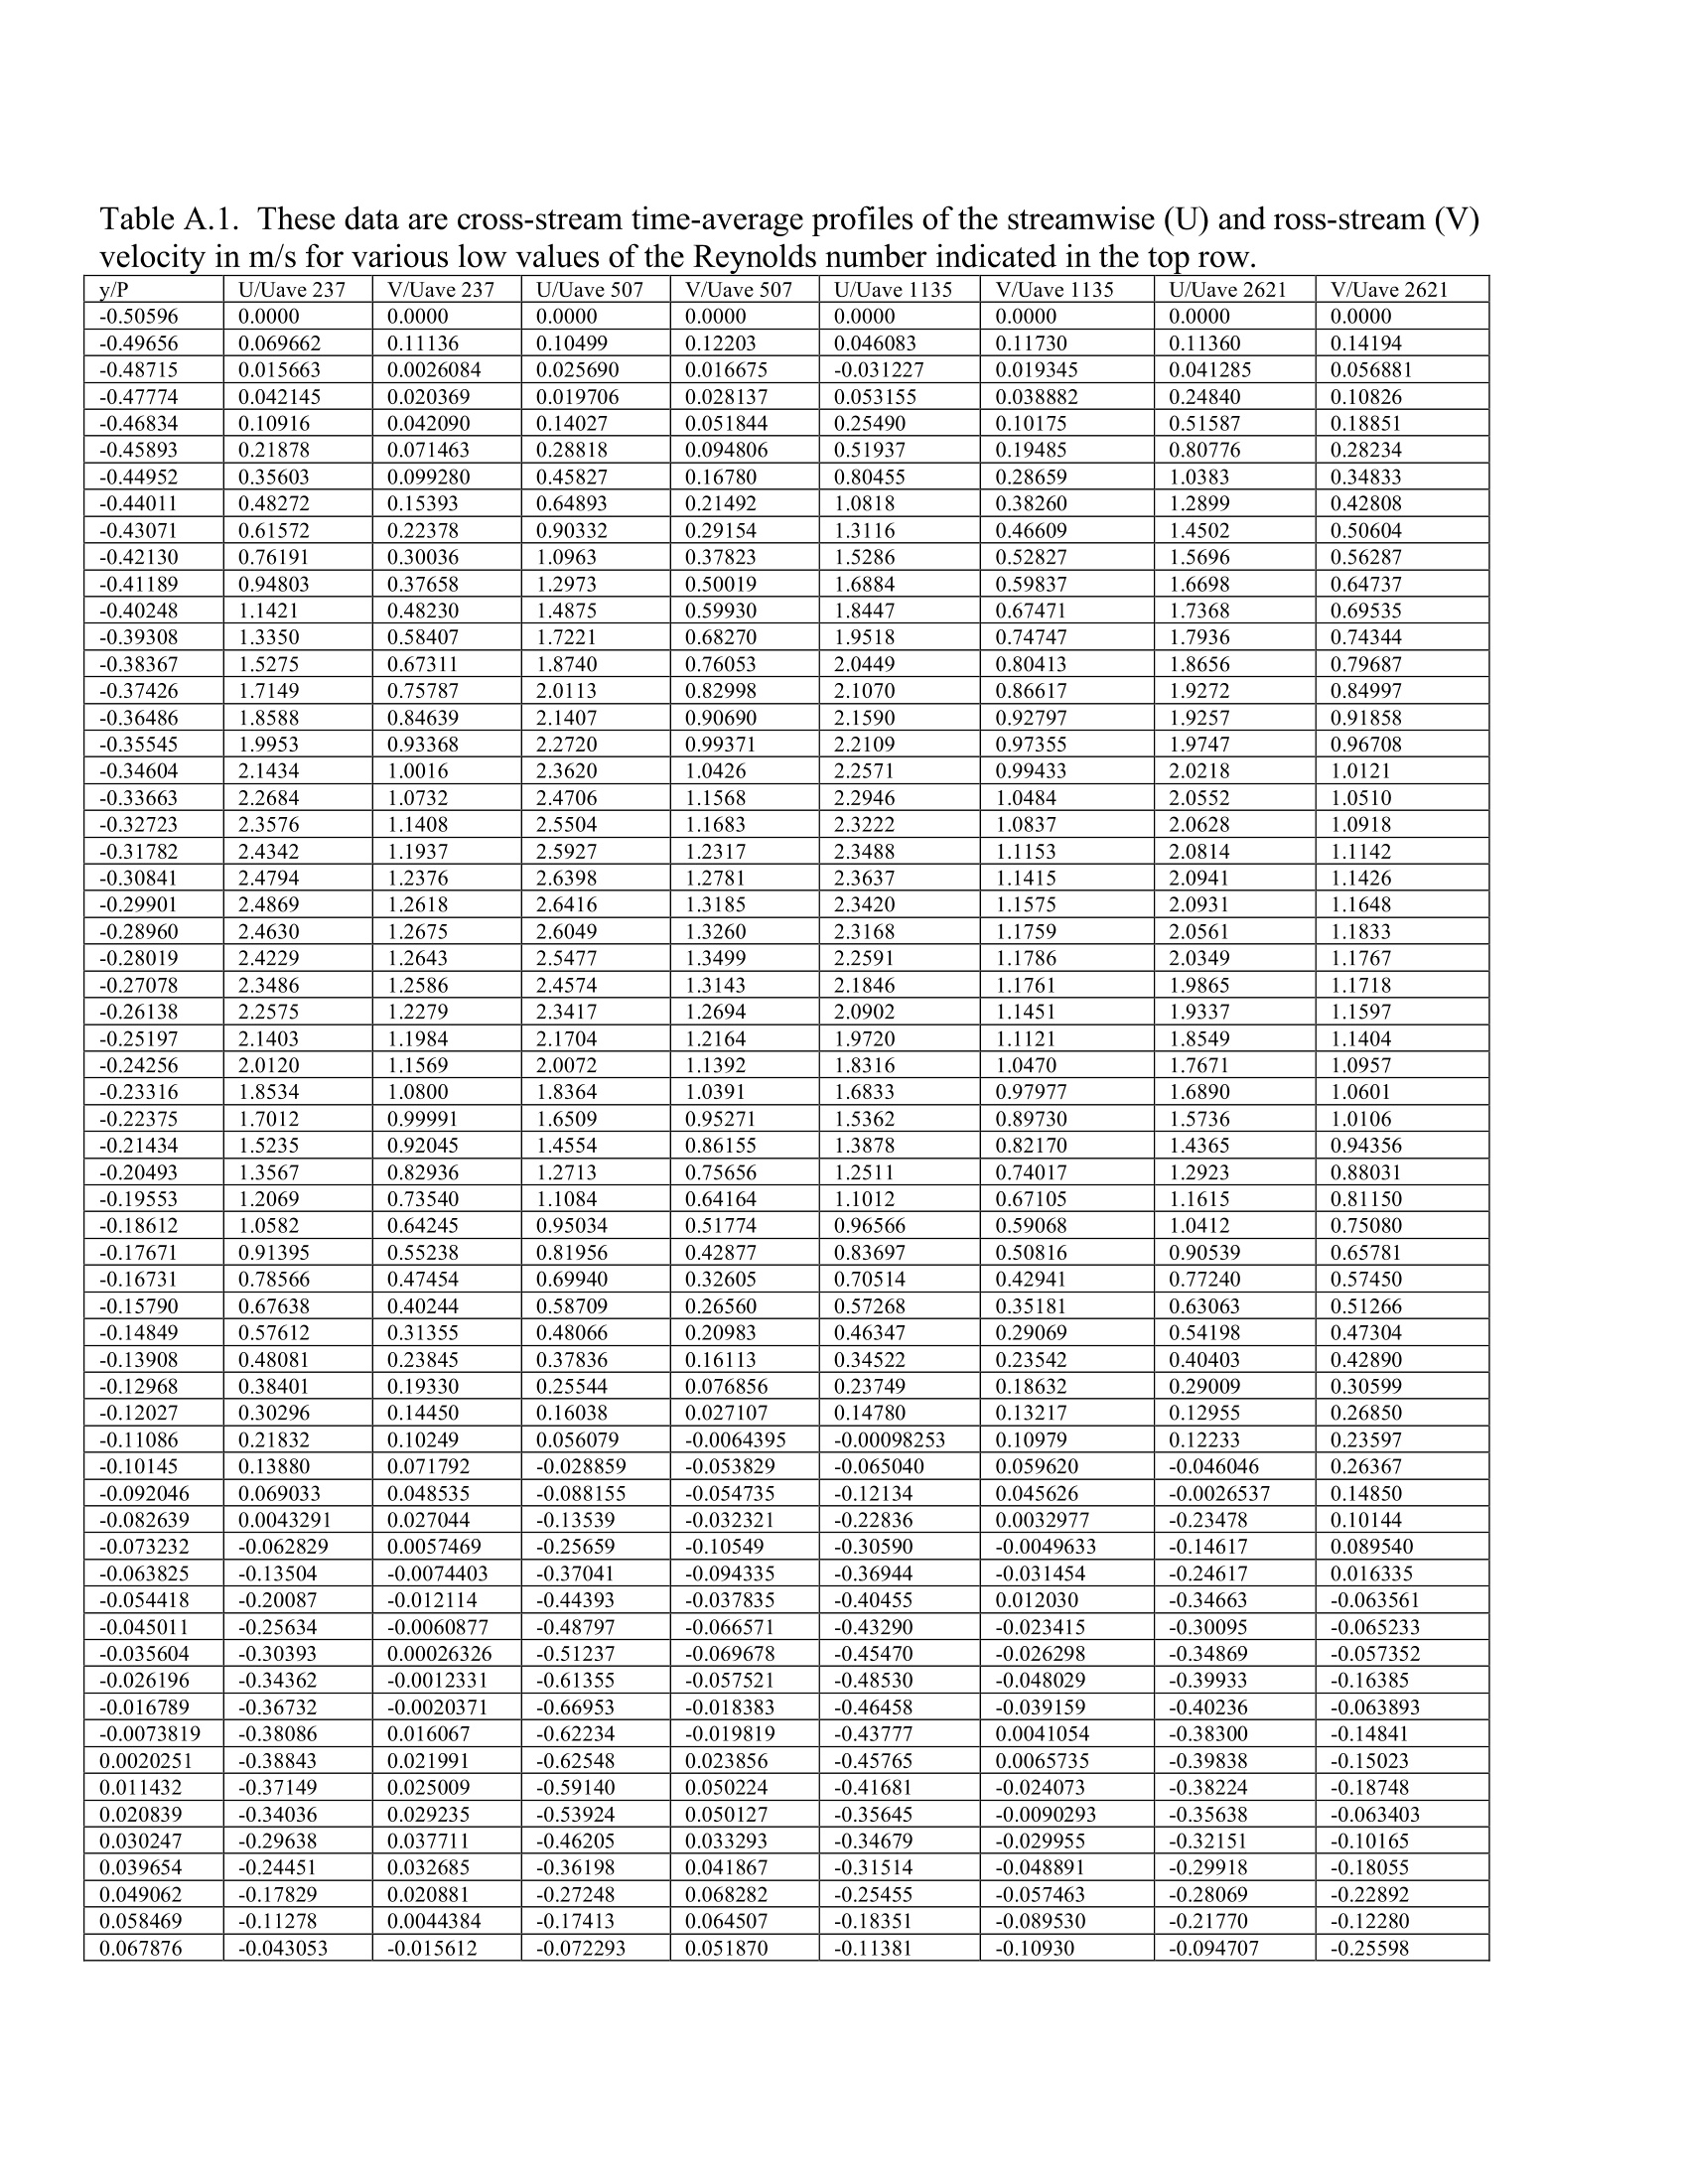
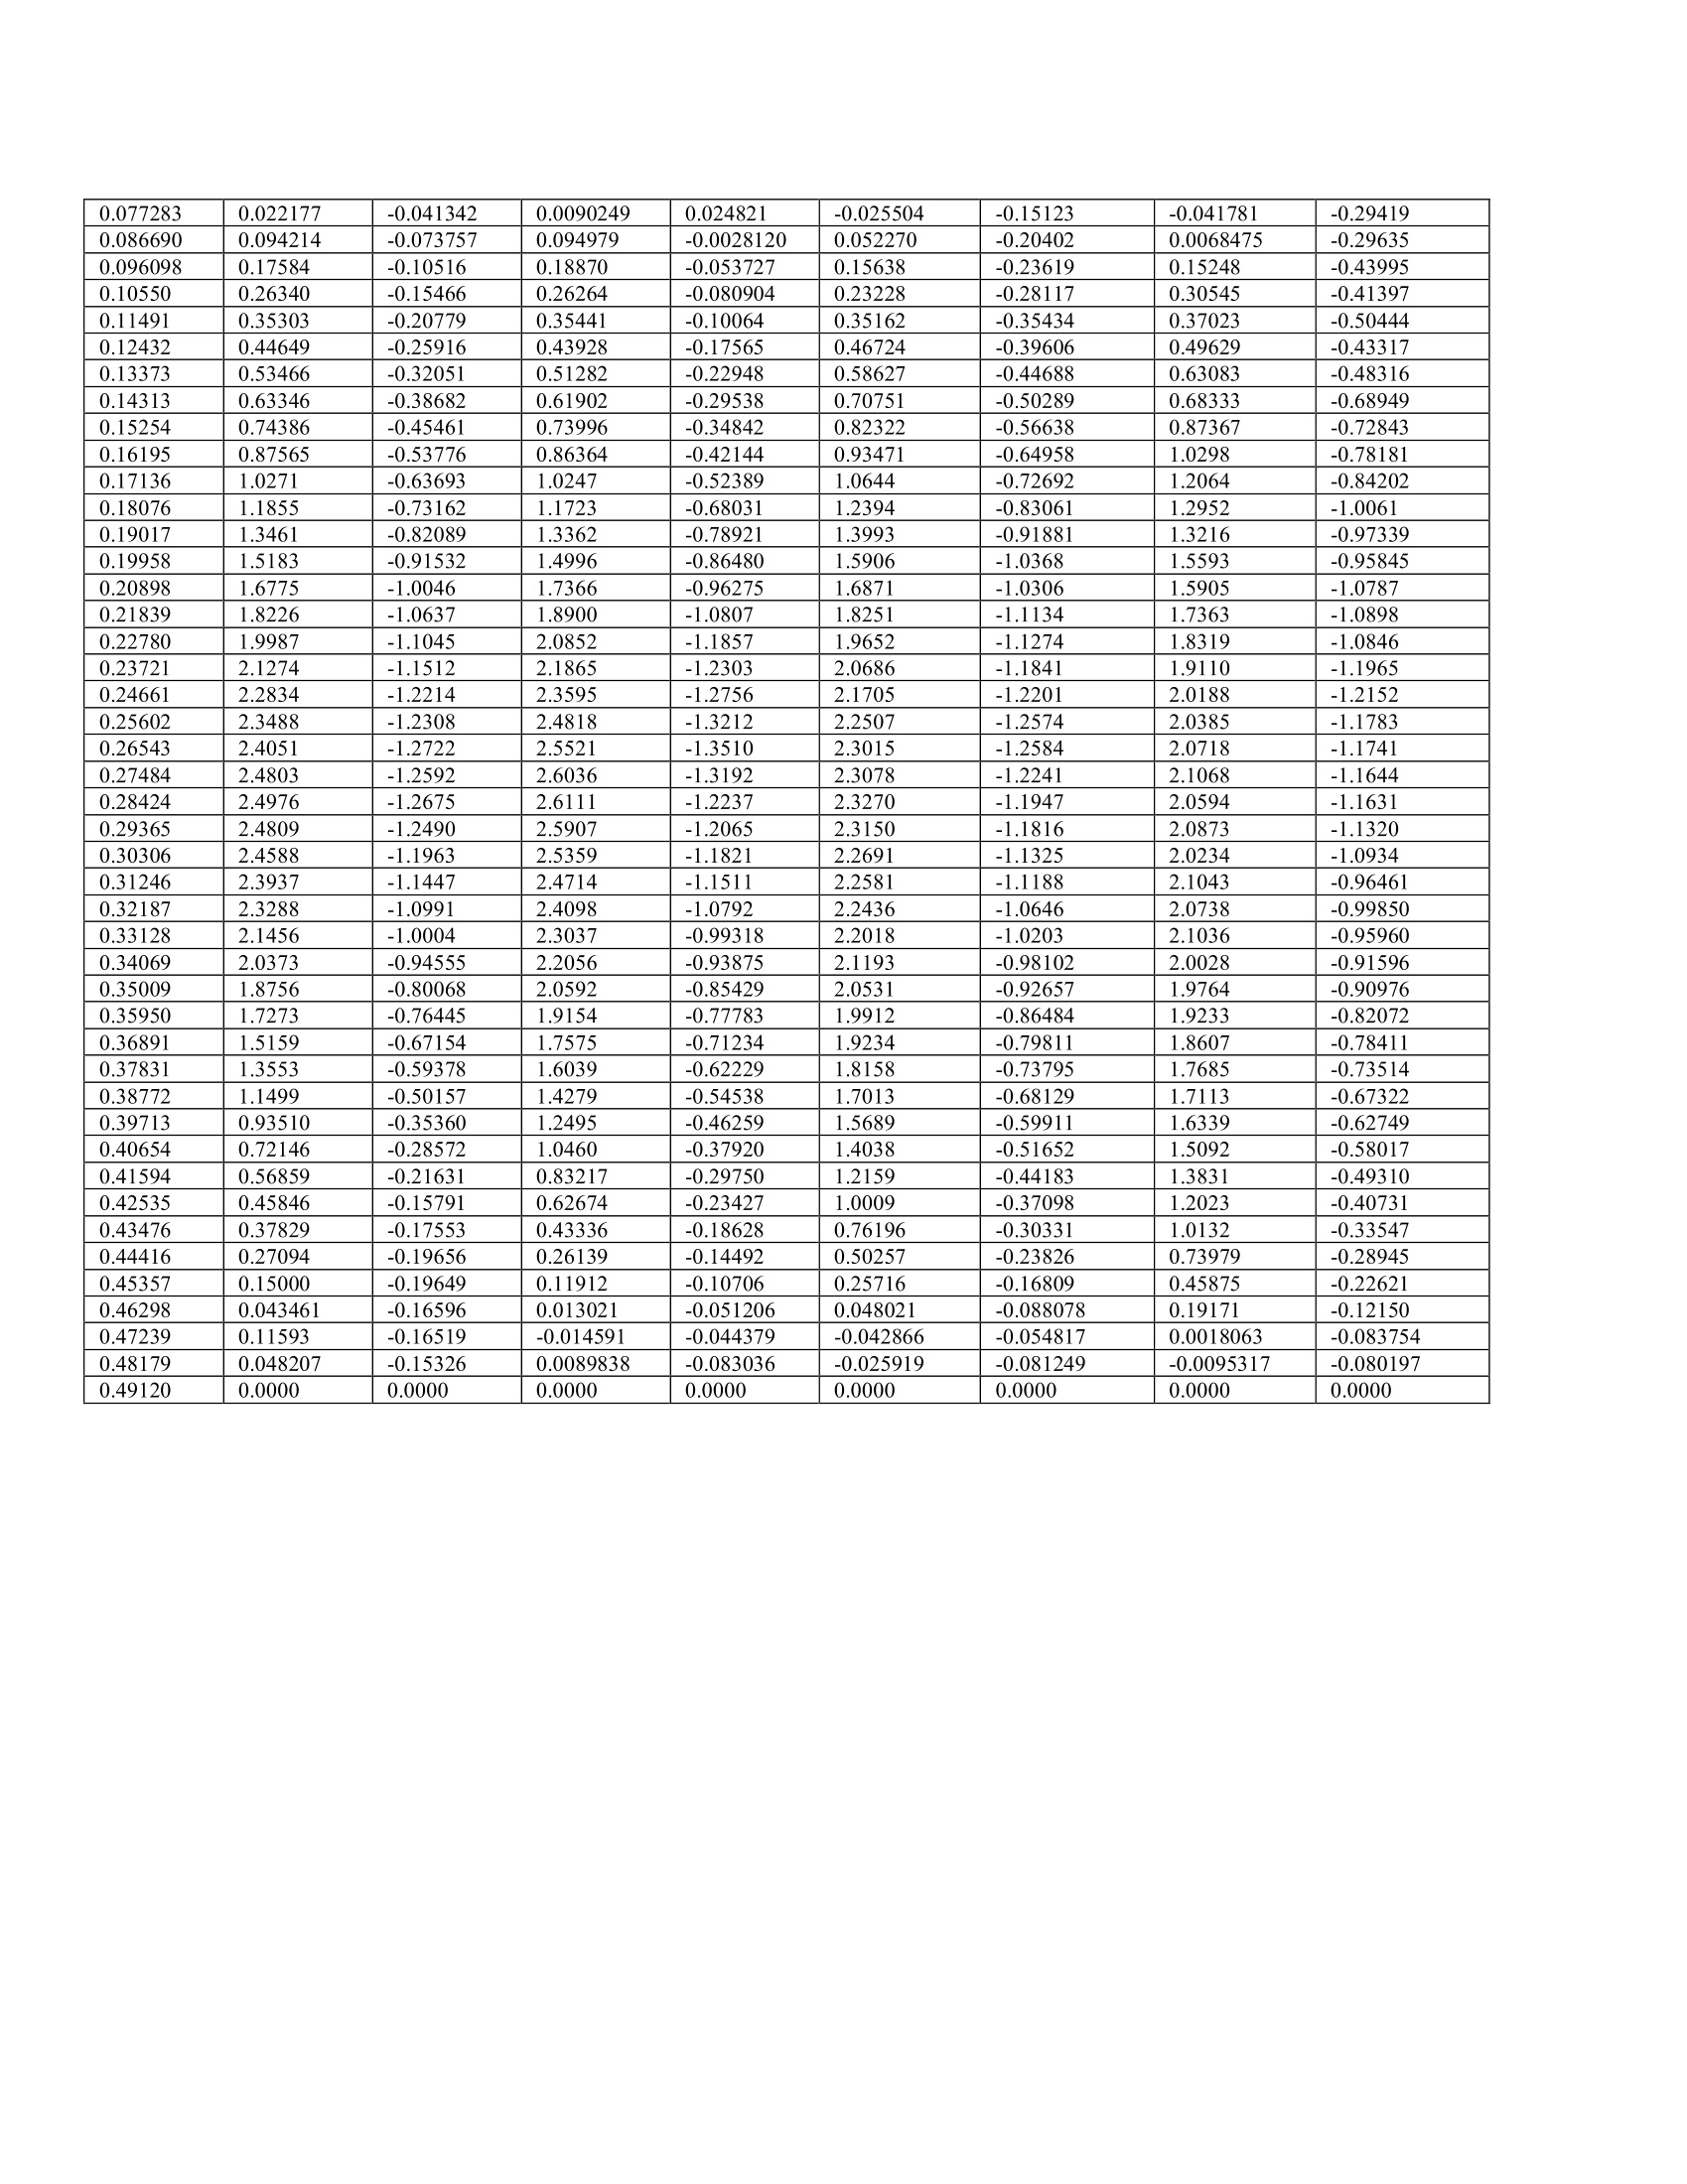
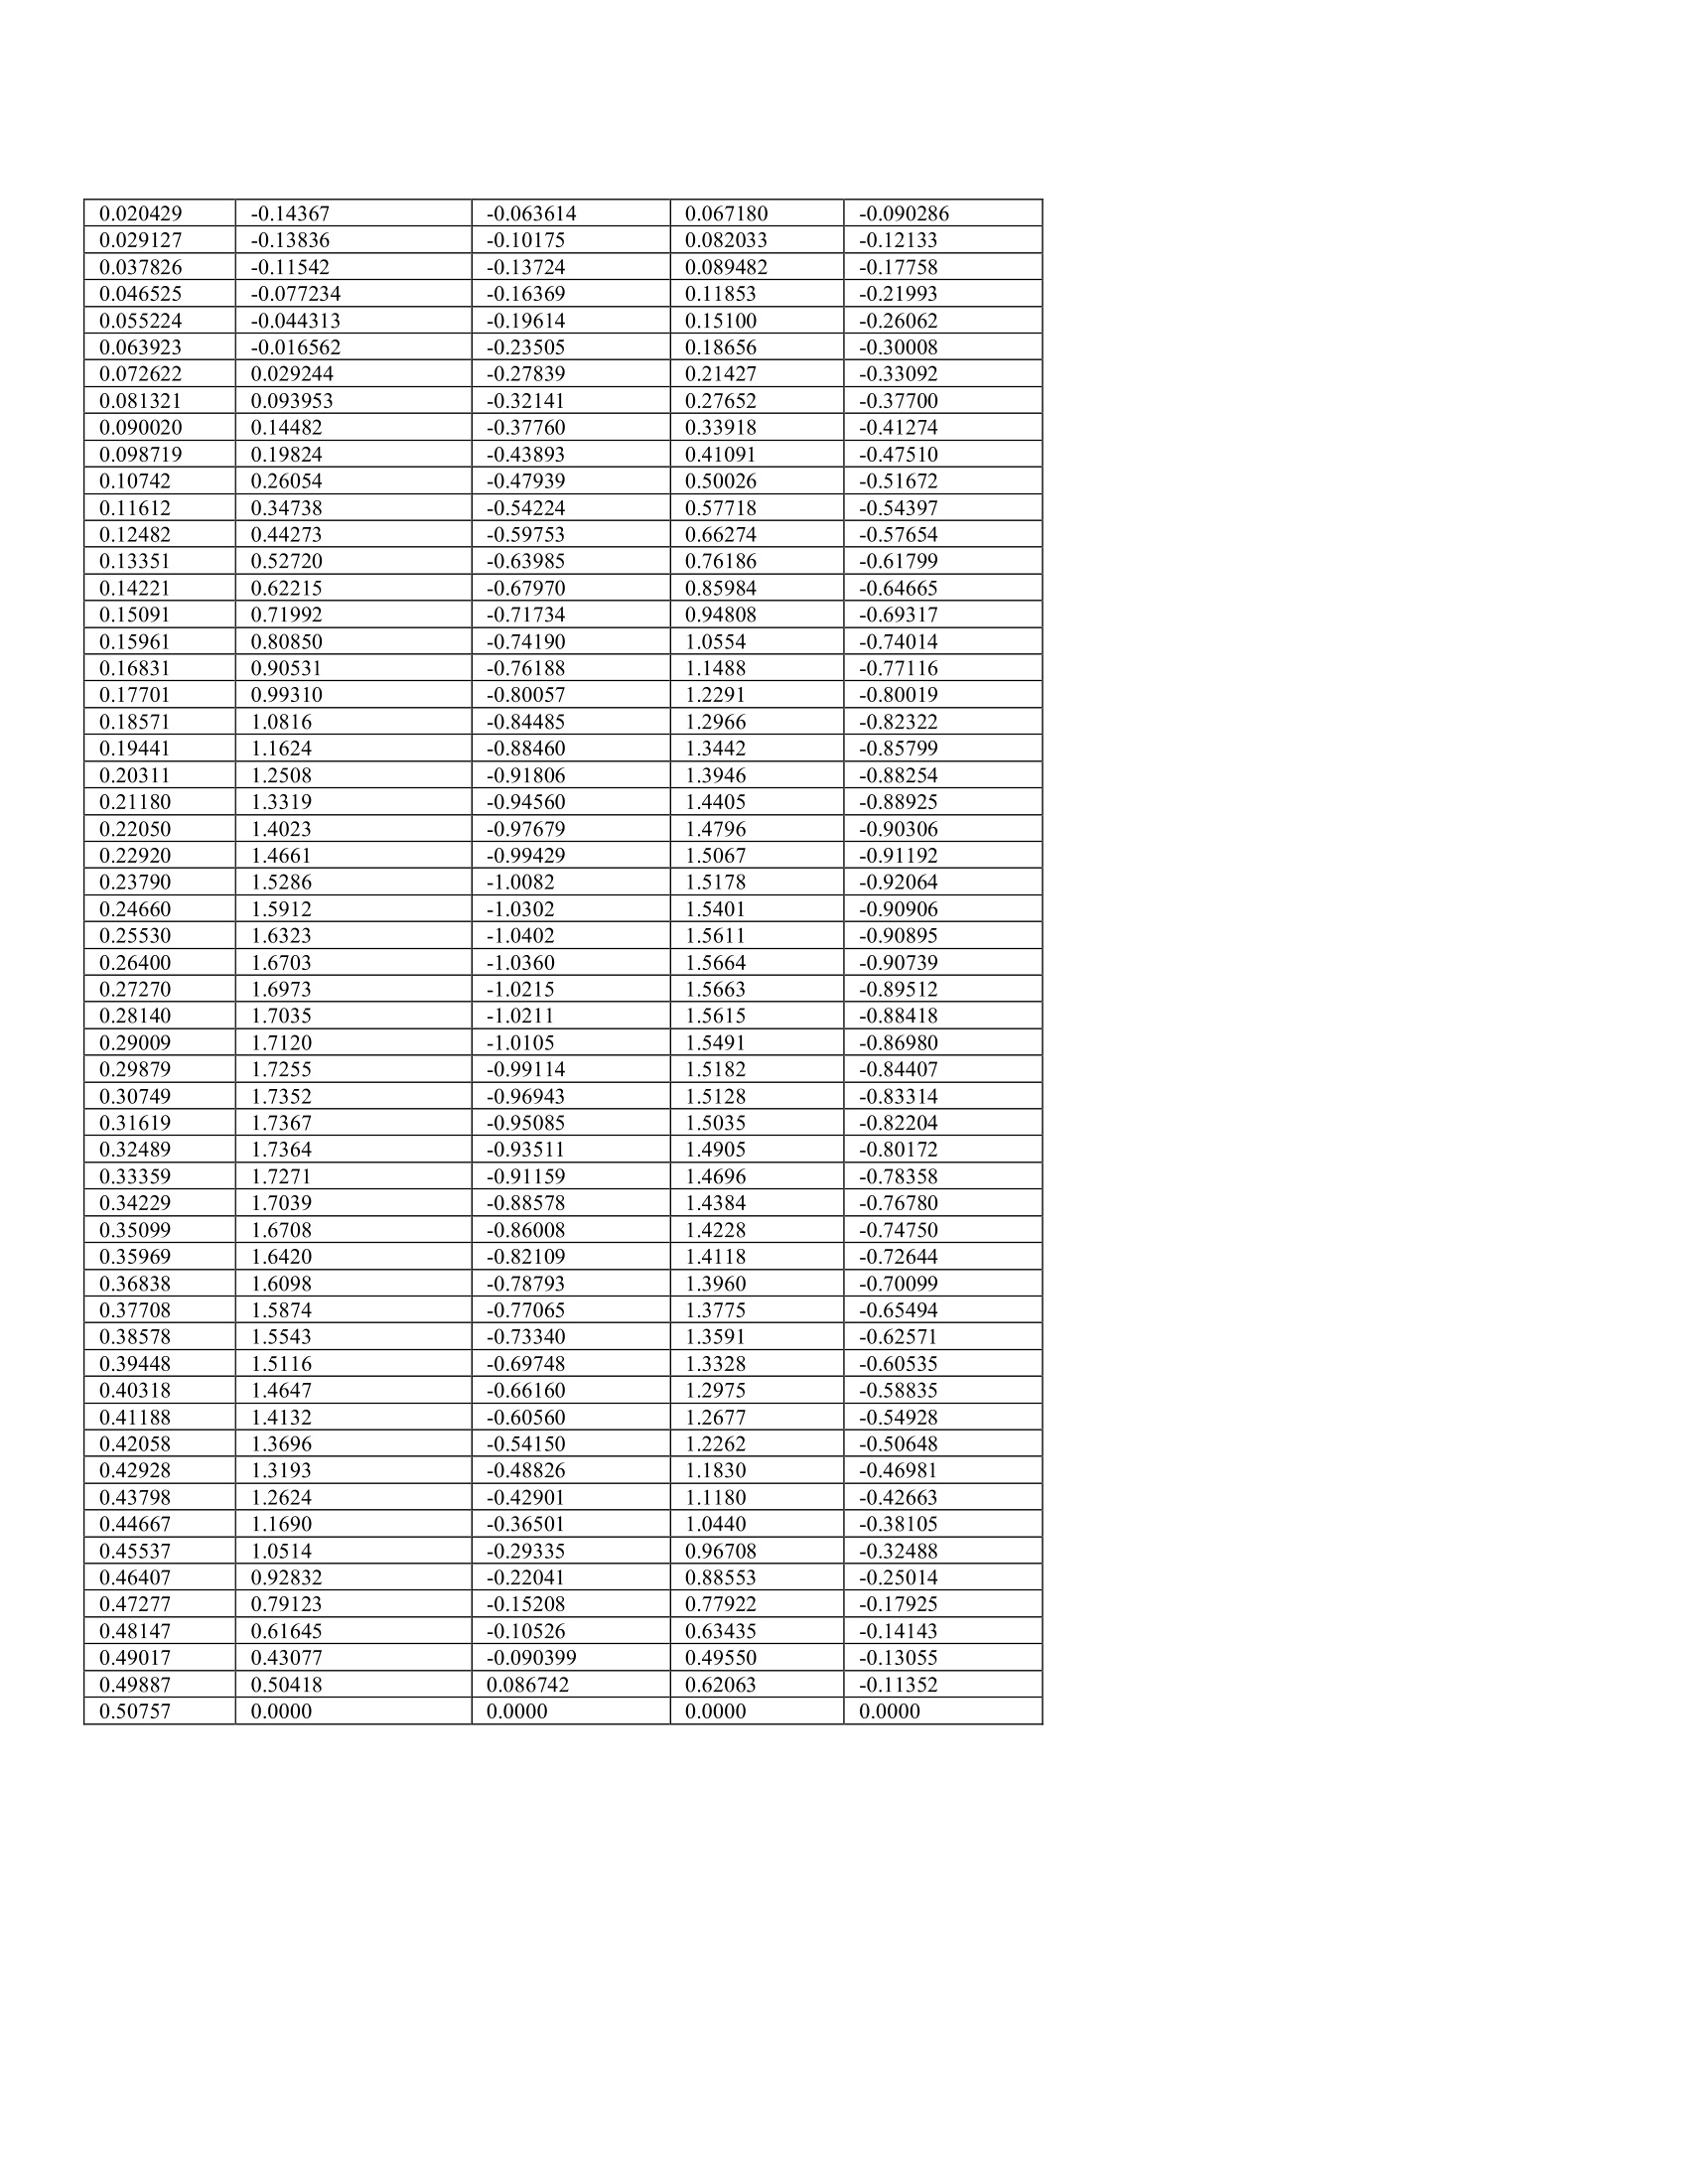
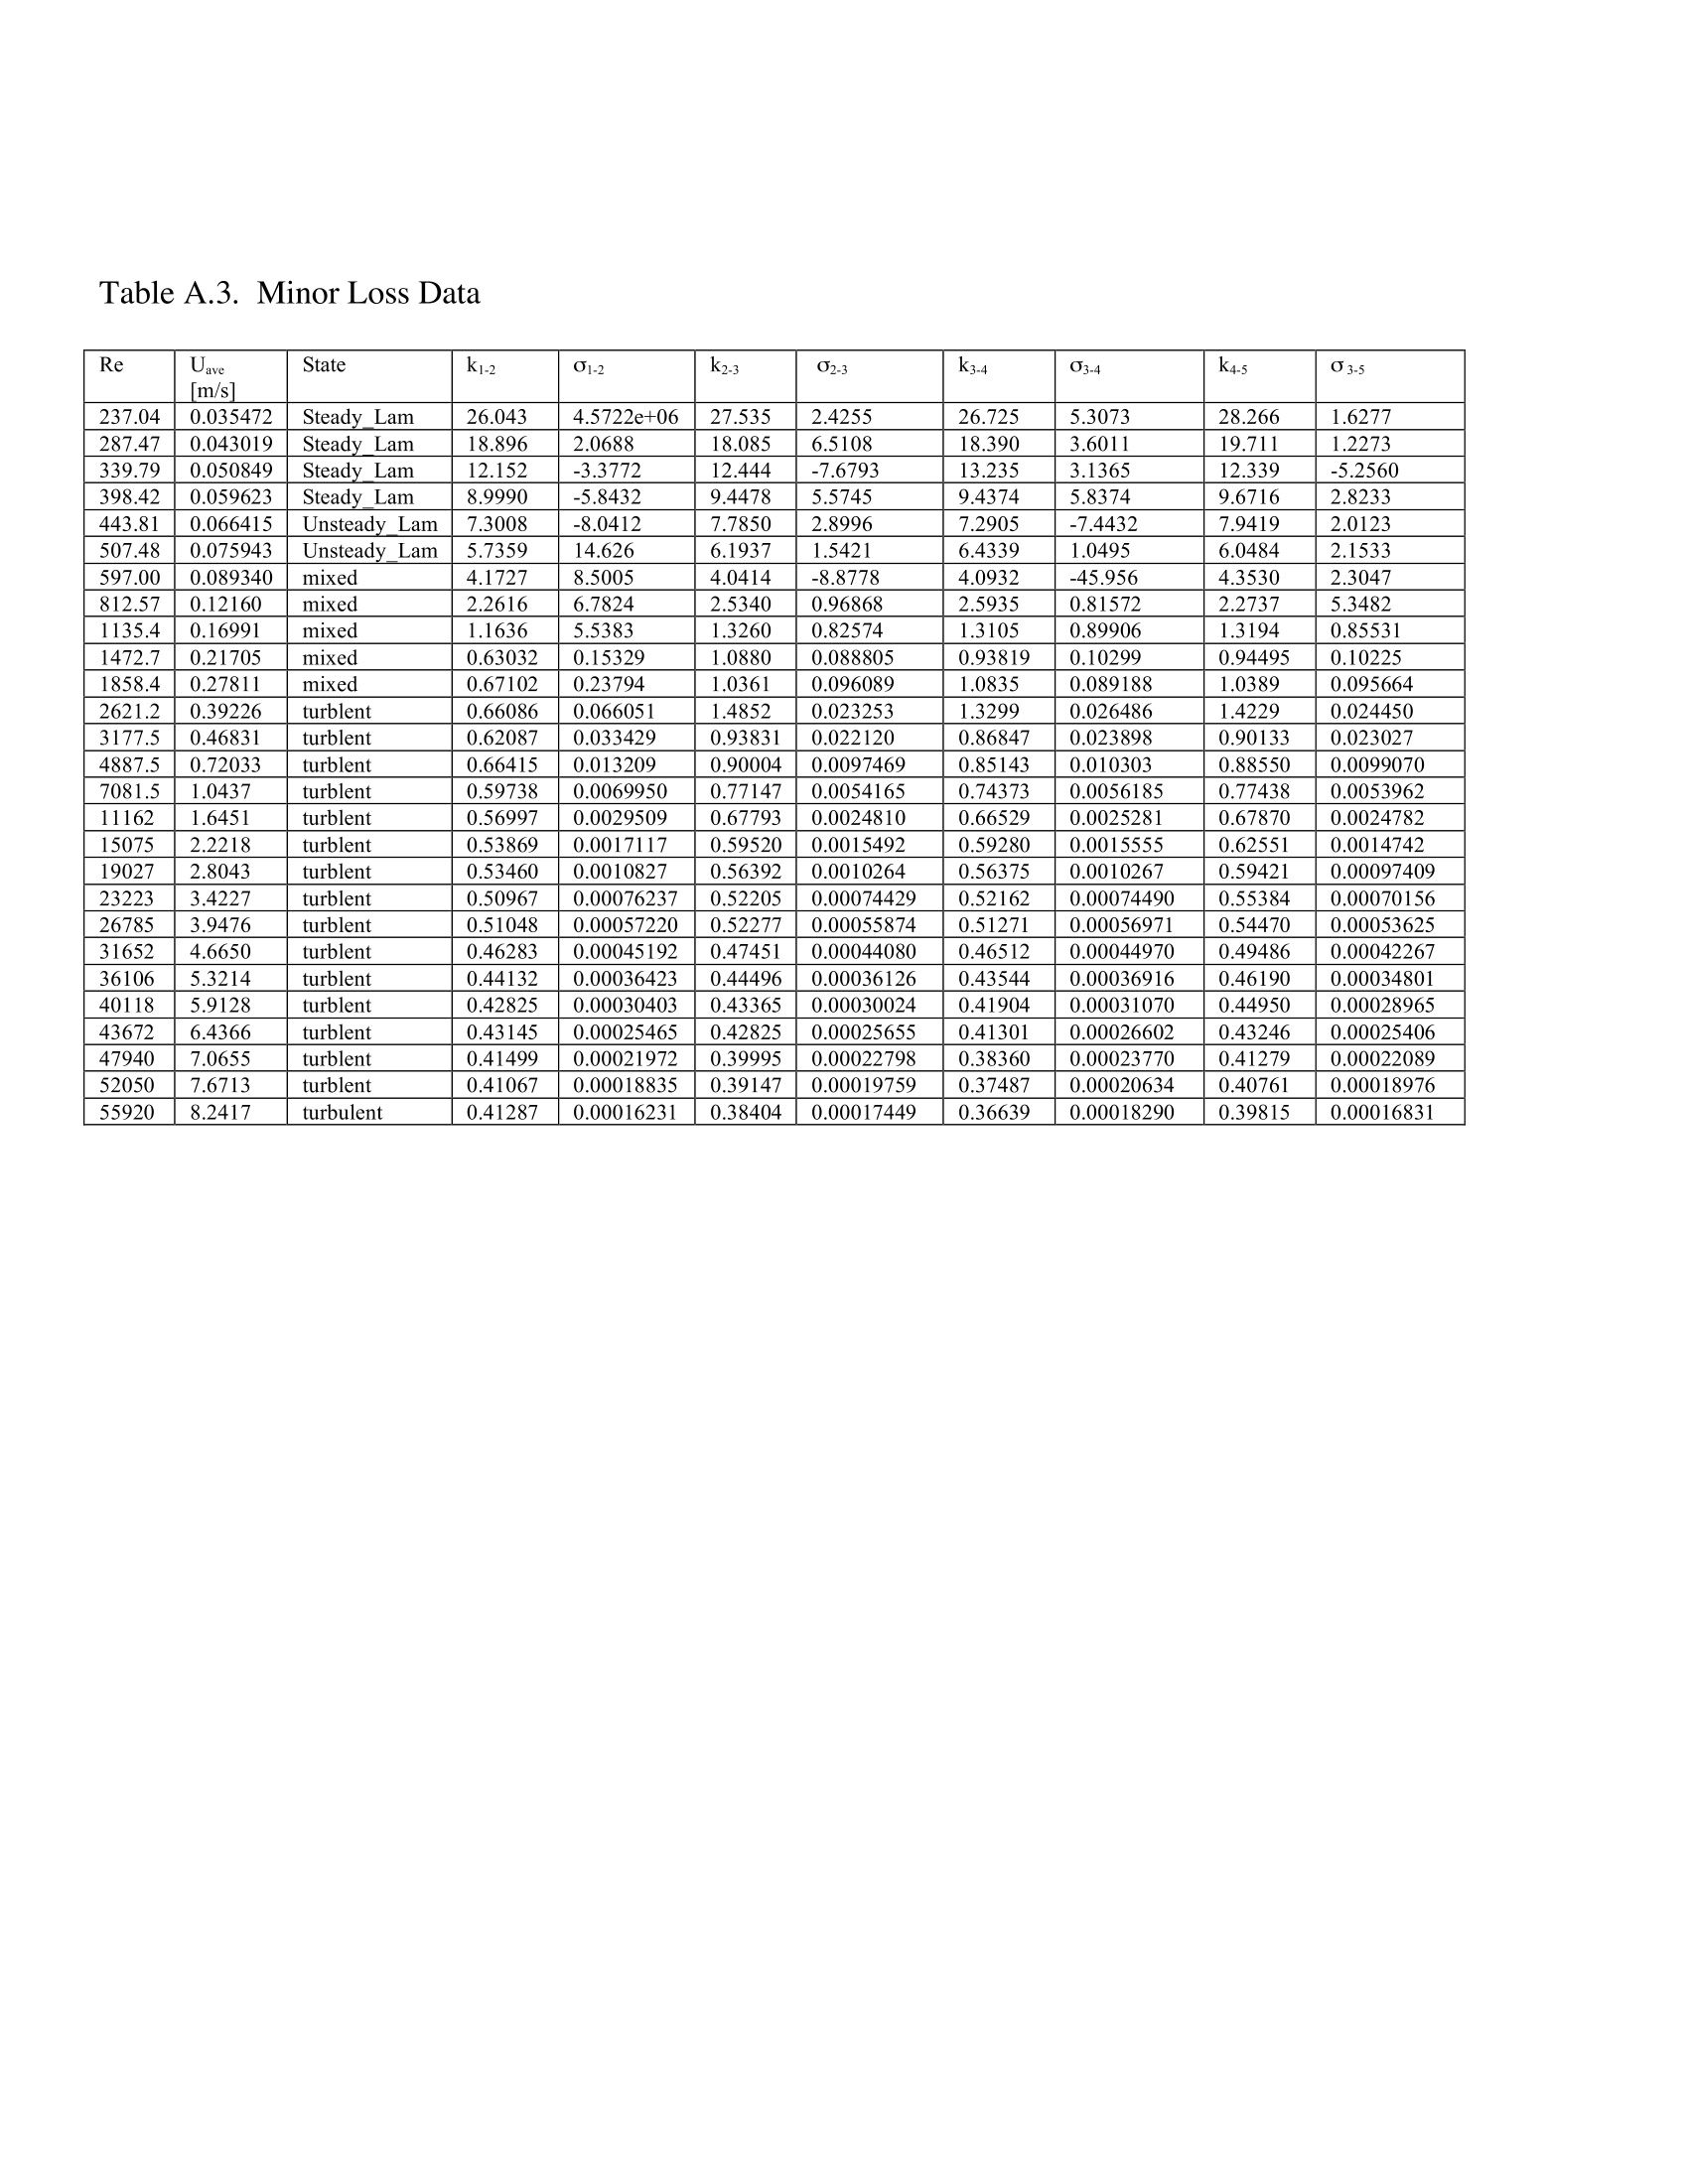
UtahStateUNIVERSITY Flow Regimes in an Idealized Plenum Model B. L.Smith Experimental Fluid Dynamics Laboratory Utah State University 10 August, 2005 Prepared for U. S.Department of Energy Office of Nuclear Energy, Science and Technology Under DoE Idaho Operations Office Contract DE-AC07-05ID14517 DEPARTMENT OF MECHANICAL & AEROSPACE ENGINEERING 4130 Old Main Hill · Logan UT 84322-4130· Phone: (435) 797-2867· FAX: (435) 797-2417 Flow Regimes in an ldealized Plenum Model Barton L. Smith Mechanical and Aerospace Engineering Utah State University Logan, UT 84322-4130 August 10, 2005 Abstract The results of flow experiments performed in a cylinder array designed to mimica Next Generation Nuclear Plant lower plenum design are presented. Pressure dropand velocity field measurements are made. Based on these measurements, five regimesof behavior are identified that are found to depend on Reynolds number. It is foundthat the recirculation region behind the cylinders is shorter than that of half cylindersplaced on the wall representing the symmetry plane. Contents Introduction 3 2 Facility and Measurements 3 3 Parameters and Parameter Space 7 4 Results 8 5 Acknowledgements 15 References 15 6Appendix (Tabulated Data) 18 Nomenclature D Cylinder diameter H Spanwise channel dimension k Minor Loss Factor from one full cylinder to the next, k =: AP1/2pUave P Cylinder pitch, and the channel width U Streamwise time-averaged velocity u Streamwise velocity Streamwise velocity fluctuation Uave Bulk, or mixed mean velocity at the maximum flow area Umax Bulk velocity and the location of minimum area V Time-averaged cross-stream velocity Cross stream velocity u' Cross stream velocity fluctuation xc Streamwise coordinate y Cross stream coordinate Spanwise coordinate ▲PD Pressure drop from one full cylinder to the next Kinematic viscosity 山 Stream function Fluid density Re Reynolds number based on the cylinder diameter D and Umax TKE 2-D Turbulent kinetic energy 1/2 (u'u’+v’v’) 1Introduction This report describes experiments performed at the Utah State University (USU) Ex-perimental Fluid Dynamics Laboratory (EFDL) in support of future experiments to be per-formed in the INL Matched Index of Refraction facility. The INL experiments will examinegeneric flow features expected in the lower plenum of a typical Next Generation NuclearPlant (NGNP) concept. In designing the INL experimental model, a key question is howhigh the Reynolds number must be so that the basic plenum flow of the model will be in thesame regime as in an NGNP design. The objective of the USU experiments is to answer thisquestion for the particular geometry of the INL model and to develop benchmark databasesfor CFD (computational fluid dynamics) code assessment. A comprehensive article on the fluid and heat transfer behavior of large arrays of cylindershas been presented by Zukauskas [1]. In that work, he describes three primary regimesof behavior that depend on Reynolds number Re =UmaxD/v, presumably based on flowvisualization results: 1. Laminar flow (Re <1000) 2. Mixed flow, where the cylinder boundary layers are laminar, while the flow containsturbulent regions (5002×10) In the present work, we do not achieve Reynolds numbers in this turbulent range. Addition-ally, we are able to subdivide regimes 1-2. For these reasons, we will depart from Zukauskas’sregime definitions, but will relate our regime demarcations to his. 2Facility and Measurements The facility consists of a inlet contraction, a test section, and an outlet that connects toducting leading to the blower inlet as shown in Figure 1. Atmospheric air (at 4500 feet, Loganair pressure is nominally 0.85 atm) is drawn through the facility by a frequency-controlledcentrifugal blower (Cincinnati Fan SBP-15 series). The inlet contracts 1.4-1 in the spanwise direction and 3-1 in the cross-stream direction. Turbulence is managed by a single bank ofscreen with 44 wires per inch on the inlet.The flow leaving the test section flows throughtwo perforated plates placed in line to prevent separation and to suppress separation and anypulsations generated by the blower. The blower is connected to the outlet by a flexible hose.The effectiveness of the turbulence management is confirmed through hot wire measurementsat y= z = 0 (the span-wise and cross-stream center) and at the inlet of the test section.The rms level of the hotwire velocity magnitude signal varies from a minimum of 1.1% ofthe mean velocity magnitude at low velocity up to 1.5% at the highest velocity; for theultimate application, a“low” turbulence level is not expected. The hotwire is calibrated ina dedicated calibration facility prior to the measurement. A third order polynomial is least-square fit to the calibration data and used to convert the bridge output voltage to velocity.Data are recorded with the same data acquisition system used for the pressure measurementsdescribed below. The test section is a channel 35.3 inches long in the streamwise direction (x), 3.36 inchesin the cross-stream direction (y) and 13.7 inches in the spanwise (z) direction and is geo-metrically similar to the proposed INL model. The channel contains an array of cylindersand half cylinders designed to mimic an infinite array of cylinders arranged on an equilateraltriangular pitch. Five cylinders, which represent vertical support posts in the lower plenumof an NGNP concept, are in placed on the cross-stream centerline. The streamwise distancebetween these cylinders is 5.83 inches. The cylinders are 1.98 inches in diameter. Four sets ofhalf-cylinders are placed on the cross-stream edges directly between the centerline cylinders.A schematic diagram of the test section along with the coordinate system employed is givenin Figure 1. The primary geometric dimensionless parameter that describes this arrangement is thedimensionless cylinder pitch, P/D, where P is the distance between adjacent cylinders (andequal to the channel width, 3.36 inches) and D is the cylinder diameter. Therefore, P/D=1.7. An additional parameter is the spanwise dimension relative to the cylinder diameter,H/D=6.9, which corresponds to the approximate height of the lower plenum represented. Two types of measurements are made: 1. The pressure drop from each centerline cylinder to the next Figure 1:The test section used in this study.Air enters through screens at the left, into acontraction and into the test section. 2. The velocity field on the x -y plane centered on the 4th cylinder Pressure taps are drilled into the back wall of the facility.The pressure taps are holes0.0625 inches in diameter. Care is taken to ensure that the wall is smooth after drilling.All taps are placed at the spanwise centerline and are at the same streamwise position asthe axis of the full cylinders. The pressure measurements are made using a high-accuracydifferential capacitance manometer (MKS Baratron Model 698A12TRA,100mmHg full scale)with 0.0001 mm Hg resolution.. This resolution is the major source of uncertainty in thepressure measurements. The positive and negative sides of the manometer are placed acrossthe two successive ports. For each cylinder at each Reynolds number, data are recorded viaa 12-bit digital to Analog converter in a laboratory computer. The average of samples takenover 30 seconds is reported. The PIV measurements are made using a system by LaVision Inc. consisting of a 12-bit1.3-MPixel (1280 × 1040) camera, a pair of 50 mJ Nd:YAG lasers with sheet optics, andan acquisition PC including a frame grabber and a timing board. A florescent paint wasapplied to all surfaces to shift laser reflections to wavelengths that can be removed by a filteron the camera optics. The laser sheet enters the facility from one cross-stream side madeof transparent plastic and was terminated on the other opaque side. The sheet is placed inbetween the spanwise centerline and the spanwise wall as a compromise between our desire toobtain 2-D mean data and to minimize the extent of the region near the cylinder surface thatcannot be observed due to parallax. Olive oil droplets formed by a Laskin nozzle apparatus(built in house) are used as seeding particles.The droplets produced are estimated to be 1-2 um in diameter. The droplets are drawn into the facility at the inlet. Care was taken toensure that the images of the droplets on the CCD array were somewhat larger than 2 pixelsto eliminate pixel locking while providing maximum accuracy [2]. Multiple cross-correlationpasses with a final spot size of sixteen pixels are used. In each case, 500 image pairs areacquired at a rate of one pair per second. An example of one image is shown in Figure 2. Several features of this raw-data imageshould be noted: The data are acquired centered on the fourth cylinder, since this was judgedto be the most likely location to obtain a streamwise-periodic result. Streamwise periodicityis confirmed by the pressure drop data below as well as a single case measured on the thirdcylinder (not shown). The half cylinders upstream and downstream are visible on both sidesof the channel. Both channel walls are easily found, and these locations are used for the PIVcalibration since this distance is known. Thelaser sheet is blocked by the lower half-cylinders,but expands somewhat as it crosses the channel. The laser sheet is also blocked by the opaquecenterline cylinder, forming a shadow on the far side of the channel. The shadow appears tobe less wide than the cylinder. This situation occurs because the view of the surface of thecylinder is obscured by the part of the cylinder between the laser sheet and the camera lens.That is, due to the placement of the camera in line with the center of the cylinder, the anglesubtended by the cylinder end is greater than the angle to the intersection of the cylinderand the light sheet further along. Therefore, the boundary layer of the cylinder is not visible.This effect is reduced by placing the laser sheet four inches from the spanwise center towardsthe side close to the camera. The PIV data were first acquired with the blower outlet open and the blower operatingin between its minimum and maximum rotation rate. Reynolds numbers in the range 1473 200,000). Based on the results of [1]. The pressure drop results are shown in Figure 4 for the range of Reynolds numbers overwhich they are within the resolution of the pressure transducer. The first subscript refers tothe cylinder (and pressure tap) at which the positive side of the pressure sensor is attached,while the second subscript refers to the cylinder where the negative side is attached (seeFigure 1).. The transducer resolution is indicated with error bars (and is provided in thetabulated data in the columns labeled a). The loss from the first cylinder to the secondis consistently much lower than the losses across the remainder of the cylinders, which aresimilar to one another. At low Reynolds numbers, the data lie directly between the resultsfrom [1] for P/D values just above and below that used here, as expected. At larger Re (inthe mixed, turbulent regime), the present data exhibit smaller losses than the infinite arrayof [1]. It may be that the presence of the cross-stream walls in the present case suppresseswake oscillations and thus inhibits losses. Profiles of several quantities on a line midway between the centerline cylinder and thehalf cylinders downstream (see Figure 1) are presented. These data are also provided in theAppendix. The time-averaged profiles of the streamwise and cross-stream components (Uand V, respectively) are shown in Figures 5 and 6, respectively. All of the regimes describedabove are represented. Starting with the streamwise component, in each case, the velocitypeaks on either side of the centerline cylinder, and reverse flow is present in the cylinder wakein the center of the channel. Generally, as the Reynolds number is increased, the magnitudeof peaks decreases as the peaks become broader. The wake deficit also becomes smaller, mostnotably for the highest two Reynolds numbers. In fact, the wakes for these two cases showno reverse flow at this streamwise location. For the largest Reynolds number (55,900) thepeaks have moved toward the centerline considerably, and the shape of the peak is modifiedcompared to lower Re values. 义 Re Figure 4:: Pressure losses represented by minor loss factors.Solid and dashed lines representgraphical correlations from Zukauskas [1] (his Figure 64) for equilateral triangle arrays with P/D=1.5 and 2.0. y/P Figure 5: Cross-stream profiles of the mean streamwise velocity for a range of Reynolds numbers.Every third data point is shown. The acronyms in the legend denote the flow regimes. In the cross-stream component profiles (Figure 6), all cases with Re ≤2620 have a flatregion of near zero cross-stream velocity in the wake. The largest two Reynolds numbersexhibit a continuous variation ofV in the wake, indicating that this measurement is down-stream of the recirculation region for these two cases. This is confirmed below in Figure10. The five regimes outlined above are visible in profiles of the two-dimensional version ofturbulent kinetic energy TKE= 1/2(u’u’+u’) normalized by Uave (Figure 7). At Re =237, the TKE is near zero (as expected for laminar flow) except near y/P=0.25;this apparent peak has been traced to problems with seeding nonuniformity for this very lowvelocity. Regions with little or no seeds can produce erroneous vectors which impact TKEstrongly. As Re is increased, the uniformity of the seeding improves. It should also be noted y/P Figure 6: Cross-stream profiles of the mean cross-stream velocity for a range of Reynolds numbersrepresenting the flow regimes. Every third data point is shown. The acronyms in the legend denotethe flow regimes y/P Figure 7: Cross-stream profiles of normalized TKE for a range of Reynolds numbers representingthe flow regimes. Every third data point is shown/. that this peak is not present for larger Re values within the steady laminar range (not shown).The fluctuation in the wake position in the unsteady laminar range leads to elevated TKElevels compared to the steady laminar case. The fluctuations are not symmetric above andbelow the cylinder-a tendency that continues to higher Reynolds numbers. In the mixedpartially-turbulent regime, the peaks of TKE are at a similar location as in the unsteadylaminar regimes, but normalized TKE levels are higher. The normalized TKE levels aremaximum at the low Re end of the mixed turbulent regime, and become smaller as Re isincreased. Interestingly, locations of these peaks then begin to move away from the centerlinefor the two highest Re values. This may be due to the reduction in the size of the recirculationregion discussed below with respect to Figure 10. Contours of the stream function w (U =0w/8y, V=-0w/0c) at even incrementsare presented in Figure 8. Each contour increment represents 2.3% of the total flow rate.Given the equal contour spacing, the flow rate between any two streamlines is the same.However, computation of the streamfunction requires integration across the data making the above plots subject to propagated error from erroneous vectors near the edges of thedata. These errors appear as “wrinkles”in the contours. For this reason, these plots are notuseful for quantitative results such as determination of the length of the recirculation regionsdownstream of the cylinders.The regions occupied by the cylinder and half cylinders areshaded dark grey. Other regions where data are not acquired due to shadows or parallaxare shaded a lighter grey. The differences between the streamline patterns for the variouscases are subtle. In fact, the patterns are nearly identical until the mixed turbulent regime isreached. At such Reynolds numbers, the size of the wake begins to decrease with Reynoldsnumber. One item revealed by these data that cannot be detected in streamline plots is thatthe flow rate within the wakes of the wall-mounted half-cylinders is larger than that behindthe centerline cylinder. Streamline plots (lines drawn parallel to the velocity vector) cannot provide informationabout the velocity magnitude.However, it is possible to accurately find the stagnationpoint that represents the edge of the recirculation region from such plots. An example of astreamline plot is shown in Figure 9. The extent of the recirculation region downstream ofthe full cylinder as well as the half cylinder below and upstream of it are shown in Figure10. Interestingly, the numerical data of [5] for an array of equally-spaced staggered cylinderswith spacing P/D=2 and 3 lie below and above the present data. Additional results and data tabulations are available on the EFDL website 4. 5 Acknowledgements This work was partly supported by the U. S. Department of Energy, Office of NuclearEnergy, Science and Technology (NE), under DoE-NE Idaho Operations Office ContractDE-AC07-05ID14517. References [1] A. Zukauskas. Heat transfer from tubes in crossflow. Adu. Heat Transfer, 8:93-160,1972. x/P Figure 8: Contours of the stream function. Contour interval represents 2.3% of the total volumeflow rate. Figure 9: Definition of the recirculation length. Streamlines are for flow at Re =237. Figure 10:The recirculation length relative to the pitch for versus Reynolds number for thecenterline cylinder and for the half cylinder on the lower wall. 2J. Westerweel. Fundamentals of digital particle image velocimetry. Measurement Science8 Technology, 8:1379-1392,1997. 3] E. Fried and I. E. Idelchik. Flow Resistance: a design guide for engineers. Hemisphere,1989. 4 B. L. Smith. Experimental Fluid Dynamics Laboratory website. 2004.http://www.mae.usu.edu/faculty/bsmith/EFDL/EFDL.htm. ( [5] C. Moulinec, J. C. R. Hunt, and F . T . M .Nieuwstadt. Dis a ppearing wakes and disper-sion in numerically simulated flows through tube bundles. Flow Turbulence Combustion,73:95 - 116,2004. ) Appendix (Tabulated Data) Table A.1. These data are cross-stream time-average profiles of the streamwise (U) and ross-stream (V)velocity in m/s for various low values of the Reynolds number indicated in the top row. Table A.2. These data are cross-stream time-average profiles of the streamwise (U) and ross-stream (V)velocity in m/s for various high values of the Reynolds number indicated in the top row. Table A.3. Minor Loss Data Re Uave[m/sl State k1-2 01-2 k2-3 02-3 k3-4 3-4 k4-5 O3-5 237.04 0.035472 Steady Lam 26.043 4.5722e+06 27.535 2.4255 26.725 5.3073 28.266 1.6277 287.47 0.043019 Steady Lam 18.896 2.0688 18.085 6.5108 18.390 3.6011 19.711 1.2273 339.79 0.050849 Steady Lam 12.152 -3.3772 12.444 -7.6793 13.235 3.1365 12.339 -5.2560 398.42 0.059623 Steady Lam 8.9990 -5.8432 9.4478 5.5745 9.4374 5.8374 9.6716 2.8233 443.81 0.066415 Unsteady Lam 7.3008 -8.0412 7.7850 2.8996 7.2905 -7.4432 7.9419 2.0123 507.48 0.075943 Unsteady Lam 5.7359 14.626 6.1937 1.5421 6.4339 1.0495 6.0484 2.1533 597.00 0.089340 mixed 4.1727 8.5005 4.0414 -8.8778 4.0932 -45.956 4.3530 2.3047 812.57 0.12160 mixed 2.2616 6.7824 2.5340 0.96868 2.5935 0.81572 2.2737 5.3482 1135.4 0.16991 mixed 1.1636 5.5383 1.3260 0.82574 1.3105 0.89906 1.3194 0.85531 1472.7 0.21705 mixed 0.63032 0.15329 1.0880 0.088805 0.93819 0.10299 0.94495 0.10225 1858.4 0.27811 mixed 0.67102 0.23794 1.0361 0.096089 1.0835 0.089188 1.0389 0.095664 2621.2 0.39226 turblent 0.66086 0.066051 1.4852 0.023253 1.3299 0.026486 1.4229 0.024450 3177.5 0.46831 turblent 0.62087 0.033429 0.93831 0.022120 0.86847 0.023898 0.90133 0.023027 4887.5 0.72033 turblent 0.66415 0.013209 0.90004 0.0097469 0.85143 0.010303 0.88550 0.0099070 7081.5 1.0437 turblent 0.59738 0.0069950 0.77147 0.0054165 0.74373 0.0056185 0.77438 0.0053962 11162 1.6451 turblent 0.56997 0.0029509 0.67793 0.0024810 0.66529 0.0025281 0.67870 0.0024782 15075 2.2218 turblent 0.53869 0.0017117 0.59520 0.0015492 0.59280 0.0015555 0.62551 0.0014742 19027 2.8043 turblent 0.53460 0.0010827 0.56392 0.0010264 0.56375 0.0010267 0.59421 0.00097409 23223 3.4227 turblent 0.50967 0.00076237 0.52205 0.00074429 0.52162 0.00074490 0.55384 0.00070156 26785 3.9476 turblent 0.51048 0.00057220 0.52277 0.00055874 0.51271 0.00056971 0.54470 0.00053625 31652 4.6650 turblent 0.46283 0.00045192 0.47451 0.00044080 0.46512 0.00044970 0.49486 0.00042267 36106 5.3214 turblent 0.44132 0.00036423 0.44496 0.00036126 0.43544 0.00036916 0.46190 0.00034801 40118 5.9128 turblent 0.42825 0.00030403 0.43365 0.00030024 0.41904 0.00031070 0.44950 0.00028965 43672 6.4366 turblent 0.43145 0.00025465 0.42825 0.00025655 0.41301 0.00026602 0.43246 0.00025406 47940 7.0655 turblent 0.41499 0.00021972 0.39995 0.00022798 0.38360 0.00023770 0.41279 0.00022089 52050 7.6713 turblent 0.41067 0.00018835 0.39147 0.00019759 0.37487 0.00020634 0.40761 0.00018976 55920 8.2417 turbulent 0.41287 0.00016231 0.38404 0.00017449 0.36639 0.00018290 0.39815 0.00016831 Page
确定


还剩22页未读,是否继续阅读?

产品配置单

北京欧兰科技发展有限公司为您提供《流体中速度场检测方案(粒子图像测速)》,该方案主要用于其他中速度场检测,参考标准--,《流体中速度场检测方案(粒子图像测速)》用到的仪器有德国LaVision PIV/PLIF粒子成像测速场仪、Imager SX PIV相机
推荐专场


相关方案
更多
该厂商其他方案
更多