


方案详情
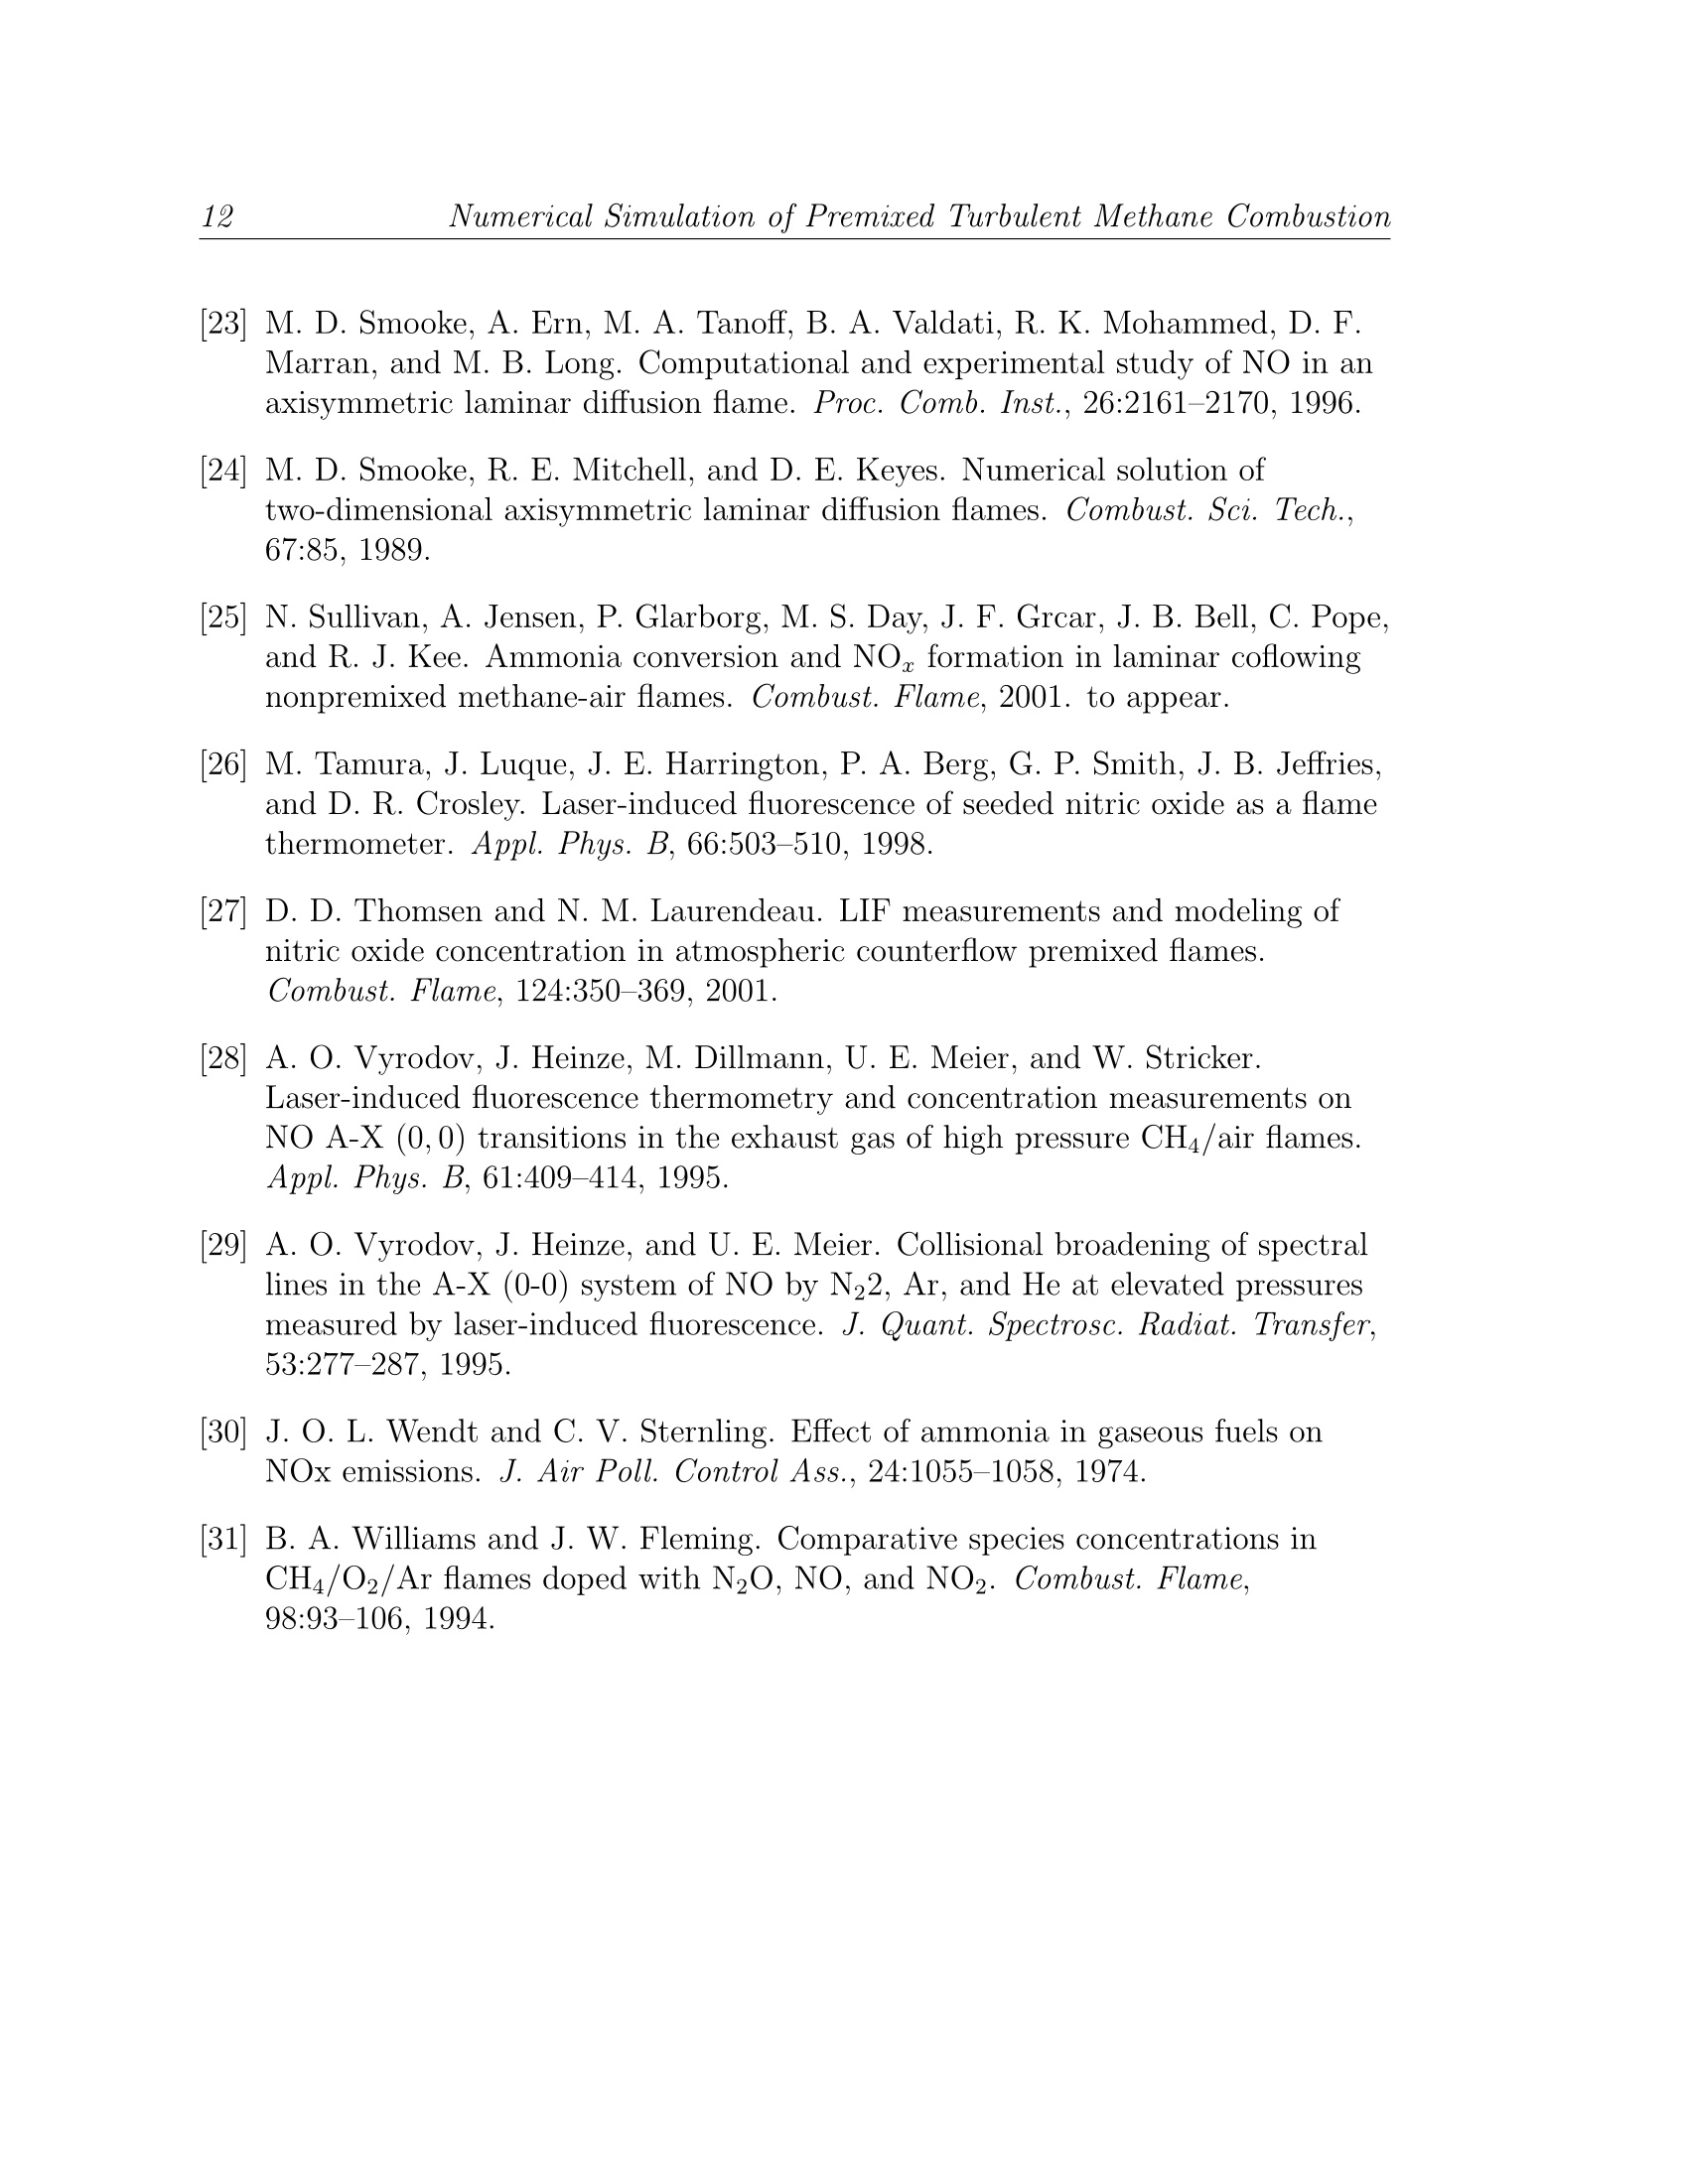
文
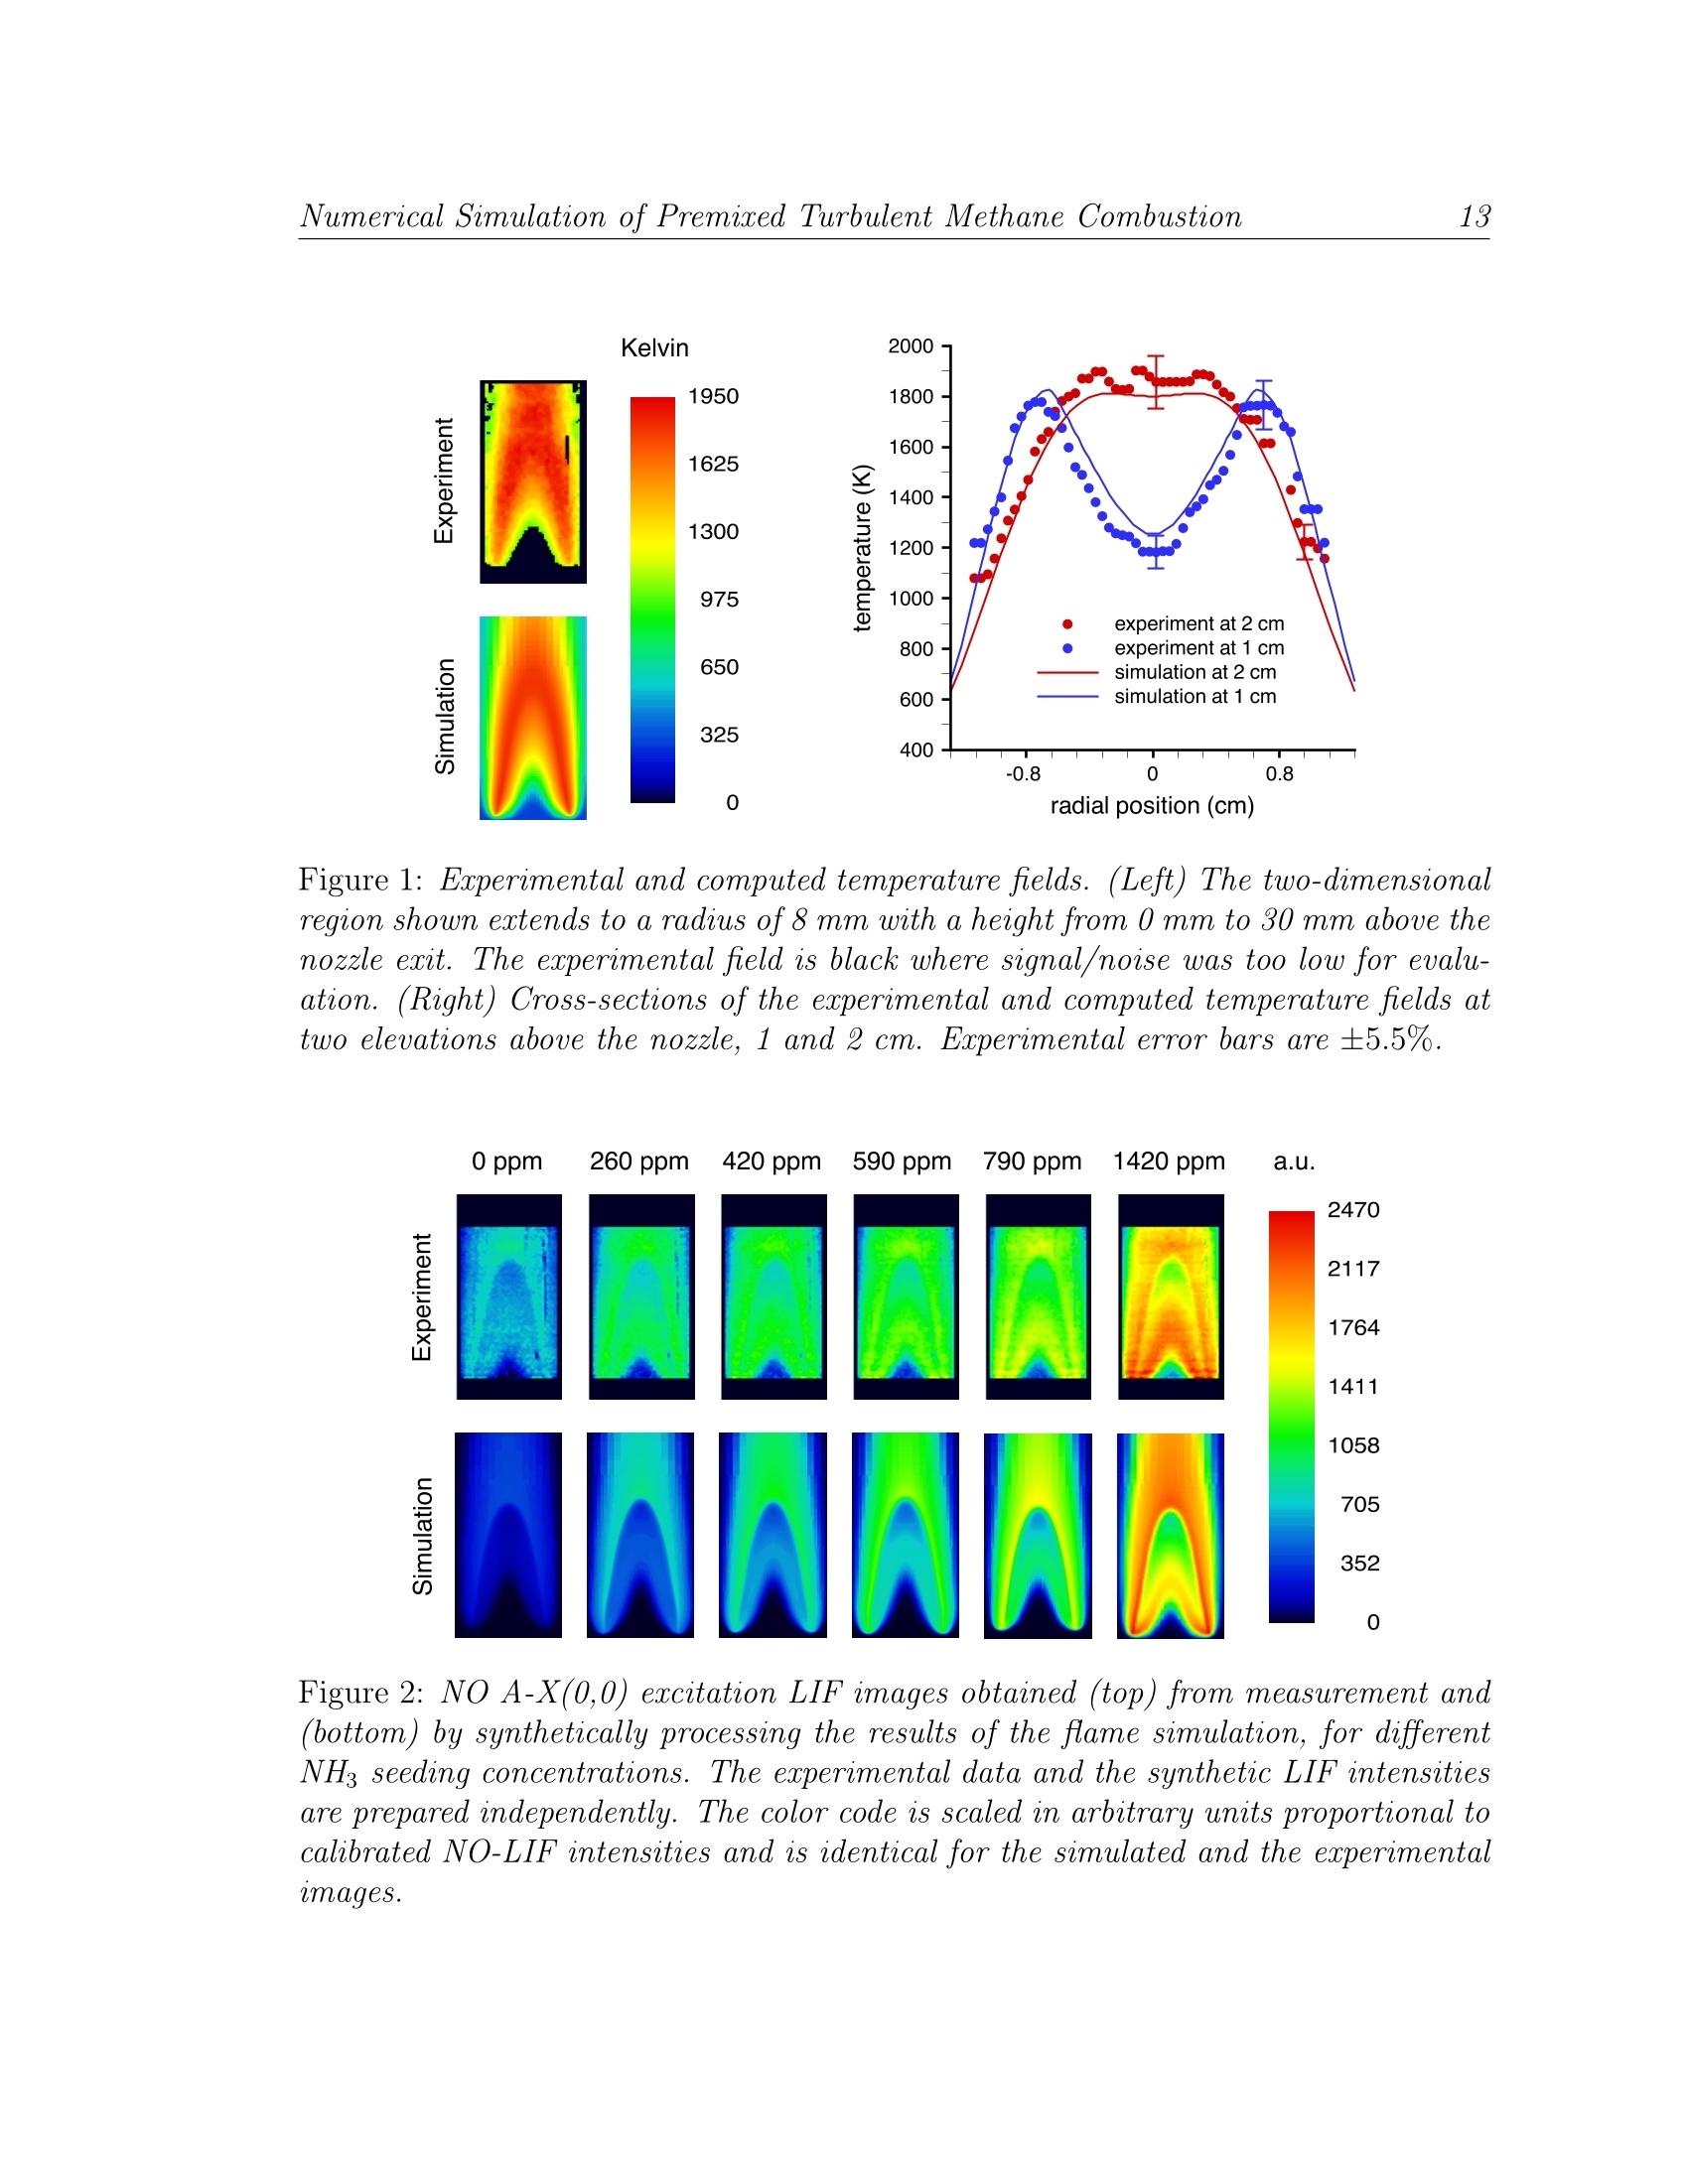
In this paper we study the formation of NO in laminar, nitrogen diluted
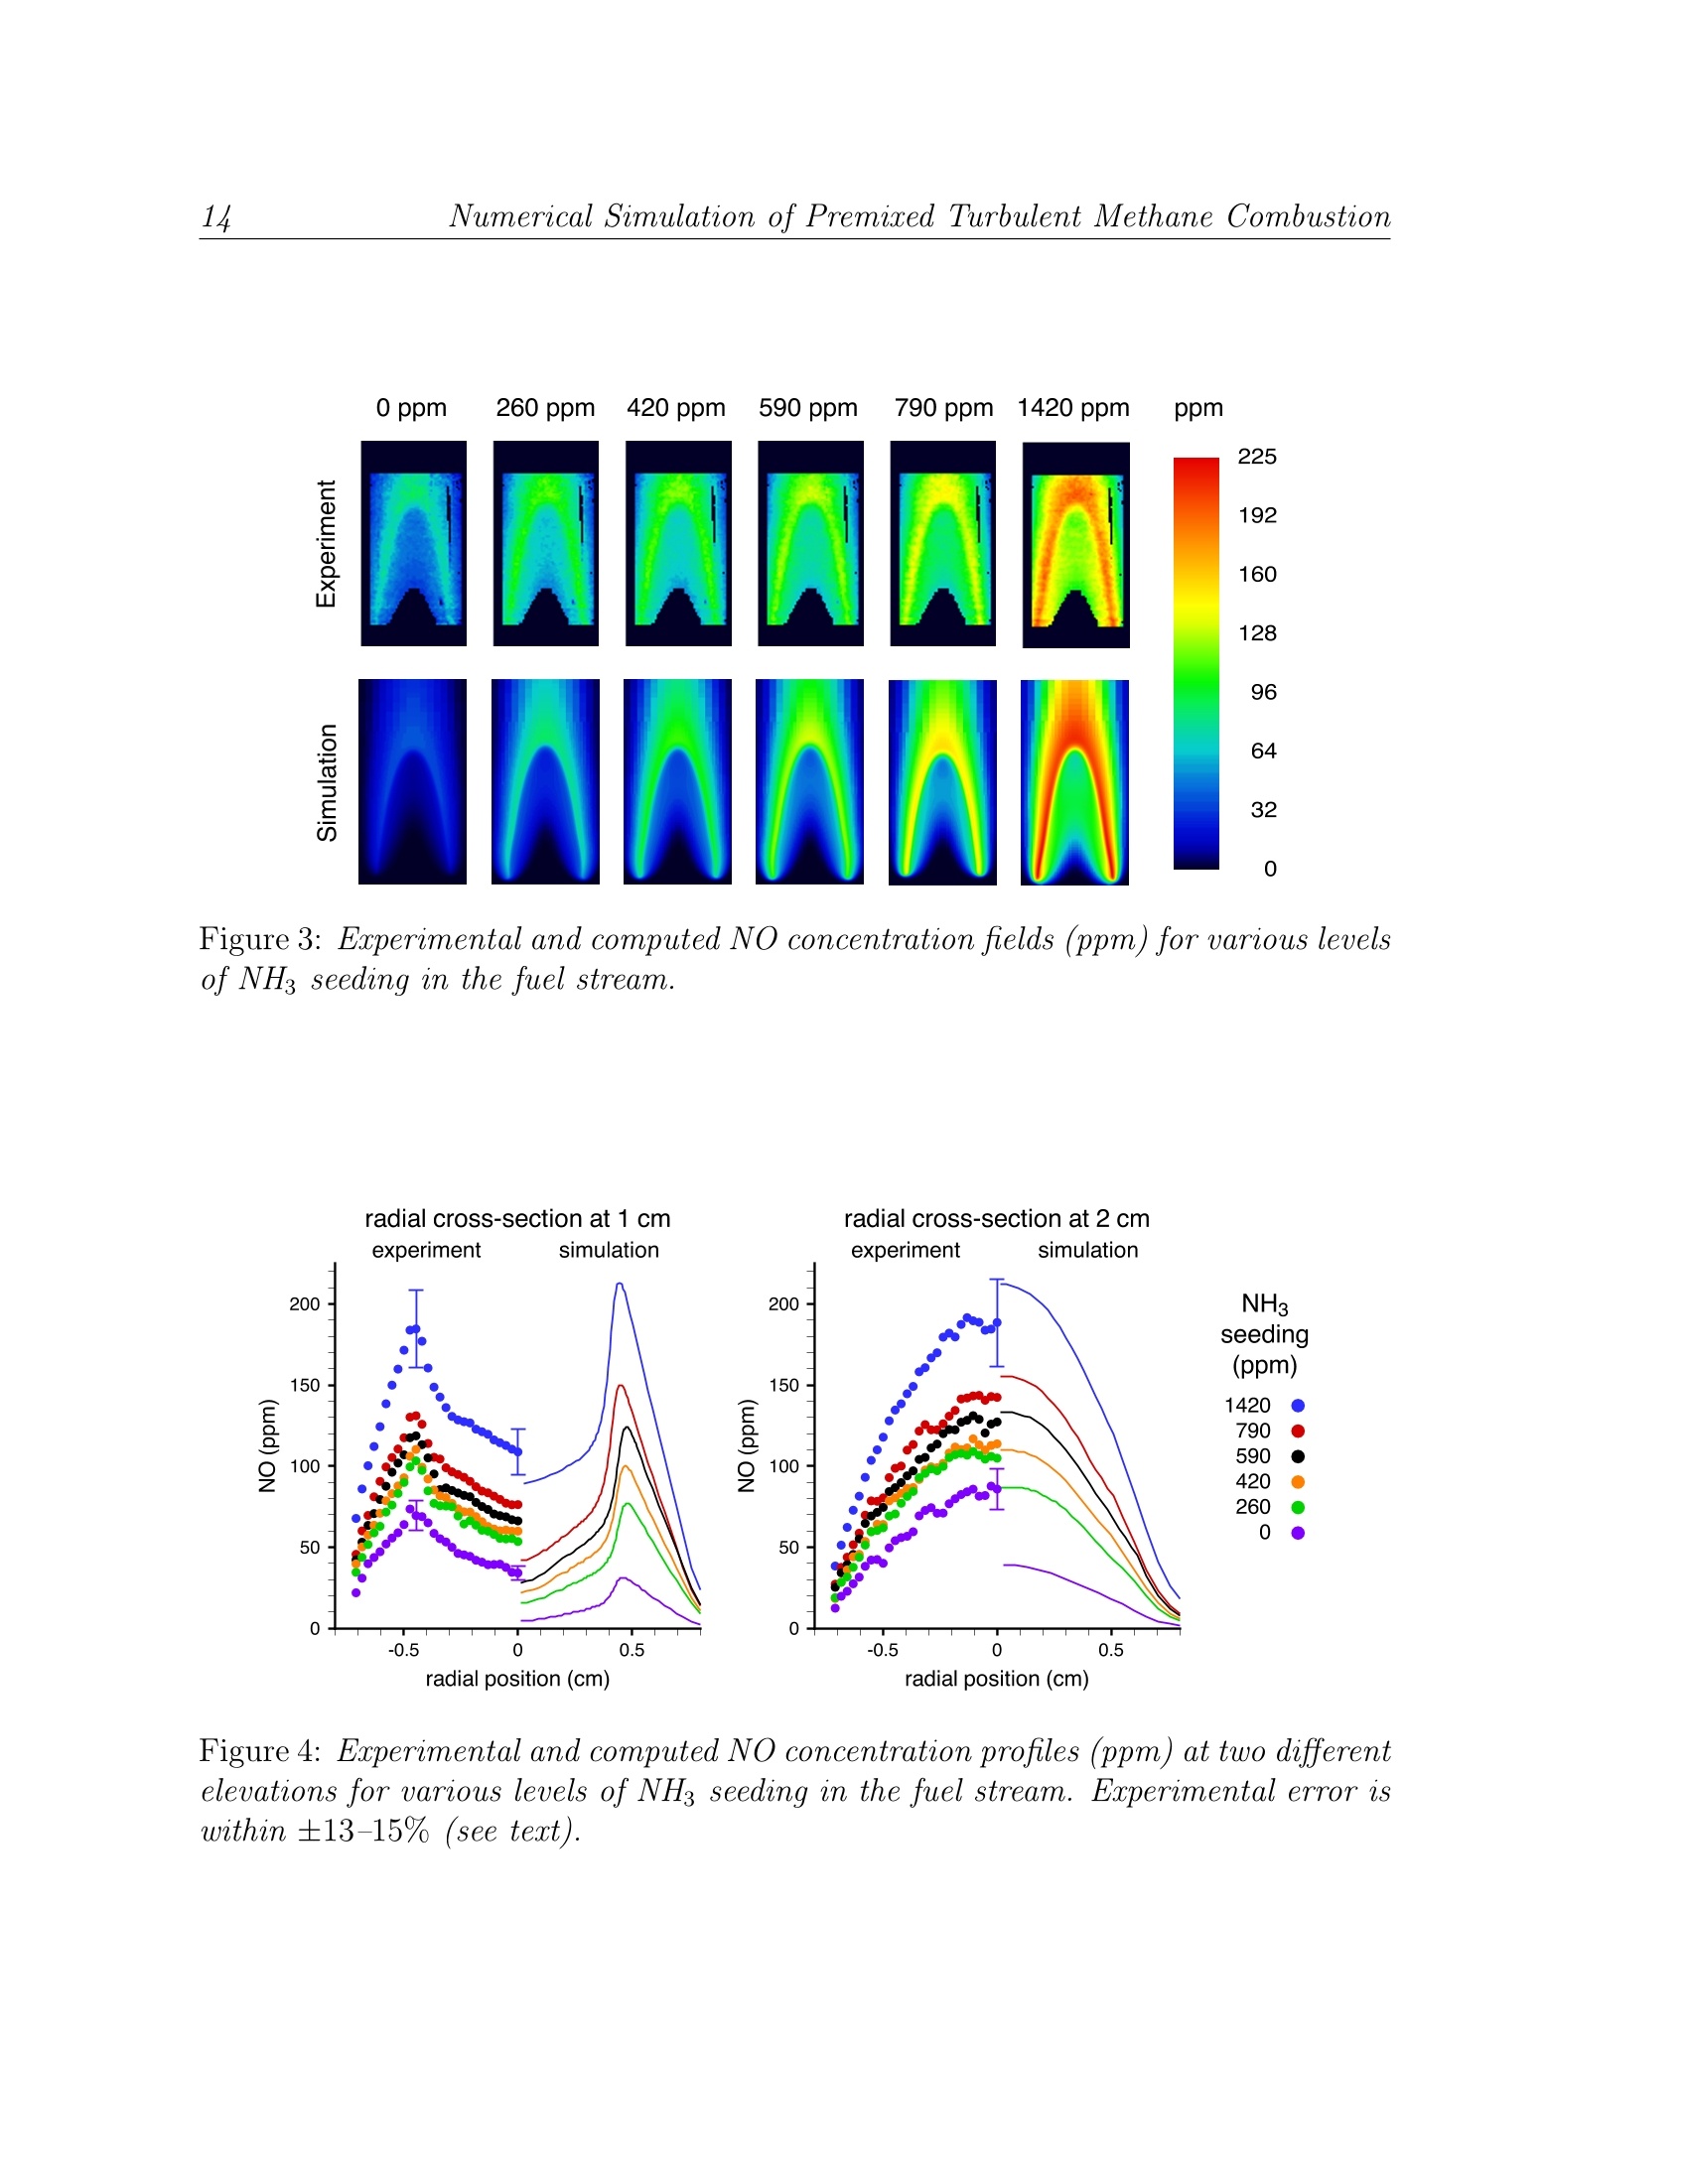
methane diffusion flames that are seeded with ammonia in the fuel stream.
We have performed numerical simulations with detailed chemistry as well as
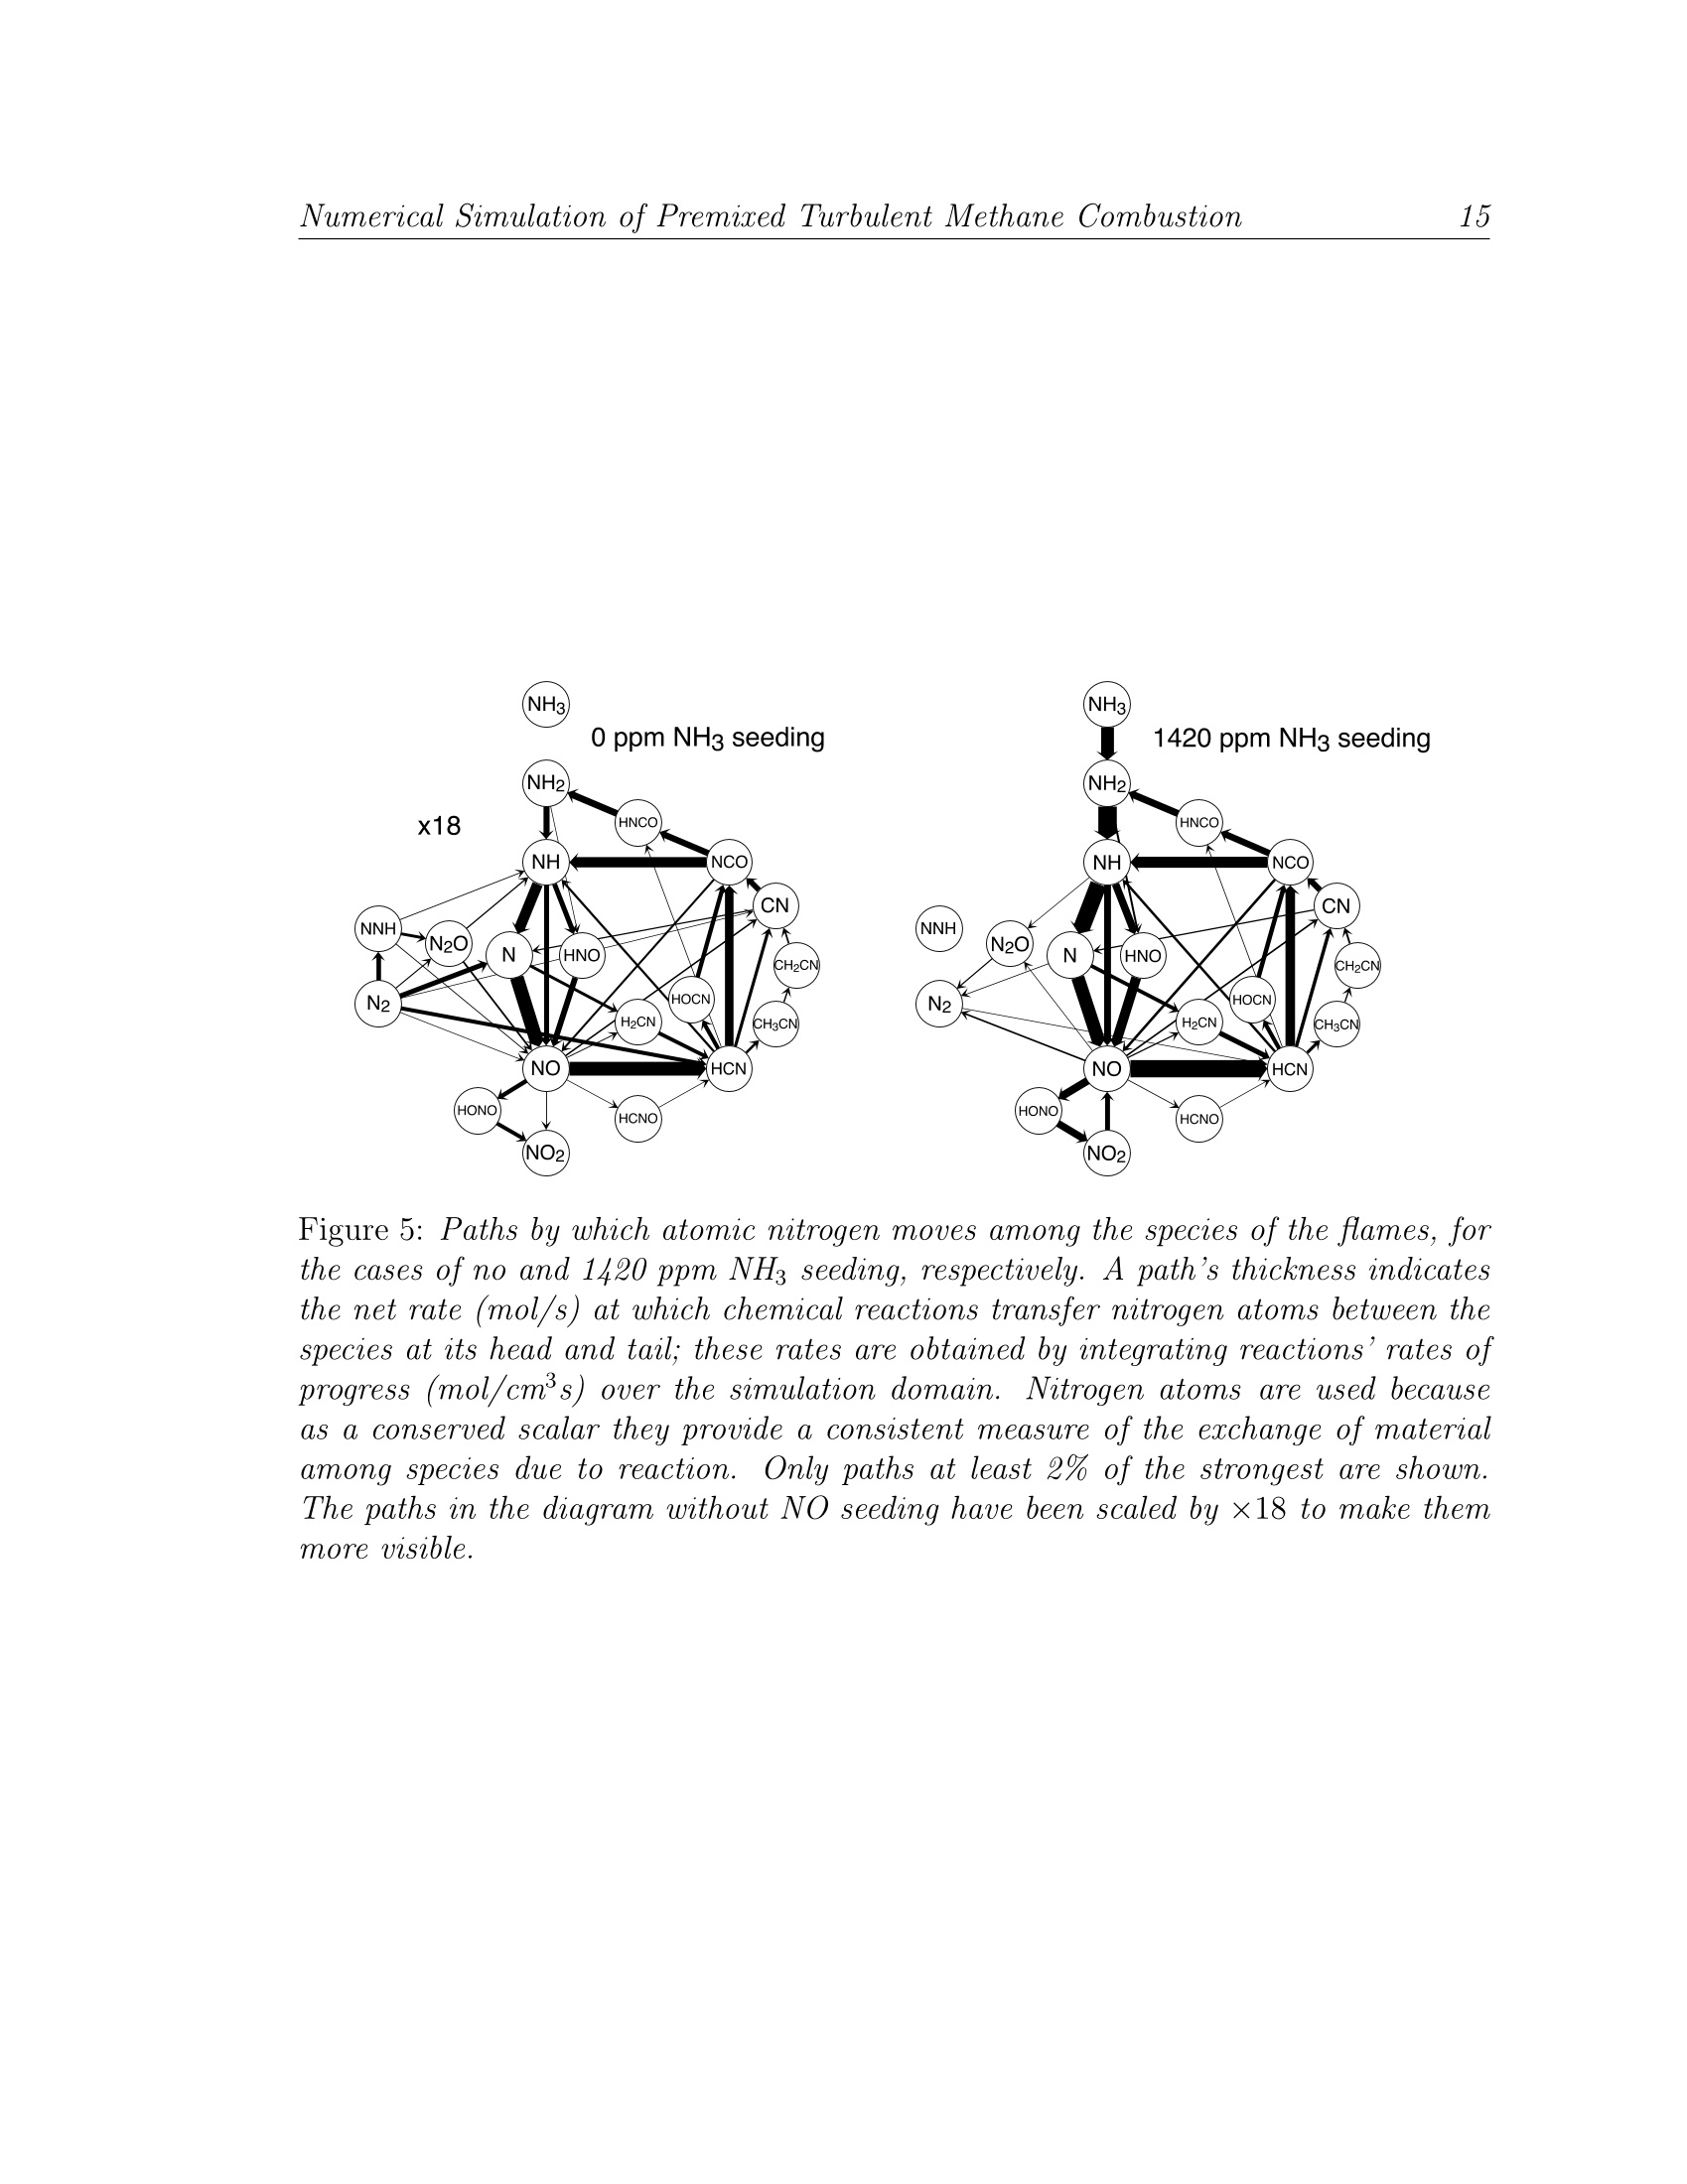
laser-induced fluorescence imaging measurements for a range of ammonia injection
rates. For comparison with the experimental data, synthetic LIF images
are calculated based on the numerical data accounting for temperature and
fluorescence quenching effects. We demonstrate good agreement between measurements
and computations. The LIF corrections inferred from the simulation
are then used to calculate absolute NO mole fractions from the measured signal.
方案详情

LBNL-49333 Numerical Simulation of Premised Turbulent Methane Combustion2 Detailed modeling and laser-induced fluorescence imaging of nitric oxide in a NH-seeded non-premixed methane/air flame John B. Bell, Marcus S. Day, Joseph F. Grcar Computing Sciences DirectorateLawrence Berkeley National Laboratory Berkeley, California, 94720, USA Wolfgang G. Bessler, Christof Schulz University of HeidelbergIm Neuenheimer Feld 25369120 Heidelberg, Germany Peter Glarborg,Anker D. Jensen Department of Chemical Engineering Technical University of Denmark DK-2800, Lyngby, Denmark This work was supported under the SciDAC Program by the Director, Office of Sci-ence, Office of Advanced Scientific Computing Research, Mathematical,Information,and Computational Sciences Division of the U.S. Department of Energy, contract No.DE-AC03-76SF00098. Detailed modeling and laser-induced fluorescence imaging of nitric oxidein a NH-seeded non-premixed methane/air flame Abstract In this paper we study the formation of NO in laminar, nitrogen dilutedmethane diffusion flames that are seeded with ammonia in the fuel stream.We have performed numerical simulations with detailed chemistry as well aslaser-induced fluorescence imaging measurements for a range of ammonia injec-tion rates. For comparison with the experimental data, synthetic LIF imagesare calculated based on the numerical data accounting for temperature andfluorescence quenching effects. We demonstrate good agreement between mea-surements and computations. The LIF corrections inferred from the simulationare then used to calculate absolute NO mole fractions from the measured signal. The NO formation in both doped and undoped flames occurs in the flamesheet. In the undoped flame, four different mechanisms contribute to NO for-mation. The present calculations show the most important pathway is promptNO, followed by the NNH mechanism, thermal NO and the N20 mechanism.As the NH3 seeding level increases, fuel-NO becomes the dominant mechanismand N2 shifts from being a net reactant to being a net product. Nitric oxidein the undoped flame as well as in the core region of the doped flames are un-derpredicted by the model; we attribute this mainly to inaccuracies in the NOrecycling chemistry on the fuel-rich side of the flame sheet. Introduction Oxidation of fuel-bound nitrogen is the dominant source of nitric oxide in com-bustion of solid fuels such as coal and biomass. Most of the fuel-nitrogen is releasedwith the volatiles during devolatilization and subsequently oxidized in gas-phase dif-fusion flames. Despite the importance of fuel-NO, comparatively little work has beenreported on conversion of reactive nitrogen species in non-premixed flames. Studies of laminar diffusion flames doped with fuel-N show that the species com-position of gas-phase fuel-N does not have a significant effect on NO yield [20]. Themajor parameters for fuel-N selectivity towards NO or N2 appear to be the fuel-Ndopant level and the flame configuration. At typical fuel-N/fuel ratios of about 1%,the conversion efficiency to NO is often below 30% for non-premixed flames20,25.This is remarkably lower than the values of 80-100% reported for lean premixed flameswith similar fuel-N seeding amounts 14,30. Despite the considerable progress overthe last decade in modeling laminar non-premixed flames with detailed chemistry (see [2, 23, 24] and references therein), no study of fuel-nitrogen effects has been performeduntil recently. Sullivan et al. [25] conducted a combined experimental and modeling investigationof NO, formation in nitrogen-diluted laminar methane diffusion flames seeded withammonia. The computations were performed with a two-dimensional model that in-cluded detailed chemical kinetics. The model showed good agreement with exhaustgas concentrations of NO over a wide range of NH seeding. In particular, the declin-ing efficiency of NH3 to NO conversion with increased fuel-ammonia in nonpremixedflames [220] was observed both experimentally and in the simulations. Based on anal-ysis of the calculations, the changes in NO formation and consumption mechanismswith increasing amounts of ammonia in the fuel were identified. Even though the agreement between model and experiments in the work of Sulli-van et al. is encouraging, flue data alone are insufficient for model validation. For thispurpose in-flame measurements are required,providing detailed characterization ofthe flame structure. In the present work we combine high-resolution numerical simu-lations with laser-induced fluorescence (LIF) imaging measurements to study steadylaminar diffusion flames with various levels of fuel-N. The present experimental set-up involves axisymmetric laminar coflowing non-premixed CH4/air flames doped with NH3, similar to those studied by Sullivan et al.The calculations are performed with a two-dimensional model[7]using the reactionmechanism proposed by Glarborg et al. [11]. The objective of this work is partly tovalidate the model and partly to analyze further the NO formation mechanisms innon-premixed flames doped with fuel-N. In the following sections we describe both the experimental setup and the com-putational methodology used in this study. We then provide a detailed comparisonbetween the numerical results and the measured data. Finally, we discuss how addedammonia affects the nitrogen chemistry within the flames. Experiment Background Laser-induced fluorescence is frequently used as a non-intrusive technique forquantitative measurements of NO concentrations and temperatures in combustionprocesses. Quantitative NO-imaging has been performed in laminar [15] and turbulent5,17atmospheric-pressure and high-pressure4,12 flames. LIF-based thermometryhas been performed using the NO molecule as a temperature probe. Rotational [26as well as vibrational [3] temperatures have been measured using one- [26], two-[3,26]or multi-line 4,28techniques. The dependence of NO-LIF intensity, ILIF, for weak, non-perturbing laser excita- tion is given by ILir depends on the number density of the excitable molecules (number density Nnotimes the Boltzmann fraction fB,i), the Einstein coefficient Bi,k for absorption i →k,the spectral overlap fraction gx,i(p,T,X) of the laser spectral profile and the NOabsorption spectrum, and the fluorescence quantum yield A/(ZA+Q), where A andQ are decay rates due to spontaneous emission and electronic quenching, respectively.The summations account for overlapping transitions and rotational energy transferin the excited state. Q is calculated using temperature-dependent quenching cross-sections from Paulet al. [19]. The overlap fraction gx,i is calculated using Doppler and pressure broad-ening as well as collisional shifting models 6,8,9,29. NO transition frequencies androtational line strengths are calculated using relations from Paul [18], with vibrationaltransition probabilities from Laux and Kruger[13]. Equation 1 thus provides a quantitative relationship between ILIF and the NOnumber density NNo or mole fraction XNo = NNop/kT. Its evaluation requiresknowledge of temperature,T, and species mole fractions, X. Temperature is measured in a two-line approach using NO excitation from differentvibrational ground states[3]. The large difference in ground state energies provideshigh temperature sensitivity at combustion temperatures (900-3000 K). The NO tran-sitions we use for thermometry and concentration measurements are the A-X(0,0)Ri1+Q21(21.5) feature at 225.25 nm and the A-X(0,2) O12 bandhead at 247.94 nm.The choice of these transitions is governed by the availability of a tunable KrF ex-cimer laser that can be used directly or in combination with a hydrogen Raman cellto generate the required wavelengths in the (0,0) and (0,2) band, respectively [10]. Setup The investigations are carried out at atmospheric pressure in a modified Tarantype burner [16] consisting of an inner (fuel, 1.0 cm diameter) and an outer (oxidizer,3.25 cm diameter) tube. The reaction zone is enclosed by a fused silica tube (3.35cm diameter) to stabilize the flame. Constant gas flows are provided by mass flowcontrollers (Tylan, Bronkhorst). The oxidizer is air (6.26 l/min). For the fuel flow,methane (0.103 l/min) is diluted with a nitrogen/NHg mixture (0.151 l/min) withvarious amounts of NH3. Experimental and computational results are reported herefor 0, 260, 420, 590, 790 and 1420 ppm of NH in the fuel. For the temperaturemeasurements, the fuel is seeded with 260 ppm NO (no NH3) to yield high LIF-signalintensities in all regions of the flame. The beam from a tunable, narrowband (Av =0.6 cm-1) KrF excimer laser(Lambda Physik, EMG 150) is used to pump a Raman shift cell (H2, 8 bar).APellin-Broca prism and a slit aperture separate the fundamental frequency (~ 248nm) and the first anti-Stokes line (≈ 225 nm). A cylindrical lens and aligned withthe center of the flame forms each laser beam into a vertical light sheet (30×0.8 mm²cross-section). The laser energy is detected by a fast photodiode. LIF-signals arefocused (Nikon, f=105 mm, f#=4.5) onto an intensified CCD camera (LaVision,StreakStar, 100 ns exposure time). Reflection bandpass filters in combination with a248 nm short-pass filter isolate the NO (0,1) fluorescence around 236 nm from LIFsignal interference and from elastically scattered light for both excitation wavelengths.The raw images are corrected for spatial and temporal laser energy fluctuations. Theremaining background is corrected by taking data with the laser tuned off the NOresonance. Calibration of both temperature and NO concentration is performed in a lean(中=0.92) premixed ethylene/air flame.from CARS measurements [1]. The LIF signal is calibrated using a standard additiontechnique by seeding 100-1500 ppm NO into the lean premixed flame [4,5,27]. Forcorrect application of this technique, a loss of 10% of the added NO due to reburnreactions in the flame front must be accounted for 15,21,31]. Simulation Methodology The numerical simulations evolve a low Mach number model [7] to a steady state.The axisymmetric model includes conservation equations for species mass and totalenthalpy, and incorporates a detailed chemical mechanism due to Glarborg, et al. [11],with transport properties from Sullivan et al. [25]. The numerical algorithm is basedon a sequential predictor-corrector formulation, using a Godunov upwind method foradvection terms, and a semi-implicit (Crank-Nicholson) treatment of diffusion. Thechemical kinetics are integrated using implicit backward-difference methods. The lowMach number formulation introduces an elliptic constraint on the velocity field; amodified projection method enforces this constraint on the solution. The simulations use an adaptive numerical grid, which increases resolution in theflame zone.This affords a large computational domain extending throughout theentire quartz tube (radius 1.675 cm, length 30.15 cm). A five-level adaptive gridhierarchy is used, where each level is a factor of two finer than the next coarser level.The finest cells (in the flame zone) are approximately 65 um on a side. This adaptivemethodology has been shown to provide accurate predictions of NO, formation inammonia-enriched non-premixed flames 25. Comparison of Experiment and Simulation Flame Height The simulated and experimental flames show a noticeable discrepancy in height.If h is the height above the burner exit of the flame front in the center of the flame,we find hf,erp.=21.5 mm and hfsim= 30 mm for the flame seeded with 1420 ppmNH. We believe this arises from differences between conditions at the burner exit inthe experiments and the boundary conditions in the simulations. The burner housingis water-cooled to 283 K which the simulations assume is also the temperature ofthe inflowing gases and of the burner tip. Further, the simulations assume fullydeveloped laminar flow of the entering fuel and oxidizer, though measurements toverify this assumption are not available. Nevertheless, the experimental and numerical flames are self-similar and the dif-ferences in the flame length do not appear to affect the chemistry. Therefore, forthe remainder of the paper we scale the computational results vertically to matchthe experimental flame height. The resulting images shown here represent an area of16×30 mm2. Temperature Fields Figure 1 compares experimental and computed temperature fields for the flamesconsidered here. The temperature is measured using the two-line technique[3] de-scribed in the background section with 260 ppm of NO seeded in the fuel to providehigh LIF intensities throughout the flame. The vertical stripes at the sides of theflame are due to laser beam reflections on the quartz cylinder. The overall error ofthe LIF temperature measurement is within ±5.5%, which corresponds to~ 100 Kat the maximum flame temperature. This error estimate is based on experimentalprecision, accuracy of the CARS temperature calibration 1, and uncertainties in theNO spectroscopic data used in the two-line data reduction. The agreement between measurement and computation is excellent. The principaldifferences are that the computations predict higher temperature in the lower portionof the flame and the measured temperature shows a slightly broader region of hightemperature near the flame tip. Comparison of Observed and Synthetic LIF Signals Typically, experimental data is processed to obtain mole fractions of the quantityof interest for direct comparison to simulation results. As discussed above, conversionof the NO-LIF signal to quantitative NO mole fractions requires corrections for local temperature and species concentrations that are only known approximately. Thequenching correction is particularly delicate for nonpremixed flames [22]. On the other hand, all of the data required to compute ILiF are available from thesimulation except the calibration constant Ccal which connects ILIF/llaser to a stan-dard LIF intensity emitted from a known NO concentration at the local T and X ofthe calibration flame. Rather than compare processed LIF data with simulations, wecompute synthetic NO-LIF images using the simulation results and compare thosedirectly with the unprocessed LIF signals. The model then consists of both the sim-ulation results (based on our understanding of fluid dynamics and chemical kinetics)and the fluorescence calculation (based on our understanding of NO molecular spec-troscopy). The experimental data consist of the measured signal corrected for spatialvariations in laser energy. Figure 2 compares such “synthetic”LIF with the calibrated, experimental LIFimages with A-X(0,0) excitation for flames with different NH seeding concentrations.The over-all agreement between the measured LIF and the synthetic LIF is excellent.The simulations, however, predict a weaker signal in the lower central part of theflame, which also shows slight differences in shape. NWith decreasing NH seeding,the simulations increasingly underpredict the measured NO-LIF signals not only inthe flame center, but also in the flame sheet. Similar conclusions can be drawn fromimages from a higher ground state (A-X(0,2) excitation) which are not shown forreasons of space. NO Concentration To investigate the quantitative agreement in more detail we derive NO concen-trations from the calibrated experimental NO A-X(0,0) LIF data in Fig. 2.Theexperimental temperatures (Fig. 1) are used for Boltzmann and overlap fraction cor-rections. Quenching corrections are derived from the simulated concentrations of themajor species CO, CO2, H2O, N2, and O2; this approach has been used before [23],though not for fuel-N seeded flames. For relative NO concentrations the error boundsare ±9-10% depending on the position in the flame.Following a standard errorpropagation calculation, uncertainties in temperature, quenching rate, and the LIFexperiment (laser energy, detection, image noise) contribute in approximately equalamnoo1unts. The dependence on position is due to the variation of the LIF tempera-ture sensitivity with local temperature. The additional inaccuracy of the calibrationprocedure yields a total error within ±13-15%for absolute NO concentrations. Essentially the same concentrations are obtained by using NO A-X(0,2) data (notshown here). However, signal/noise decreased because of the higher temperaturesensitivity and lower signal levels, leading to an uncertainty of up to ±23% in thecolder, central region of the flame. Figure 3 displays the experimental and simulated NO concentration fields. Due to the corrections for temperature and fluorescence quenching, the spatial distributionof NO differs from what might be anticipated by examining the LIF data in Fig. 2.In particular, the strong LIF signal in the central, cooler part of the flame observedin Fig. 2 is not actually indicative of an extremely high NO concentration. NO concentration profiles are shown in Fig. 4.The profiles at 1 cm above theburner exit intersect the middle of the region of intense LIF signal in the lower partof the frames in Fig. 2. As already evident from the LIF images, the simulationsunderpredict NO concentrations in the cool center of the flame at this elevation.However, as can be seen in the right half of the figure, at higher elevations theagreement between experiment and simulation is very good for all but the lowestlevel of NH seeding. Discussion Integrated Nitrogen Reaction Paths We use integrated reaction path diagrams to summarize the nitrogen chemistryin the simulations. Fig. 5 shows how nitrogen moves through the chemical species ofthe flames with 0 and 1420 ppm of NH seeding. The diagrams reveal the extent towhich the nitrogen chemistry is quickly dominated by fuel bound nitrogen. With no NH seeding, all nitrogen chemistry stems from N2. Due to the largerange of conditions occurring in the nonpremixed flame, no less than four mecha-nisms contribute to NO: thermal NO (initiating in paths N2 -N,NO), prompt NO(paths N2 -N,HCN), the N20 (path N2→N2O), and the NNH mechanism (pathN2→NNH). Prompt NO is most important for NO formation, with the NNH mech-anism a surprising second. In the fuel-rich parts of the flame where hydrogen atomsreach high concentrations,N2 and NNH are almost in partial equilibrium. Subsequentreactions NNH+0→N2O+Hor NH+NO initiate a reaction sequence that yieldssignificant amounts of NO. With NH3 added to the flame, fuel-NO becomes important. At 1420 ppm NHseeding, the amine chemistry has reversed the net flow of nitrogen atoms out ofmolecular nitrogen, which is now a net product. In both doped and undoped flamesthere is considerable recycling of nitrogen through cyano species.The results areconsistent with the observations of Sullivan et al. [25] who offer a detailed discussionof the nitrogen chemistry in these flames based on simulations. Location of Peak NO Concentration The fuel-nitrogen level affects not only the chemical mechanism for NO formation,but also the location of peak NO concentration. Thermal and prompt NO, whichdominate at zero or low fuel-N levels, occur in the thin, parabola-shaped flame sheet. As can be seen in the faint 0 ppm case of Fig. 3, NO concentrations just to theoutside of the flame sheet increase with elevation leading to a peak in concentrationdownstream of the flame tip. As the fuel-N seeding of the flame increases, however, the peak NO concentrationspreads throughout the flame sheet (Fig. 3). Specifically, in the case of 1420 ppm NH3seeding, the simulation shows that a peak NO level of about 210 ppm occurs in a thinregion that overlaps the parabola-shaped flame sheet. On the centerline, both peakNO and peak T =1810 K occur at a height of z =2.1 cm. The NO concentrationdrops off smoothly on the lean side of the flame as the NO mixes with other gases. NO in the Low-Temperature Flame Center As the LIF images show, there is also some NO inside the low-temperature flamecore. This can be attributed to diffusion and convection of NO and NO2 from theflame sheet. The small amount of NO formed inside the core is largely due to reductionof NO2, for instance by the reaction CO+NO2. In contrast, the major NO producingreaction in the flame sheet, N+OH→NO +H, creates 0.26 mol/m’s of NO justinside the flame tip, at z=2.0 cm, and reaches as high as 2.0 mol/m’s at the baseof the flame sheet. This is four orders of magnitude more than any reactions thatproduce NO in the flame core. The LIF images also show a very faint depletion zone for NO on the centerline.This is also indicated by the simulation. For example, for 1420 ppm NH3 seeding, NOon the centerline has a local peak of 90 ppm at z=1.2 cm, then dips to 77 ppm at z= 1.8 cm, before rising to 210 ppm at z =2.1 cm at the flame tip. The slight drop isdue to reactions such as CH3+NO→H2CN+OH which occurs at the rate of about10-5 mol/m’s over the range from z = 1.5 to 1.8 cm. For perspective on the strengthof this reaction, the major NO consuming reaction is HCCO +NO→HCN+ CO2.This occurs along and just inside the flame sheet and peaks at 0.25 mol/m’s at z=2.0 cm. Due to the low temperatures and thereby low radical levels, the reactions consum-ing NO in the flame core are too slow to explain the differences between the measuredand simulated NO concentrations in this region (Fig.4). We attribute the discrep-ancy to overpredicting the NO consumption on the fuel-rich side of the flame sheet.Some refinement of the NO recycle chemistry, in particular related to the HCCO+NOreaction, may improve the agreement between the measured and simulated NO con-centrations in the low-temperature flame core, as well as the general agreement forthe flames with low NH seedings. Concluding Remarks The good agreement obtained between the experimental data and the simulationssupports the present modeling approach and confirms that it is possible to describe theconversion of fuel nitrogen in laminar nonpremixed flames. Through analysis of themodeling results we can obtain a good understanding of details of the flame structureand the impact of physical and chemical parameters on the conversion selectivity offuel nitrogen to NO or N2. The ability to predict reliably the conversion of fuel-N as afunction of process parameters in laminar nonpremixed flames is of significant interest,since there are important similarities to practical flames. This work represents a stepforward towards the goal of understanding and modeling fuel-N conversion in practicalcombustors. ( References ) .1]A. Arnold, B. Lange, T. Bouche, T. Heitzmann, G. Schiff,W. Ketterle,P. Monkhouse, and J. Wolfrum. Absolute temperature fields in flames by2D-LIF of OH using excimer lasers and CARS spectroscopy. Ber. Bunsenges.Phys. Chem., 96:1388-1392,1992. 21B. A. V. Bennett, C. S. McENally, L. D. Pfefferle,M. D. Smooke, and M. B.Colket. Computational and experimental study of axisymmetric coflowpartially premixed ethylene/air flames. Combust. Flame, 127:2004-2022, 2001. 3W. G. Bessler, F. Hildenbrand, and C. Schulz. Two-line laser-inducedfluorescence imaging of vibrational temperatures in a NO-seeded flame. Appl.Opt., 40:748-756,2001. [4] W. G. Bessler, C. Schulz, T. Lee, D.-I. Shin, M. Hofmann, J. B. Jeffries,J. Wolfrum, and R. K. Hanson. Quantitative NO-LIF imaging in high-pressureflames. Appl. Phys. B, 2002. submitted. S. Bockle, J. Kazenwadel, T. Kunzelmann, and C. Schulz. Laser-diagnosticmulti-species imaging in strongly swirling natural gas flames. Appl. Phys. B,71:741-746,2000. ( 6A. Y. Chang, M. D. DiRosa,and R. K. Hanson. Temperature dependence ofcollision broadenin g and shi f t in the NO A ←X(0 , 0) band in the p r esence ofargon and nitrogen. J . Q uant. Spectrosc. R a diat. T r ansfer, 47:375-390, 1992. ) ( 7 M. S . Day and J. B. B ell. Numerical s imulation o f laminar r eacting flows withcomplex chemistry. Combust. Theory Modelling, 4:535 - 556,2000. ) [8]M.D. DiRosa and R. K. Hanson. Collision-broadening and -shift of NOy(0,0)absorption lines by H2O, 02, and NO at 295K. J. Mol. Spectrosc.,164:97-117,1994. 9)MM. D. DiRosa and R. K. Hanson. Collision broadening and shift of NOy(0,0)absorption lines by O2 and H20 at high temperature. J.Quant. Spectrosc.Radiat. Transfer, 52:515-529,1994. [10] T. Dreier, A. Dreizler, and J. Wolfrum. The application of a Raman-shiftedtunable KrF eximer laser for laser-induced fluorescence combustion diagnostics.Appl. Phys. B, 55:381-387,1992. ( [11] P. Glarborg, M. U . A lzueta, K. D a m-Johansen, and J. A. M iller. Kineticmodelling of hydrocarbon/nitric oxide interactions in a flow reactor. C o mbust.Flame, 115:1-27,1998. ) [12 F. Hildenbrand, C. Schulz, J. Wolfrum, F. Keller,and E. Wagner. Laserdiagnostic analysis of NO formation in a direct injection diesel engine withpump-line-nozzle and common rail injection systems. Proc. Comb. Inst.,28:1137-1144,2000. [13] C. O. Laux and C. H. Kruger. Arrays of radiative transition probabilities forthe N2 first and second positive, NO beta and gamma, N, first negative, andO2Schumann-Runge band systems. J. Quant. Spectrosc. Radiat. Transfer,48:9-24,1992. 14R. J. Martin and N. J. Brown. Nitrous oxide formation and destruction in lean.premixed combustion. Combust. Flame, 80:238-255,1990. |15A. V. Mokhov, H. B. Levinsky, and C. E. van der Meij. Temperaturedependence of laser-induced fluorescence of nitric oxide in laminar premixedatmospheric-pressure flames. Appl. Opt., 36:3233-3243, 1997. 16|K. Miiller-Dethlefs, M. Peleat, and J.-P. Taran. Temperature and hydrogenconcentration measurements by CARS in an ethylene-air-bunsen flame. Ber.Bunsenges. Phys. Chem., 85(9):803-807,1981. 17|M. Namazian, J. Kelly, and R. Schefer. Simultaneous NO and temperatureimaging measurements in turbulent nonpremixed flames. Proc. Comb. Inst.,25:1149-1157,1994. 18P. H. Paul. Calculation of transition frequencies and rotational line strengths inthe y-bands of nitric oxide. J. Quant. Spectrosc. Radiat. Transfer, 57:581-589,1997. |19P. H. Paul, J. A. Gray, J. L. Durant, Jr., and J. W. Thoman Jr. A model fortemperature-dependent collisional quencing of NO A22+. Appl. Phys. B,57:249-259,1993. [20] A. F. Sarofim, G. C. Williams, M. Modell, and S. M. Slater. Conversion of fuelnitrogen to nitric oxide in premixed and diffusion flames. AIChE Symp. Ser.,71(148):51-61, 1975. [21]C. Schulz, V. Sick, U. Meier, J. Heinze, and W. Stricker. Quantification of NOA-X(0,2) LIF:investigation of calibration and collisional influences inhigh-pressure flames. Appl. Opt., 38:1434-1443,1999. [22] V. Sick, F. Hildenbrand, and P. Lindstedt. Quantitative laser-basedmeasuerment and detailed chemical kinetic modeling of nitric oxideconcentrations in methane-air counterflow diffusion flames. Proc. Comb. Inst.,27:1401-1409,1998. 23M. D. Smooke, A. Ern, M. A. Tanoff, B. A. Valdati,R. K. Mohammed, D. F.Marran, and M. B. Long. Computational and experimental study of NO in anaxisymmetric laminar diffusion flame. Proc. Comb. Inst., 26:2161-2170, 1996. 24M. D. Smooke, R. E. Mitchell, and D. E. Keyes. Numerical solution oftwo-dimensional axisymmetric laminar diffusion flames. Combust. Sci. Tech.,67:85,1989. [25]N. Sullivan, A. Jensen, P. Glarborg, M. S. Day, J. F. Grcar, J. B. Bell, C. Pope,and R. J. Kee. Ammonia conversion and NO formation in laminar coflowingnonpremixed methane-air flames. Combust. Flame, 2001. to appear. 26]M. Tamura, J. Luque, J. E. Harrington, P. A. Berg, G. P. Smith, J. B. Jeffries,and D. R. Crosley. Laser-induced fluorescence of seeded nitric oxide as a flamethermometer. Appl. Phys. B, 66:503-510,1998. [27]D. D. Thomsen and N. M. Laurendeau. LIF measurements and modeling ofnitric oxide concentration in atmospheric counterflow premixed flames.Combust. Flame, 124:350-369,2001. [28] A. O. Vyrodov,J. Heinze, M. Dillmann, U. E. Meier, and W. Stricker.Laser-induced fluorescence thermometry and concentration measurements onNO A-X (0, 0) transitions in the exhaust gas of high pressure CH4/air flames.Appl. Phys. B, 61:409-414, 1995. 29A. O. Vyrodov, J. Heinze, and U. E. Meier. Collisional broadening of spectrallines in the A-X (0-0) system of NO by N22, Ar, and He at elevated pressuresmeasured by laser-induced fluorescence. J. Quant. Spectrosc. Radiat. Transfer,53:277-287.1995. ( [30] J. O. L. Wendt and C. V. Sternling. E f fect of ammonia in gaseous fuels onNOx emissions. J. Air Poll. Control Ass., 24:1055- 1 058,1974. ) [31] B. A. Williams and J. W. Fleming. Comparative species concentrations inCH4/O2/Ar flames doped with N2O,NO, and NO2. Combust. Flame,98:93-106, 1994. Kelvin Figure 1: Experimental and computed temperature fields. (Left) The two-dimensionalregion shown ectends to a radius of 8 mm with a height from 0 mm to 30 mm above thenozzle ecit. The ecperimental field is black where signal/noise was too low for evalu-ation. (Right) Cross-sections of the experimental and computed temperature fields attwo elevations above the nozzle, 1 and 2 cm. Eperimental error bars are ±5.5%. Figure 2: NO A-X(0,0) excitation LIF images obtained (top) from measurement and(bottom) by synthetically processing the results of the flame simulation, for differentNH seeding concentrations. The experimental data and the synthetic LIF intensitiesare prepared independently. The color code is scaled in arbitrary units proportional tocalibrated NO-LIF intensities and is identical for the simulated and the experimentalimages. Figure 3: Experimental and computed NO concentration fields (ppm) for various leuelsof NH3 seeding in the fuel stream. Figure 4: Eaperimental and computed NO concentration profiles (ppm) at two differentelevations for various levels of NHs seeding in the fuel stream. Experimental error iswithin ±13-15% (see text). Figure 5: Paths by which atomic nitrogen moves among the species of the flames, forthe cases of no and 1420 ppm NH seeding, respectively. A path’s thickness indicatesthe net rate (mol/s) at which chemical reactions transfer nitrogen atoms between thespecies at its head and tail; these rates are obtained by integrating reactions’rates ofprogress (mol/cm’s) over the simulation domain. NIitrogen atoms are used becauseas a conserued scalar they provide a consistent measure of the exchange of materialamong species due to reaction. Only paths at least 2% of the strongest are shown.The paths in the diagram without NO seeding have been scaled by ×18 to make themmore uisible.
确定
还剩14页未读,是否继续阅读?

产品配置单

北京欧兰科技发展有限公司为您提供《掺氨非预混甲烷,空气,火焰,氮氧化物中PLIF,平面激光诱导荧光,成像,自由基,羟基,氮氧化物浓度检测方案(流量计)》,该方案主要用于其他中PLIF,平面激光诱导荧光,成像,自由基,羟基,氮氧化物浓度检测,参考标准--,《掺氨非预混甲烷,空气,火焰,氮氧化物中PLIF,平面激光诱导荧光,成像,自由基,羟基,氮氧化物浓度检测方案(流量计)》用到的仪器有PLIF平面激光诱导荧光火焰燃烧检测系统
推荐专场


相关方案
更多
该厂商其他方案
更多