


方案详情
文
Lifting surfaces are used both for propulsion and control of sea vessels and must meet performance criteria such as lift, drag, and (in some military applications)hydroacoustic noise limits. Design tools suitable to predict such criteria must handle complex flow phenomena and manage the wide range of flow scales inherent in marine
applications (Reynolds numbers ~108). To date, the development of such tools has been limited by the lack of controlled experimental data in this high Reynolds numbers range.
Lifting surface flow is the focus of current high Reynolds number experiments involving a two-dimensional hydrofoil in the world’s largest water tunnel, the US Navy’s William B. Morgan Large Cavitation Channel (LCC). The goal of these experiments is
to provide a unique high Reynolds number experimental dataset at chord-based Reynolds numbers (Re) approaching those of full-scale propulsors (~108). This data will be used for validation of scaling laws and computational models, with particular emphasis given
to the unsteady, separated, turbulent flow at the trailing edge. In addition, these experiments will provide fundamental insight into the fluid mechanics of trailing-edge noise generation in marine propulsion systems.
This paper describes the experimental equipment and methods employed in the test program. Described herein is the use of the LCC’s Laser Doppler Velocimetry (LDV) capability to acquire flow velocity mean and turbulence quantities, as well as estimates of boundary layer transition. Also presented is a Particle Imaging Velocimetry
(PIV) system developed for these experiments and employing seed injection upstream of the channel’s flow straightener. Finally, a description is given of instrumentation mounted in the foil for measurement of vibration and surface static and dynamic pressures.
方案详情

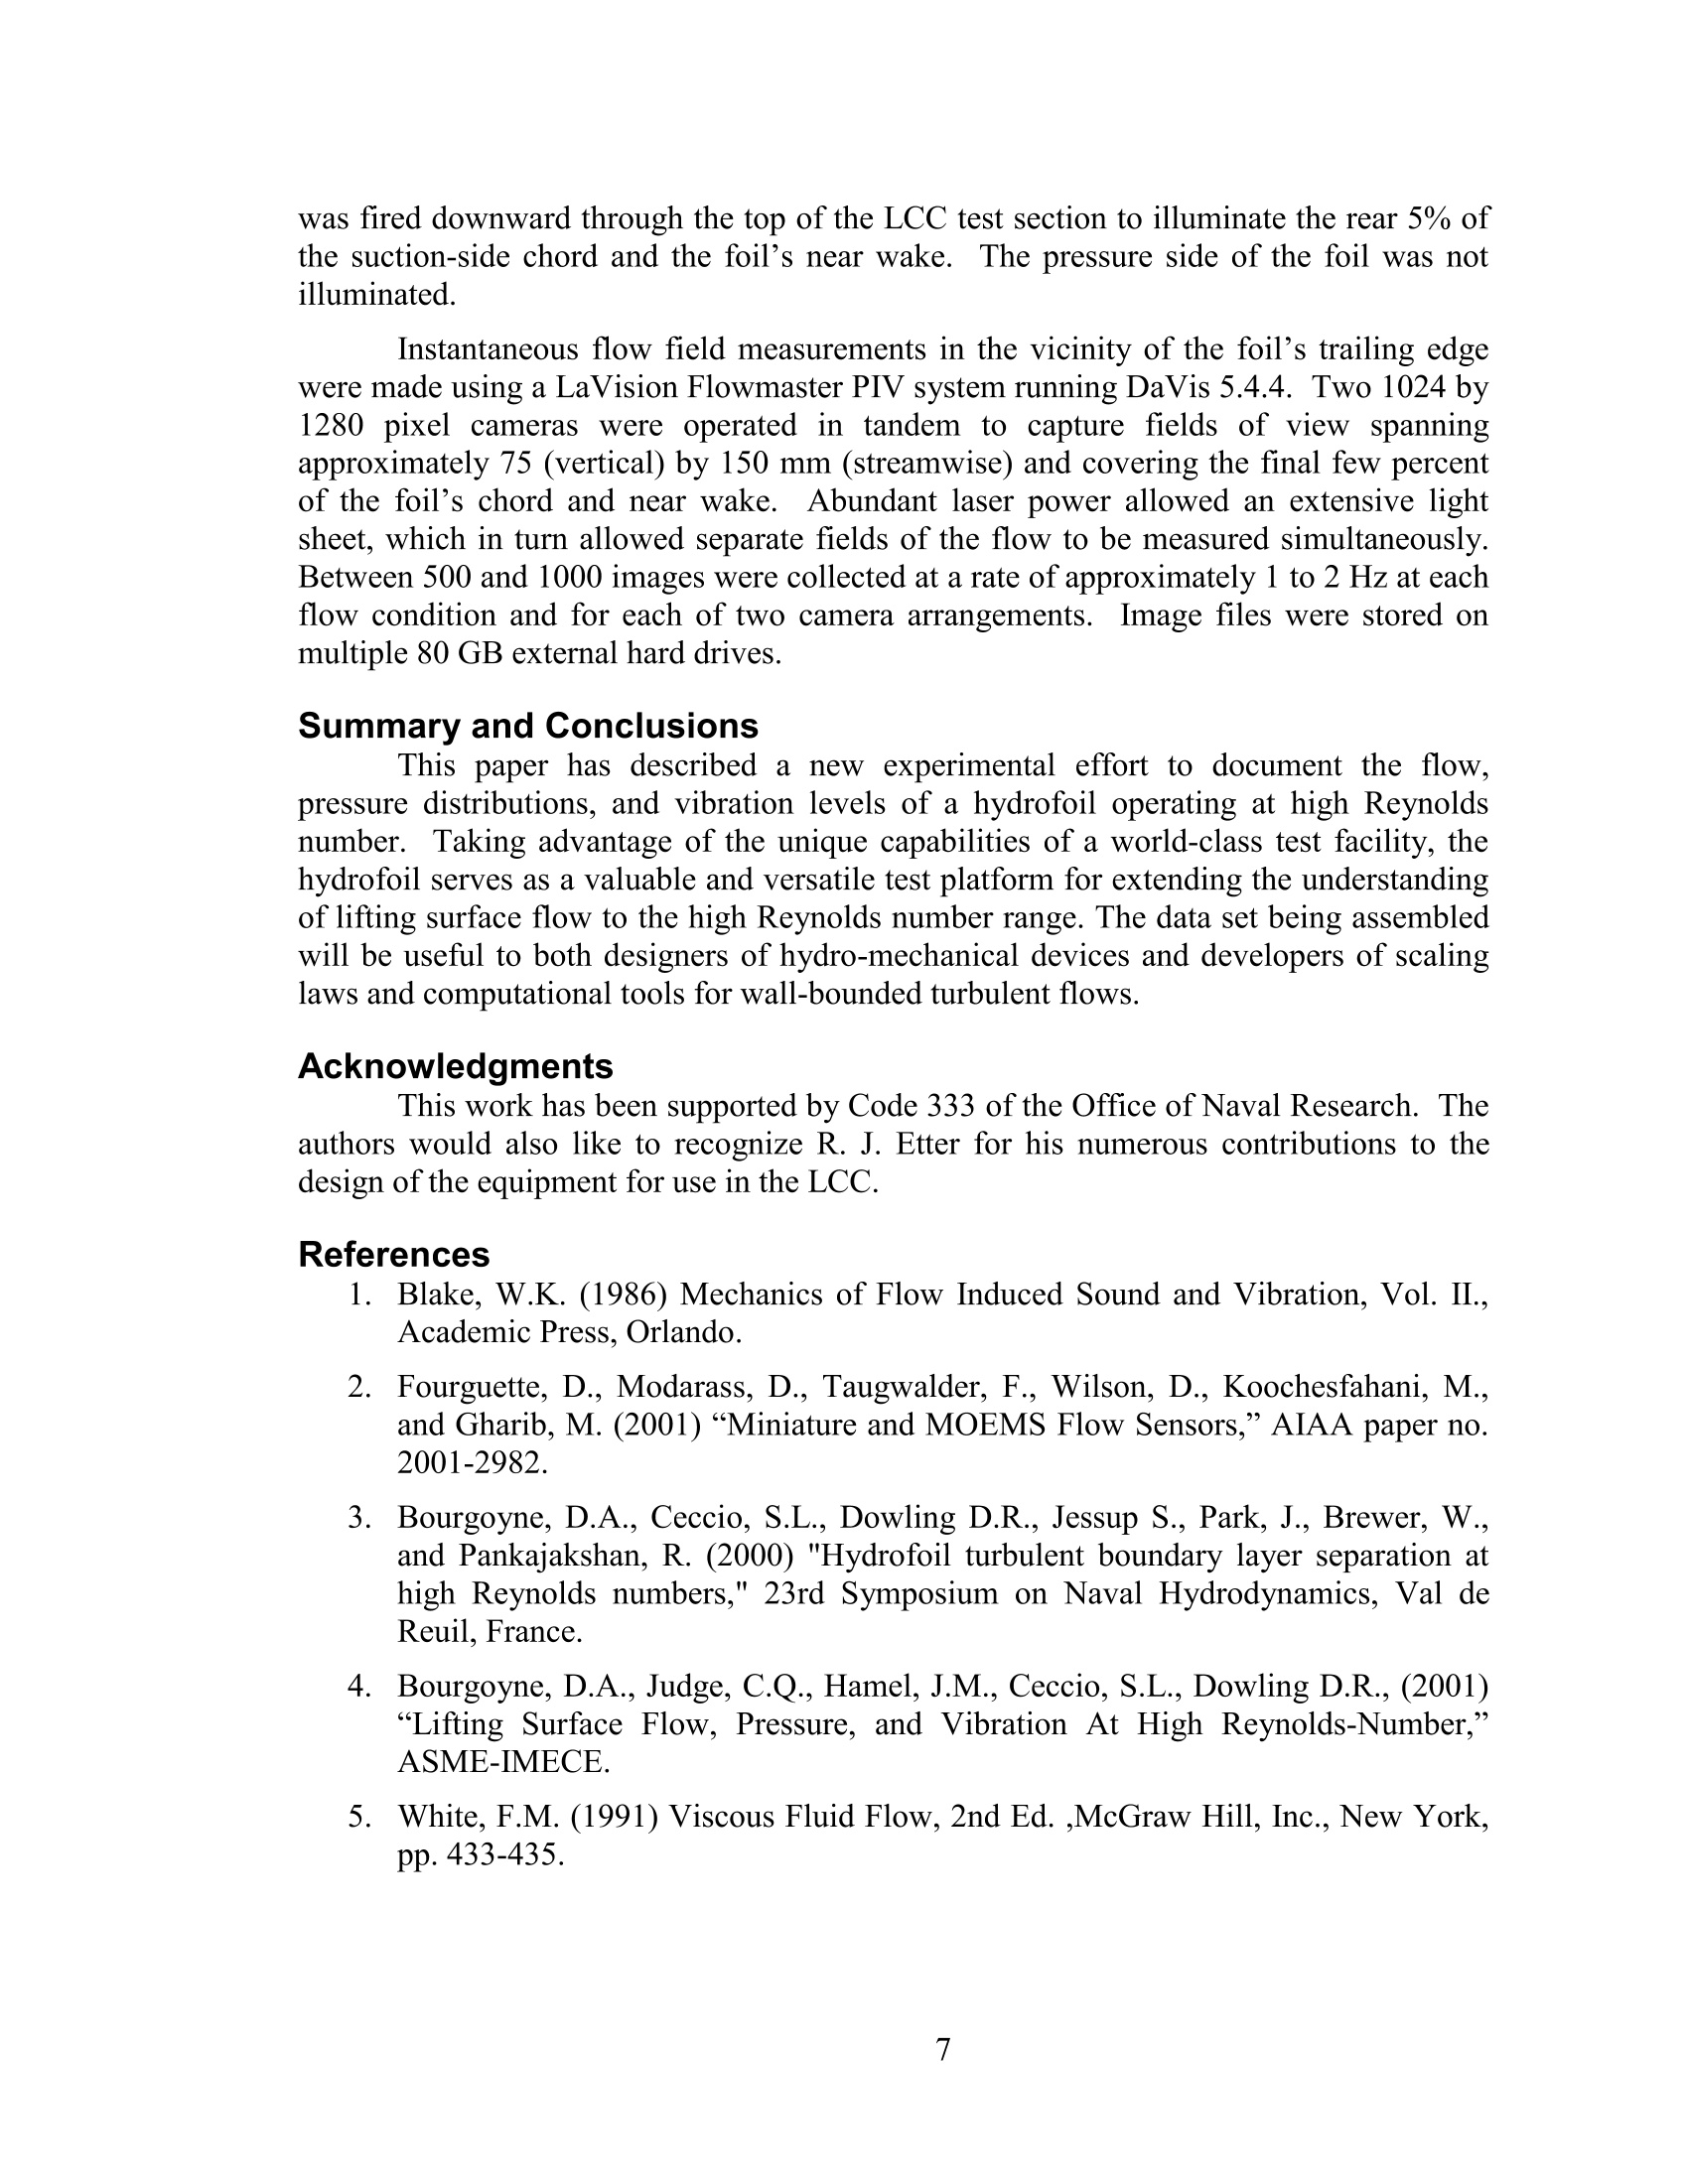
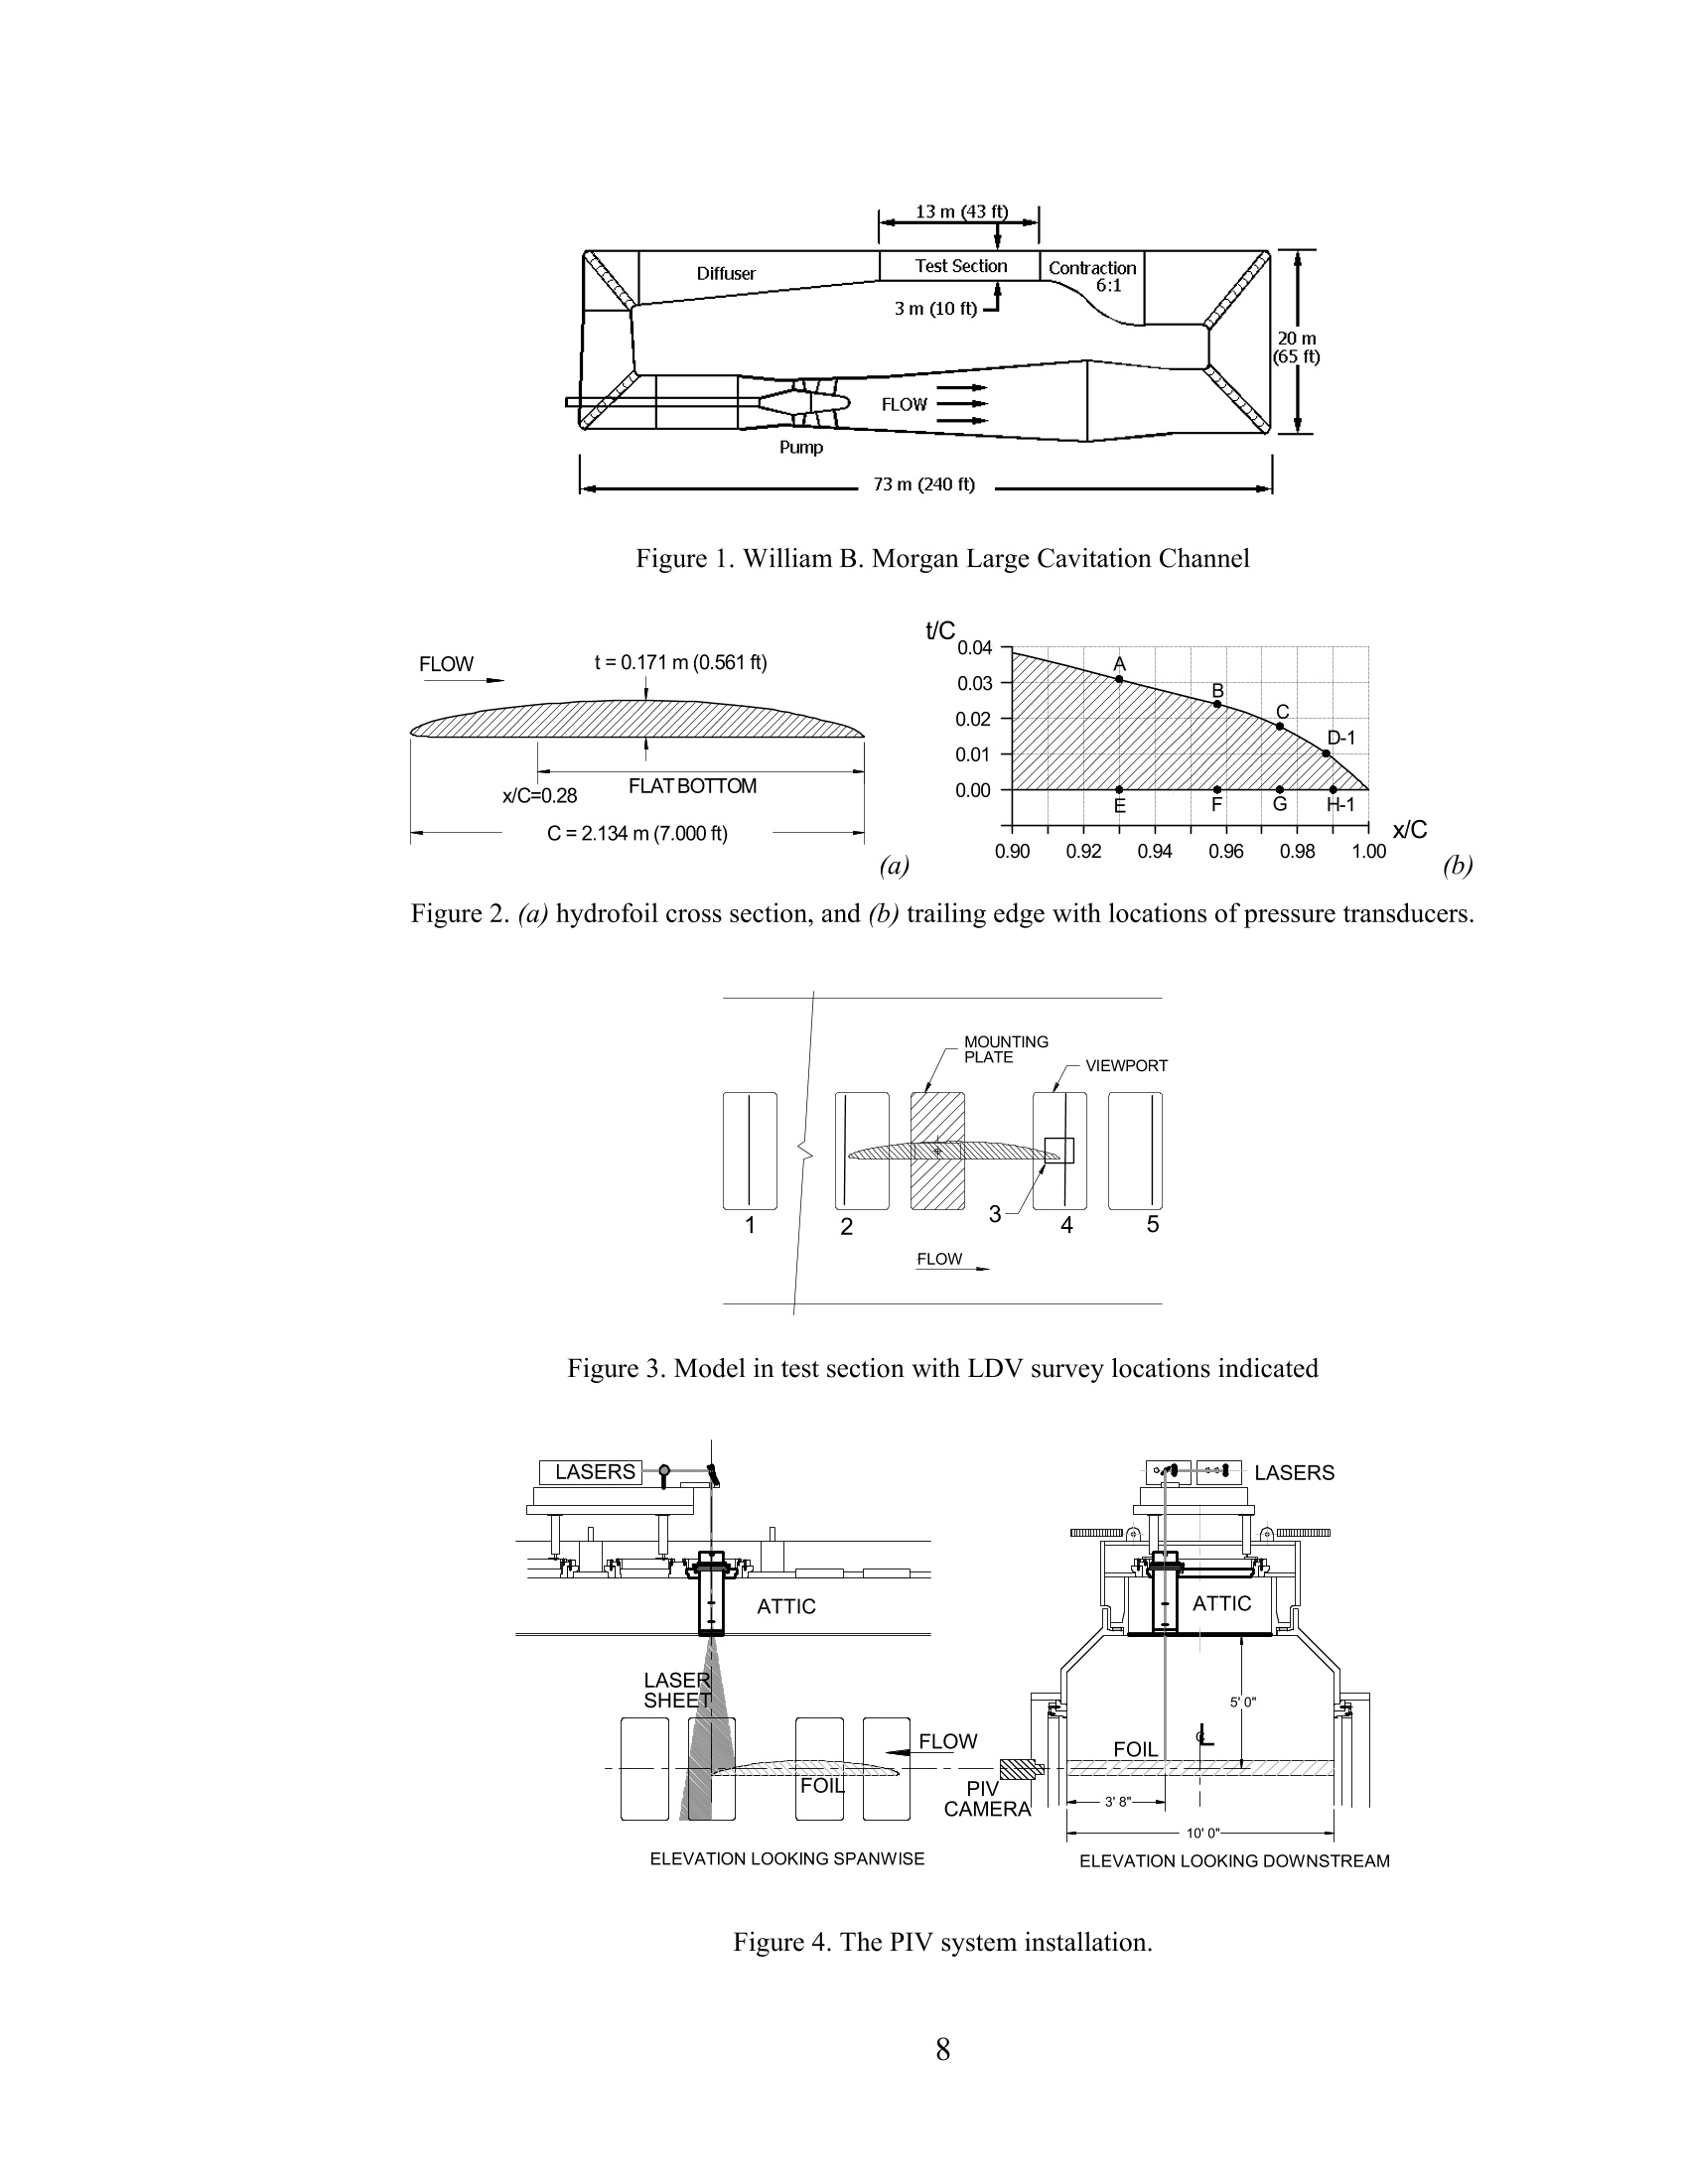
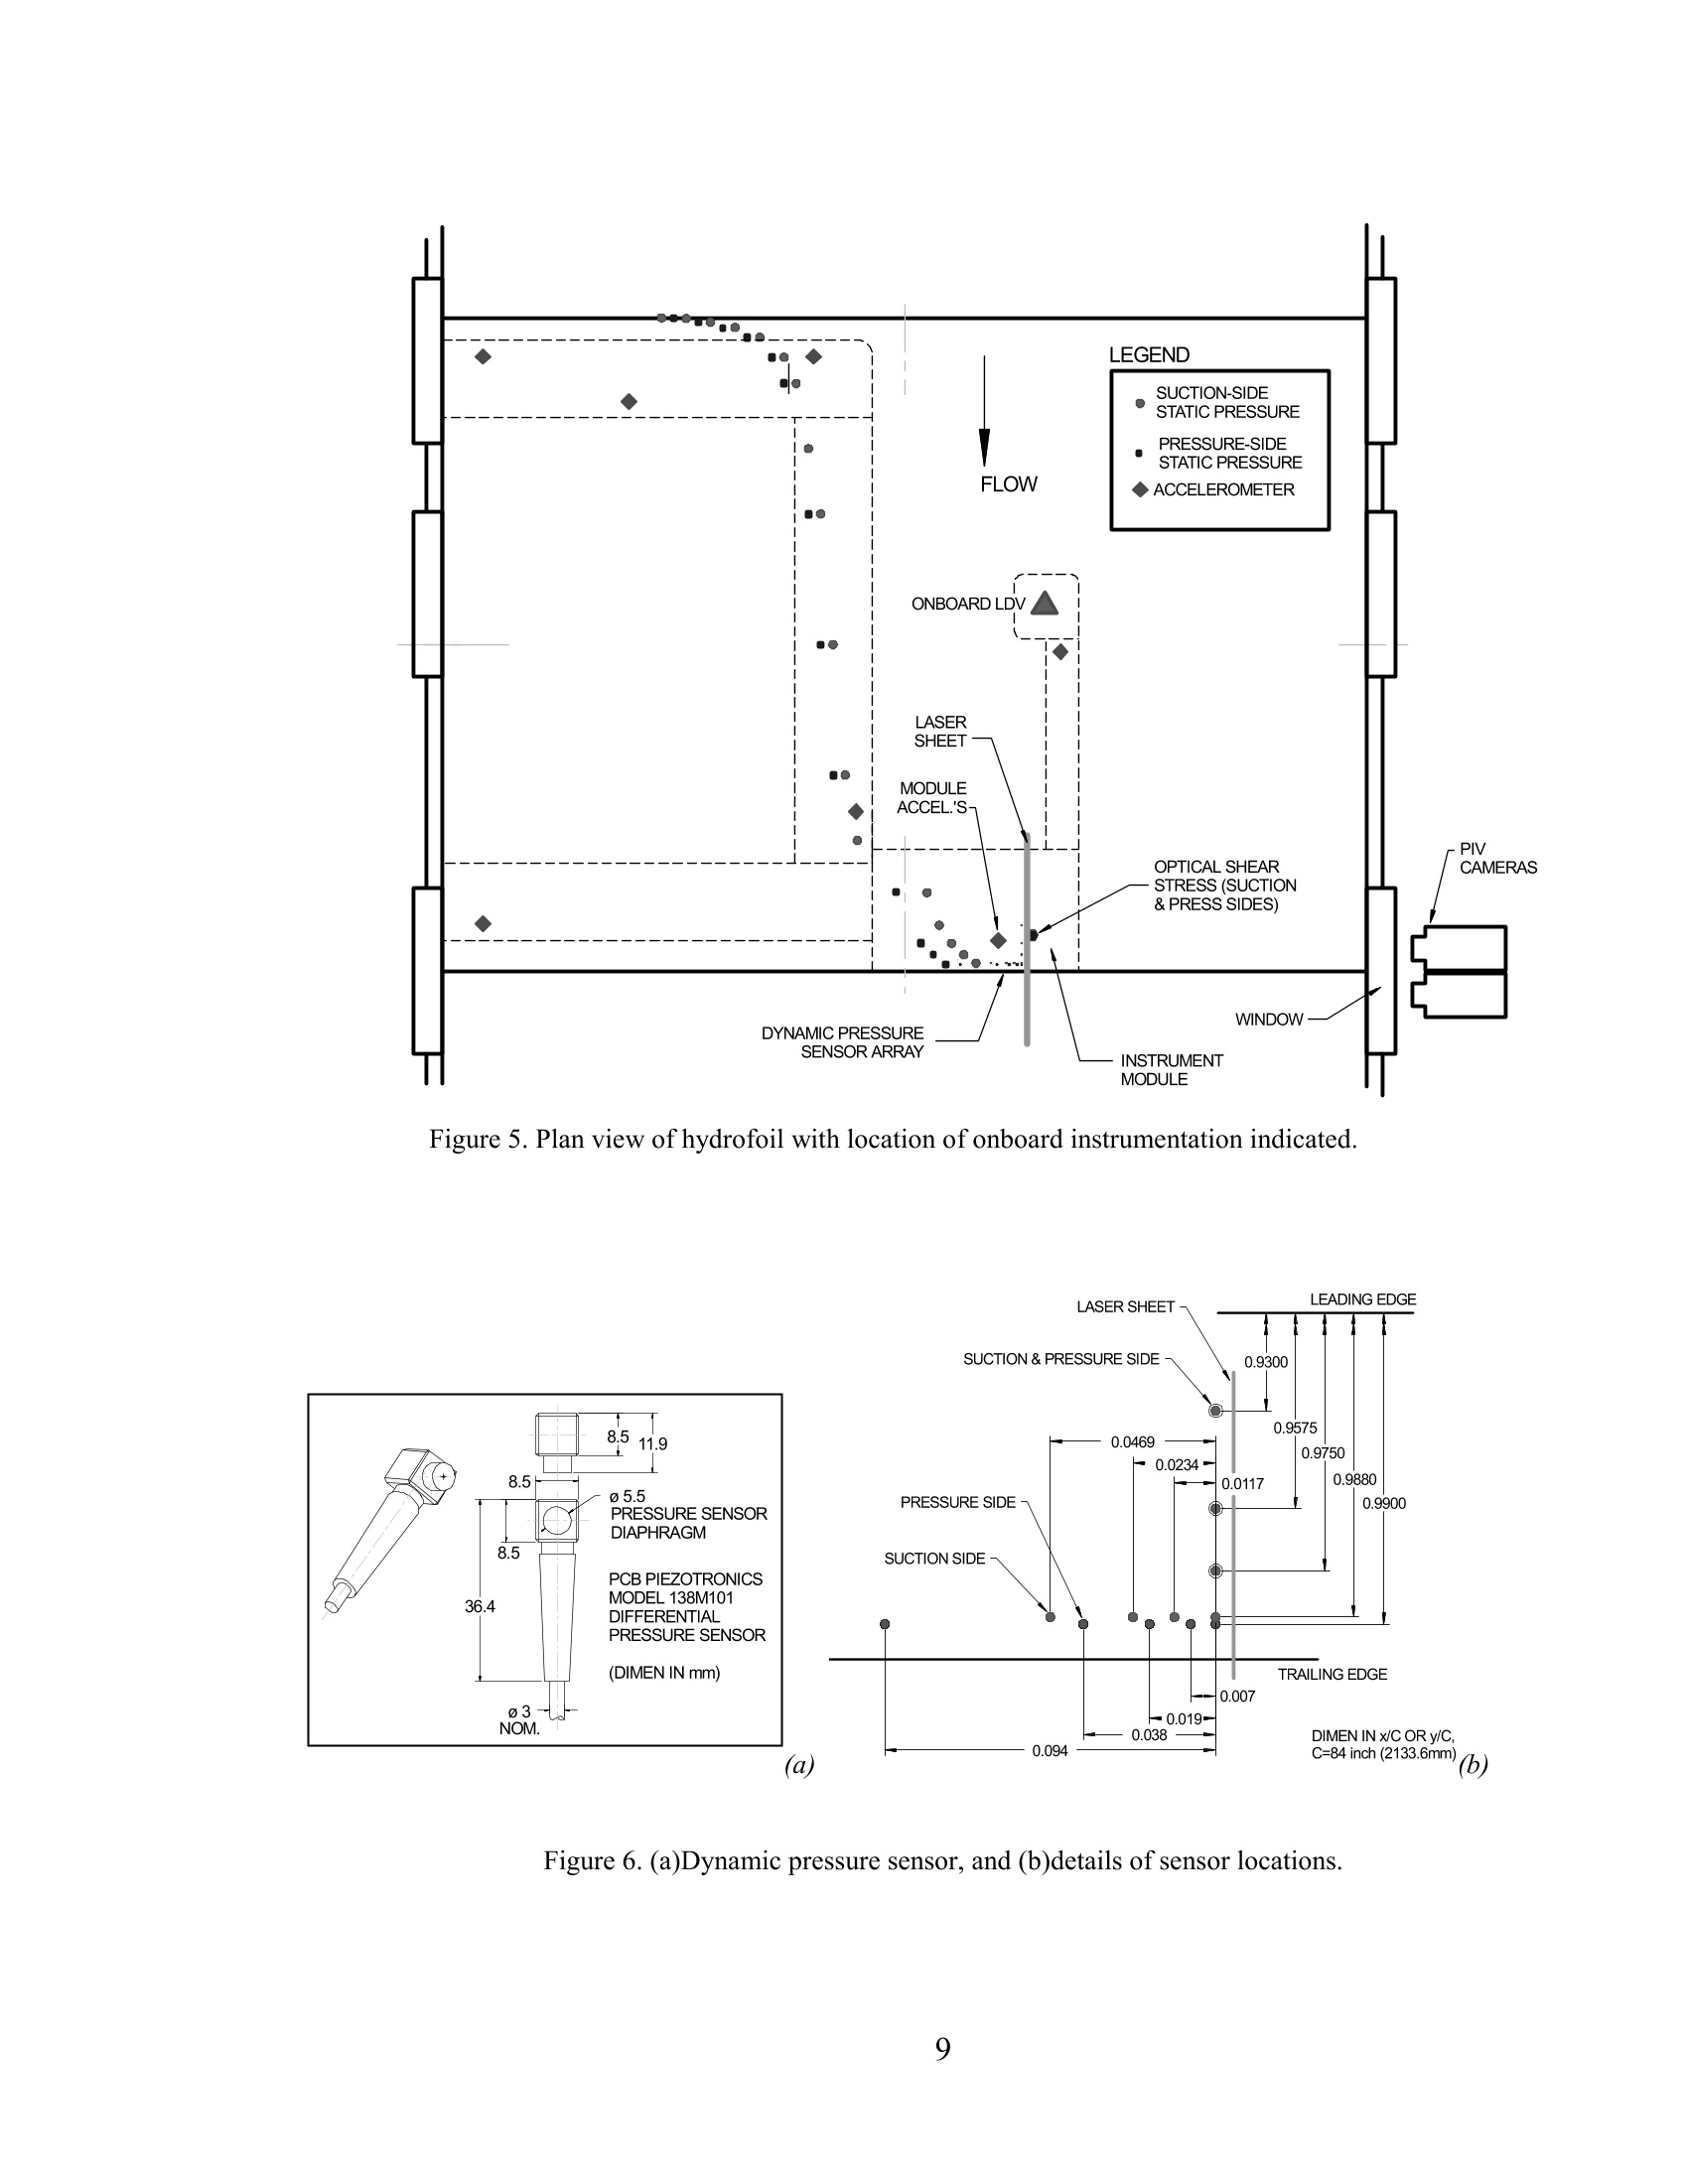
Hydrofoil Testing At High Reynolds Number Dwayne A. Bourgoyne, Carolyn Q. Judge, Joshua M. Hamel, Steven L. Ceccio, David R. Dowling Department ofMechanical Engineering University ofMichigan Ann Arbor, Michigan 48109-2121 Abstract Lifting surfaces are used both for propulsion and control of sea vessels and mustmeet performance criteria such as lift, drag, and (in some military applications)hydroacoustic noise limits. Design tools suitable to predict such criteria must handlecomplex flow phenomena and manage the wide range of flow scales inherent in marineapplications (Reynolds numbers ~10). To date, the development of such tools has beenlimited by the lack of controlled experimental data in this high Reynolds numbers range. Lifting surface flow is the focus of current high Reynolds number experimentsinvolving a two-dimensional hydrofoil in the world’s largest water tunnel, the US Navy’sWilliam B. Morgan Large Cavitation Channel (LCC). The goal of these experiments isto provide a unique high Reynolds number experimental dataset at chord-based Reynoldsnumbers (Re) approaching those of full-scale propulsors (~10). This data will be usedfor validation of scaling laws and computational models, with particular emphasis givento the unsteady, separated,turbulent flow at the trailing edge. In addition, theseexperiments will provide fundamental insight into the fluid mechanics of trailing-edgenoise generation in marine propulsion systems. This paper describes the experimental equipment and methods employed in thetest program. Described herein is the use of the LCC’s Laser Doppler Velocimetry(LDV) capability to acquire flow velocity mean and turbulence quantities, as well asestimates of boundary layer transition. Also presented is a Particle Imaging Velocimetry(PIV) system developed for these experiments and employing seed injection upstream ofthe channel’s flow straightener. Finally, a description is given of instrumentationmounted in the foil for measurement of vibration and surface static and dynamicpressures. [Significant assistance provided by personnel from NWSC-CD, Sponsored byCode 333 of the Office of Naval Researchl Introduction Background Lifting surfaces are used both for propulsion and control of naval vessels.Predictive tools are needed to design surfaces that meet fundamental performanceobjectives including lift, drag, and in military applications, hydroacoustic noise. Limitingthe development of such tools is the lack oDa一nf controlled experimental data at the highReynolds numbers typical of naval applications. Such data is needed to validate thescaling laws that are used in practice to extrapolate existing data to the higher Reynoldsnumber range. Also needed is adequate validation of computational approaches, whichfor practical use must employ some degree of modeling to lessen the range of flow scales. Inherent in these methods must be inadequately tested assumptions concerning Reynoldsnumber dependence. In no area of a lifting surface flow are scaling laws and computational modelsmore challenged than in the unsteady, separated, turbulent flow at the trailing edge. Atthe same time, this flow region significantly affects most performance measures andcrucially affects the hydroacoustics. Specifically, trailing edge flow noise includes incertain cases a tonal contribution generated by periodic vortex shedding. In the worstcase, there may be significant feedback between the vortex shedding drive (associatedwith the Kelvin-Helmholtz instability) and a structural vibrational mode.Thisphenomenon is known as singing and is characterized by high noise levels and evenstructural fatigue. Though important progress has been made in understanding vortexshedding in naval applications (see Blake[1]), much remains undetermined, including theReynolds number dependence of the phenomenon at the full scale. These considerationsled to the trailing edge region as the logical focus for this lifting surface dataset. Adataset revealing unsteady, Reynolds-number dependent vortex shedding would not onlygreatly challenge models, but also provide fundamental insight into the mechanismsgoverning vortex shedding noise. Experimental Plan This program sets out to measure the flow features of a lifting surface at Reynoldsnumbers approaching those of full-scale naval applications (10). In order to reach thisReynolds number, a hydrofoil was designed for use in the U.S. Navy’s William B.Morgan Large Cavitation Channel in Memphis, Tennessee. This facility is the largestwater tunnel of its type in the world. The chord of the hydrofoil model (2.31 m) is themaximum for which the leading and trailing edges are both visible in sidewall windows,and the span (3.05 m) is that of the full test section. This geometry yields a Reynoldsnumber as high as 60 million at a maximum facility flow speed of 18.3 m/s (36 knots)and at a maximum allowed water temperature of 104° F. A lifting surface shape waschosen that, though generic and two-dimensional, is of practical interest to designers ofsea vessels. Most significant to this shape is the trailing edge design, which generates acompact region of separated flow around 97% chord and potentially leads to periodicvortex shedding. Design of the experiment is driven by two main objectives. The first objective isto obtain a dataset useful for validation of both high Reynolds number scaling laws andcomputational models. Toward this end, boundary conditions are established using LDV-acquired velocity statistics at the inflow and in the far wake of the foil. In addition, staticpressures on the foil surface and channel walls are measured. LDV is also used toestimate the location of boundary layer transition. With the modeling inputs established,the remaining (and majority) of LDV measurements are focused on the unsteady,separated, turbulent flow at the trailing edge. In complement to the LDV, PIV at thetrailing edge is used to provide full field images of the instantaneous flow field, includingboth separation and the near wake. The second experimental objective is to providefundamental insight into the relationship between the unsteady velocity and pressurefields at the trailing edge that leads to vortex shedding noise. In order to capture thevortex shedding phenomenon, instantaneous velocity fields and the induced dynamic surface pressures at the trailing edge are recorded simultaneously using PIV and flushsurface-mounted dynamic pressure sensors. At the same time, foil vibration is recordedusing onboard accelerometers, both to validate the rigid model approximation and toprovide an independent indication of surface pressure fluctuations. Finally, independentinvestigators were invited to use the foil as a test bed for a miniature onboard single-component LDV and flush surface mounted optical shear stress sensors. Preliminaryresults of their investigation may be found in Fourguette, et al. [2]. This experimental effort has been conducted in three phases. The first phase oftesting took place in the fall of 1999 and was used for validating the model mountingsystem, confirming the absence of singing, and obtaining of LDV survey of the flow. Thesecond phase was completed in the spring of 2001 and included PIV at the trailing edgeand the onboard pressure and acceleration instrumentation. Preliminary results from thefirst and second phase of testing are available in Bourgoyne et al. [3,4]. A third phase tobe conducted in the fall of 2001 will obtain lower speed data, investigate the effects ofboundary layer tripping, and test additional trailing edge shapes. Test Facility and Model The LCC is a low turbulence water tunnel with a 6:1 contraction ratio and a 3.05×3.05×13 m test section (Fig. 1). Driven by a 10,440 kW motor, a 5.5 m diameter axialflow impeller delivers steady test section flows from 0.5 to 18.3 m/s. Test-sectionpressures are controlled from 3.5 to 414 kPa (0.5 to 60 psia). Experimental capabilitiesinclude flow visualization and measurements of cavitation inception, steady and unsteadyforce and pressure, acoustics, and velocity (LDV, hot-film anemometry, pitot-tubes,particle displacement velocimetry). The HIFOIL model is a hydrofoil of 2.134-m chord (C) and 0.171-m maxthickness (t) which spans the full width of the LCC test section. Though fully two-dimensional, the foil has the cross section of a generic naval propeller of moderatethickness and camber (f). The shape (Fig. 2a) is that of a NACA-16 (t/C=0.08,f/C=0.032) with two modifications. First the bottom (pressure side) of the foil is flat aftof 28% chord, which simplified fabrication and facilitated the addition of onboardinstrumentation.Second, the hydrofoil terminates in an anti-singing trailing edge typicalof some propellers. This later modification is characterized by a rounded bevel near 97%of chord that terminates at an apex angle of approximately 44° (Fig. 2b). This geometrygenerates a compact region of flow separation in the immediate vicinity of the trailingedge. Similar shapes tested at lower Reynolds number have demonstrated periodicvortex shedding. The hydrofoil was CNC-machined from a solid Ni-Al Bronze casting andpolished to a RMS surface roughness of 2.5x10 mm. Based on estimations from a flatplate (see White[5]), this roughness level is small enough to consider the foil surface assmooth, even at the Reynolds numbers of these experiments. The finished weight of thefoil was approximately 62 kN. At a flow speed of 18.3 m/s and angle of attack of 0°, thehydrofoil generates approximately 670 kN of lift, and deflects approximately 6-7 mm atmidspan. While prior LCC models have been mounted using ceiling struts, the hydrofoilwas mounted between walls, using a stainless steel mounting plate in the place of a window on each sidewall (see Fig. 3). Tangs cast integrally with the foil engage thesidewall mounting plates, and angled load-bearing blocks are used to vary angle ofattack. Three angles-of-attack, defined from the flat pressure side of the foil, wereinvestigated (-1°,0°, +1). Gasketing between the foil and the channel walls preventedbypass flow. Experimental Methods Nomenclature Throughout this work, all x and y spatial coordinates are normalized with the foilchord, C=84 inches, which assumes an idealized sharp trailing edge tip. On the actualfoil, the tip was ground to a 1/64 inch radius, reducing the actual chord by a smallamioount. The x-axis is directed as positive in the direction of undisturbed channel flow,with x=1 taken at the sharp tip of the idealized trailing edge. The y-axis is directed aspositive upward, perpendicular to the x-axis, with y=0 taken at the sharp tip of theidealized trailing edge. Controlled Parameters For all tests, the channel flow velocity was set through computer control of therotational speed of the LCC impeller drive motor. The flow speed was then monitoredwith a stationary single-component LDV probe positioned within the test section morethan two chord lengths upstream of the hydrofoil’s leading edge. Throughout all datacollection, tunnel pressure was held constant and sufficiently high to suppress anycavitation that would alter the flow conditions over the foil. Temperature was monitored,but tunnel heat exchanger capacity was not sufficient for full thermal control, and watertemperature increased as much as 1.3 °C/hr during tests at 18.3 m/s. This led to an overalltest temperature range of 24 °℃ to 40 °C, though data taken at a given test speed variedby no more than 9℃. The main impact of the changing water temperature was a changein the viscosity of the water, and therefore a variation in the Reynolds number for a givenflow speed. Thus, the chord-based Reynolds numbers (Re) are as follows: 3 m/s impliesRe= 7 to 10 million; 6 m/s implies Re =16 to 20 million; 12 m/s implies Re = 29 to 39million; and 18.3 m/s implies Re = 46 to 61 million. Laser Doppler Velocimetry This test program took advantage of the LCC’s in-house capability for two-component LDV. Measurements have been made at zero angle of attack (see Fig.3) at(1) the far upstream, (2) the leading edge, (3) the region near the trailing edge, (4) in thenear wake, and (5) in the far wake. Further LDV was acquired for angles of attack of +1°and -1°at selected x/C locations in the near wake. Details on these measurements areavailable in Bourgoyne, et al[3]. The location of boundary layer transition was estimated using the LCC’s LDVcapability. At a variety of test speeds and angles of attack, the external LDV waspositioned at 4 span and traversed chordwise at the minimum vertical distance over thefoil surface at which a signal could be acquired.A sharp increase in the velocityfluctuations was interpreted as either a transition of the boundary layer from laminar toturbulent, or a growth of a developing turbulent boundary layer to a height sufficient to be detected by the LDV. Across all test conditions, boundary layer transition was foundby this method to occur within the first 7% of the foil chord. Further evidence oftransition was observed in the patterns of seed particles inadvertently deposited by thetest flow on the foil surface. V-shaped markings initiating at static pressure tap holes andindividual seed particles revealed boundary layer instability and suggested unintendedlocalized tripping of transition. In all cases these markings fell within the first 7% ofchord. The variation in the locations of the markings suggested spanwise variation in thelocationof transition. Surface Static Pressure The static pressure measurements were made using 17 suction-side and 13pressure-side taps on the hydrofoil. Taps were individually routed to a commontransducer using a 48-channel rotary Scanivalve. The tap diameters were 1.6 mm exceptnear the leading edge where 0.8 mm diameter holes were used. Pressure differencesbetween these on-foil taps and a reference tap located approximately two chord lengthsupstream of the hydrofoilwere measured with three differentialstatic pressuretransducers (Rosemount 3051 ±10"inches of water, Setra P230 ±50 psi, Setra P230±10psi) chosen to properly span the anticipated pressure range of the tests. Zero-flowmeasurements were used to subtract out measured zero-offsets. Estimates of hole errorwere not used to correct the data but were included in the reported uncertainty. Inaddition to foil surface taps, measurements were made on the walls of the test section,using both the Scanivalve and LCC in-house capability. Acceleration Accelerometers (Wilcoxon 754-1) were placed onboard the hydrofoil to monitorvibration, and their locations are depicted as triangles in Fig.5. The accelerometers wereanalogue band-pass filtered and 12-bit sampled at 10 kHz using a National InstrumentsA/D card. Acceleration measurements were used to confirm the absence of the singingcondition, validate the rigid foil approximation, allow acceleration error to be subtractedfrom the dynamic pressure signals, and to record the foil response to surface pressures.RMS acceleration levels during testing ranged from 0.001 to 0.083g at channel speedsfrom 3.0 and 18.3 m/s. Surface Dynamic Pressure Dynamic surface pressure measurements were made with an array of fifteen flushmounted pressure transducers (PCB 138M101) in the vicinity of the foil’s trailing edge.These transducers were arrayed in an “L" shape with lines of transducers set parallel andperpendicular to the flow direction. The signals from these transducers were analogueband-pass filtered from 2 Hz to 5.0 kHz and12-bit sampled at 10 kHz using a PCequipped with National Instruments A/D hardware. The location of the dynamic pressuretransducers is shown on the plan view of the foil in Fig.5, and with greater detail in Fig.6. Particle Imaging Velocimetry This experimental effort was the first to successfully implement PIV at the LCC.Key to PIV is adequate seeding of the test flow.While this program demonstrated thatbulk seeding of the channel is practical for relatively coarse magnifications (~2 mmbetween vectors) and using a thick light sheet (~10mm), a versatile PIV capabilityrequires a more sophisticated approach. Because of the large volume of water, bulkseeding may become prohibitively expensive at dense seeding conditions. In addition,seed density may significantly affect water clarity over the large optical lengths involved.To meet this need, an upstream seeder system was designed to reliably deliver repeatableseed densities to the PIV target using a minimal amount of seed. The injection point is lined up with the PIV laser sheet at 37% span. To avoid awake at the test section, the injection point is located upstream of the flow managementgrid and contraction of the channel. (LDV surveys in the test section confirmed that nodiscernable disturbance was produced.) To accommodate different seed settling times andmodel geometries, a vertical column of injection points was employed, with partitions ofthe column fed by one of eight % diameter tubes running from the pumping systemlocated outside the channel. A centrifugal pump takes suction off the channel anddischarges to the injection column at flow velocities sufficient to carry seed up the supplyline. A metering pump (Netzsch progressive cavity) on a variable frequency drive (VFD)takes suction off a barrel of seed/water mix at atmospheric pressure and delivers it to thedischarge line of the centrifugal pump. Because the centrifugal pump takes suction offthe channel, and the metering pump flow rate is relatively insensitive to dischargepressure, changes in channel pressure do not affect seed injection. Since the seed-metering pump can employ a dense mix of seed, the seed barrel does not need to beconstantly resupplied. After the system is set up for a particular seeding elevation, theVFD on the metering pump is controlled remotely from the test section. While this system was used successfully in testing, some inhomogenity in theseed distribution was observed and attributed to insufficient mixing at the injection point.Field modifications to increase the number of injection holes improved conditions, butthis improvement was limited by a resulting imbalance in the column’s mass flowdistribution (holes on the end of a header receiving more flow). Further injection columnmodifications may be necessary to realize the full seeding versatility intended for thedesign. The PIV light sheet was provided by two Spectra-Physics Model Pro 250-10flash-lamp pumped YAG lasers with 800 mJ per pulse at 532nm and a repetition rate of 8Hz. Powerful lasers were chosen to overcome the long optical paths and provide a widerange of potential fields of view. The lasers were mounted on top ofthe channel asdepicted in Fig. 4. In order to bring the optics as close to the test section as possible, ashaft was constructed to bridge the attic space and mount a pressure-containing windowflush with the ceiling of the test section. This design both minimized optical paths andeliminated interference from attic air bubbles. BK-7 was used for the window material toaccommodate the powerful lasers, and a 10”diameter pipe was used to minimize windowcost.Machined mating surfaces inside the pipe allow an optical rail to be removed andreplaced in a repeatable manner, and a remote cable brings out control of an optical stageat the bottom of the pipe. Using this configuration, a thick laser sheet (~10 mm thickness) was fired downward through the top of the LCC test section to illuminate the rear 5% ofthe suction-side chord and the foil’s near wake. The pressure side of the foil was notilluminated. Instantaneous flow field measurements in the vicinity of the foil’s trailing edgewere made using a LaVision Flowmaster PIV system running DaVis 5.4.4. Two 1024 by1280 pixel cameras; were operated in tandem to capture fields of view spanningapproximately 75 (vertical) by 150 mm (streamwise) and covering the final few percentof the foil’s chord and near wake. Abundant laser power allowed an extensive lightsheet, which in turn allowed separate fields of the flow to be measured simultaneously.Between 500 and 1000 images were collected at a rate of approximately 1 to 2 Hz at eachflow condition and for each of two camera arrangements. Image files were stored onmultiple 80 GB external hard drives. Summary and Conclusions This paper has described a new experimental effort to document the flow,pressure distributions, and vibration levels of a hydrofoil operating at high Reynoldsnumber.Taking advantage of the unique capabilities ofa world-class test facility, thehydrofoil serves as a valuable and versatile test platform for extending the understandingof lifting surface flow to the high Reynolds number range. The data set being assembledwill be useful to both designers of hydro-mechanical devices and developers of scalinglaws and computational tools for wall-bounded turbulent flows. Acknowledgments This work has been supported by Code 333 of the Office of Naval Research. Theauthors would also like to recognize R. J. Etter for his numerous contributions to thedesign of the equipment for use in the LCC. References 1. Blake,W.K.(1986) Mechanics of Flow Induced Sound and Vibration, Vol. II.,Academic Press. Orlando. 2.Fourguette, D., Modarass, D., Taugwalder, F.,Wilson, D., Koochesfahani, M.,and Gharib,M. (2001)“Miniature and MOEMS Flow Sensors,”AIAA paper no.2001-2982. 3..Bourgoyne, D.A., Ceccio, S.L., Dowling D.R., Jessup S., Park, J., Brewer, W.,and Pankajakshan, R. (2000) "Hydrofoil turbulent boundary layer separation athigh Reynolds numbers," 23rd Symposium on Naval Hydrodynamics, Val deReuil,France. ( 4. Bourgoyne, D.A., Judge,C.Q., Hamel, J.M., Ceccio, S. L ., Dowling D.R., (2001)“Lifting Surface Flow, Pressure, and Vibration At High Reynolds-Number,” ASME-IMECE. ) 5.White, F.M. (1991) Viscous Fluid Flow, 2nd Ed.,McGraw Hill, Inc., New York,pp. 433-435. Figure 1. William B. Morgan Large Cavitation Channel Figure 2. (a) hydrofoil cross section, and (b) trailing edge with locations of pressure transducers. Figure 3. Model in test section with LDV survey locations indicated Figure 4. The PIV system installation. -PIV CAMERAS Figure 5. Plan view of hydrofoil with location of onboard instrumentation indicated. Figure 6.(a)Dynamic pressure sensor, and (b)details of sensor locations.
确定


还剩7页未读,是否继续阅读?

产品配置单

北京欧兰科技发展有限公司为您提供《流体中速度场,速度矢量场检测方案(粒子图像测速)》,该方案主要用于其他中速度场,速度矢量场检测,参考标准--,《流体中速度场,速度矢量场检测方案(粒子图像测速)》用到的仪器有德国LaVision PIV/PLIF粒子成像测速场仪
推荐专场


相关方案
更多
该厂商其他方案
更多