


方案详情
文
Surface plasmon resonance (SPR) spectroscopy is a widely used optical reflection technique for the characterization of thin films.
The central quantity of SPR spectroscopy is the surface plasmon coupling angle as a characteristic signature of the prevailing interfacial architecture. Adsorption processes lead to a shift of the surface plasmon resonance which is in the thin film limit directly proportional to the corresponding mass coverage. The aim of any SPR instrument is a precise measurement of the coupling angle with a sufficient high time resolution that fast kinetic processes can be monitored. In this paper, we compare two promising methods, an established one,the reflectivity tracking and a fairly new one, the mismatch tracking. Reflectivity tracking simply records the intensity of the light in the vicinity of the coupling angle. The shift of the plasmon modifies the intensity at the detector which can subsequently be used for data analysis. Mismatch tracking is more complex. Light is focused with a lens onto the prism base and the reflected light is detected via a bicell detector. The upper and lower cell integrate over a well-defined angular range of the fan of rays produced within the focus. The mismatch in the intensity between the upper and lower segments is evaluated and used to retrieve the unknown film parameter. In this contribution we suggest some decisive variations of the originally proposed scheme and demonstrate that the modified mismatch scheme yields a significantly higher sensitivity than the original one. Furthermore, it is demonstrated that this scheme is a superior alternative to reflectivity tracking.
方案详情

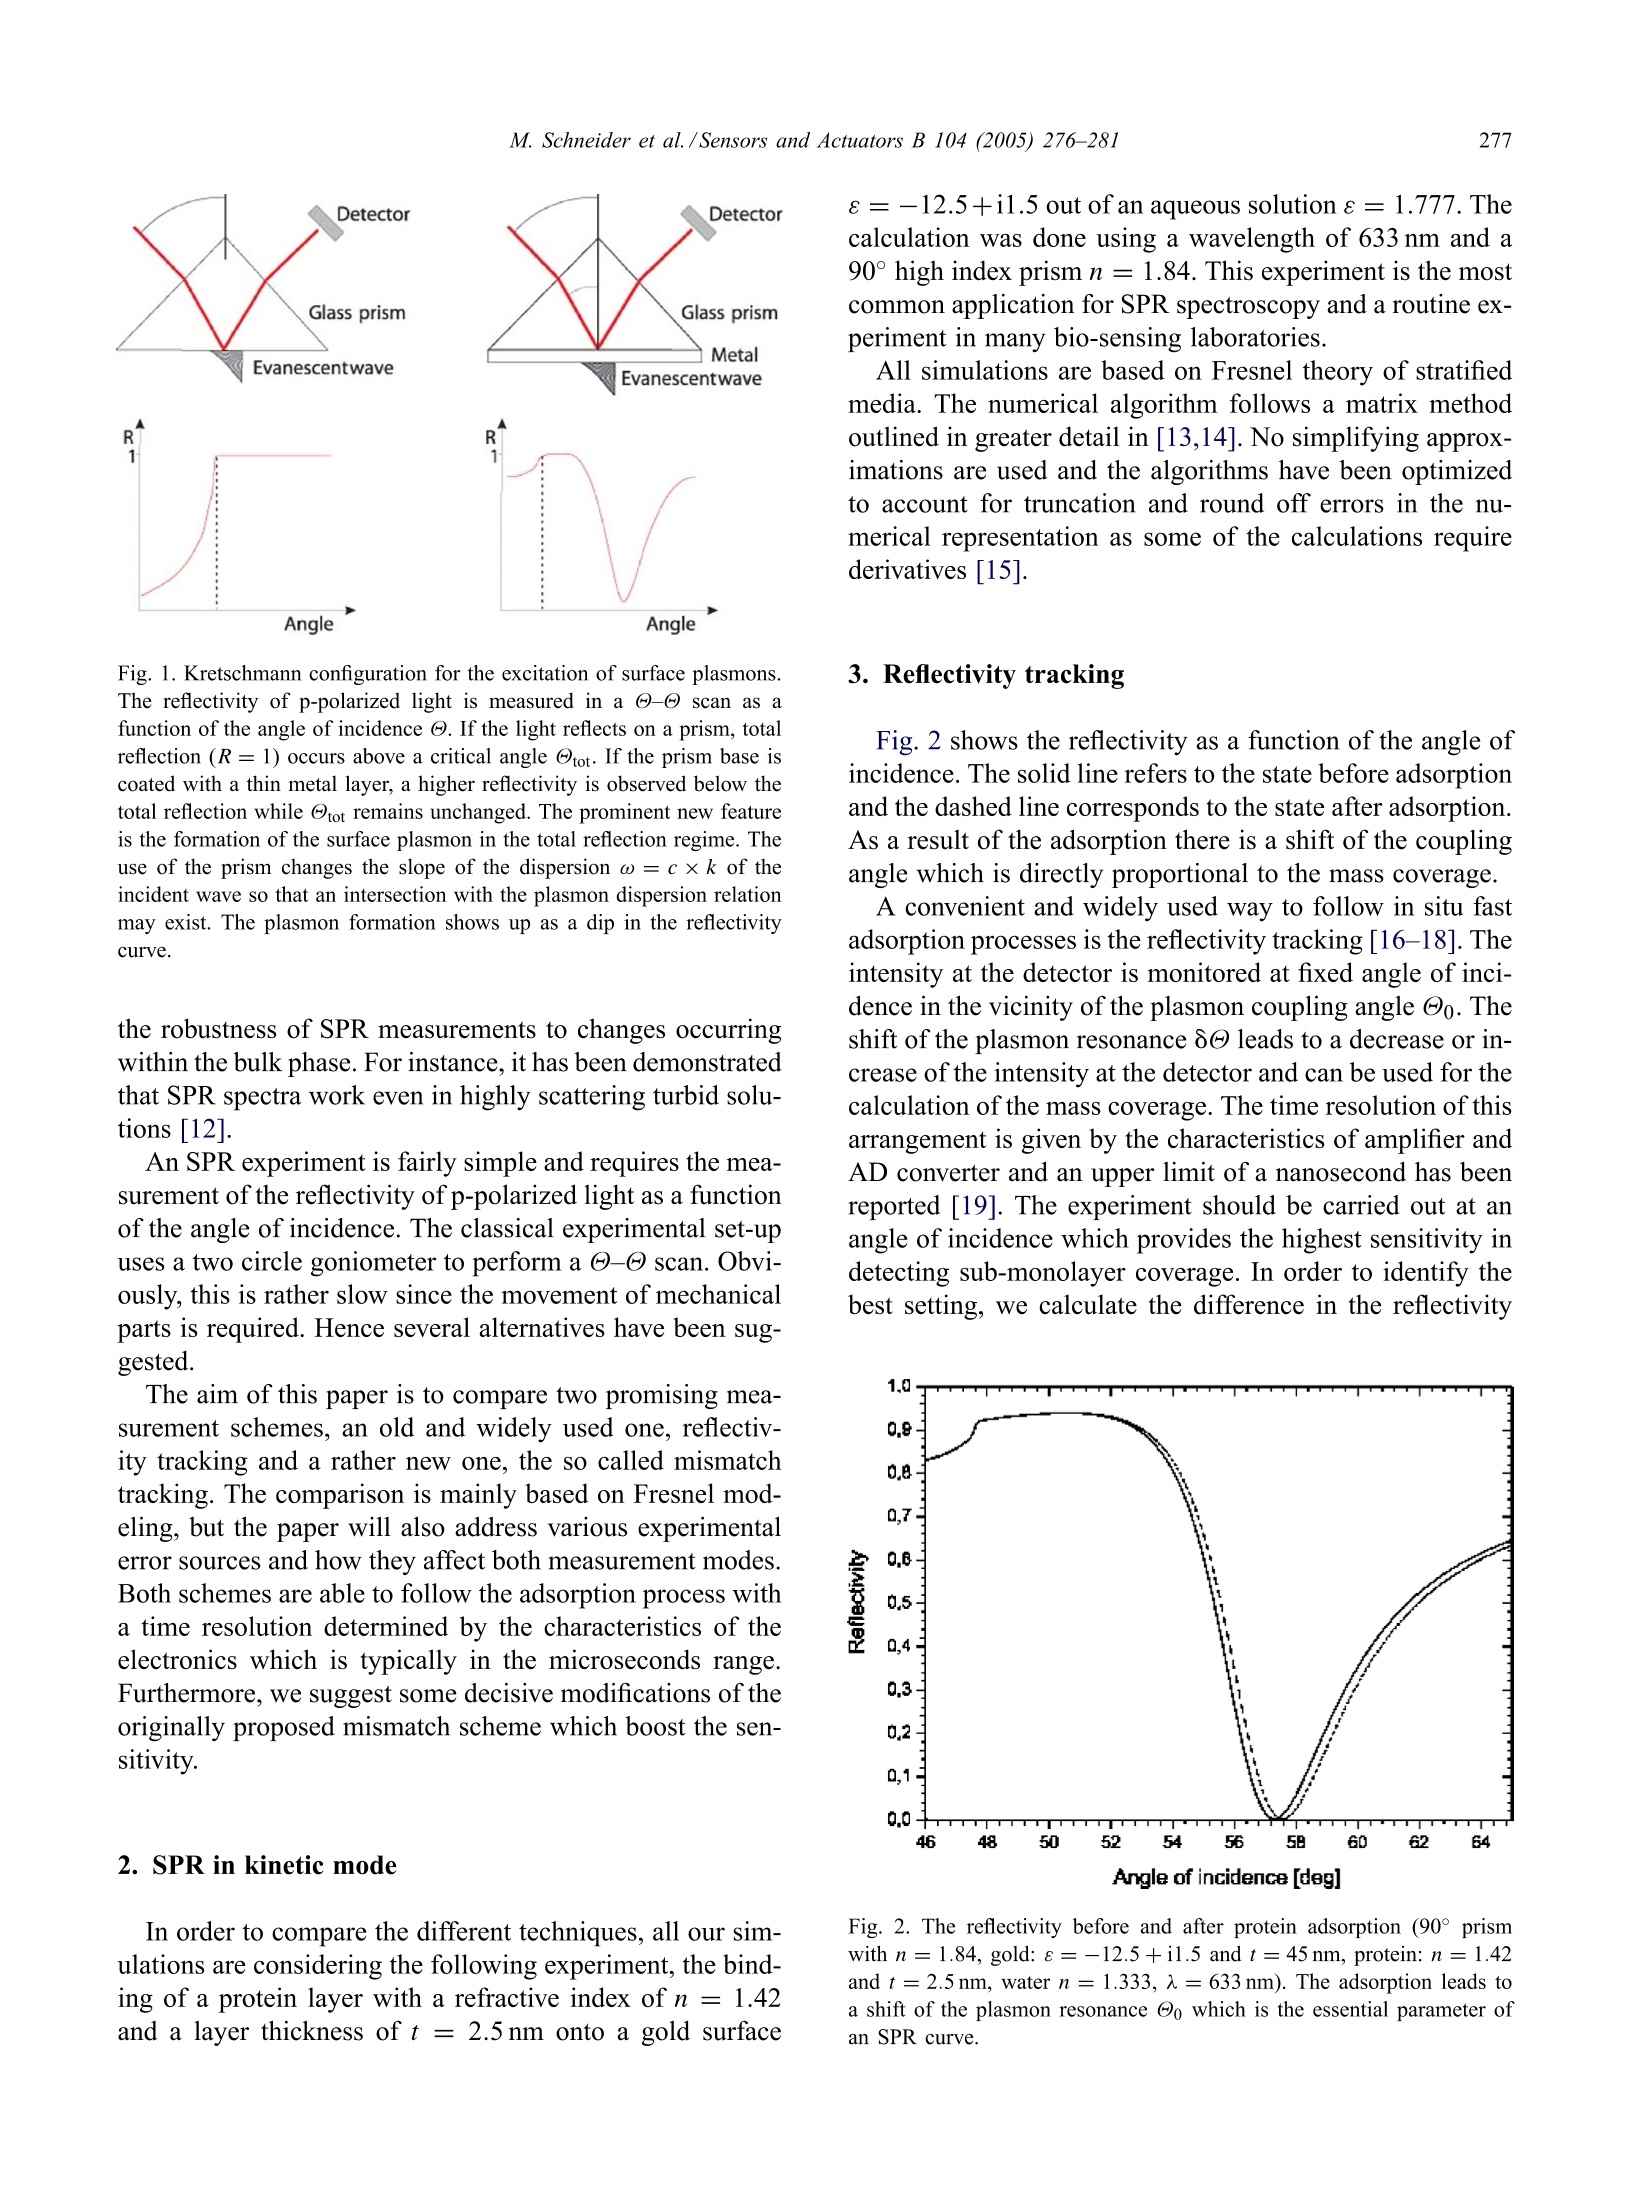
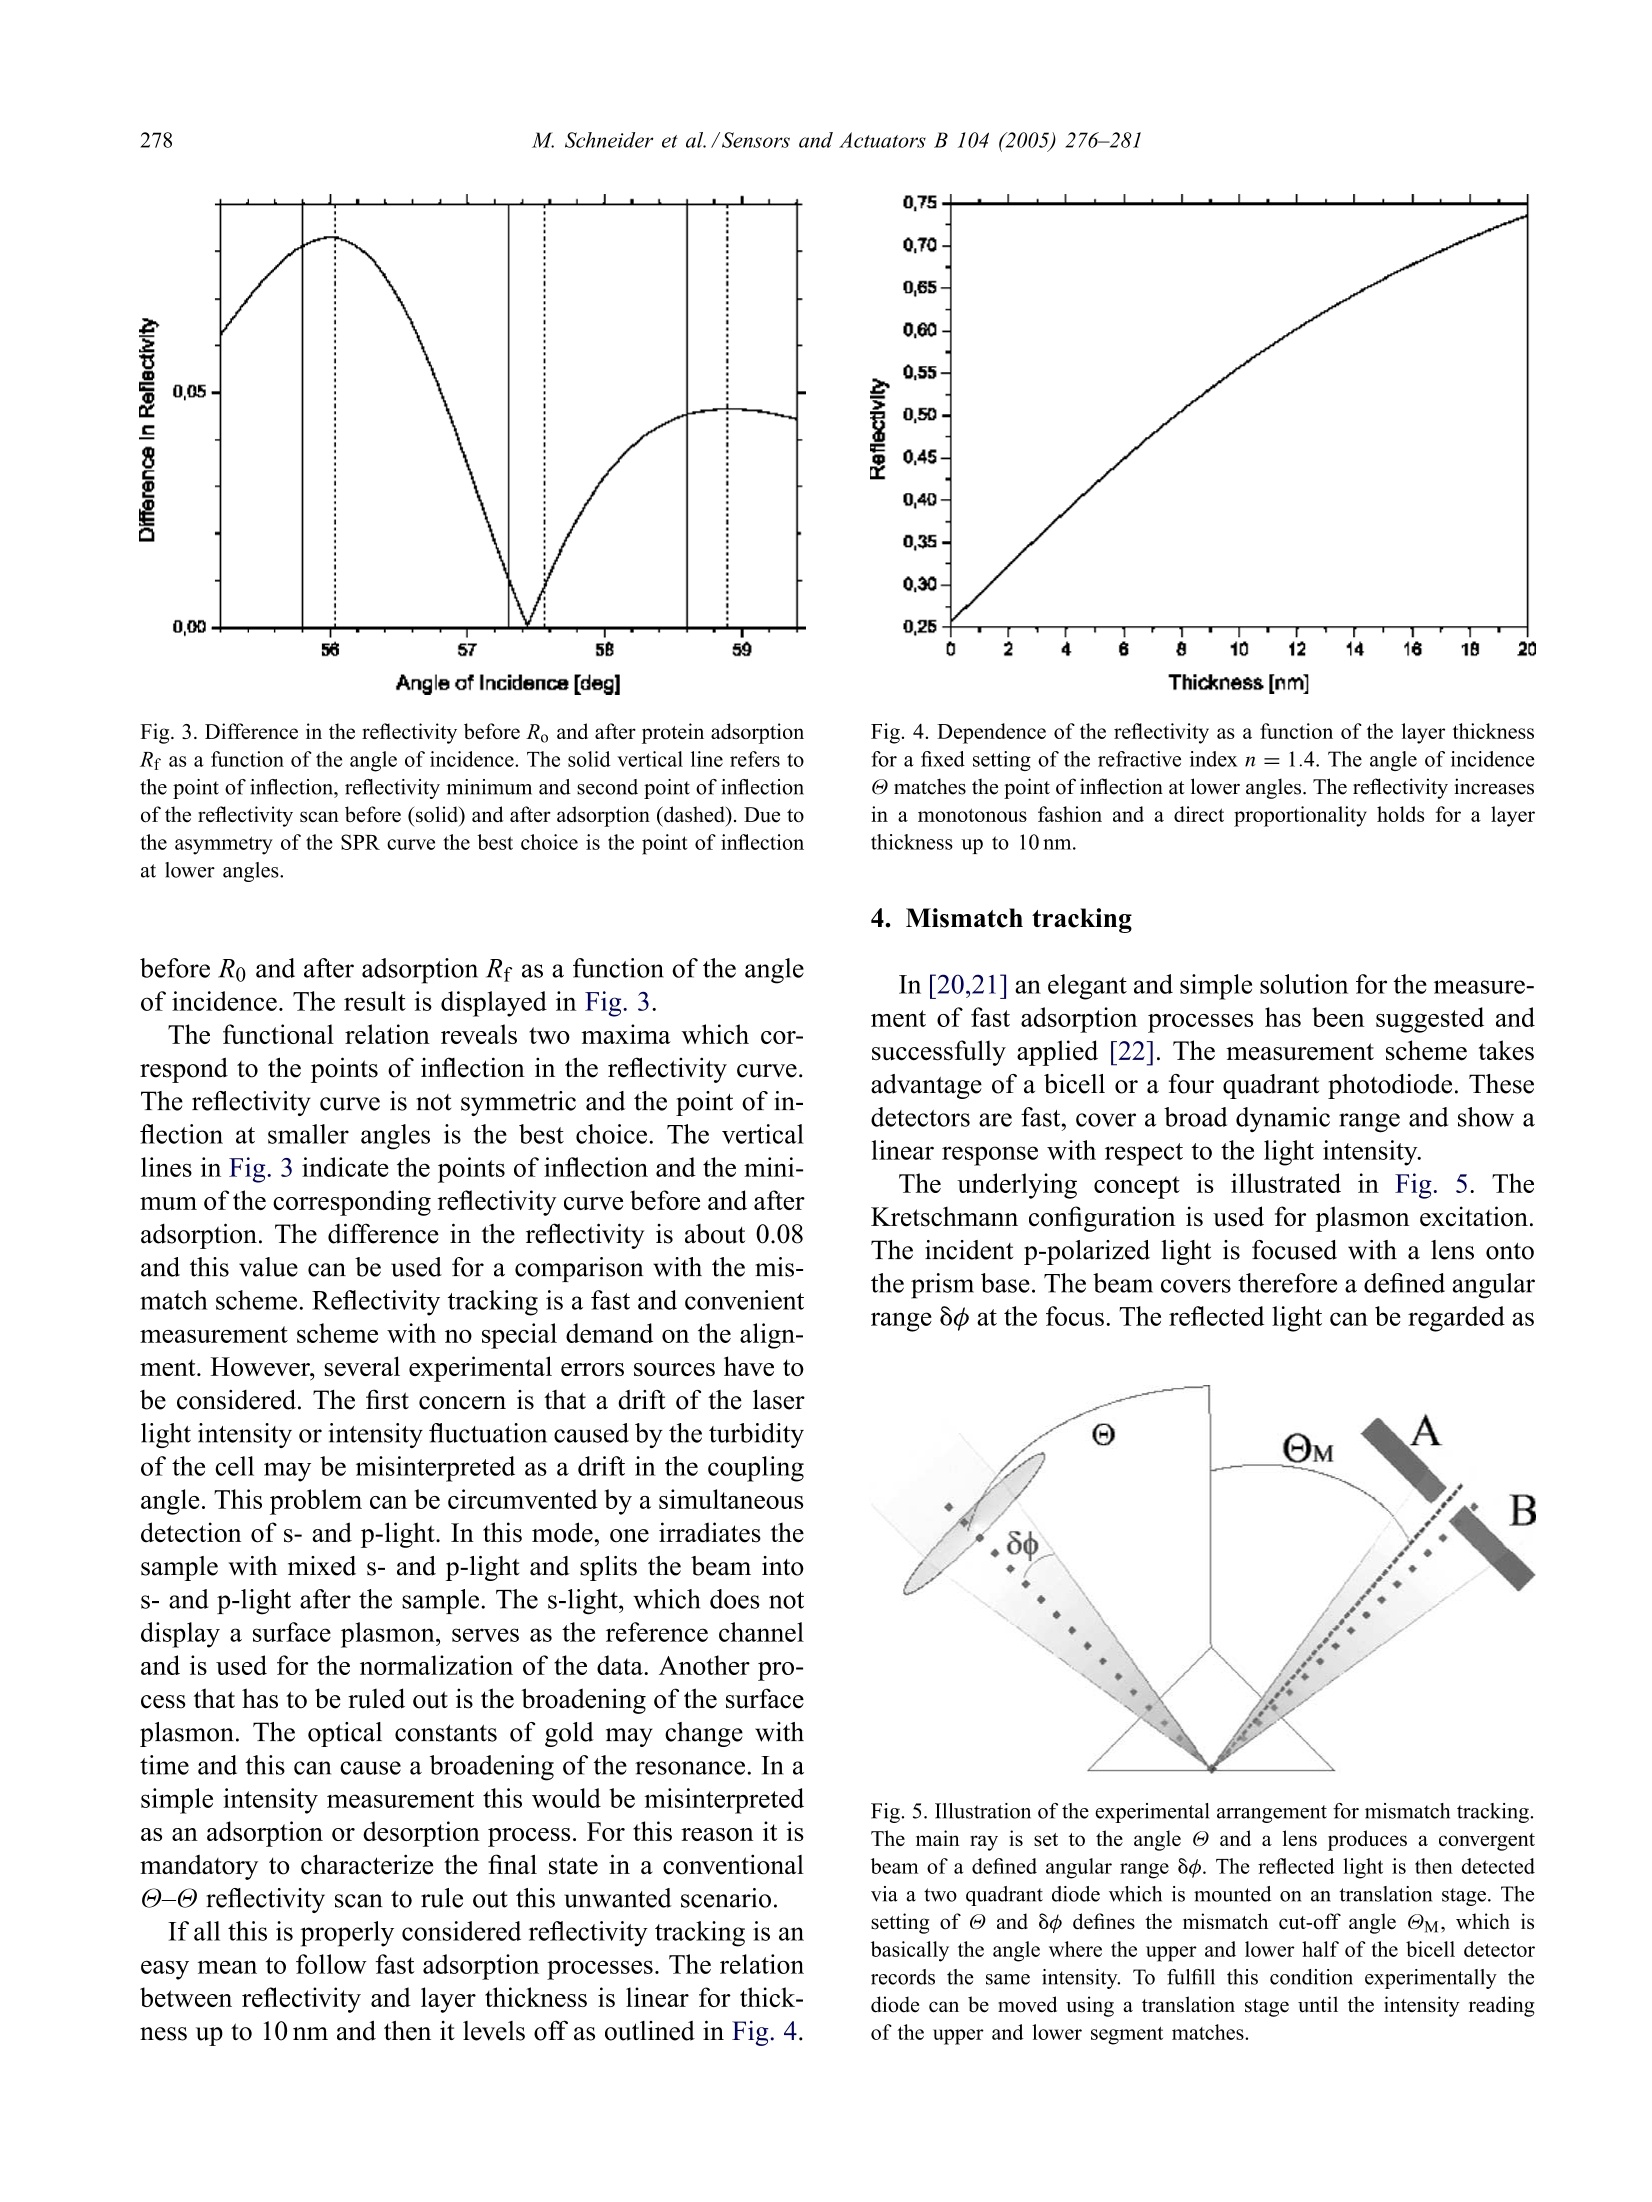
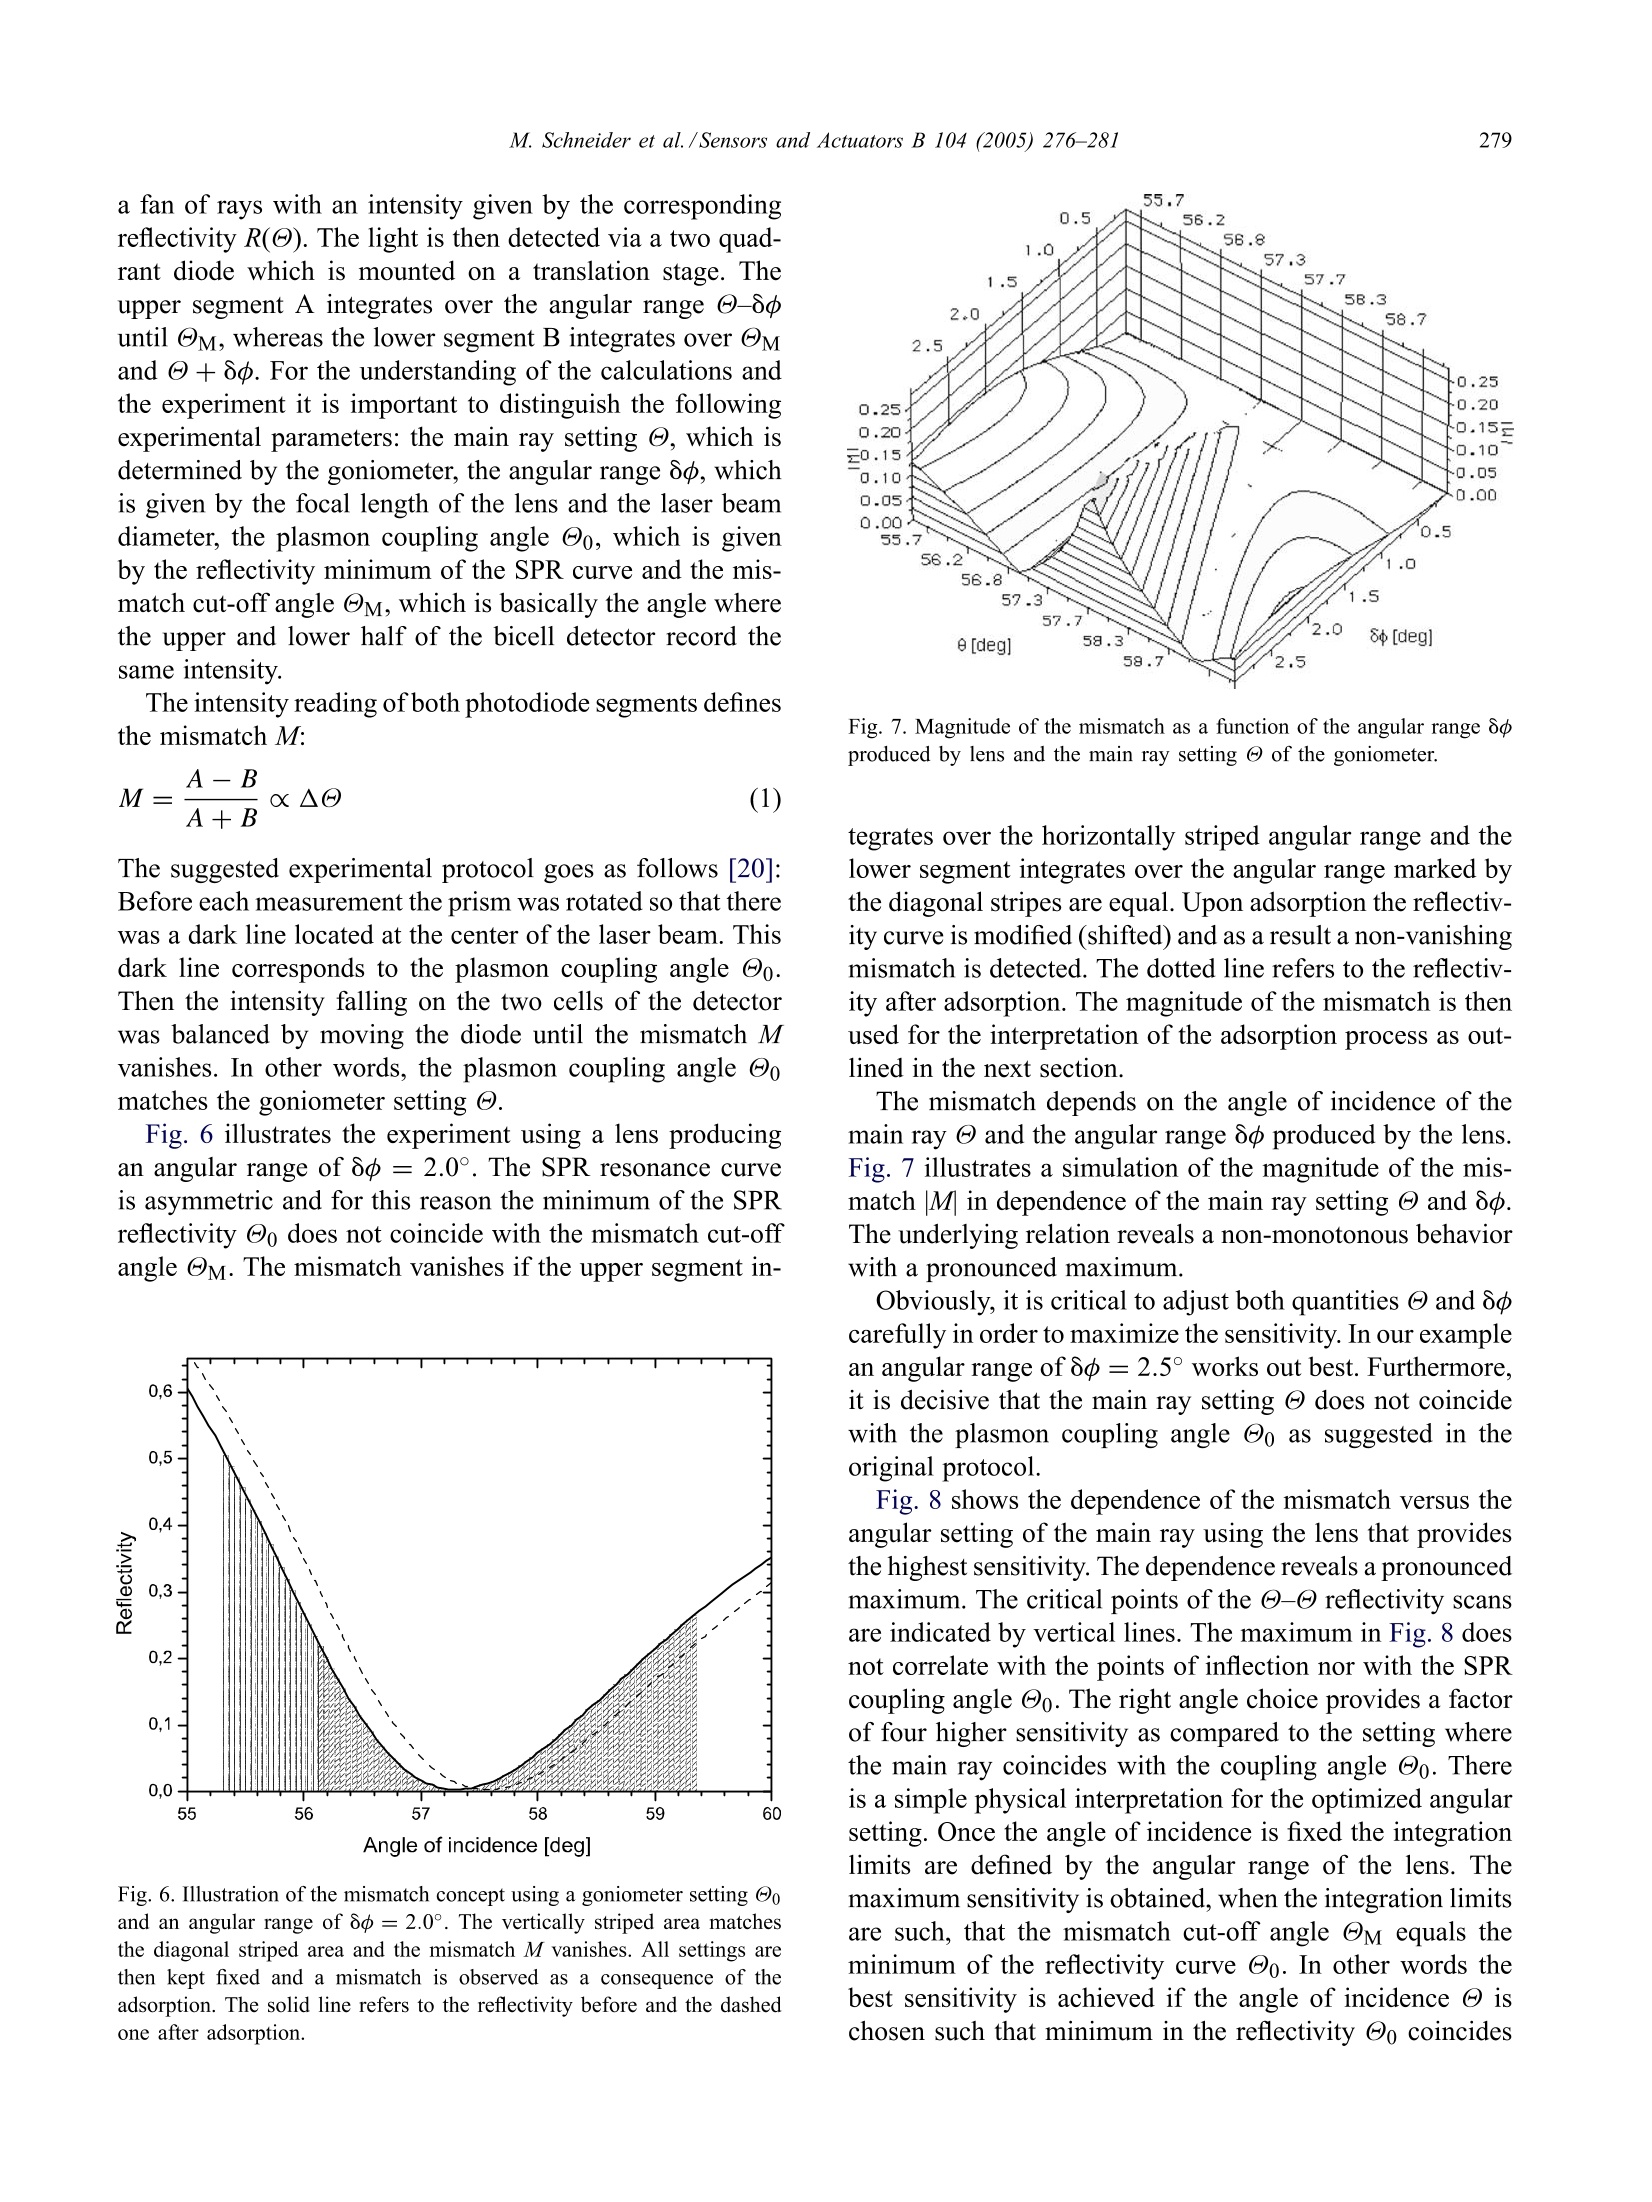
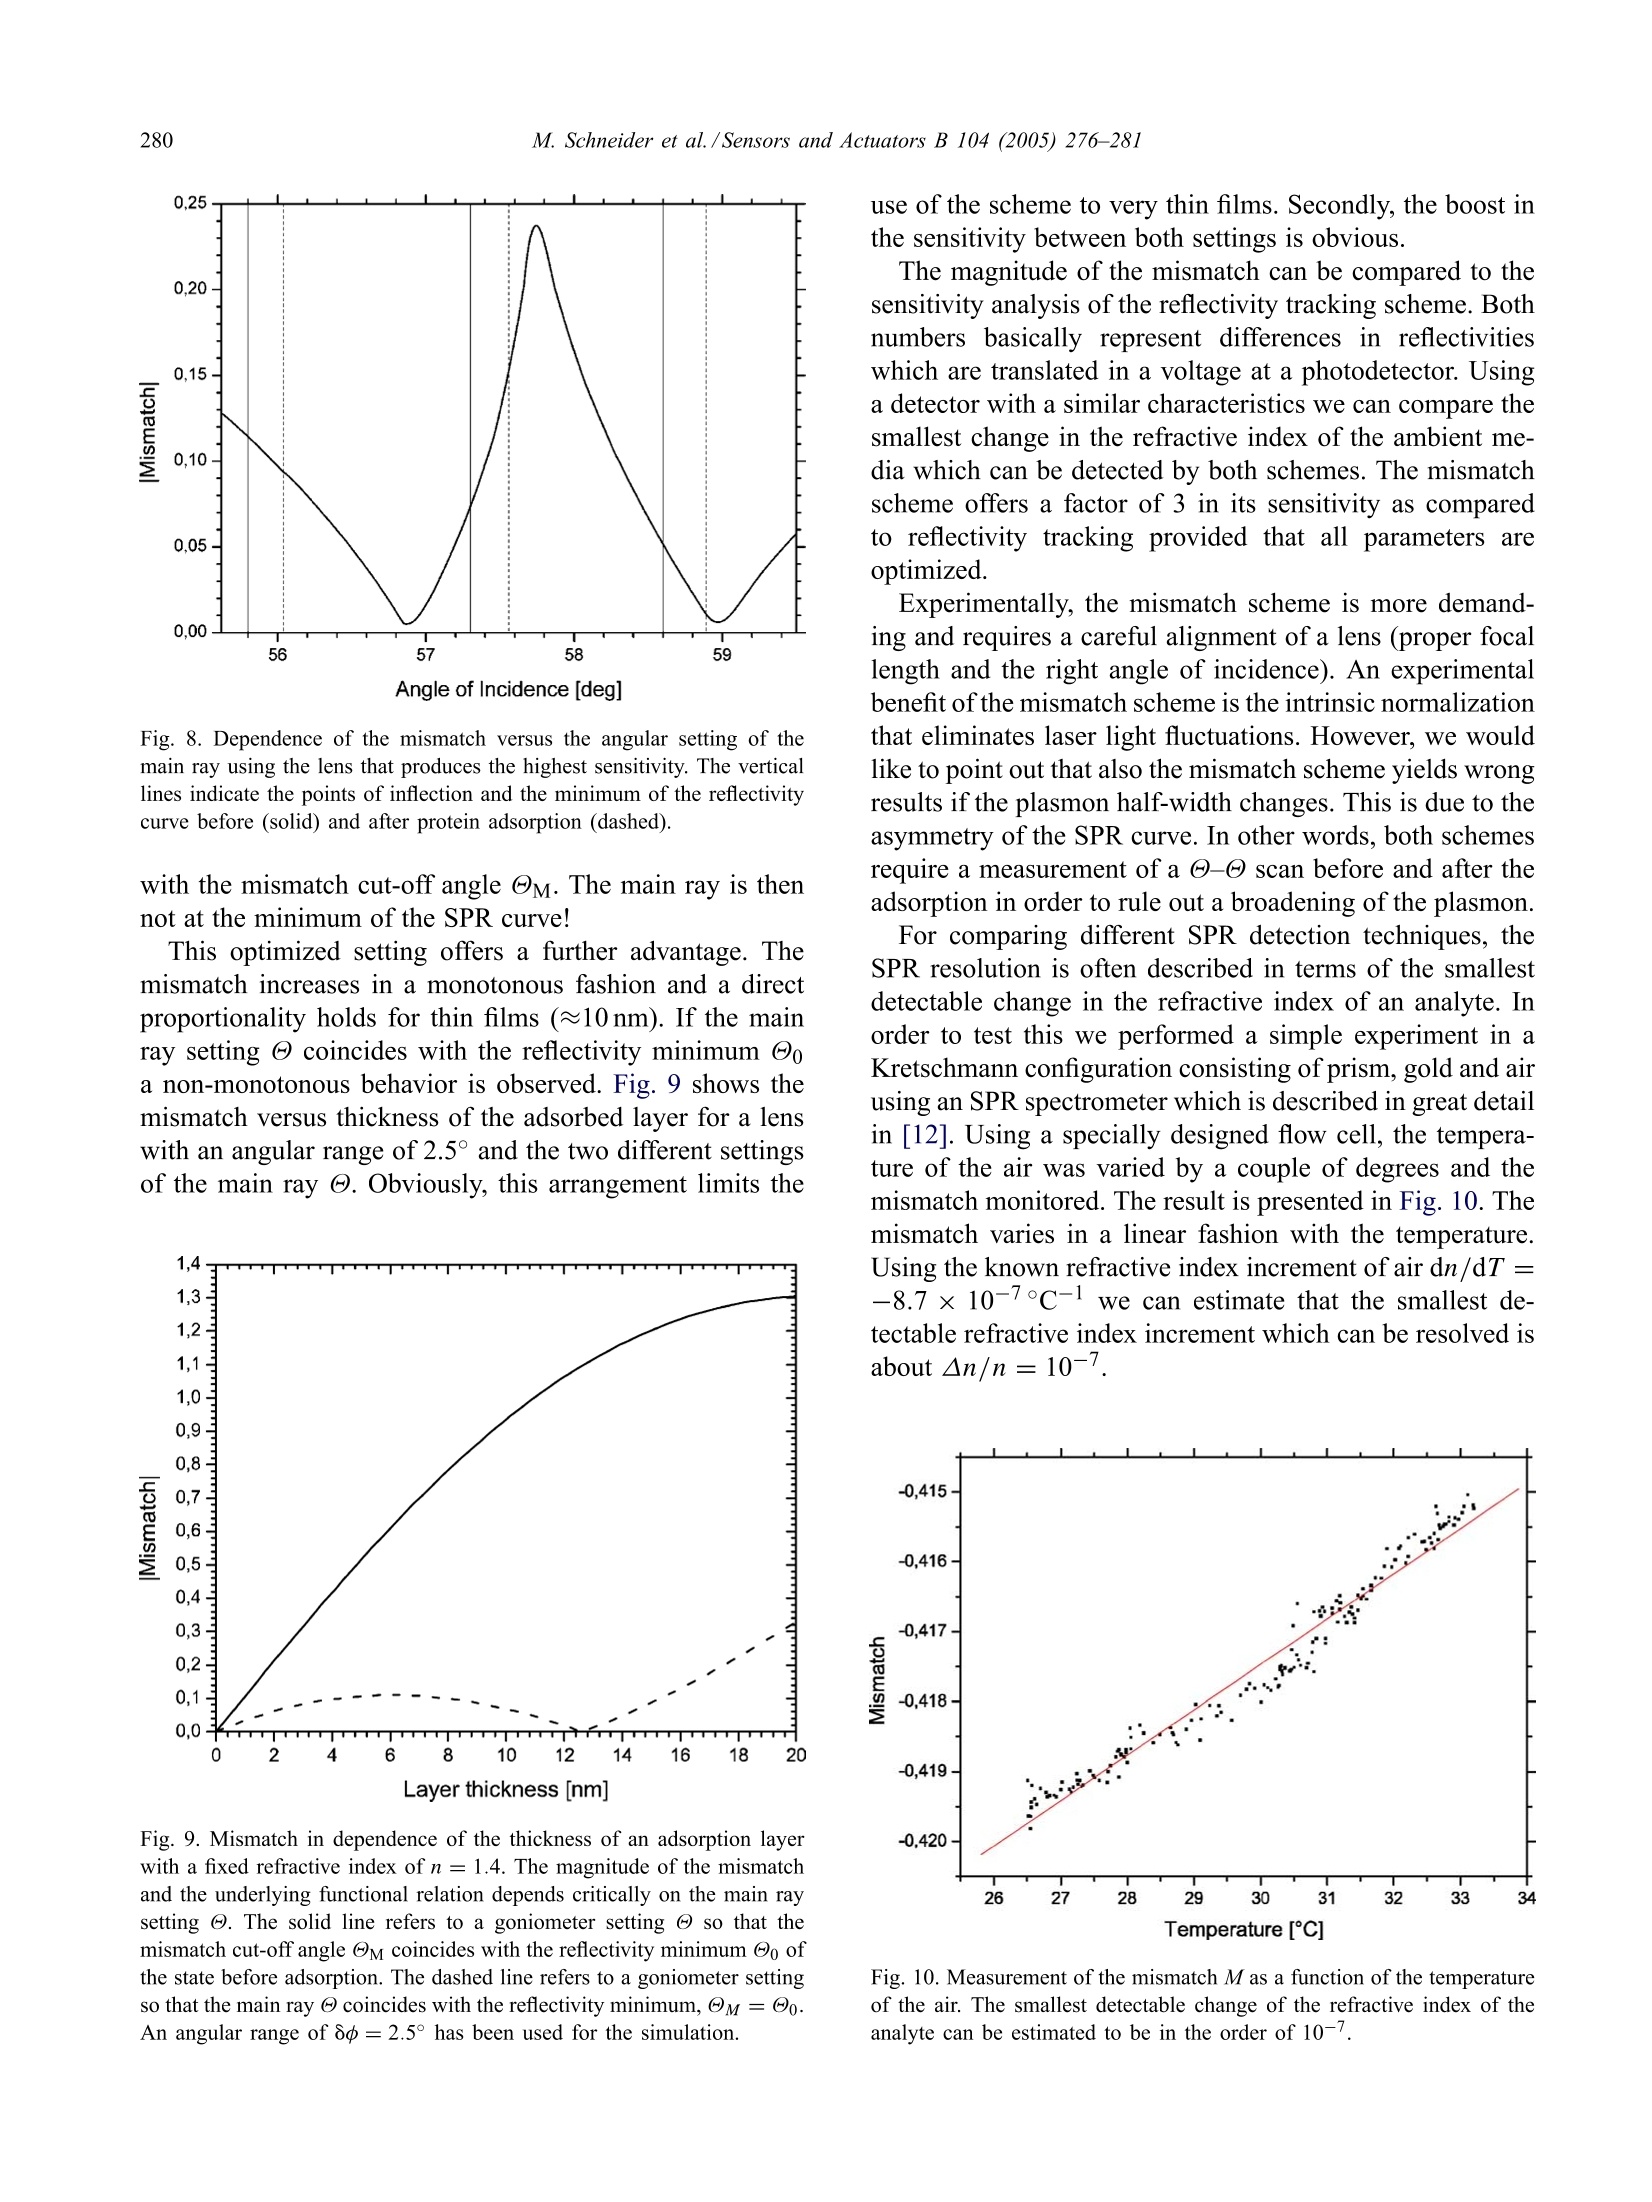
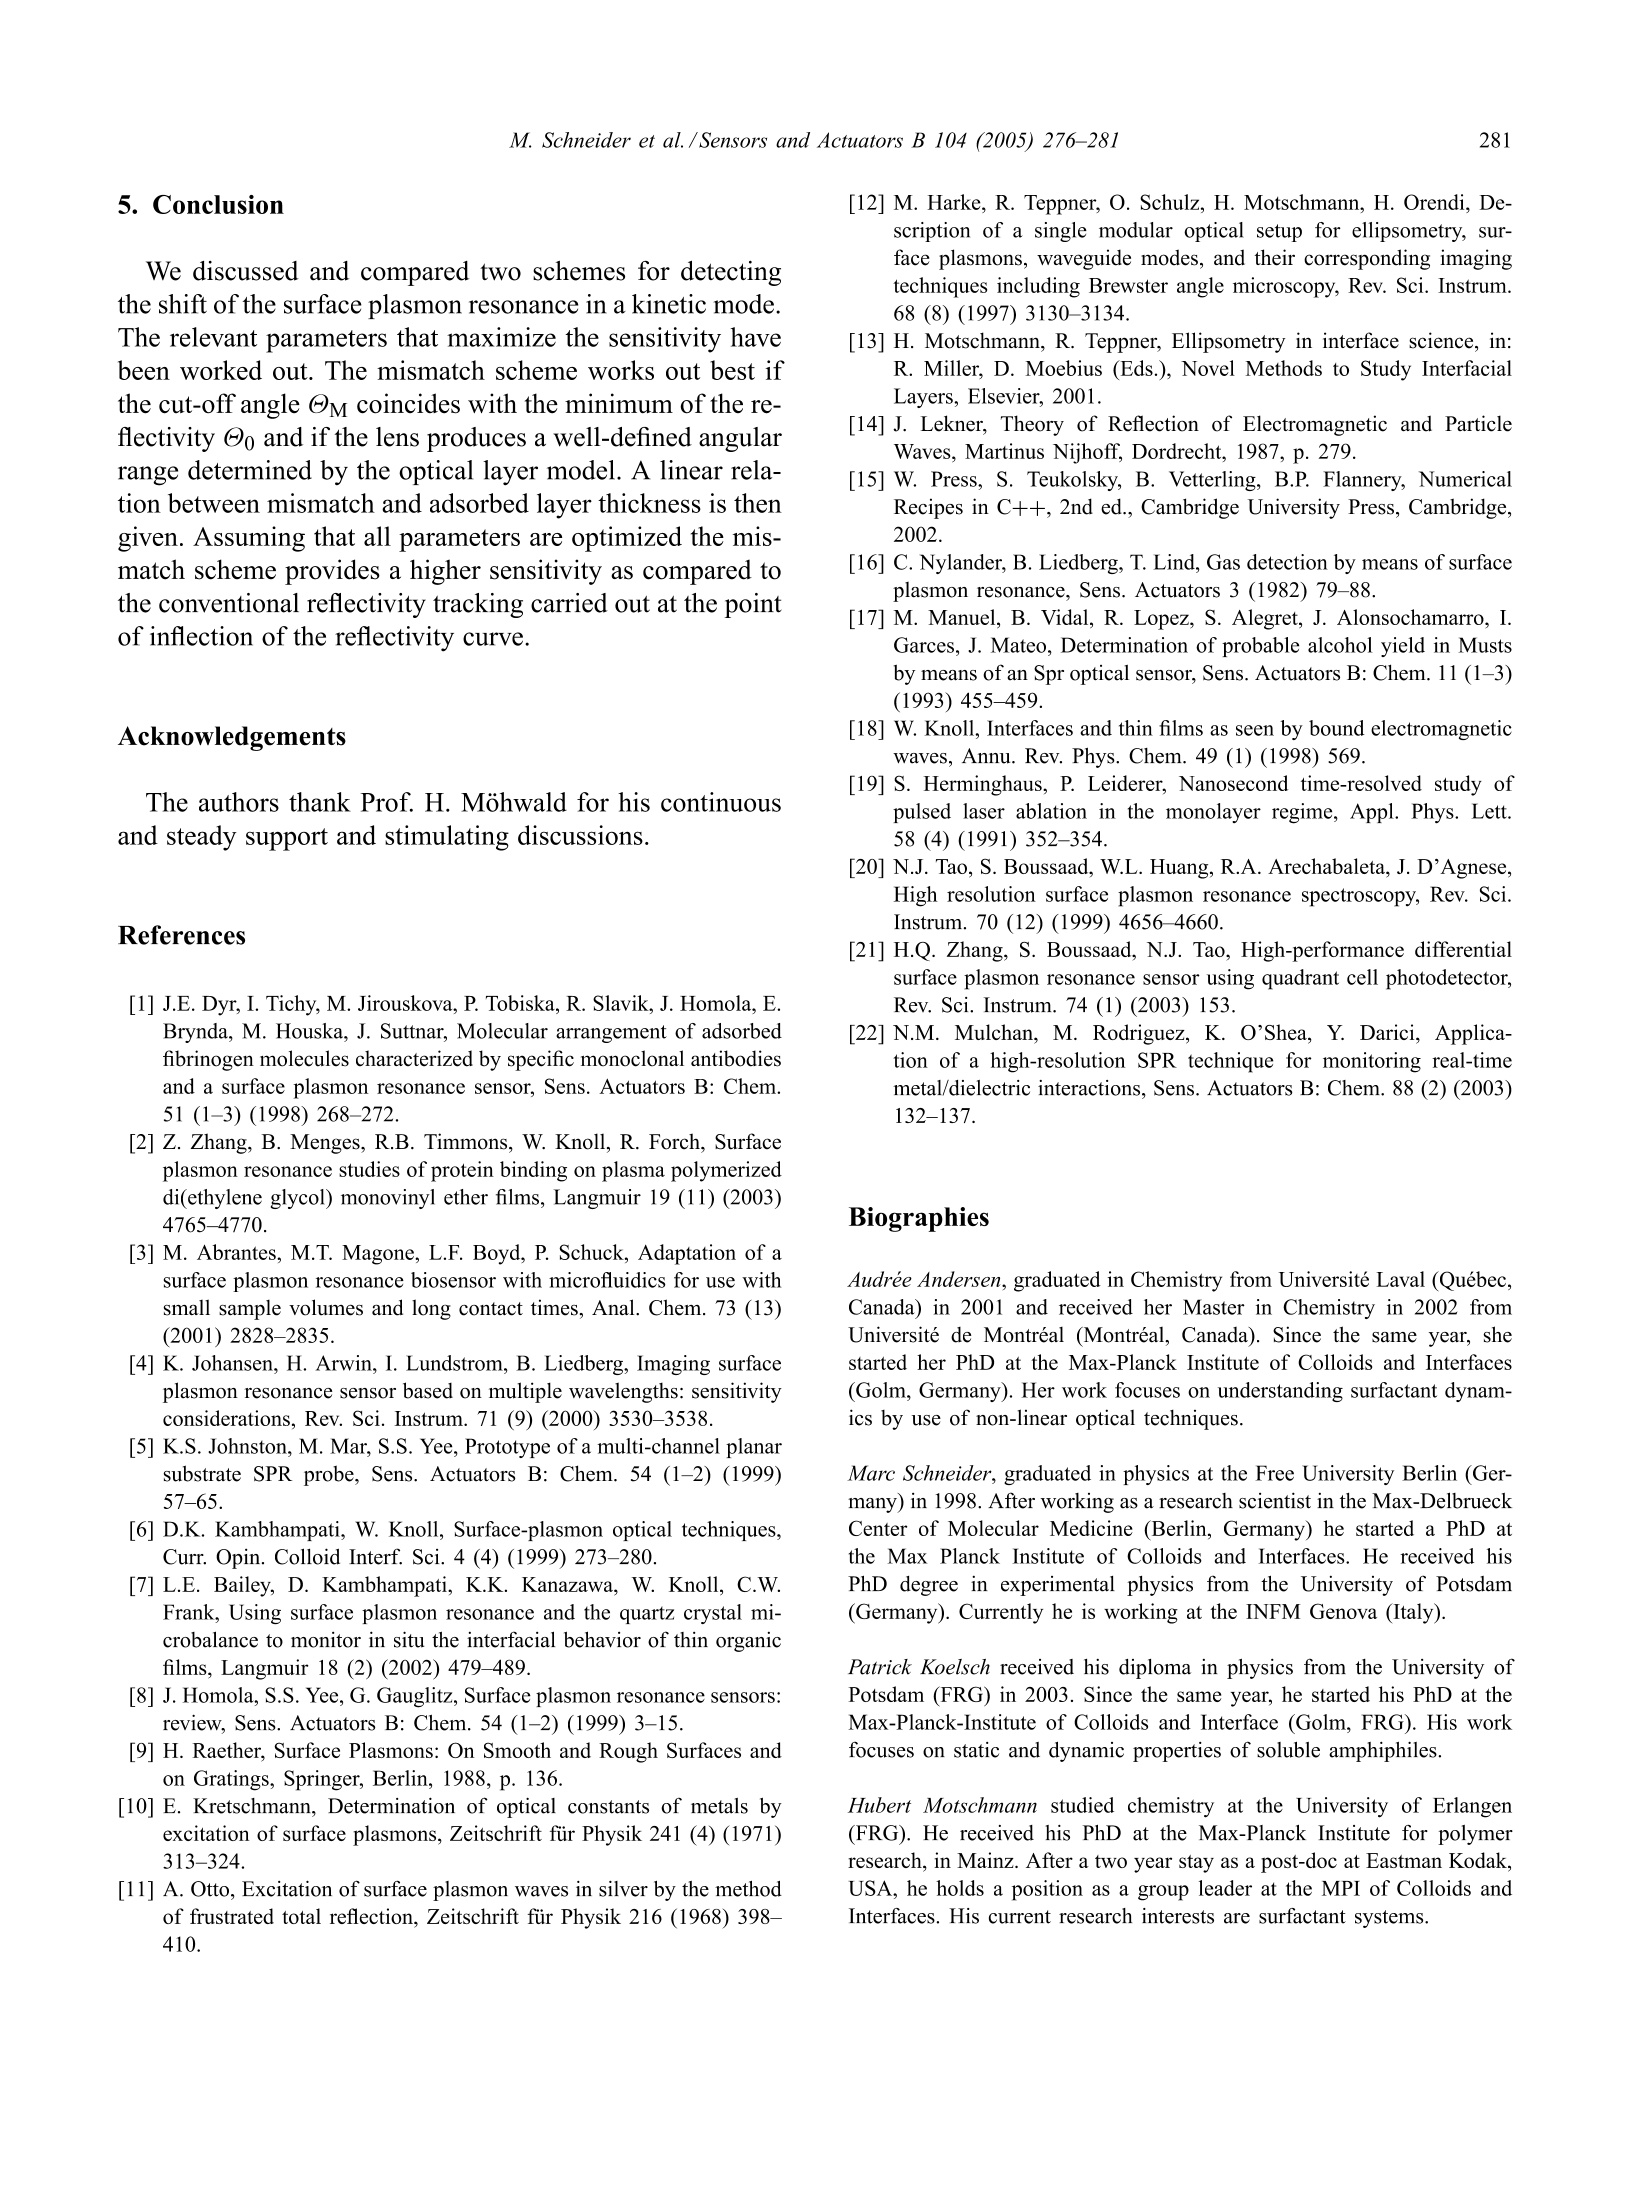
Available online at www.sciencedirect.comSensors and Actuators B 104 (2005)276-281www.elsevier.com/locate/snb 277M. Schneider et al./Sensors and Actuators B 104(2005)276-281 Following fast adsorption processes with surface plasmonspectroscopy: reflectivity versus mismatch tracking M. Schneider,A. Andersen, P. Koelsch, H. Motschmann* Max Planck Institute of Colloids and Interfaces, Am Miihlenberg 1, D-14424 Potsdam, GermanyAvailable online 2 July 2004 Abstract Surface plasmon resonance (SPR) spectroscopy is a widely used optical reflection technique for the characterization of thin films.The central quantity of SPR spectroscopy is the surface plasmon coupling angle as a characteristic signature of the prevailing interfacialarchitecture. Adsorption processes lead to a shift of the surface plasmon resonance which is in the thin film limit directly proportionalto the corresponding mass coverage. The aim of any SPR instrument is a precise measurement of the coupling angle with a sufficienthigh time resolution that fast kinetic processes can be monitored. In this paper, we compare two promising methods, an established onthe reflectivie,ty tracking and a fairly new one, the mismatch tracking. Reflectivity tracking simply records the intensity of the light in thevicinity of the coupling angle. The shift of the plasmon modifies the intensity at the detector which can subsequently be used for dataanalysis. Mismatch tracking is more complex. Light is focused with a lens onto the prism base and the reflected light is detected via abicell detector. The upper and lower cell integrate over a well-defined angular range of the fan of rays produced within the focus. Themismatch in the intensity between the upper and lower segments is evaluated and used to retrieve the unknown film parameter. In thiscontribution we suggest some decisive variations of the originally proposed scheme and demonstrate that the modified mismatch schemeyields a significantly higher sensitivity than the original one. Furthermore, it is demonstrated that this scheme is a superior alternative toreflectivity tracking. C 2004 Elsevier B.V. All rights reserved. 1. Introduction An affinity biosensor faces two major challenges. Thefirst one concerns the underlying chemistry as the sensor re-quires the design of a surface functionalization that showsonly specific binding to the target molecule and suppressesunspecific adsorption. The second challenge is the monitor-ing of the binding events with a sufficient sensitivity andtime resolution. The latter task is quite frequently addressedby various configurations of surface plasmon spectroscopy[1-5]. SPR spectroscopy is an optical reflection technique with ahigh sensitivity to the prevailing interfacial architecture [6].A surface plasmon is a charge density oscillation that mayexist at the interface of two media with dielectric constantsof opposite signs, for instance, a metal and a dielectric. Thecharge density wave is associated with bound TM-polarized ( * C o rresponding a uthor. Tel. : +49-331-567-9254; ) ( fax: +49-331-567-9202.E- m ail address: hubert.motschmann@mpikg-golm.mpg.de ) ( (H. Motschmann). ) ( 0925-4005/$ - s e e front m a tter C 2 0 0 4 Els e vier B.V. All rig h ts re s erved.doi: 1 0.1016/ j .snb.2004.05.017 ) electromagnetic wave at the metal dielectric interface. Theelectric field of this wave has its maximum at the interfaceand decays evanescently into both media. Any change inrefractive index of the bulk or binding events lead to a shift inthe SPR resonance. The shift in the resonance coupling angleis for thin films (≈50 nm) directly proportional to the masscoverage of the adsorption layer [7]. The central quantity inSPR spectroscopy is the resonant coupling angle. The aimof SPR instrumentation is a fast and precise determinationof the resonance position. The excitation of a surface plasmon requires a special ge-ometry. A good overview is given in the review articles [8,9].The most common configurations are angular resolved tech-niques based on the ATR technique [10,11] as outlined inFig. 1. The projection of the wavevector ky changes duringa - angle scan and the resonant conditions are fulfilledat a specific angle, the so-called surface plasmon couplingangle Oo. The formation of the plasmon shows up as a dipin the reflectivity curve. The energy of the laser light is thenconverted in a collective charge density oscillation of theelectrons at the metal dielectric interface. A nice side effectof the high localization of the electric field at the interface is Angle Fig. 1. Kretschmann configuration for the excitation of surface plasmons.The reflectivity of p-polarized light is measured in a @-@ scan as afunction of the angle of incidence @. If the light reflects on a prism, totalreflection (R=1) occurs above a critical angle @tot. If the prism base iscoated with a thin metal layer, a higher reflectivity is observed below thetotal reflection while @tot remains unchanged. The prominent new featureis the formation of the surface plasmon in the total reflection regime. Theuse of the prism changes the slope of the dispersion ω = c x k of theincident wave so that an intersection with the plasmon dispersion relationmay exist. The plasmon formation shows up as a dip in the reflectivitycurve. the robustness of SPR measurements to changes occurringwithin the bulk phase. For instance, it has been demonstratedthat SPR spectra work even in highly scattering turbid solu-tions [12]. An SPR experiment is fairly simple and requires the mea-surement of the reflectivity of p-polarized light as a functionof the angle of incidence. The classical experimental set-upuses a two circle goniometer to perform a - scan. Obvi-ously, this is rather slow since the movement of mechanicalparts is required. Hence severa alternatives have been sug-gested. The aim of this paper is to compare two promising mea-surement schemes, an old and widely used one, reflectiv-ity tracking and a rather new one, the so called mismatchtracking. The comparison is mainly based on Fresnel mod-eling, but the paper will also address various experimentalerror sources and how they affect both measurement modes.Both schemes are able to follow the adsorption process witha time resolution determined by the characteristics of theelectronics which is typically in the microseconds range.Furthermore, we suggest some decisive modifications of theoriginally proposed mismatch scheme which boost the sen-sitivity. 2. SPR in kinetic mode In order to compare the different techniques, all our sim-ulations are considering the following experiment, the bind-ing of a protein layer with a refractive index of n = 1.42and a layer thickness of t= 2.5 nm onto a gold surface e=-12.5+i1.5 out of an aqueous solution e =1.777. Thecalculation was done using a wavelength of 633 nm and a90° high index prism n = 1.84. This experiment is the mostcommon application for SPR spectroscopy and a routine ex-periment in many bio-sensing laboratories. All simulations are based on Fresnel theory of stratifiedmedia. The numerical algorithm follows a matrix methodoutlined in greater detail in [13,14]. No simplifying approx-imations are used and the algorithms have been optimizedto account for truncation and round off errors in the nu-merical representation as some of the calculations requirederivatives [15]. 3. Reflectivity tracking Fig. 2 shows the reflectivity as a function of the angle ofincidence. The solid line refers to the state before adsorptionand the dashed line corresponds to the state after adsorption.As a result of the adsorption there is a shift of the couplingangle which is directly proportional to the mass coverage. A convenient and widely used way to follow in situ fastadsorption processes is the reflectivity tracking [16-18]. Theintensity at the detector is monitored at fixed angle of inci-dence in the vicinity of the plasmon coupling angle Oo. Theshift of the plasmon resonance 8@ leads to a decrease or in-crease of the intensity at the detector and can be used for thecalculation of the mass coverage. The time resolution of thisarrangement is given by the characteristics of amplifier andAD converter and an upper limit of a nanosecond has beenreported [19]. The experiment should be carried out at anangle of incidence which provides the highest sensitivity indetecting sub-monolayer coverage. In order to identify thebest setting, we calculate the difference in the reflectivity Fig. 2. The reflectivity before and after protein adsorption (90° prismwith n=1.84, gold:e=-12.5+i1.5 and t=45 nm, protein: n =1.42and t=2.5 nm, water n = 1.333, 入=633nm). The adsorption leads toa shift of the plasmon resonance @o which is the essential parameter ofan SPR curve. Angle of Incidence [deg] Fig. 3. Difference in the reflectivity before Ro and after protein adsorptionRr as a function of the angle of incidence. The solid vertical line refers tothe point of inflection, reflectivity minimum and second point of inflectionof the reflectivity scan before (solid) and after adsorption (dashed). Due tothe asymmetry of the SPR curve the best choice is the point of inflectionat lower angles. before Ro and after adsorption Rf as a function of the angleof incidence. The result is displayed in Fig. 3. The functional relation reveals two maxima which cor-respond to the points of inflection in the reflectivity curve.The reflectivity curve is not symmetric and the point of in-flection at smaller angles is the best choice. The verticallines in Fig.3 indicate the points of inflection and the mini-mum of the corresponding reflectivity curve before and afteradsorption. The difference in the reflectivity is about 0.08and this value can be used for a comparison with the mis-match scheme. Reflectivity tracking is a fast and convenientmeasurement scheme with no special demand on the align-ment. However, several experimental errors sources have tobe considered. The first concern is that a drift of the laserlight intensity or intensity fluctuation caused by the turbidityof the cell may be misinterpreted as a drift in the couplingangle. This problem can be circumvented by a simultaneousdetection ofs- and p-light. In this mode, one irradiates thesample with mixed s- and p-light and splits the beam intos- and p-light after the sample. The s-light, which does notdisplay a surface plasmon, serves as the reference channeland is used for the normalization of the data. Another pro-cess that has to be ruled out is the broadening of the surfaceplasmon. The optical constants of gold may change withtime and this can cause a broadening ofthe resonance. In asimple intensity measurement this would be misinterpretedas an adsorption or desorption process. For this reason it ismandatory to characterize the final state in a conventional-reflectivity scan to rule out this unwanted scenario. Ifall this is properly considered reflectivity tracking is aneasy mean to follow fast adsorption processes. The relationbetween reflectivity and layer thickness is linear for thick-ness up to 10 nm and then it levels off as outlined in Fig. 4. Fig. 4. Dependence of the reflectivity as a function of the layer thicknessfor a fixed setting of the refractive index n=1.4. The angle of incidence@ matches the point of inflection at lower angles. The reflectivity increasesin a monotonous fashion and a direct proportionality holds for a layerthickness up to 10 nm. 4. Mismatch tracking In [20,21] an elegant and simple solution for the measure-ment of fast adsorption processes has been suggested andsuccessfully applied [22]. The measurement scheme takesadvantage of a bicell or a four quadrant photodiode. Thesedetectors are fast, cover a broad dynamic range and show alinear response with respect to the light intensity. The underlying concept is illustrated in Fig. 5. TheKretschmann configuration is used for plasmon excitation.The incident p-polarized light is focused with a lens ontothe prism base. The beam covers therefore a defined angularrange oo at the focus. The reflected light can be regarded as Fig. 5. Illustration of the experimental arrangement for mismatch tracking.The main ray is set to the angle @ and a lens produces a convergentbeam of a defined angular range 8o.The reflected light is then detectedvia a two quadrant diode which is mounted on an translation stage. Thesetting of @ and 8o defines the mismatch cut-off angle @M, which isbasically the angle where the upper and lower half of the bicell detectorrecords the same intensity. To fulfill this condition experimentally thediode can be moved using a translation stage until the intensity readingof the upper and lower segment matches. a fan of rays with an intensity given by the correspondingreflectivity R(@). The light is then detected via a two quad-rant diode which is mounted on a translation stage. Theupper segment A integrates over the angular range -8until oM, whereas the lower segment B integrates over Mand +8d. For the understanding of the calculations andthe experiment it is important to distinguish the followingexperimental parameters: the main ray setting @, which isdetermined by the goniometer, the angular range 8o, whichis given by the focal length of the lens and the laser beamdiameter, the plasmon coupling angle @o, which is givenby the reflectivity minimum of the SPR curve and the mis-match cut-off angle M, which is basically the angle wherethe upper and lower half of the bicell detector record thesame intensity. The intensity reading of both photodiode segments definesthe mismatch M: The suggested experimental protocol goes as follows [20]:Before each measurement the prism was rotated so that therewas a dark line located at the center of the laser beam. Thisdark line corresponds to the plasmon coupling angle Oo.Then the intensity falling on the two cells of the detectorwas balanced by moving the diode until the mismatch Mvanishes. In other words, the plasmon coupling angle Oomatches the goniometer setting . Fig. 6 illustrates the experiment using a lens producingan angular range of 8d=2.0°.The SPR resonance curveis asymmetric and for this reason the minimum of the SPRreflectivity Oo does not coincide with the mismatch cut-offangle M. The mismatch vanishes if the upper segment in- Fig. 6. Illustration of the mismatch concept using a goniometer setting @oand an angular range of 8p=2.0°. The vertically striped area matchesthe diagonal striped area and the mismatch M vanishes. All settings arethen kept fixed and a mismatch is observed as a consequence of theadsorption. The solid line refers to the reflectivity before and the dashedone after adsorption. Fig. 7. Magnitude of the mismatch as a function of the angular range ooproduced by lens and the main ray setting of the goniometer. tegrates over the horizontally striped angular range and thelower segment integrates over the angular range marked bythe diagonal stripes are equal. Upon adsorption the reflectiv-ity curve is modified (shifted) and as a result a non-vanishingmismatch is detected. The dotted line refers to the reflectiv-ity after adsorption. The magnitude of the mismatch is thenused for the interpretation of the adsorption process as out-lined in the next section. The mismatch depends on the angle of incidence of themain ray @ and the angular range 8dproduced by the lens.Fig. 7 illustrates a simulation of the magnitude of the mis-match M| in dependence of the main ray setting @ and 8p.The underlying relation reveals a non-monotonous behaviorwith a pronounced maximum. Obviously, it is critical to adjust both quantities @ and 8ocarefully in order to maximize the sensitivity. In our examplean angular range of 8p=2.5° works out best. Furthermore,it is decisive that the main ray setting @ does not coincidewith the plasmon coupling angle @o as suggested in theoriginal protocol. Fig. 8 shows the dependence of the mismatch versus theangular setting of the main ray using the lens that providesthe highest sensitivity. The dependence reveals a pronouncedmaximum. The critical points of the -@ reflectivity scansare indicated by vertical lines. The maximum in Fig. 8 doesnot correlate with the points of inflection nor with the SPRcoupling angle Oo. The right angle choice provides a factorof four higher sensitivity as compared to the setting wherethe main ray coincides with the coupling angle Oo. Thereis a simple physical interpretation for the optimized angularsetting. Once the angle of incidence is fixed the integrationlimits are defined by the angular range of the lens. Themaximum sensitivity is obtained, when the integration limitsare such, that the mismatch cut-off angle M equals theminimum of the reflectivity curve Oo. In other words thebest sensitivity is achieved if the angle of incidence @ ischosen such that minimum in the reflectivity Oo coincides Fig. 8. Dependence of the mismatch versus the angular setting of themain ray using the lens that produces the highest sensitivity. The verticallines indicate the points of inflection and the minimum of the reflectivitycurve before (solid) and after protein adsorption (dashed). with the mismatch cut-off angle @M. The main ray is thennot at the minimum of the SPR curve! This optimized setting offers a further advantage. Themismatch increases in a monotonous fashion and a directproportionality holds for thin films (≈10 nm). If the mainray setting @ coincides with the reflectivity minimum @oa non-monotonous behavior is observed. Fig. 9 shows themismatch versus thickness of the adsorbed layer for a lenswith an angular range of 2.5° and the two different settingsof the main ray @. Obviously, this arrangement limits the Fig. 9. Mismatch in dependence of the thickness of an adsorption layerwith a fixed refractive index of n= 1.4. The magnitude of the mismatchand the underlying functional relation depends critically on the main raysetting @. The solid line refers to a goniometer setting @ so that themismatch cut-off angle M coincides with the reflectivity minimum Oo ofthe state before adsorption. The dashed line refers to a goniometer settingso that the main ray @coincides with the reflectivity minimum,@M=@0.An angular range of 80=2.5° has been used for the simulation. use of the scheme to very thin films. Secondly, the boost inthe sensitivity between both settings is obvious. The magnitude of the mismatch can be compared to thesensitivity analysis of the reflectivity tracking scheme. Bothnumbers basically represent differences in reflectivitieswhich are translated in a voltage at a photodetector. Usinga detector with a similar characteristics we can compare thesmallest change in the refractive index of the ambient me-dia which can be detected by both schemes. The mismatchscheme offers a factor of 3 in its sensitivity as comparedto reflectivity tracking provided that all parameters areoptimized. Experimentally, the mismatch scheme is more demand-ing and requires a careful alignment of a lens (proper focallength and the right angle of incidence). An experimentalbenefit of the mismatch scheme is the intrinsic normalizationthat eliminates laser light fluctuations. However, we wouldlike to point out that also the mismatch scheme yields wrongresults if the plasmon half-width changes. This is due to theasymmetry ofthe SPR curve. In other words, both schemesrequire a measurement of a @-@ scan before and after theadsorption in order to rule out a broadening of the plasmon. For comparing different SPR detection techniques, theSPR resolution is often described in terms of the smallestdetectable change in the refractive index of an analyte. Inorder to test this we performed a simple experiment in aKretschmann configuration consisting of prism, gold and airusing an SPR spectrometer which is described in great detailin [12]. Using a specially designed flow cell, the tempera-ture of the air was varied by a couple of degrees and themismatch monitored. The result is presented in Fig. 10. Themismatch varies in a linear fashion with the temperature.Using the known refractive index increment of air dn/dT =-8.7x 10⁻⁷°c-l we can estimate that the smallest de-tectable refractive index increment which can be resolved isabout An/n= 10-'. Fig. 10. Measurement of the mismatch M as a function of the temperatureof the air. The smallest detectable change of the refractive index of theanalyte can be estimated to be in the order of 10-'. 5. Conclusion We discussed and compared two schemes for detectingthe shift of the surface plasmon resonance in a kinetic mode.The relevant parameters that maximize the sensitivity havebeen worked out. The mismatch scheme works out best ifthe cut-offangle @M coincides with the minimum of the re-flectivity @o and if the lens produces a well-defined angularrange determined by the optical layer model. A linear rela-tion between mismatch and adsorbed layer thickness is thengiven. Assuming that all parameters are optimized the mis-match scheme provides a higher sensitivity as compared tothe conventional reflectivity tracking carried out at the pointof inflection of the reflectivity curve. Acknowledgements The authors thank Prof. H. Mohwald for his continuousand steady support and stimulating discussions. References ( [ 1 ] J.E. Dyr, I . Ti chy,M . Jirouskova, P. To b iska, R. S la v ik, J . H omola, E.Brynda, M. H ouska, J. S uttnar, Molecular arrangement of adsorbed f ibrinogen m olecules characterized by specific m onoclonal antibodiesand a s urface plasmon r esonance s ensor, Sens. Actuators B: Chem.51(1- 3 )(1998) 268- 2 72. ) ( [2] Z. Zhang, B. Menges, R.B. T immons, W. Kn o ll, R. Fo r ch, Surface p lasmon r e sonance st u dies of p r otein b i nding on plasma po l ymerizeddi(ethylene glycol) monovinyl e t her films, L angmuir 19 (1 1 ) (20 0 3)4765-4770. ) [3] M. Abrantes, M.T. Magone, L.F. Boyd, P. Schuck, Adaptation of asurface plasmon resonance biosensor with microfluidics for use withsmall sample volumes and long contact times, Anal. Chem. 73 (13)(2001)2828-2835. ( [4] K. J ohansen, H. Arwin, I. L u ndstrom, B. Li e dberg, Imaging surf a ce p lasmon r e sonance sensor based on multiple wavelengths: sensitivity c onsiderations, Rev. S ci.Instrum. 7 1 (9) (2 0 00) 3 5 30-3538. ) ( [ 5 ]K.S. Johnston, M. M a r, S.S. Y e e, P r ototype of a multi-channel planar s ubstrate SPR p robe, S ens. A ctuators B : C h em. 54 (1 - 2) (1999) 57-65. ) ( [ 6] D.K. Kambhampati, W. Kn o ll, Surface-plasmon op t ical techniques, C u r r . O pin. C olloid I n terf. Sci. 4 (4) (1 999) 273- 2 80. ) ( [7] L . E. Baile y , D . Kambhampati, K.K. K anazawa, W . K n oll, C.W. F rank, U sing s u rface p l asmon re s onance and the qua r tz cry s tal mi - crobalance t o m o nitor in si t u the interfacial b e havior of thin organicfilms, Langmuir 18 (2)(2002)479- 4 89. ) ( [8] J. Homola, S .S. Yee, G. Gauglitz, Sur f ace plasmon resonance s e nsors: r eview, Sens. Actuators B: Chem. 54 (1-2) (1999) 3-15. ) ( [9] H. Raether, Surface Plasmons: On Smooth and R o ugh Surfaces a n d o n Gratings, S p ringer, B e rlin, 1 9 88, p. 13 6 . ) ( [ 1 0] E. Kretschmann, D etermination of optical constants ofm e tals b y excitation of surface plasmons, Z eitschrift fur Physik 241 ( 4) ( 1 971)313-324. ) ( [ 1 1] A . Otto, Excitation of surface plasmon waves in s ilver by the method o f frustrated t otal reflection, Zeitschrift fiir Physi k 216 ( 1 968) 3 98-410. ) ( [ 1 2] M. H arke, R. Teppner, O. S chulz, H. M otschmann, H . O r endi, D e - s cription o f a single m o dular op t ical se t up for ellipsometry, sur -f ace plasmons, waveguide modes, a n d t h eir corresponding i magingtechniques i ncluding Brewster a ngle m icroscopy, Rev. S ci. I nstrum.68(8)(1997) 3 130-3134. ) ( [ 1 3] H. Motschmann, R . Te p p ner, El l i p sometry in in t erface s c ience, in: R . M iller, D. M oebius ( Eds.), Novel M ethods t o Study I n terfacial L ayers, E lsevi e r, 2 001. ) ( [ 1 4] J. Lekner, Theory o f R e flection o f E l e ctromagnetic a n d Pa r ticle Waves, Martinus Nijhoff, D ordrecht, 1 987, p. 2 79. ) ( [ 1 5] W. Press, S. T e ukolsky, B . V e tterling, B .P. F lannery, N u merical R ecipes i n C+ +, 2 nd ed., Cambridge Un i versity Press, Cambridge,2002. ) [16] C. Nylander, B. Liedberg, T. Lind, Gas detection by means of surfaceplasmon resonance, Sens. Actuators 3 (1982) 79-88. ( [17] M . Manuel, B. Vi d al, R. L o p ez, S. A l e g ret, J. A lonsochamarro, I. G arces, J . M ateo, Determination o f p r obable alcohol yield i n M u stsby m eans of a n S p r optical sensor, Sens. Actuators B: C h em. 11(1 - 3)(1993) 455- 4 59. ) [18] W. Knoll, Interfaces and thin films as seen by bound electromagneticwaves, Annu. Rev. Phys. Chem. 49 (1) (1998) 569. ( [ 1 9] S. Herminghaus, P . Le i derer, N anosecond ti m e-resolved study ofpulsed l aser abl a tion in the monolayer r egime, A ppl. P h ys. L e tt. 58 ( 4) (1991) 352-354. ) ( [20] N .J. Tao, S. Boussaad, W.L . Huang, R.A. Arechabaleta, J. D’Agnese, H igh resolution surface plasmon r esonance s pectroscopy, Rev. S ci.Instrum. 70 (12) ( 1999) 4656-4660. ) ( [21] H.Q. Z hang, S. B oussaad, N . J. T a o, H i gh-performance differentialsurface plasmon r e sonance sensor using quadrant ce l l p h otodetector, R ev. S ci. I nstrum. 7 4 ( 1) ( 2003) 1 5 3. ) ( [22] N.M. M ul c han, M . R o driguez, K . O ' Shea, Y. Da r ici, A p plica-tion of a h igh-resolution SPR t echnique f o r monitoring real-timemetal/dielectric interactions, Sen s . Actuators B: Chem. 88 (2 ) (2003)132-137. ) Biographies Audree Andersen, graduated in Chemistry from Universite Laval (Quebec,Canada) in 2001 and received her Master in Chemistry in 2002 fromUniversite de Montreal (Montreal, Canada). Since the same year, shestarted her PhD at the Max-Planck Institute of Colloids and Interfaces(Golm, Germany). Her work focuses on understanding surfactant dynam-ics by use of non-linear optical techniques. Marc Schneider, graduated in physics at the Free University Berlin (Ger-many) in 1998.After working as a research scientist in the Max-DelbrueckCenter of Molecular Medicine (Berlin, Germany) he started a PhD atthe Max Planck Institute of Colloids and Interfaces. He received hisPhD degree in experimental physics from the University of Potsdam(Germany). Currently he is working at the INFM Genova (Italy). Patrick Koelsch received his diploma in physics from the University ofPotsdam (FRG) in 2003. Since the same year, he started his PhD at theMax-Planck-Institute of Colloids and Interface (Golm, FRG). His workfocuses on static and dynamic properties of soluble amphiphiles. Hubert Motschmann studied chemistry at the University of Erlangen(FRG). He received his PhD at the Max-Planck Institute for polymerresearch, in Mainz. After a two year stay as a post-doc at Eastman Kodak,USA, he holds a position as a group leader at the MPI of Colloids andInterfaces. His current research interests are surfactant systems.
确定

还剩4页未读,是否继续阅读?

产品配置单


北京欧兰科技发展有限公司为您提供《等离子体中用表面等离子体光谱学跟踪快速吸附过程:反射率和相位失配追踪检测方案(其他生物/生化分析仪)》,该方案主要用于其他中用表面等离子体光谱学跟踪快速吸附过程:反射率和相位失配追踪检测,参考标准--,《等离子体中用表面等离子体光谱学跟踪快速吸附过程:反射率和相位失配追踪检测方案(其他生物/生化分析仪)》用到的仪器有表面等离子共振仪(SPR)(Surface Plasmon Resonance)、Imager sCMOS PIV相机、德国LaVision PIV/PLIF粒子成像测速场仪
推荐专场


相关方案
更多
该厂商其他方案
更多