


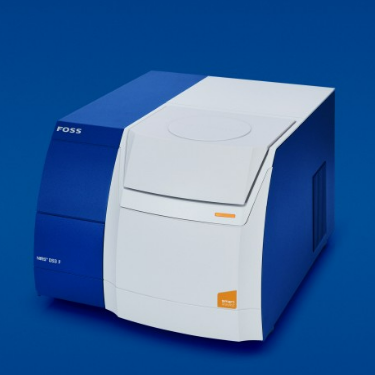
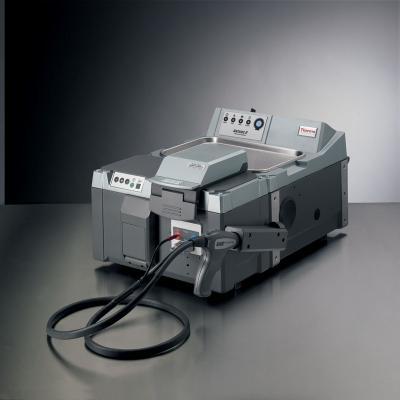
2013年,Metrohm收购Foss NIRSystems Inc.公司,以Metrohm-NIRSystems作为近红外产品品牌开始进军光谱领域,在工业领域开始与Foss公司进行全球战略合作。Metrohm-NIRSystems为客户提供实验室型、旁线以及在线近红外解决方案。 XDS系列近红外产品是新一代的光栅型扫描近红外分析仪,采用基于偏移技术数字全息光栅系统,其对应的NIIST可追溯的标准和方法保证了每台仪器的光度计,波长和带宽等重要技术参数的高度一致,保证了仪器之间定标模型无缝转移并且可实现网络控制操作。基于XDS近红外分析技术,Metrohm-NIRSystems开发了一系列新一代的过程分析仪,用于制药和化工领域的实时分析。样品无需破损、测试精确等优点都在加工过程、搅拌器、干燥器、反应器等不同阶段的检测中得到了体现。XDS近红外在线分析仪典型的应用案例包括炼油厂、石化企业、聚合过程、原料药的溶媒保护等的反应监测和终点判断,以及压缩聚合物薄膜或包衣的分析。
方案详情

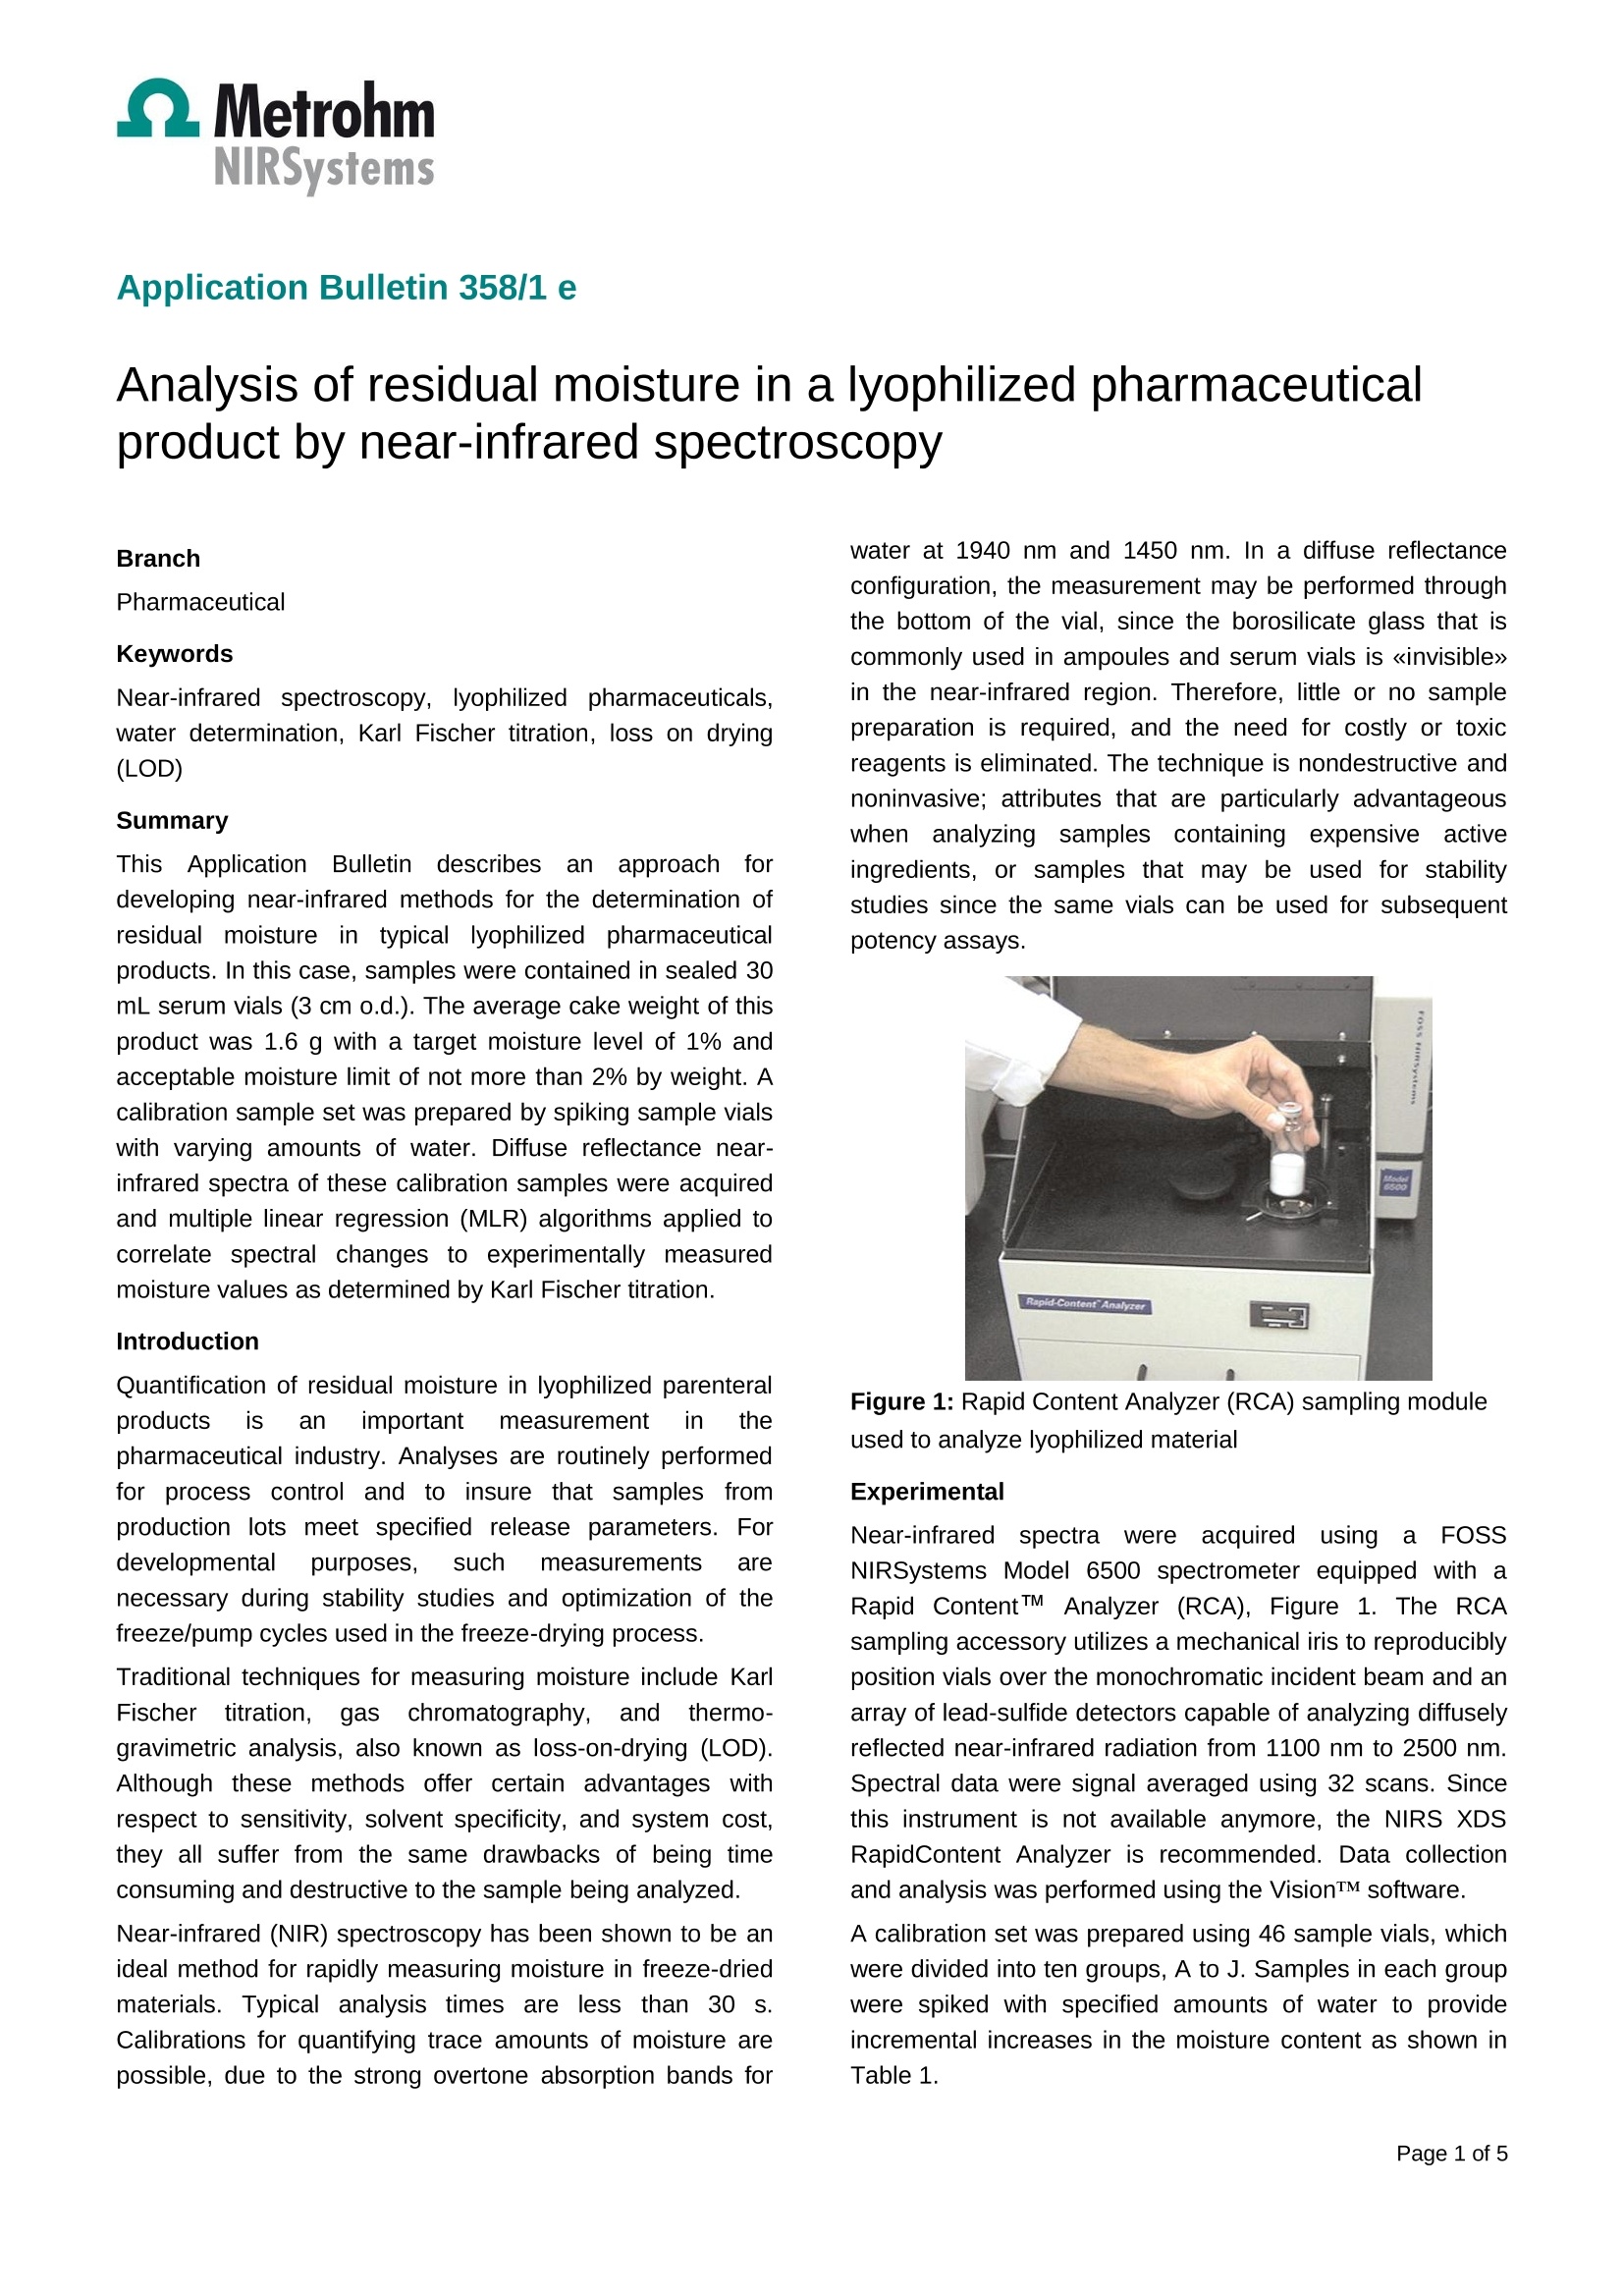
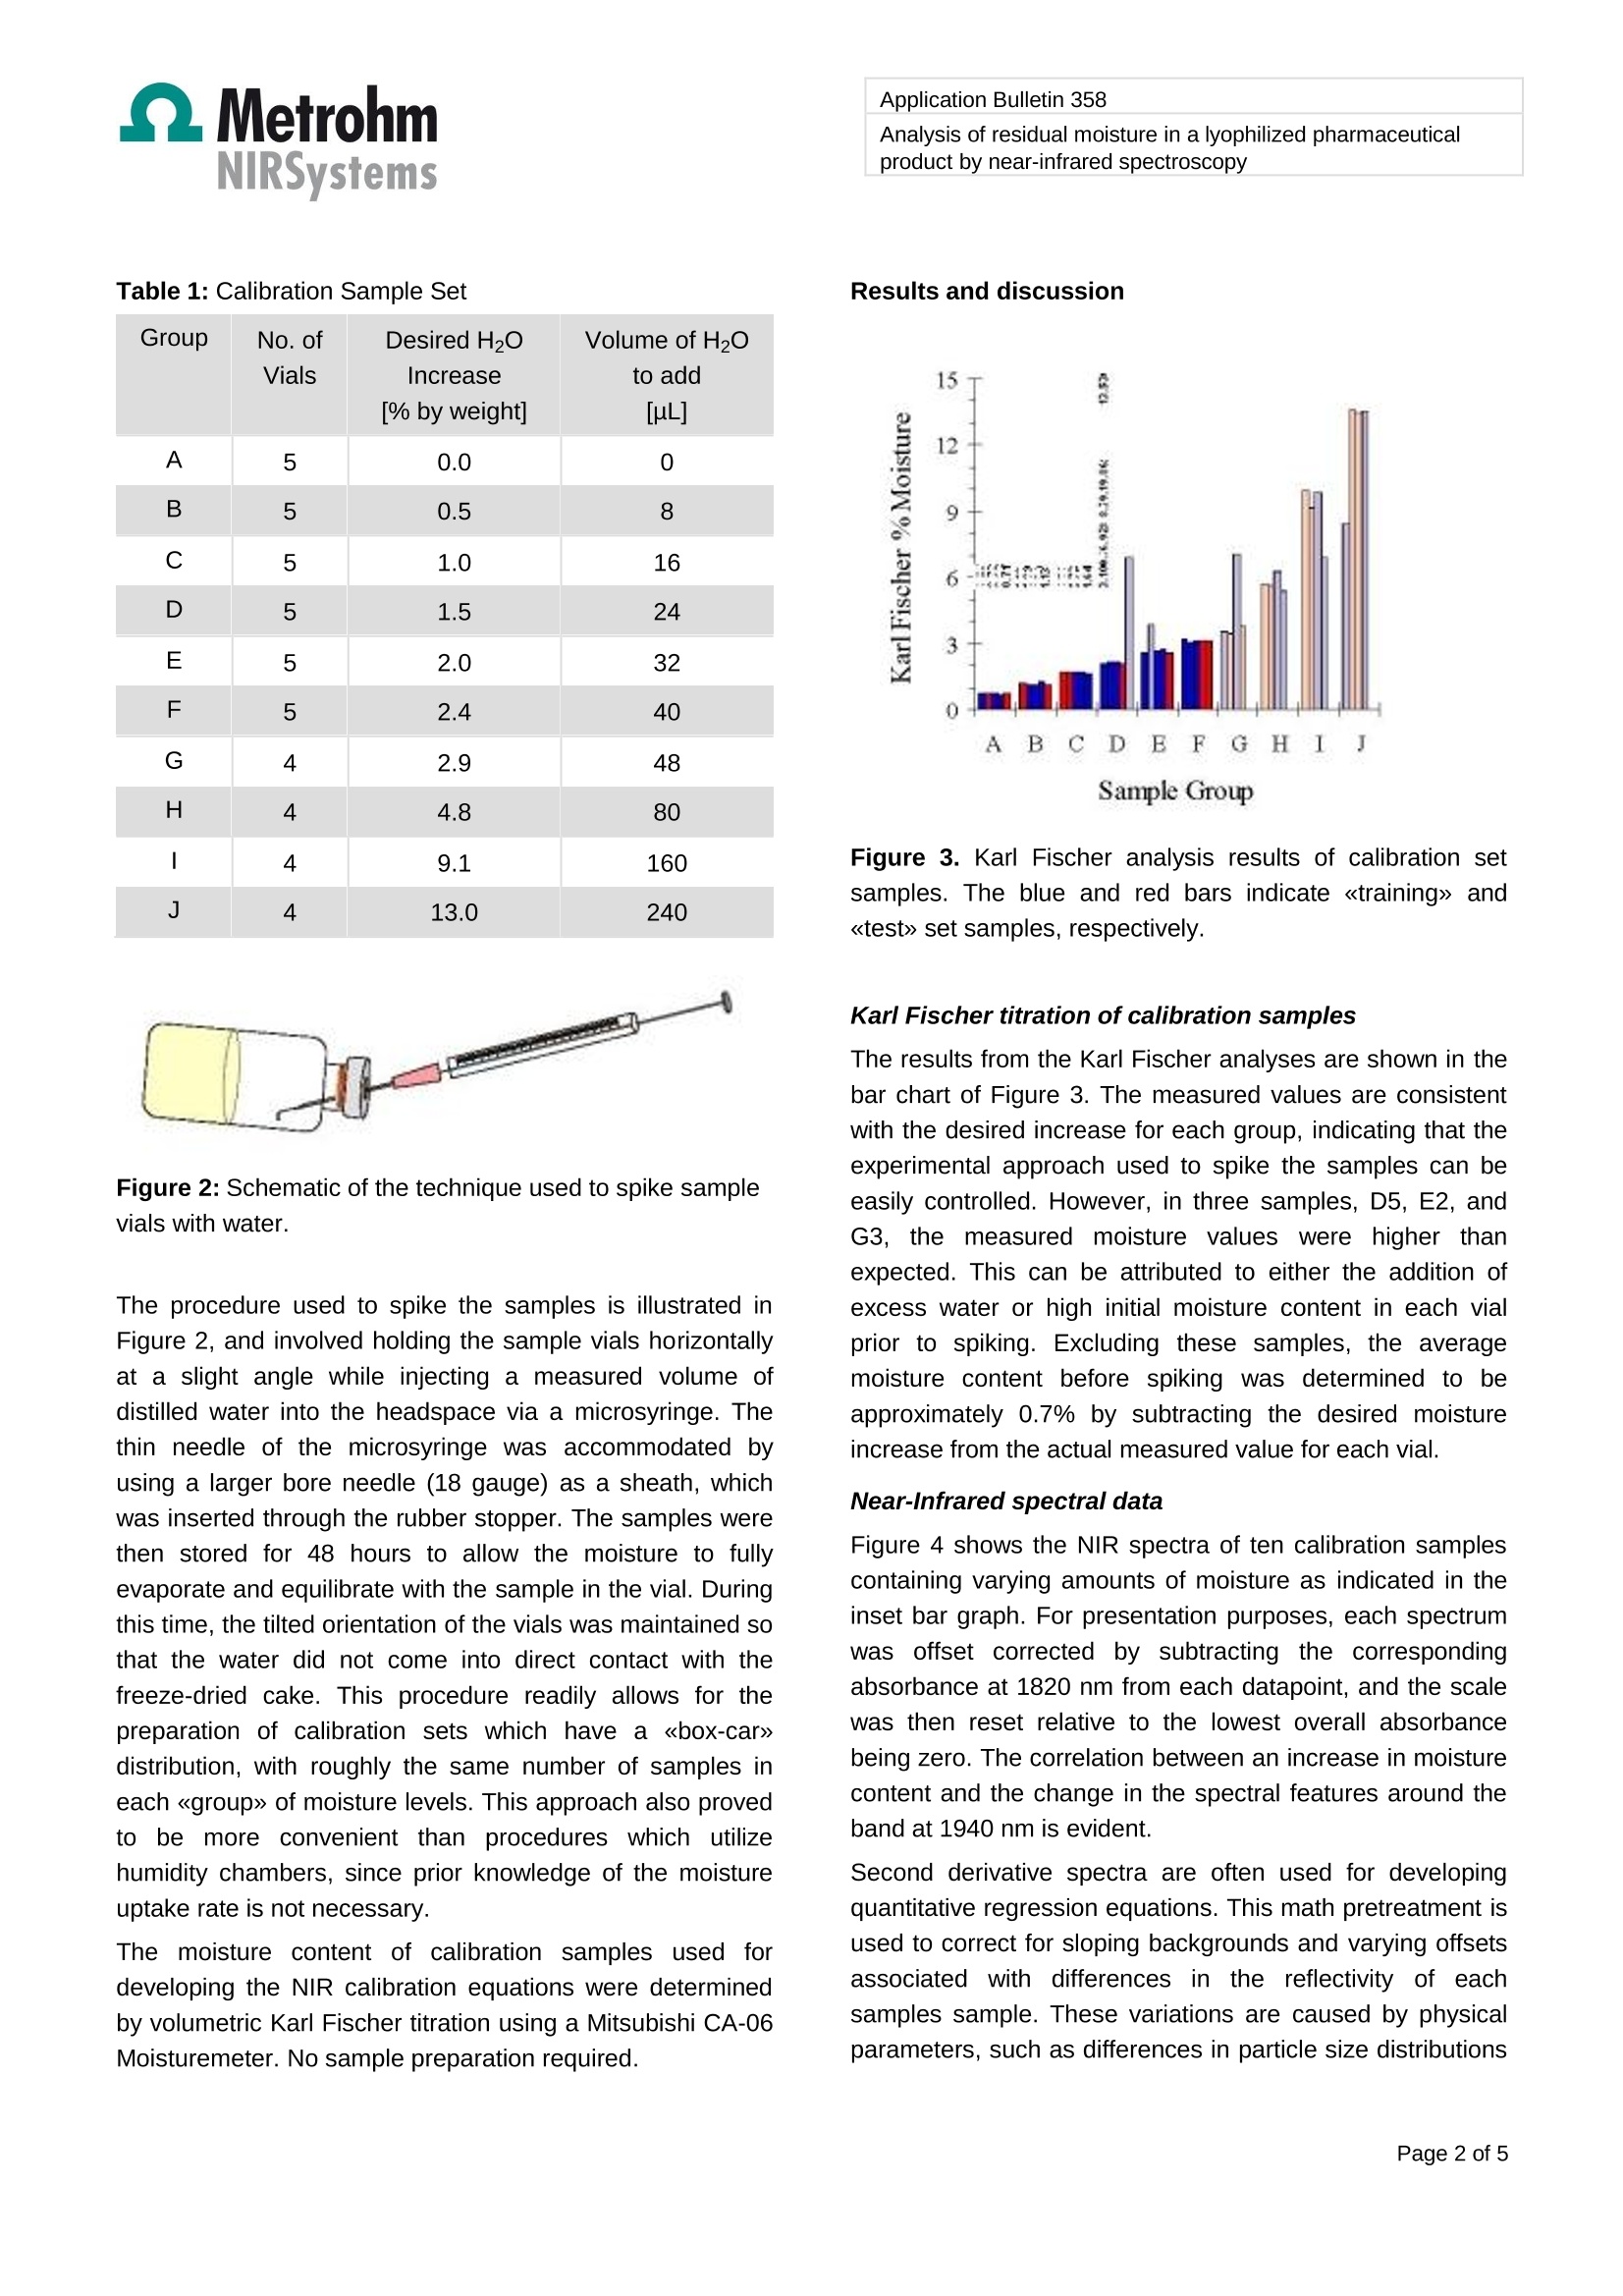
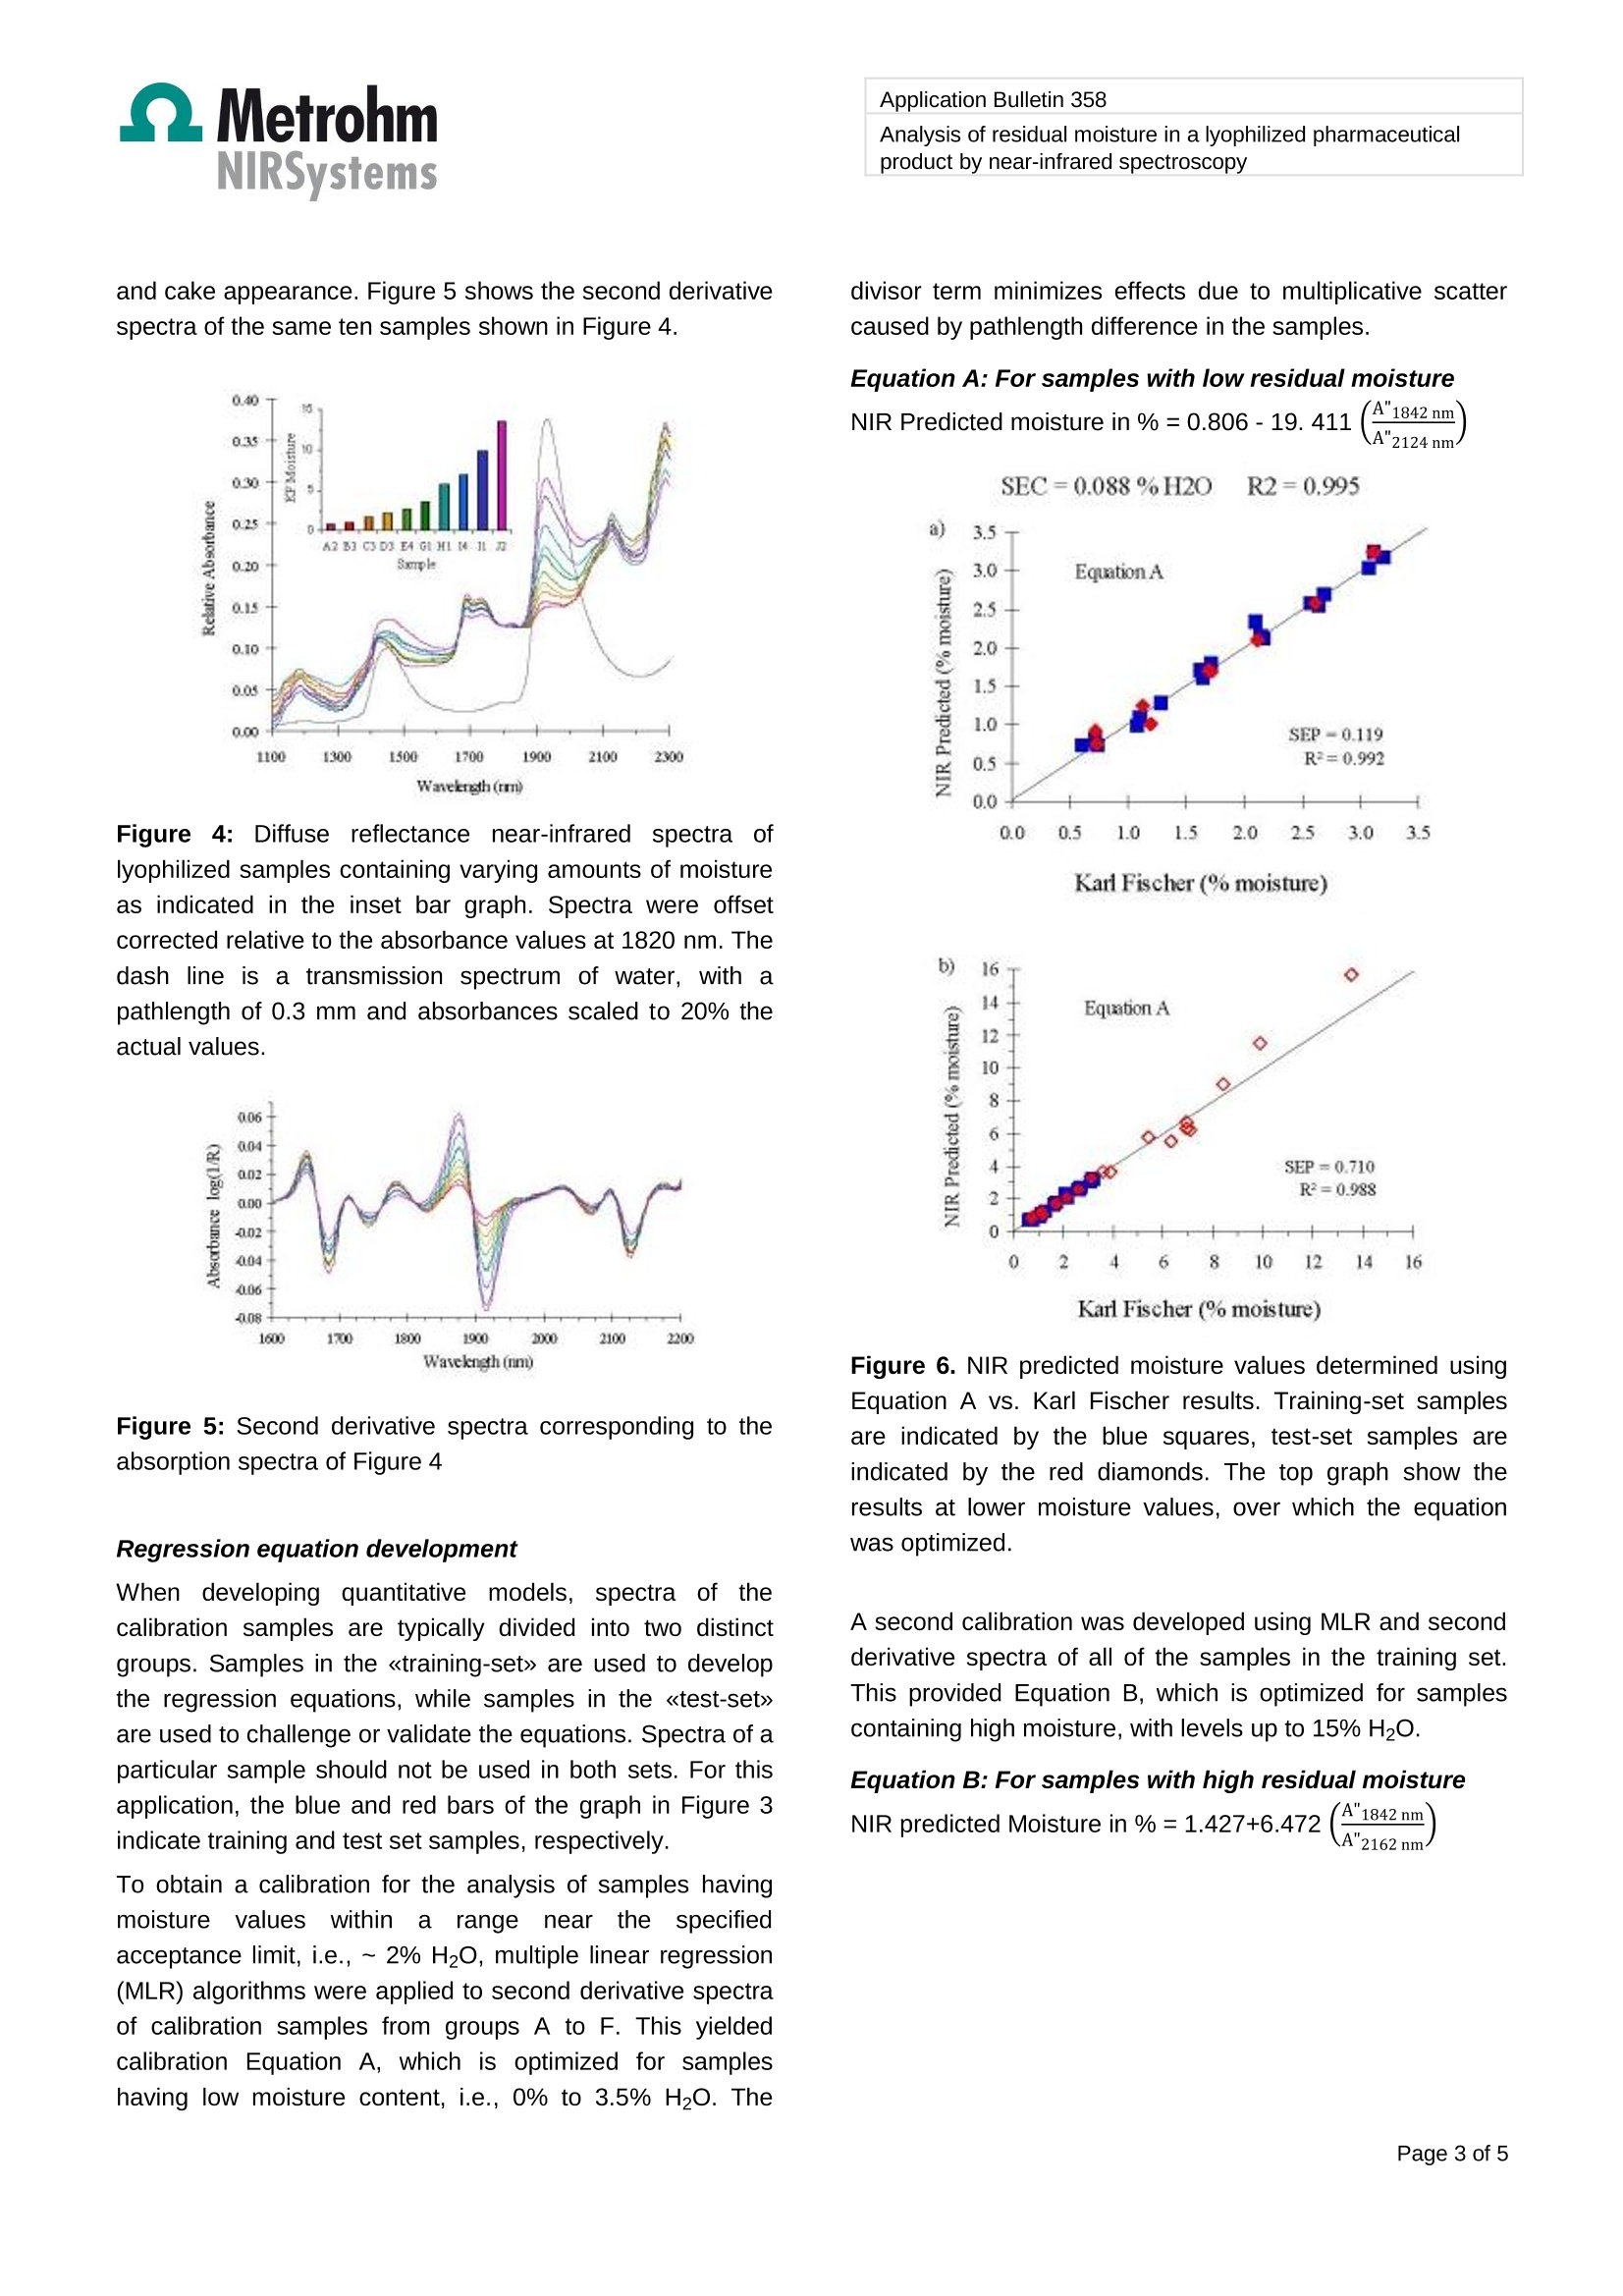
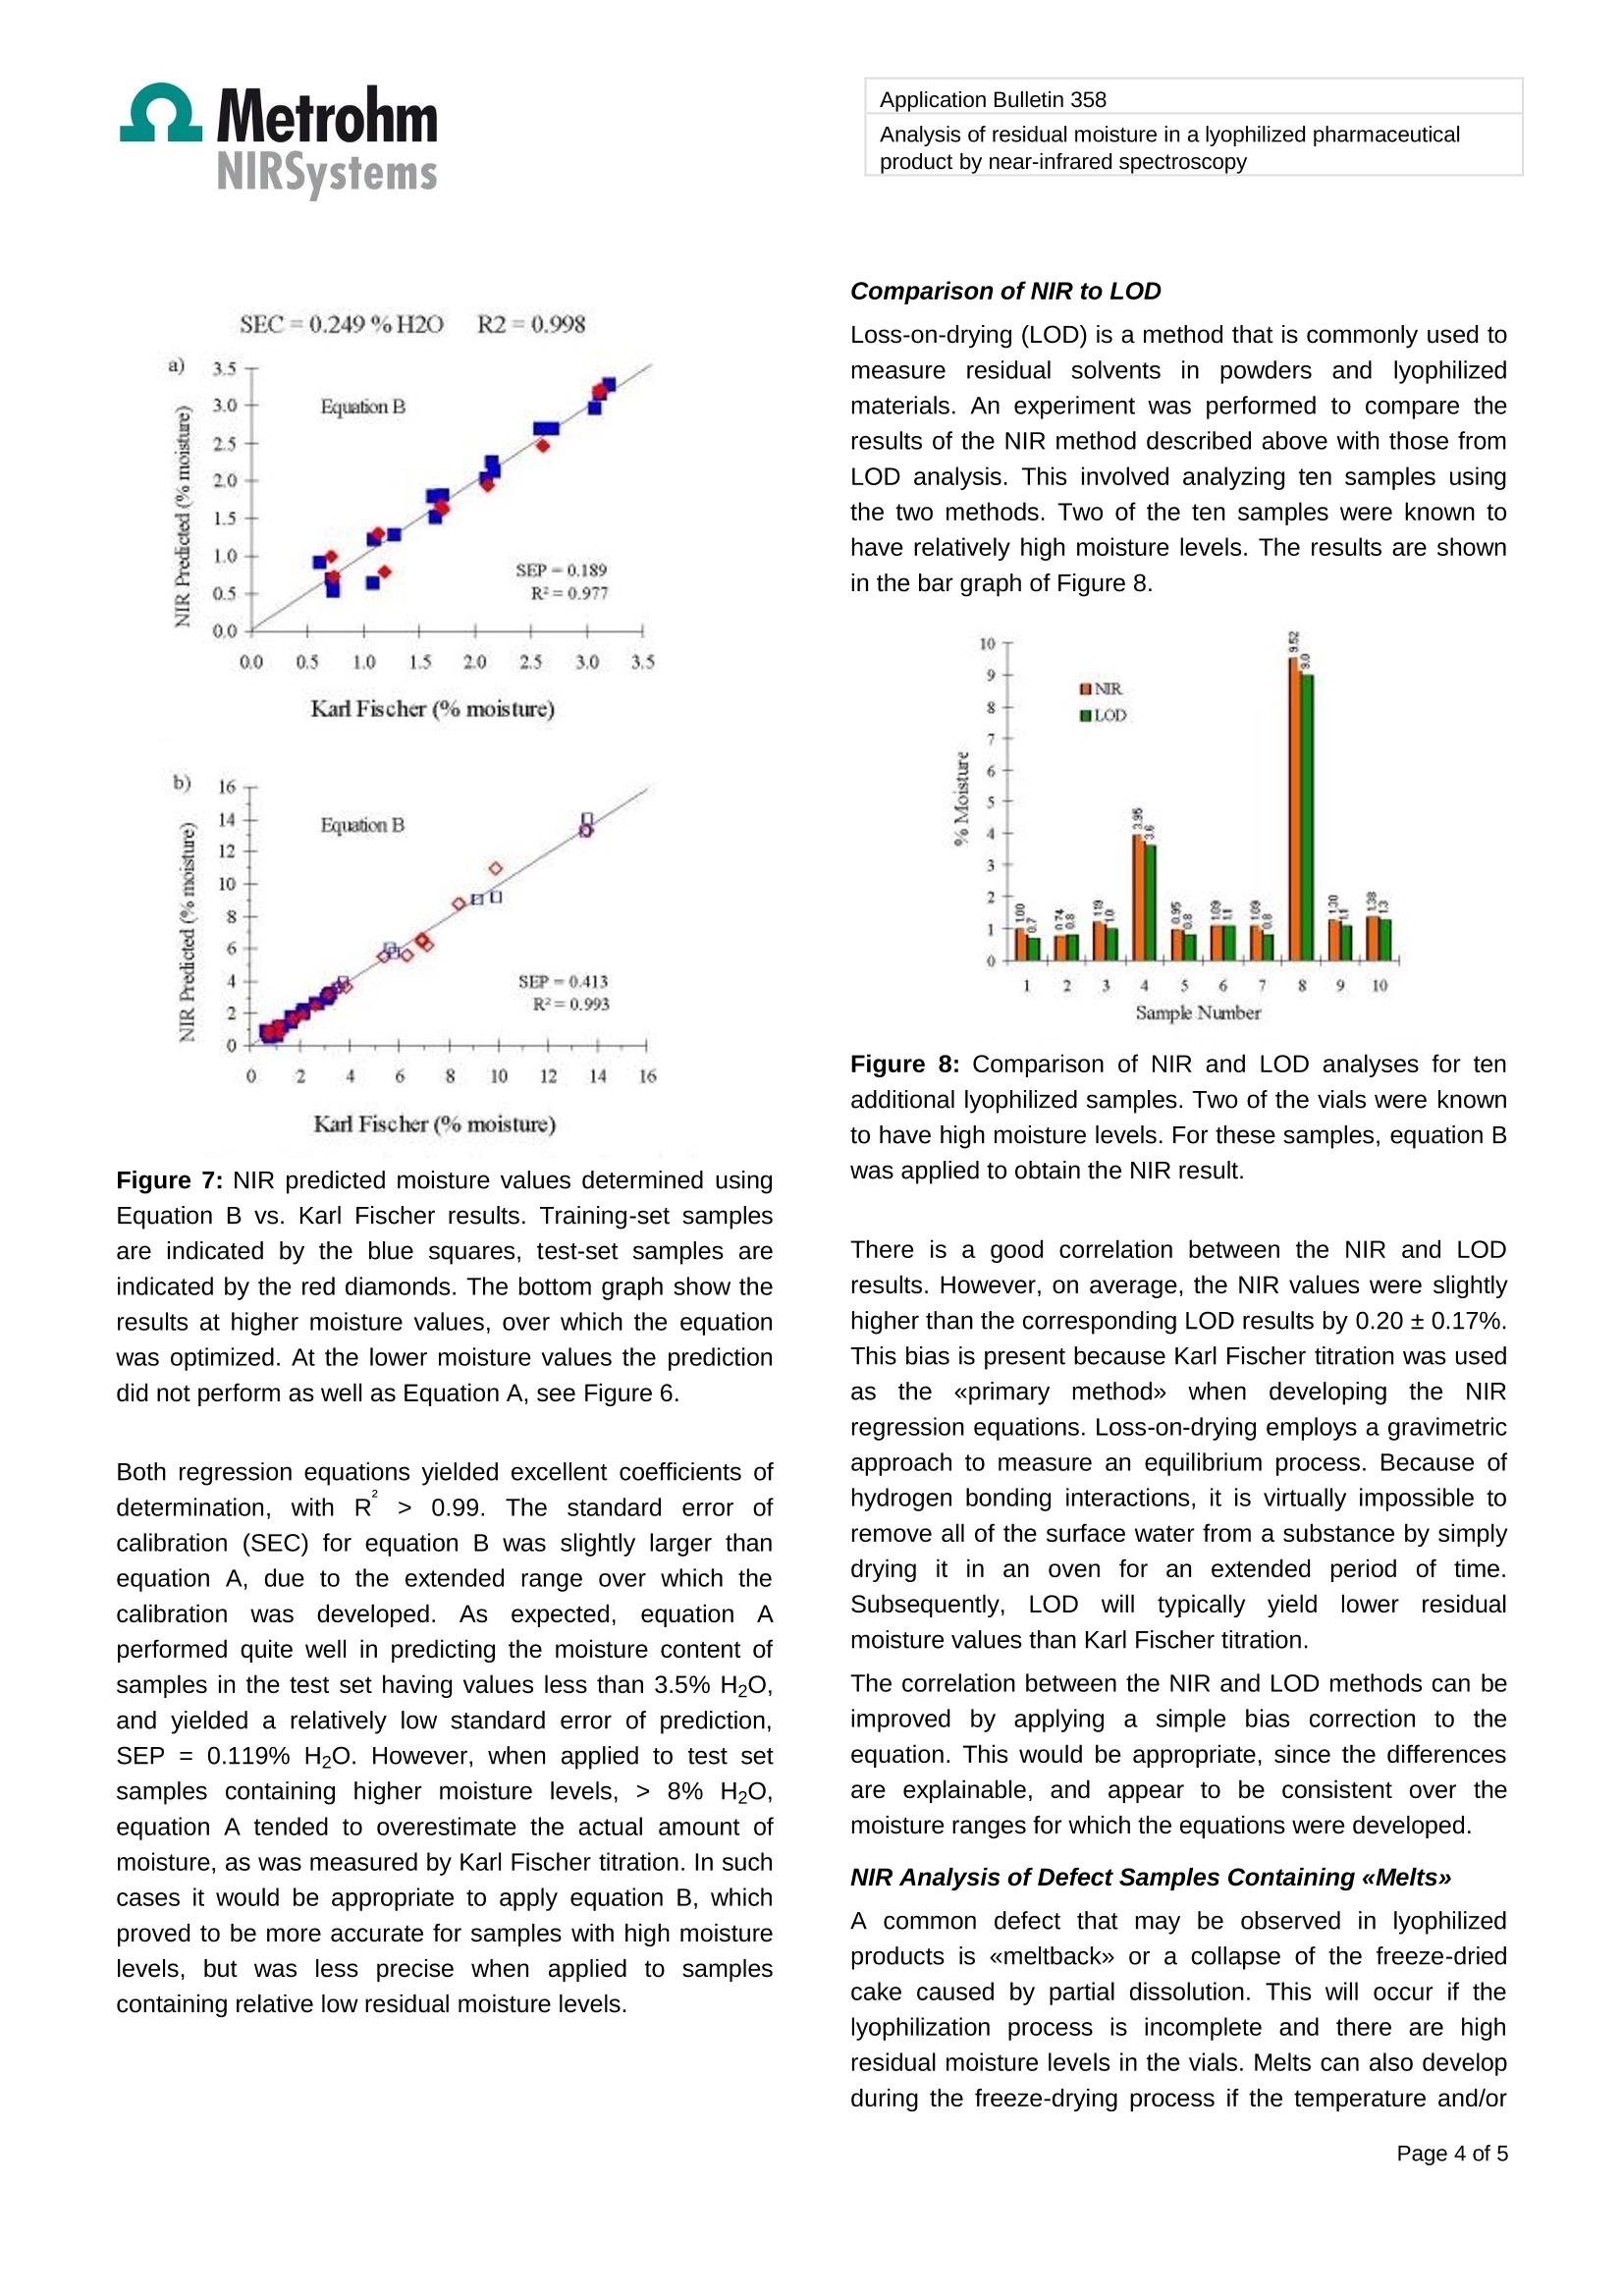
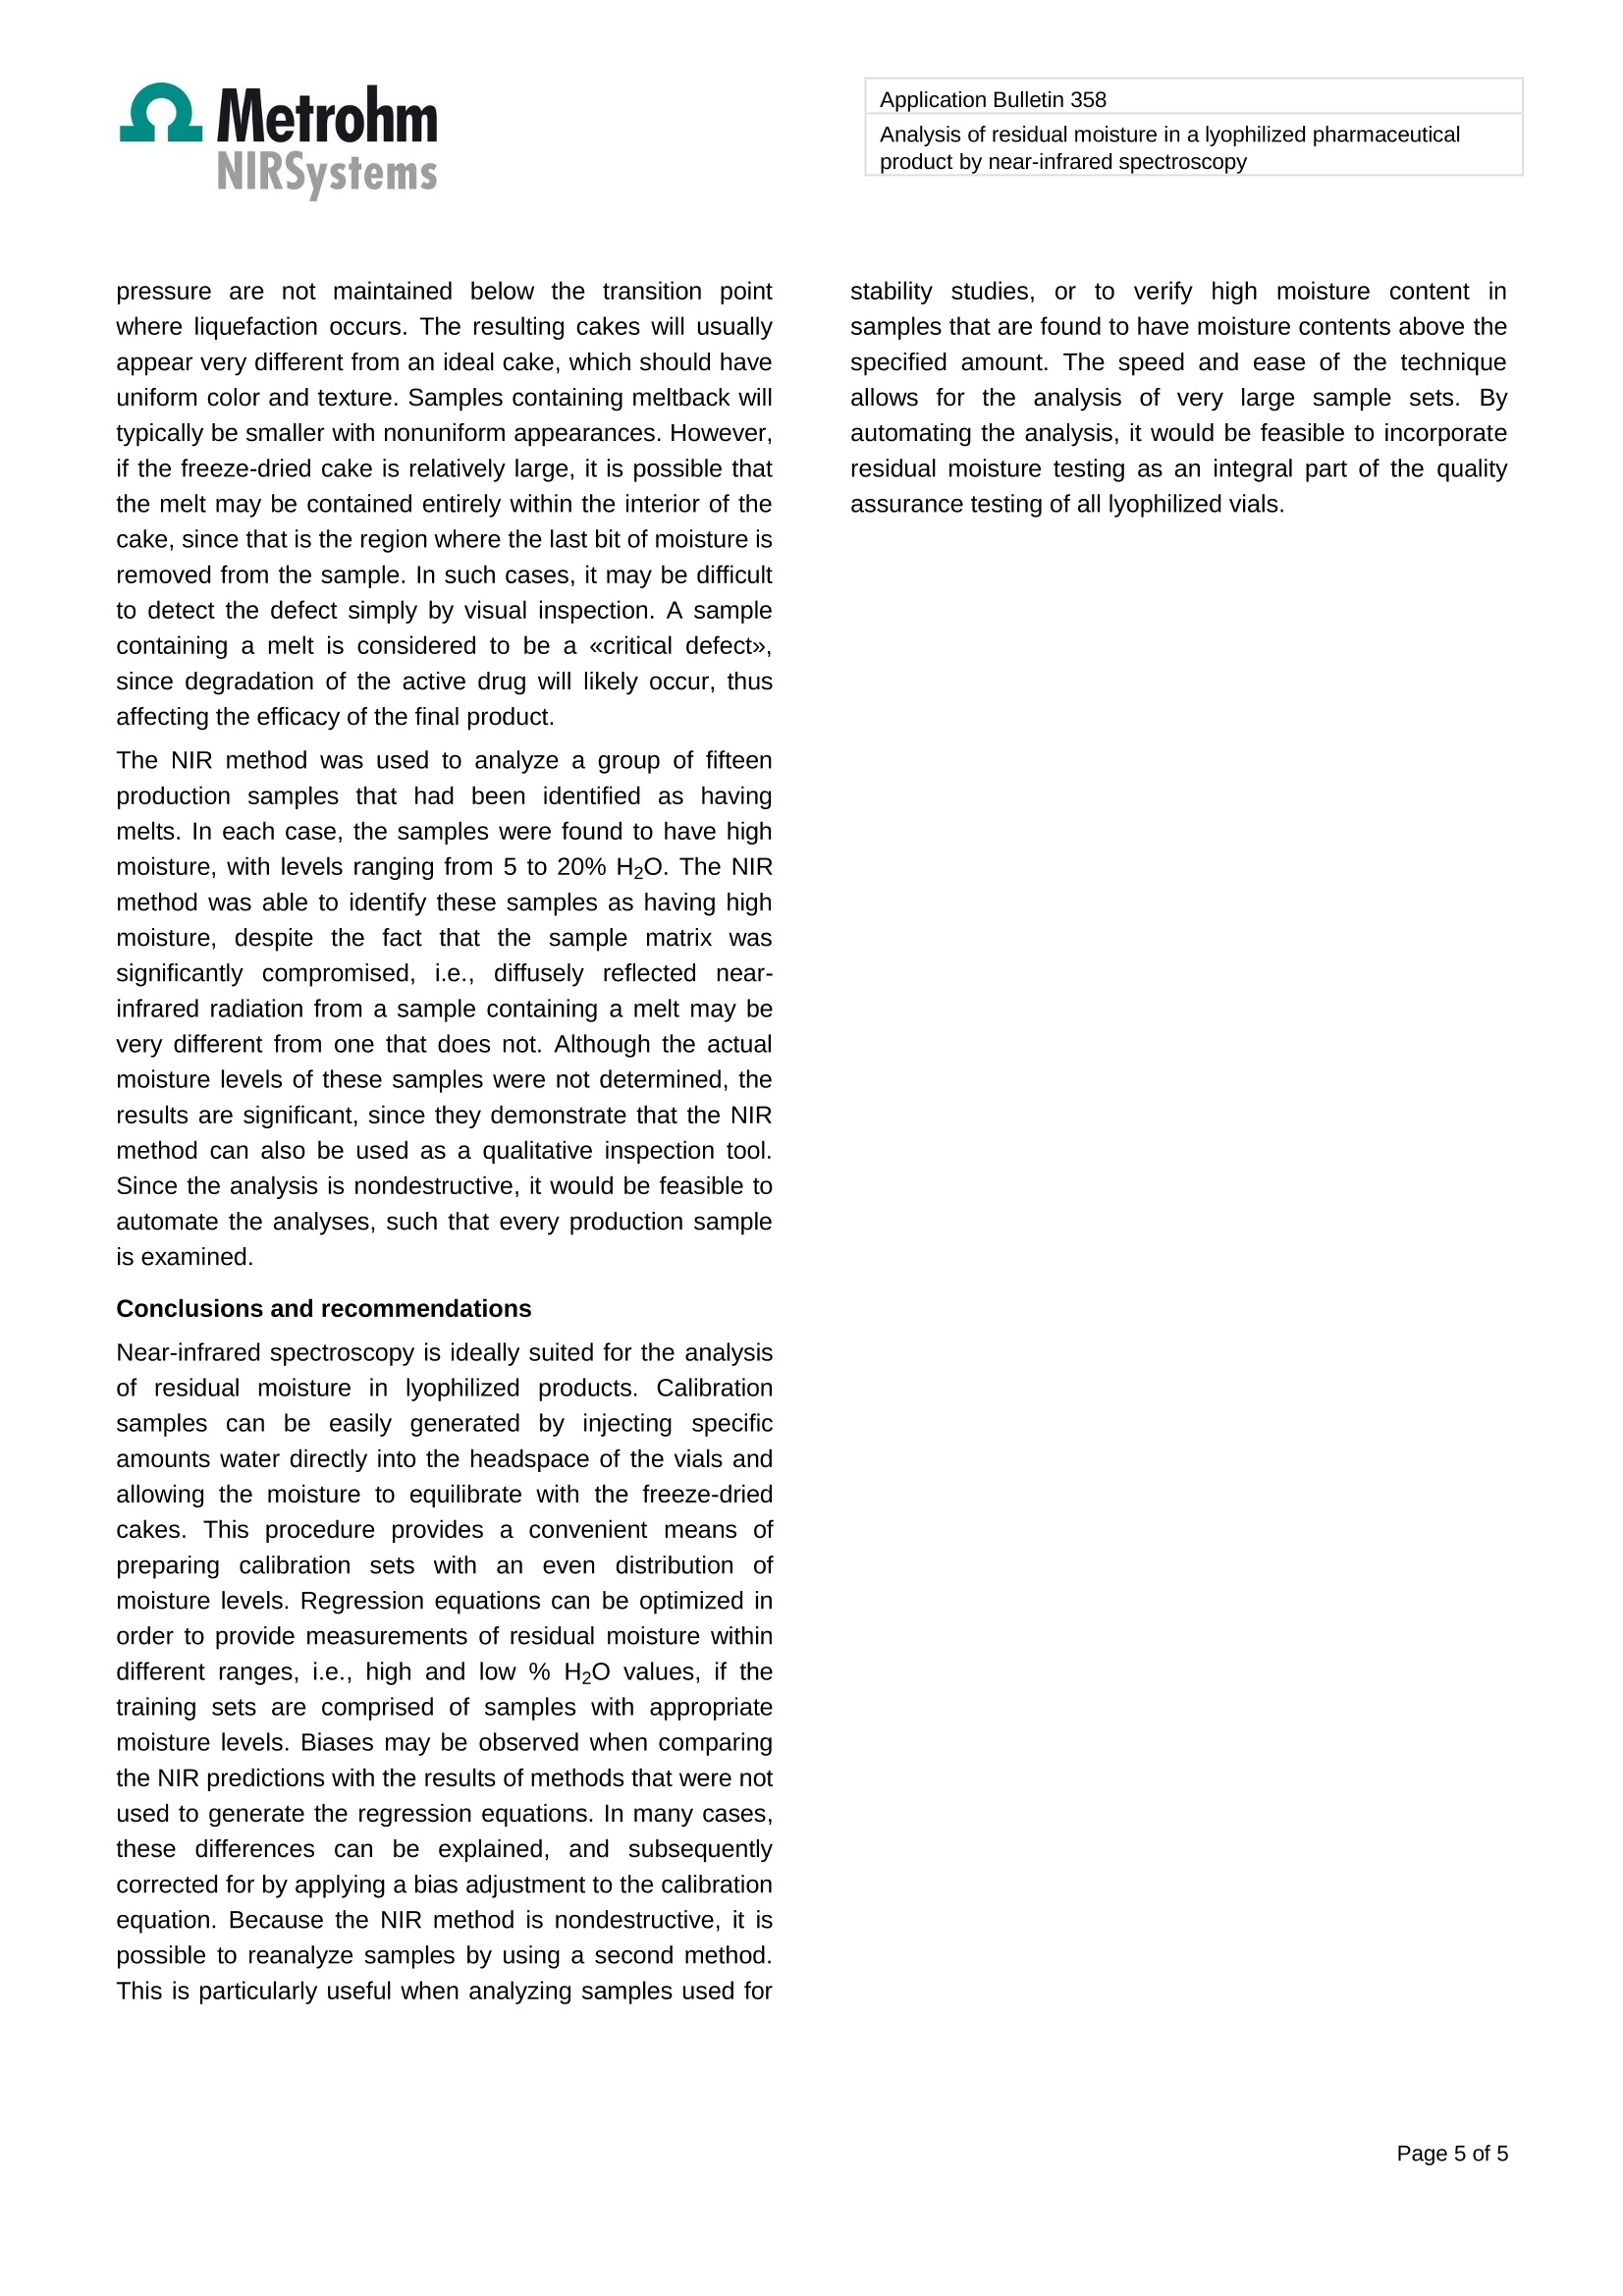
Application Bulletin 358 Application Bulletin 358/1 e Analysis of residual moisture in a lyophilized pharmaceuticalproduct by near-infrared spectroscopy BranchPharmaceutical Keywords Near-infrared spectroscopy, lyophilized pharmaceuticals,water determination, Karl Fischer titration, loss on drying(LOD) Summary This ApplicationnBulletindescribess anapproachh fordeveloping near-infrared methods for the determination ofresidual moisture in typicalil lyophilized pharmaceuticalproducts. In this case, samples were contained in sealed 30mL serum vials (3 cm o.d.). The average cake weight of thisproduct was 1.6 g with a target moisture level of 1% andacceptable moisture limit of not more than 2% by weight. Acalibration sample set was prepared by spiking sample vialswith varying amounts of water. Diffuse reflectance near-infrared spectra of these calibration samples were acquiredand multiple linear regression (MLR) algorithms applied tocorrelate spectral changes to experimentally measuredmoisture values as determined by Karl Fischer titration. Introduction Quantification of residual moisture in lyophilized parenteralproducts is an important measurement in thepharmaceutical industry. Analyses are routinely performedfor process control and to insure that samples fromproduction lots meet specified release parameters. Fordevelopmental purposes, such measurements arenecessary during stability studies and optimization of thefreeze/pump cycles used in the freeze-drying process. Traditional techniques for measuring moisture include KarlFischerrtitration. gasCchromatography,and thermo-gravimetric analysis, also known as loss-on-drying (LOD).Although these methods offer certain advantages withrespect to sensitivity, solvent specificity, and system cost,they all suffer from the same drawbacks of being timeconsuming and destructive to the sample being analyzed. Near-infrared (NIR) spectroscopy has been shown to be anideal method for rapidly measuring moisture in freeze-driedmaterials. Typical analysis times are less than 30)sS.Calibrations for quantifying trace amounts of moisture arepossible, due to the strong overtone absorption bands for water at 1940 nm and 1450 nm. In a diffuse reflectanceconfiguration, the measurement may be performed throughthe bottom of the vial, since the borosilicate glass that iscommonly used in ampoules and serum vials is 《invisible》in the near-infrared region. Therefore, little or no samplepreparation is required, and the need for costly or toxicreagents is eliminated. The technique is nondestructive andnoninvasive; attributes that are particularly advantageouswhenanalyzingissamplesscontainingexpensiveeactiveingredients, or samples that may be used for stabilitystudies since the same vials can be used for subsequentpotency assays. Figure 1: Rapid Content Analyzer (RCA) sampling moduleused to analyze lyophilized material Experimental Near-infrared spectra wereacquireddusinga FOssNIRSystems Model 6500 spectrometer equipped with aRapid ContentTM Analyzer (RCA), Figure 1. The RCAsampling accessory utilizes a mechanical iris to reproduciblyposition vials over the monochromatic incident beam and anarray of lead-sulfide detectors capable of analyzing diffuselyreflected near-infrared radiation from 1100 nm to 2500 nm.Spectral data were signal averaged using 32 scans. Sincethis instrument is not available anymore, the NIRS XDSRapidContent Analyzer is recommended. Data collectionand analysis was performed using the VisionTM software. A calibration set was prepared using 46 sample vials, whichwere divided into ten groups, A to J. Samples in each groupwere spiked with specified amounts of water to provideincremental increases in the moisture content as shown inTable 1. Table 1: Calibration Sample Set Vials [% by weight] to add [pL] A 5 0.0 0 B 5 0.5 8 C 5 1.0 16 D 5 1.5 24 E 5 2.0 32 F 5 2.4 40 G 4 2.9 48 H 4 4.8 80 4 9.1 160 J 4 13.0 240 Figure 2: Schematic of the technique used to spike samplevials with water. The procedure used to spike the samples is illustrated inFigure 2, and involved holding the sample vials horizontallyat a slight angle while injecting a measured volume ofdistilled water into the headspace via a microsyringe. Thethin needle of the microsyringe was accommodated byusing a larger bore needle (18 gauge) as a sheath, whichwas inserted through the rubber stopper. The samples werethen stored for 48 hours to allow the moisture to fullyevaporate and equilibrate with the sample in the vial. Duringthis time, the tilted orientation of the vials was maintained sothat the water did not come into direct contact with thefreeze-dried cake. This procedure readily allows for thepreparation of calibration sets which have a 《box-car》distribution, with roughly the same number of samples ineach 《group》 of moisture levels.This approach also provedto be more convenient than procedures which utilizehumidity chambers, since prior knowledge of the moistureuptake rate is not necessary. The moisture content of calibration samples used fordeveloping the NIR calibration equations were determinedby volumetric Karl Fischer titration using a Mitsubishi CA-06Moisturemeter. No sample preparation required. Analysis of residual moisture in a lyophilized pharmaceuticalproduct by near-infrared spectroscopy Results and discussion Figure 3. Karl Fischer analysis results of calibration setsamples. The blue and red bars indicate 《training》 and《test》 set samples, respectively. Karl Fischer titration of calibration samples The results from the Karl Fischer analyses are shown in thebar chart of Figure 3. The measured values are consistentwith the desired increase for each group, indicating that theexperimental approach used to spike the samples can beeasily controlled. However, in three samples, D5, E2, andG3, the measured moisture values were higher thanexpected. This can be attributed to either the addition ofexcess water or high initial moisture content in each vialprior to spiking. Excluding these samples, the averagemoisture content before spiking was determined to beapproximately 0.7% by subtracting the desired moistureincrease from the actual measured value for each vial. Near-Infrared spectral data Figure 4 shows the NIR spectra of ten calibration samplescontaining varying amounts of moisture as indicated in theinset bar graph. For presentation purposes, each spectrumwas offset corrected by subtracting the correspondingabsorbance at 1820 nm from each datapoint, and the scalewas then reset relative to the lowest overall absorbancebeing zero. The correlation between an increase in moisturecontent and the change in the spectral features around theband at 1940 nm is evident. Second derivative spectra are often used for developingquantitative regression equations. This math pretreatment isused to correct for sloping backgrounds and varying offsetsassociated with differences in the reflectivity of eachsamples sample. These variations are caused by physicalparameters, such as differences in particle size distributions and cake appearance. Figure 5 shows the second derivativespectra of the same ten samples shown in Figure 4. Figure 4:Diffuse reflectance near-infraredd:spectra oflyophilized samples containing varying amounts of moistureas indicated in the inset bar graph. Spectra were offsetcorrected relative to the absorbance values at 1820 nm. Thedash line is a transmission spectrum of water, with apathlength of 0.3 mm and absorbances scaled to 20% theactual values. Figure 5: Second derivative spectra corresponding to theabsorption spectra of Figure 4 Regression equation development When developing quantitative models, sspectra of thecalibration samples are typically divided into two distinctgroups. Samples in the 《training-set》 are used to developthe regression equations, while samples in the 《test-set》are used to challenge or validate the equations. Spectra of aparticular sample should not be used in both sets. For thisapplication, the blue and red bars of the graph in Figure 3indicate training and test set samples, respectively. To obtain a calibration for the analysis of samples havingmoisture valuess withinarange near thee specifiedacceptance limit, i.e.,~2% H2O, multiple linear regression(MLR) algorithms were applied to second derivative spectraof calibration samples from groups A to F. This yieldedcalibration Equation A, which is optimized for sampleshaving low moisture content, i.e., 0% to 3.5% H20. The Application Bulletin 358 Analysis of residual moisture in a lyophilized pharmaceuticalproduct by near-infrared spectroscopy divisor term minimizes effects due to multiplicative scattercaused by pathlength difference in the samples. Equation A: For samples with low residual moisture NIR Predicted moisture in %=0.806-19.4111(/A"1842nm\A"2124nm b) 11 0 6 8 10 12 14 16 Karl Fischer (% moisture) Figure 6. NIR predicted moisture values determined usingEquation A vs. Karl Fischer results. Training-set samplesare indicated by the blue squares, test-set samples areindicated by the red diamonds. The top graph show theresults at lower moisture values, over which the equationwas optimized. A second calibration was developed using MLR and secondderivative spectra of all of the samples in the training set.This provided Equation B, which is optimized for samplescontaining high moisture, with levels up to 15% H2O. Equation B: For samples with high residual moistureNIR predicted Moisture in %=1.427+6.472 I(A"1842nm\A"2162 nm/ 1.0 15 2.0 2.5Karl Fischer (% moisture) Karl Fischer (%moisture) Figure 7: NIR predicted moisture values determined usingEquation B vs. Karl Fischer results. Training-set samplesare indicated by the blue squares, test-set samples areindicated by the red diamonds. The bottom graph show theresults at higher moisture values, over which the equationwas optimized. At the lower moisture values the predictiondid not perform as well as Equation A, see Figure 6. Both regression equations yielded excellent coefficients ofdetermination, with R > 0.99. The standard error ofcalibration (SEC) for equation B was slightly larger thanequation A, due to the extended range over which thecalibration was developed. Assexpected, equation Aperformed quite well in predicting the moisture content ofsamples in the test set having values less than 3.5% H2O,and yielded a relatively low standard error of prediction,SEP = 0.119% H2O. However, when applied to test setsamples containing higher moisture levels,> 8% H2O,equation A tended to overestimate the actual amount ofmoisture, as was measured by Karl Fischer titration. In suchcases it would be appropriate to apply equation B, whichproved to be more accurate for samples with high moisturelevels, but was less precise when applied to samplescontaining relative low residual moisture levels. Application Bulletin 358 Analysis of residual moisture in a lyophilized pharmaceuticalproduct by near-infrared spectroscopy Comparison of NIR to LOD Loss-on-drying (LOD) is a method that is commonly used tomeasure residual solvents in powders and lyophilizedmaterials. An experiment was performed to compare theresults of the NIR method described above with those fromLOD analysis. This involved analyzing ten samples usingthe two methods. Two of the ten samples were known tohave relatively high moisture levels. The results are shownin the bar graph of Figure 8. Figure 8: Comparison of NIR and LOD analyses for tenadditional lyophilized samples. Two of the vials were knownto have high moisture levels. For these samples, equation Bwas applied to obtain the NIR result. There is a good correlation between the NIR and LODresults. However, on average, the NIR values were slightlyhigher than the corresponding LOD results by 0.20±0.17%.This bias is present because Karl Fischer titration was usedas the《primary method》when developing the NIRregression equations. Loss-on-drying employs a gravimetricapproach to measure an equilibrium process. Because ofhydrogen bonding interactions, it is virtually impossible toremove all of the surface water from a substance by simplydrying it in an oven for an extended period of time.Subsequently,',LOD willtypically yieldlowerriresidualmoisture values than Karl Fischer titration. The correlation between the NIR and LOD methods can beimproved by applying a simple bias correction to theequation. This would be appropriate, since the differencesare explainable, and appear to be consistent over themoisture ranges for which the equations were developed. NIR Analysis of Defect Samples Containing《Melts》 A common defect that may be observed in lyophilizedproducts is 《meltback》 or a collapse of the freeze-driedcake caused by partial dissolution. This will occur if thelyophilization process is incomplete and there are highresidual moisture levels in the vials. Melts can also developduring the freeze-drying process if the temperature and/or pressure are not maintained below the transition pointwhere liquefaction occurs. The resulting cakes will usuallyappear very different from an ideal cake,which should haveuniform color and texture. Samples containing meltback willtypically be smaller with nonuniform appearances. However,if the freeze-dried cake is relatively large, it is possible thatthe melt may be contained entirely within the interior of thecake, since that is the region where the last bit of moisture isremoved from the sample. In such cases, it may be difficultto detect the defect simply by visual inspection. A samplecontaining a melt is considered to be a 《critical defect》,since degradation of the active drug will likely occur, thusaffecting the efficacy of the final product. The NIR method was used to analyze a group of fifteenproduction samples that had been identified as havingmelts. In each case, the samples were found to have highmoisture, with levels ranging from 5 to 20% H2O. The NIRmethod was able to identify these samples as having highmoisture, despite the fact that the sample matrix wassignificantly compromised, i.e., diffusely reflected near-infrared radiation from a sample containing a melt may bevery different from one that does not. Although the actualmoisture levels of these samples were not determined, theresults are significant, since they demonstrate that the NIRmethod can also be used as a qualitative inspection tool.Since the analysis is nondestructive, it would be feasible toautomate the analyses, such that every production sampleis examined. Conclusions and recommendations Near-infrared spectroscopy is ideally suited for the analysisof residual moisture in lyophilized products. Calibrationsamples can be easily generated by injecting specificamounts water directly into the headspace of the vials andallowing the moisture to equilibrate with the freeze-driedcakes. This procedure provides a convenient means ofpreparing calibration sets with an even distribution ofmoisture levels. Regression equations can be optimized inorder to provide measurements of residual moisture withindifferent ranges, i.e., high and low % H2O values, if thetraining sets are comprised of samples with appropriatemoisture levels. Biases may be observed when comparingthe NIR predictions with the results of methods that were notused to generate the regression equations. In many cases,these differences can be explained, and subsequentlycorrected for by applying a bias adjustment to the calibrationequation. Because the NIR method is nondestructive, it ispossible to reanalyze samples by using a second method.This is particularly useful when analyzing samples used for Analysis of residual moisture in a lyophilized pharmaceuticalproduct by near-infrared spectroscopy stability studies, or to verify high moisture content insamples that are found to have moisture contents above thespecified amount. The speed and ease of the techniqueallows for the analysis of very large sample sets. Byautomating the analysis, it would be feasible to incorporateresidual moisture testing as an integral part of the qualityassurance testing of all lyophilized vials. Page of
确定
还剩3页未读,是否继续阅读?

产品配置单
瑞士万通中国有限公司为您提供《生物制品中限度检查检测方案 》,该方案主要用于化药制剂中限度检查检测,参考标准--,《生物制品中限度检查检测方案 》用到的仪器有瑞士万通DS2500 近红外光谱分析仪、瑞士万通PRO 近红外在线分析仪
推荐专场
相关方案
更多
该厂商其他方案
更多