


方案详情
文
Flow past a cylinder in an unbound medium gives rise to
self-sustained, limit cycle oscillations involving formation
of a regular, periodically alternating Karman vortex street.
However, little attention has been paid to the effect of an
adjacent free surface on the development of the Karman
vortices and possible generation of new classes of the nearwake
structure[1], see Figure 1. The technique of Particle
Image Velocimetry (PIV) is a useful tool to this flow,
considering that it is unsteady and multi-scale in nature.
方案详情

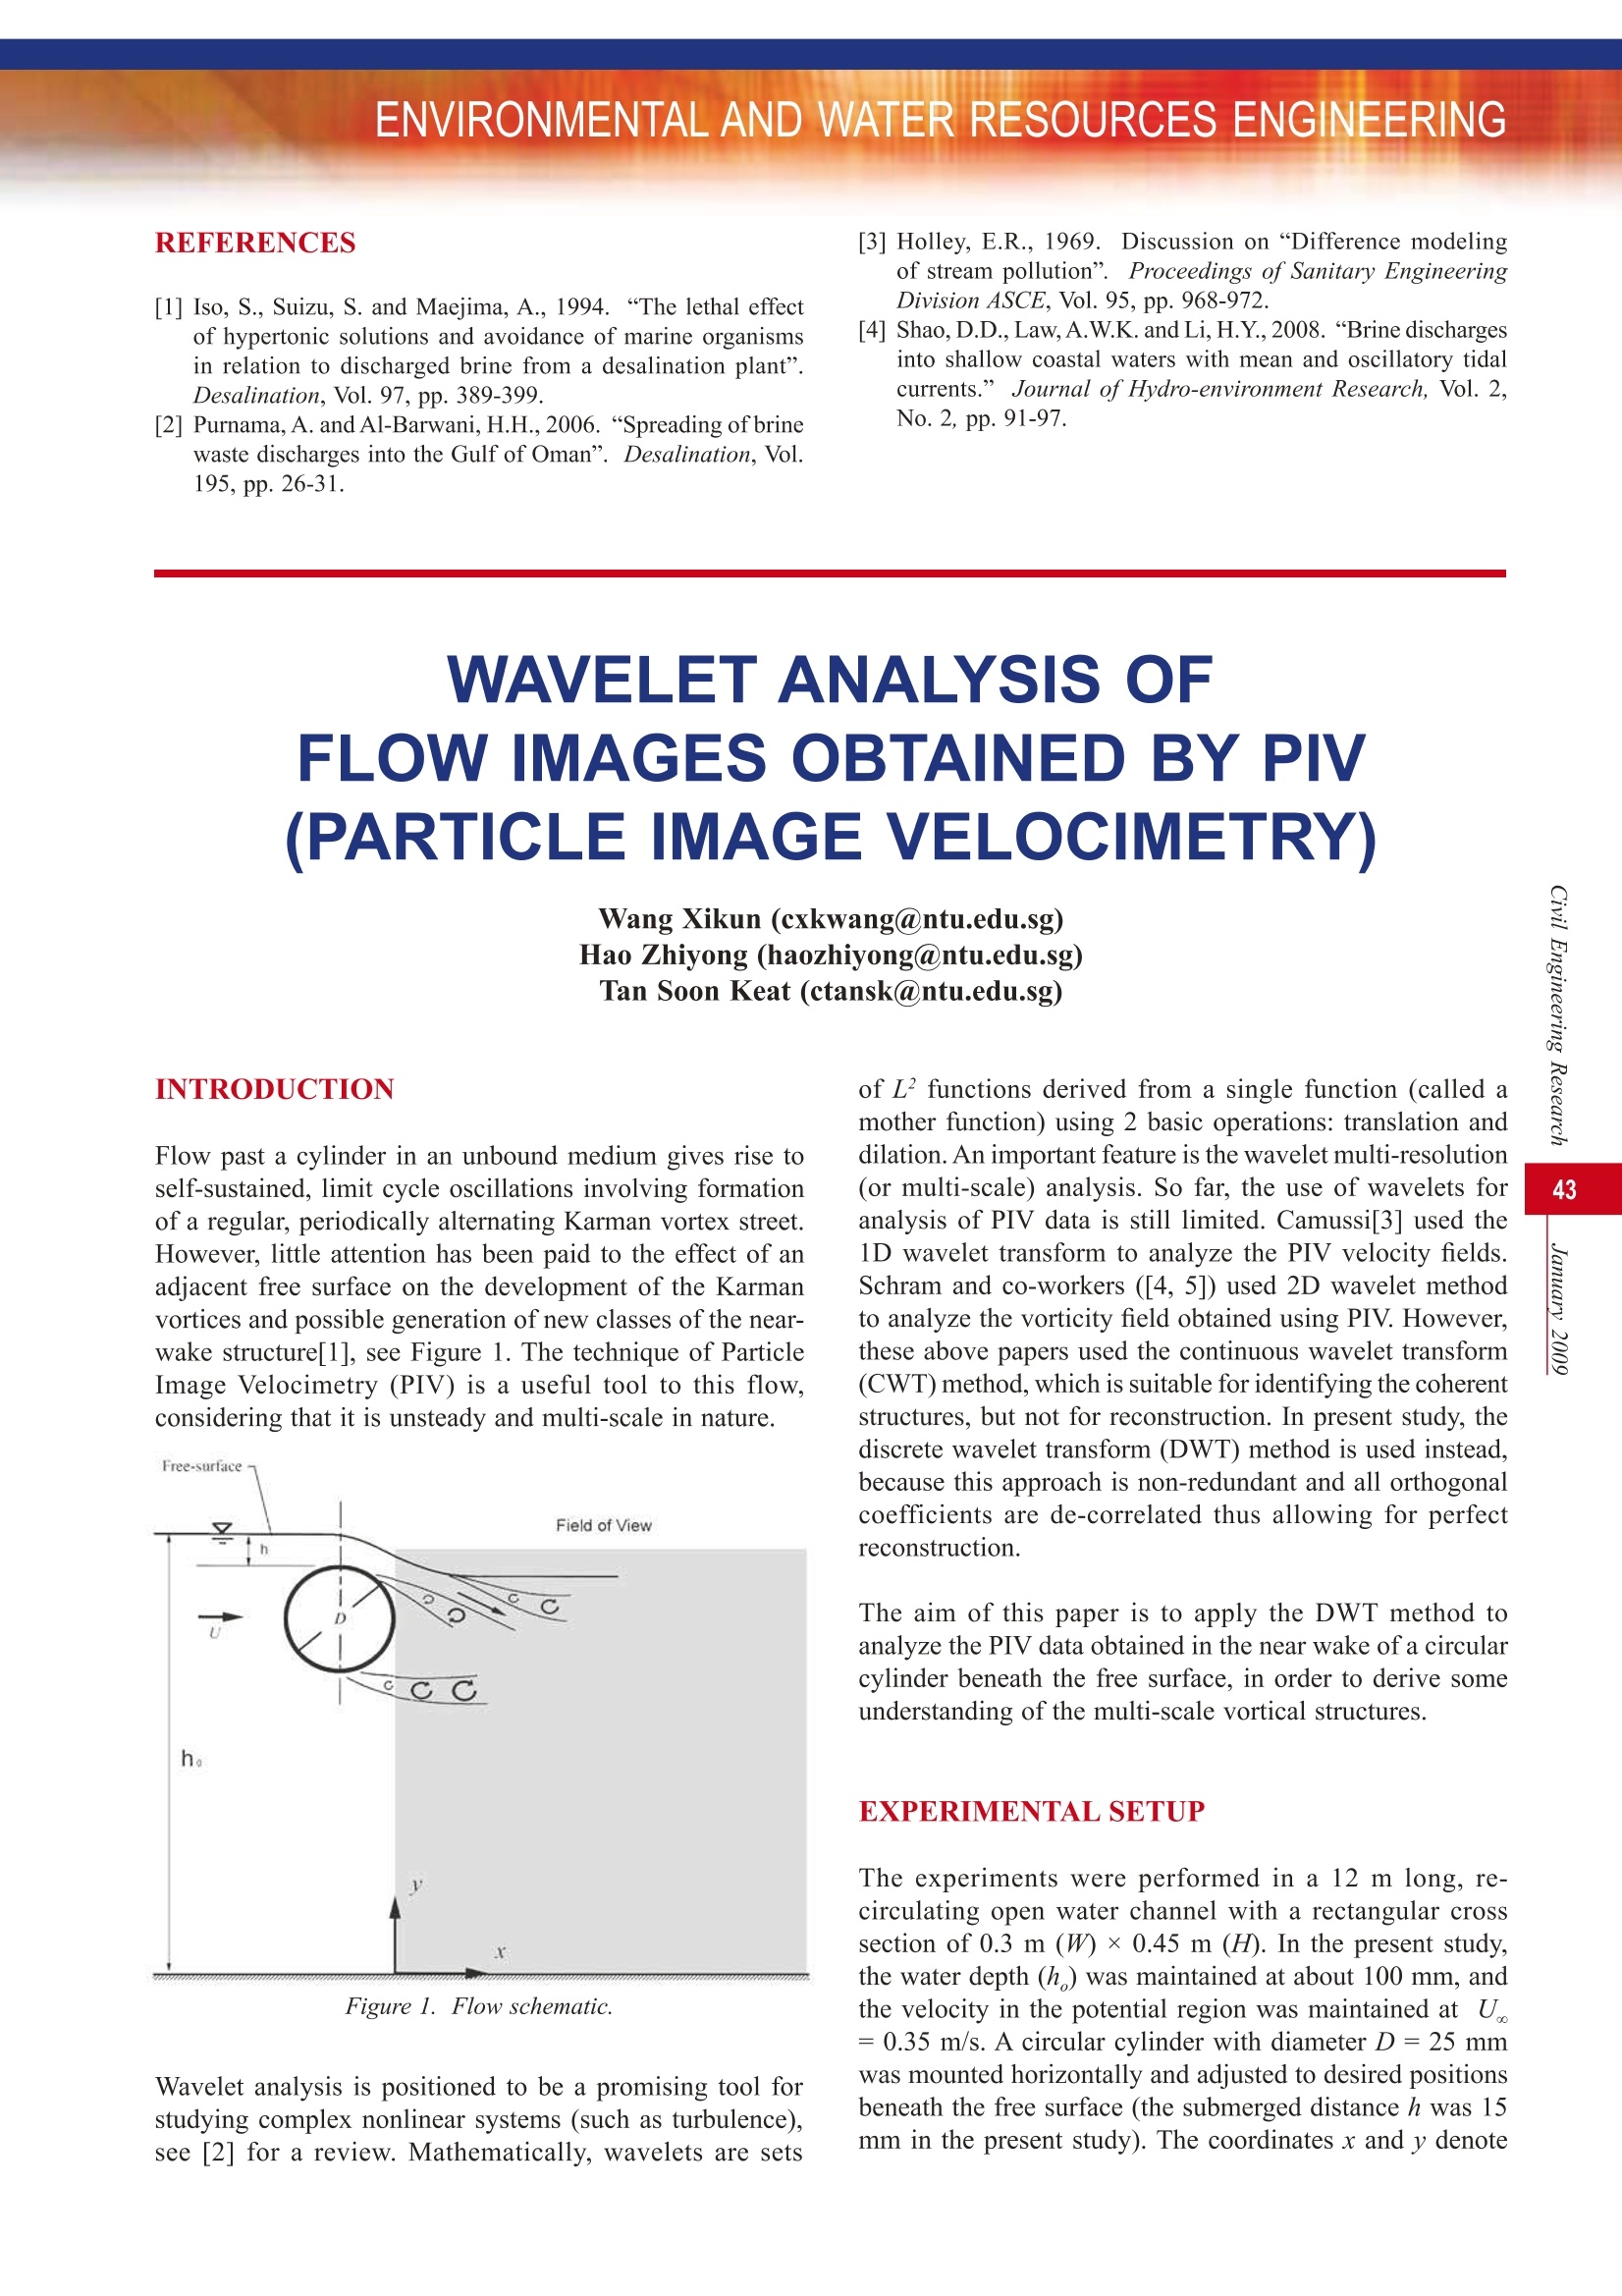
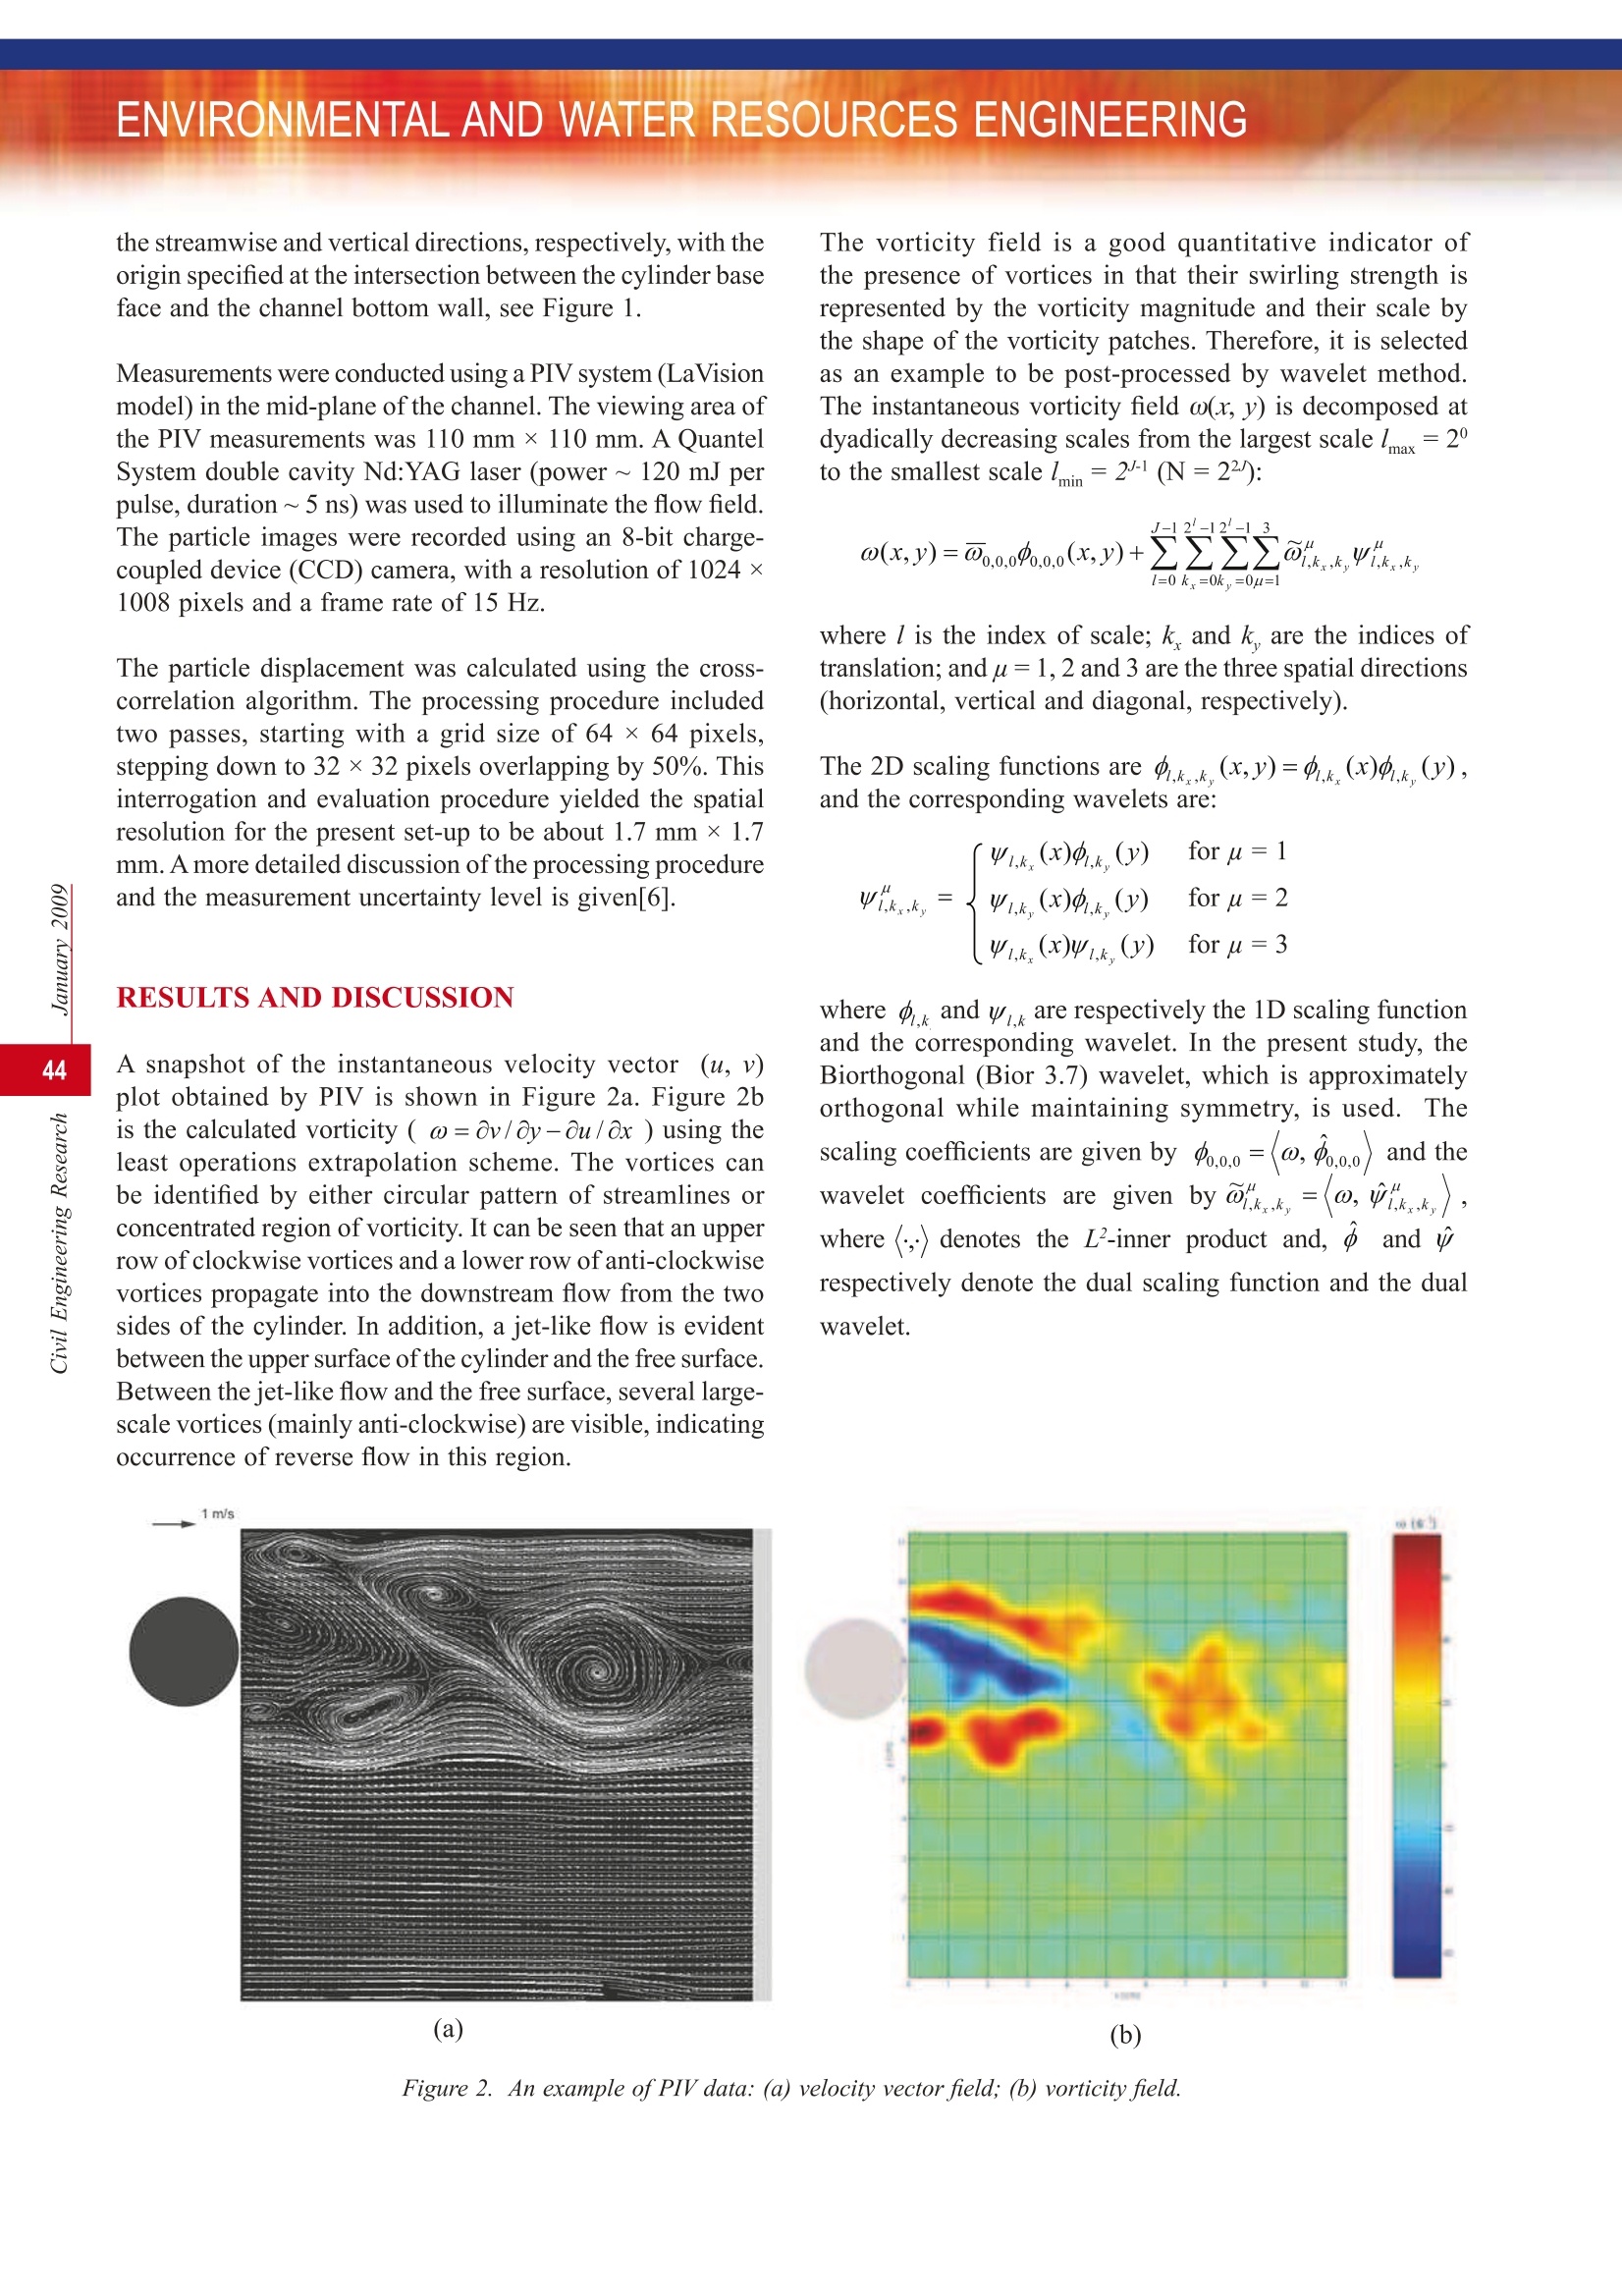
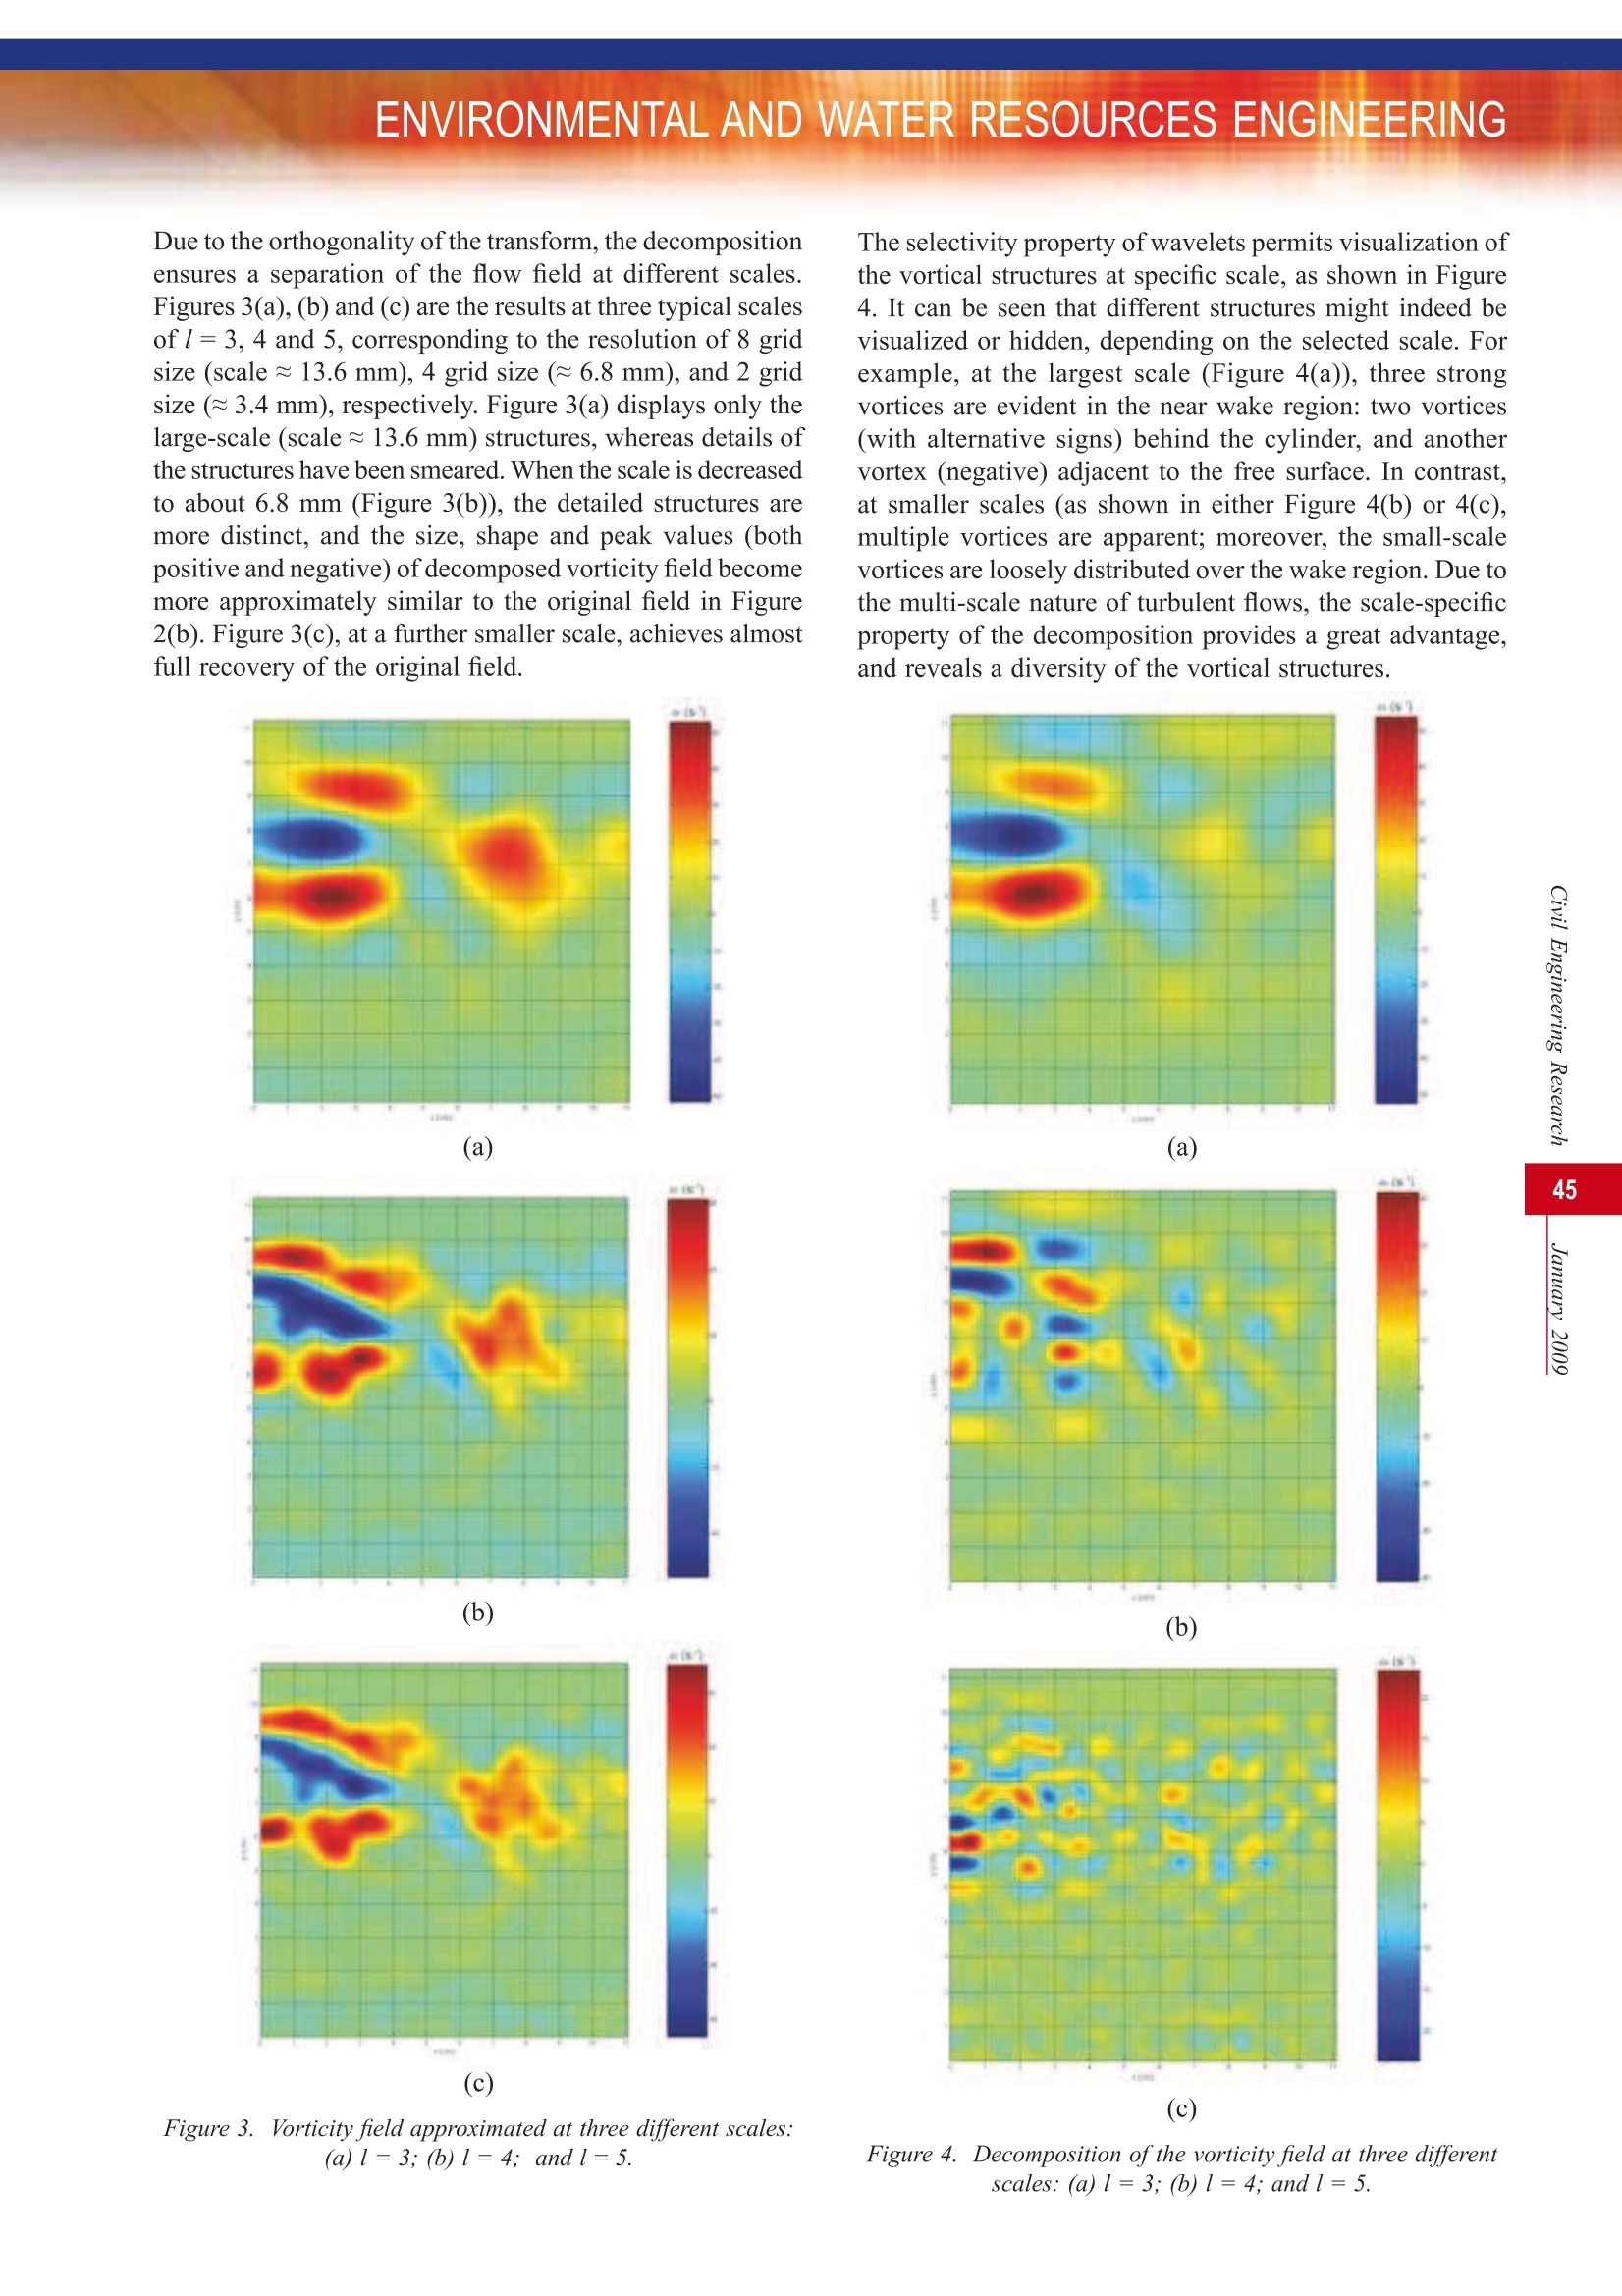
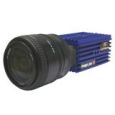
ENVIRONMENTAL AND WATER RESOURCES ENGINEERING ( [1 ] Iso, S., Suizu, S. and Maejima, A., 1994. “The lethal effect of hypertonic solutions and avoidance of marine organismsin relation to discharged brine from a desalination plant ” .Desalination, Vol. 97, pp. 389-399. ) ( [2] Purnama, A. and Al-Barwani, H.H., 2006.“Spreading of brinewaste discharges into the Gulf of Oman”. Desalination, Vol. 195, pp. 26-31. ) ( [3] Holley, E.R. , 1969. Discussion on“Difference model i ngof stream pollution”. Proceedings of Sanitary EngineeringDiv i sion ASCE, Vol. 95, pp. 968-972. ) ( [4 ] Shao,D.D.,Law,A.W.K. and Li, H.Y., 2008.“Brine dischargesinto shallow coastal waters with mean and osci l latory tidalcurrents.” Journal of Hydro-environment Research, Vol. 2,No. 2, pp. 91-97. ) Wang Xikun (cxkwang@ntu.edu.sg) Hao Zhiyong (haozhiyong@ntu.edu.sg) Tan Soon Keat (ctansk@ntu.edu.sg) INTRODUCTION Flow past a cylinder in an unbound medium gives rise toself-sustained, limit cycle oscillations involving formationof a regular, periodically alternating Karman vortex street.However, little attention has been paid to the effect of anadjacent free surface on the development of the Karmanvortices and possible generation of new classes of the near-wake structure[1], see Figure 1. The technique of ParticleImage Velocimetry (PIV) is a useful tool to this flow,considering that it is unsteady and multi-scale in nature. Free-surtace- Figure 1. Flow schematic. Wavelet analysis is positioned to be a promising tool forstudying complex nonlinear systems (such as turbulence),see [2] for a review. Mathematically, wavelets are sets of L’ functions derived from a single function (called amother function) using 2 basic operations: translation anddilation. An important feature is the wavelet multi-resolution(or multi-scale) analysis. So far, the use of wavelets foranalysis of PIV data is still limited. Camussi[3] used the1D wavelet transform to analyze the PIV velocity fields.Schram and co-workers ([4, 5]) used 2D wavelet methodto analyze the vorticity field obtained using PIV. However,these above papers used the continuous wavelet transform(CWT) method, which is suitable for identifying the coherentstructures, but not for reconstruction. In present study, thediscrete wavelet transform (DWT) method is used instead,because this approach is non-redundant and all orthogonalcoefficients are de-correlated thus allowing for perfectreconstruction. The aim of this paper is to apply the DWT method toanalyze the PIV data obtained in the near wake of a circularcylinder beneath the free surface, in order to derive someunderstanding of the multi-scale vortical structures. EXPERIMENTAL SETUP The experiments were performed in a 12 m long, re-circulating open water channel with a rectangular crosssection of 0.3 m (W) x0.45 m (H). In the present study,the water depth (h) was maintained at about 100 mm, andthe velocity in the potential region was maintained at U.= 0.35 m/s. A circular cylinder with diameter D=25 mmwas mounted horizontally and adjusted to desired positionsbeneath the free surface (the submerged distance h was 15mm in the present study). The coordinates x and y denote the streamwise and vertical directions, respectively, with theorigin specified at the intersection between the cylinder baseface and the channel bottom wall, see Figure 1. Measurements were conducted using a PIV system (LaVisionmodel) in the mid-plane of the channel. The viewing area ofthe PIV measurements was 110 mm x 110 mm. A QuantelSystem double cavity Nd:YAG laser (power~ 120 mJ perpulse, duration ~ 5 ns) was used to illuminate the flow field.The particle images were recorded using an 8-bit charge-coupled device (CCD) camera, with a resolution of 1024 ×1008 pixels and a frame rate of 15 Hz. The particle displacement was calculated using the cross-correlation algorithm. The processing procedure includedtwo passes, starting with a grid size of 64 ×64 pixels,stepping down to 32 ×32 pixels overlapping by 50%.Thisinterrogation and evaluation procedure yielded the spatialresolution for the present set-up to be about 1.7 mm×1.7mm. A more detailed discussion of the processing procedureand the measurement uncertainty level is given[6]. RESULTS AND DISCUSSION A snapshot of the instantaneous velocity vector (u, v)plot obtained by PIV is shown in Figure 2a. Figure 2bis the calculated vorticity (ω=0v/0y-Cu/Ox ) using theleast operations extrapolation scheme. The vortices canbe identified by either circular pattern of streamlines orconcentrated region of vorticity. It can be seen that an upperrow of clockwise vortices and a lower row of anti-clockwisevortices propagate into the downstream flow from the twosides of the cylinder. In addition, a jet-like flow is evidentbetween the upper surface of the cylinder and the free surface.Between the jet-like flow and the free surface, several large-scale vortices (mainly anti-clockwise) are visible, indicatingoccurrence of reverse flow in this region. (a) The vorticity field is a good quantitative indicator ofthe presence of vortices in that their swirling strength isrepresented by the vorticity magnitude and their scale bythe shape of the vorticity patches. Therefore, it is selectedas an example to be post-processed by wavelet method.The instantaneous vorticity field o(x,y) is decomposed atdyadically decreasing scales from the largest scale 1max=29to the smallest scale 1in=2(N=22): where l is the index of scale; k. and k, are the indices oftranslation; and u=1,2 and 3 are the three spatial directions(horizontal, vertical and diagonal, respectively). The 2D scaling functions are rkk,(x,y)=(x)4,,(y),and the corresponding wavelets are: where r and yi are respectively the 1D scaling functionand the corresponding wavelet. In the present study, theBiorthogonal (Bior 3.7) wavelet, which is approximatelyorthogonal while maintaining symmetry, is used. Thescaling coefficients are given by 9.0.=0, Vo.0.0) and thewavelet coefficients are given by @i,k;k,=(@,Vi,k,k,),where (.,) denotes the L’-inner product and, o and yrespectively denote the dual scaling function and the dualwavelet. (b) Figure 2. An example of PIV data: (a) velocity vector field; (b) vorticity field. Due to the orthogonality of the transform, the decompositionensures a separation of the flow field at different scales.Figures 3(a), (b) and (c) are the results at three typical scalesof l = 3, 4 and 5, corresponding to the resolution of 8 gridsize (scale ~ 13.6 mm), 4 grid size (~6.8 mm), and 2 gridsize (~3.4 mm), respectively. Figure 3(a) displays only thelarge-scale (scale ≈ 13.6 mm) structures, whereas details ofthe structures have been smeared. When the scale is decreasedto about 6.8 mm (Figure 3(b)), the detailed structures aremore distinct, and the size, shape and peak values (bothpositive and negative) of decomposed vorticity field becomemore approximately similar to the original field in Figure2(b). Figure 3(C), at a further smaller scale, achieves almostfull recovery of the original field. The selectivity property of wavelets permits visualization ofthe vortical structures at specific scale, as shown in Figure4. It can be seen that different structures might indeed bevisualized or hidden, depending on the selected scale. Forexample, at the largest scale (Figure 4(a)), three strongvortices are evident in the near wake region: two vortices(with alternative signs) behind the cylinder, and anothervortex (negative) adjacent to the free surface. In contrast,at smaller scales (as shown in either Figure 4(b) or 4(c),multiple vortices are apparent; moreover, the small-scalevortices are loosely distributed over the wake region. Due tothe multi-scale nature of turbulent flows, the scale-specificproperty of the decomposition provides a great advantage,and reveals a diversity of the vortical structures. (a) (b) (c) (c) Figure 3..Vorticity field approximated at three different scales:(a)l=3;(b)1=4; andl=5. Figure 4. Decomposition of the vorticity field at three differentscales: (a) l=3; (b)1=4;andl=5. PIV (Particle Image Velocimetry) and wavelet analysis usingDWT (discrete wavelet transform) scheme are combined inthis work in order to investigate the flow characteristics inthe wake of a circular cylinder beneath a free surface. Theselectivity property of wavelets permits decomposition ofthe vortical structures at different scales and visualizationof their corresponding spatial localization. The wavelet-based multi-resolution technique will be applied to processsufficiently large amount of PIV images (several hundredvelocity fields have been obtained for this type of flow), inorder to achieve a statistical characterization of the vorticalstructures. ( [1] Sheridan, J., Lin, J.C. and Rockwel l , D., 1997.“Flow past acy l inder close to a free surface." Journal ofFluid Mechanics,Vol. 330, pp. 1-30. ) ( [2] Farge, M., 1992. “Wavelet transforms and their applicationsto turbulence.” Annual Review of Fluid Mechanics, Vol. 24, pp. 395-457. ) ( [3] Camussi , R., 2002. “Coherent structure identificationfrom wavelet analysis of particle image velocimetry data. ” Experiments in Fluids, Vol . 32, pp. 76-86. ) ( [4] Schram, C . and Riethmuller, M.L . , 2001.“Vortex r ing evolutionin an impulsively started jet using digital particle imagevelocimetry and continuous wavelet analysis.” MeasurementScience and Technology, Vol. 12, pp. 1413-1421. ) ( [5] Schram, C . , Rambaud, P. and Riethmuller, M.L., 2004.“Wavelet based eddy structure deduction from a backwardfacing step flow i nvestigated using particle image velocimetry”.Experiments in Fluids, Vol. 36, pp. 233-245. ) ( [6] Wang, X.K. and Tan, S.K., 2008. “Near-wake flow characteristics of a c i rcular cylinder close to a wall.” Journalof Fluids and Structures, Vol. 24, pp. 605-627. ) Tan Soon Keat (ctansk@ntu.edu.sg) Le Tuyet Minh (LTMinh@ntu.edu.sg) Nguyen Anh Tuan (ATNGUYEN@ntu.edu.sg) More than 90% of municipal solid waste (MSW) in Singaporeis incinerated and the residues (bottom ash and fly ash/airpollution control residues) are subsequently disposed ofand landfilled. Once the facility is full, new space hasto be found instead. At the same time, Singapore importsraw materials such as aggregates (sand/gravel) to be usedas the sub-base in road construction. In several Europeancountries which also rely strongly on incineration for MSWmanagement, incinerator bottom ash (IBA) has been used assub-base in road construction, subject to certain functionaland environmental quality requirements. This study will characterise representative IBA samplesfrom Singapore in terms of chemical composition, leachingbehaviour and geotechnical properties, and examine thefeasilibility of utilising IBA as a road base material. In order to utilise IBA for construction work in a sustainableand environmentally safe manner, the project objective willinclude the following: 1) To update the information on the functional andenvironmental properties of Singapore’s IBA based ontests and analyses as well as existing information; 2) To compare the situation in Singapore with that in othercountries (UK, USA, Netherlands, Denmark, Germany,Sweden, Japan, Taiwan, Bermudas, etc) in terms of theIBA quality, functional and environmental criteria forutilisation (road construction) as well as the needs andlikely possibilities for IBA treatment; 3) To recommend options for treating IBA in the localcontext; and 4) TTo recommend environmental protection criteria suitableto Singapore conditions in order to obtain better IBAquality management.
确定

还剩2页未读,是否继续阅读?

产品配置单

北京欧兰科技发展有限公司为您提供《流体中PIV,粒子成像测速,流体图像,小波分析检测方案(粒子图像测速)》,该方案主要用于其他中PIV,粒子成像测速,流体图像,小波分析检测,参考标准--,《流体中PIV,粒子成像测速,流体图像,小波分析检测方案(粒子图像测速)》用到的仪器有德国LaVision PIV/PLIF粒子成像测速场仪、Imager SX PIV相机
推荐专场


相关方案
更多
该厂商其他方案
更多