
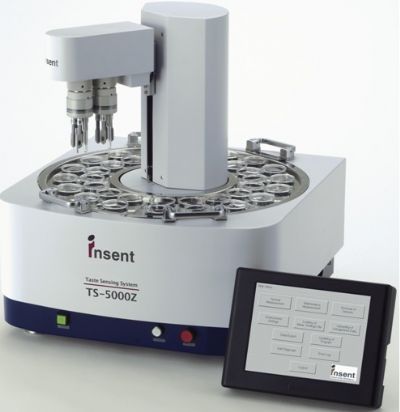


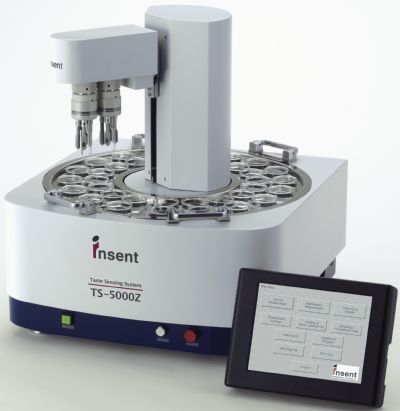
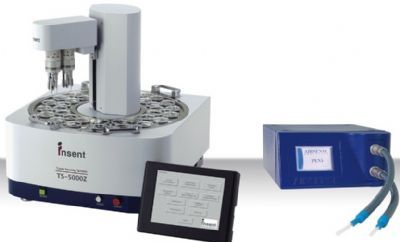
SA402B(INSENT公司)味觉分析系统,即电子舌,配备有七个人工脂膜传感器,这些传感器分别可以表征各种味觉物质,苦、鲜、咸、酸,涩......
方案详情

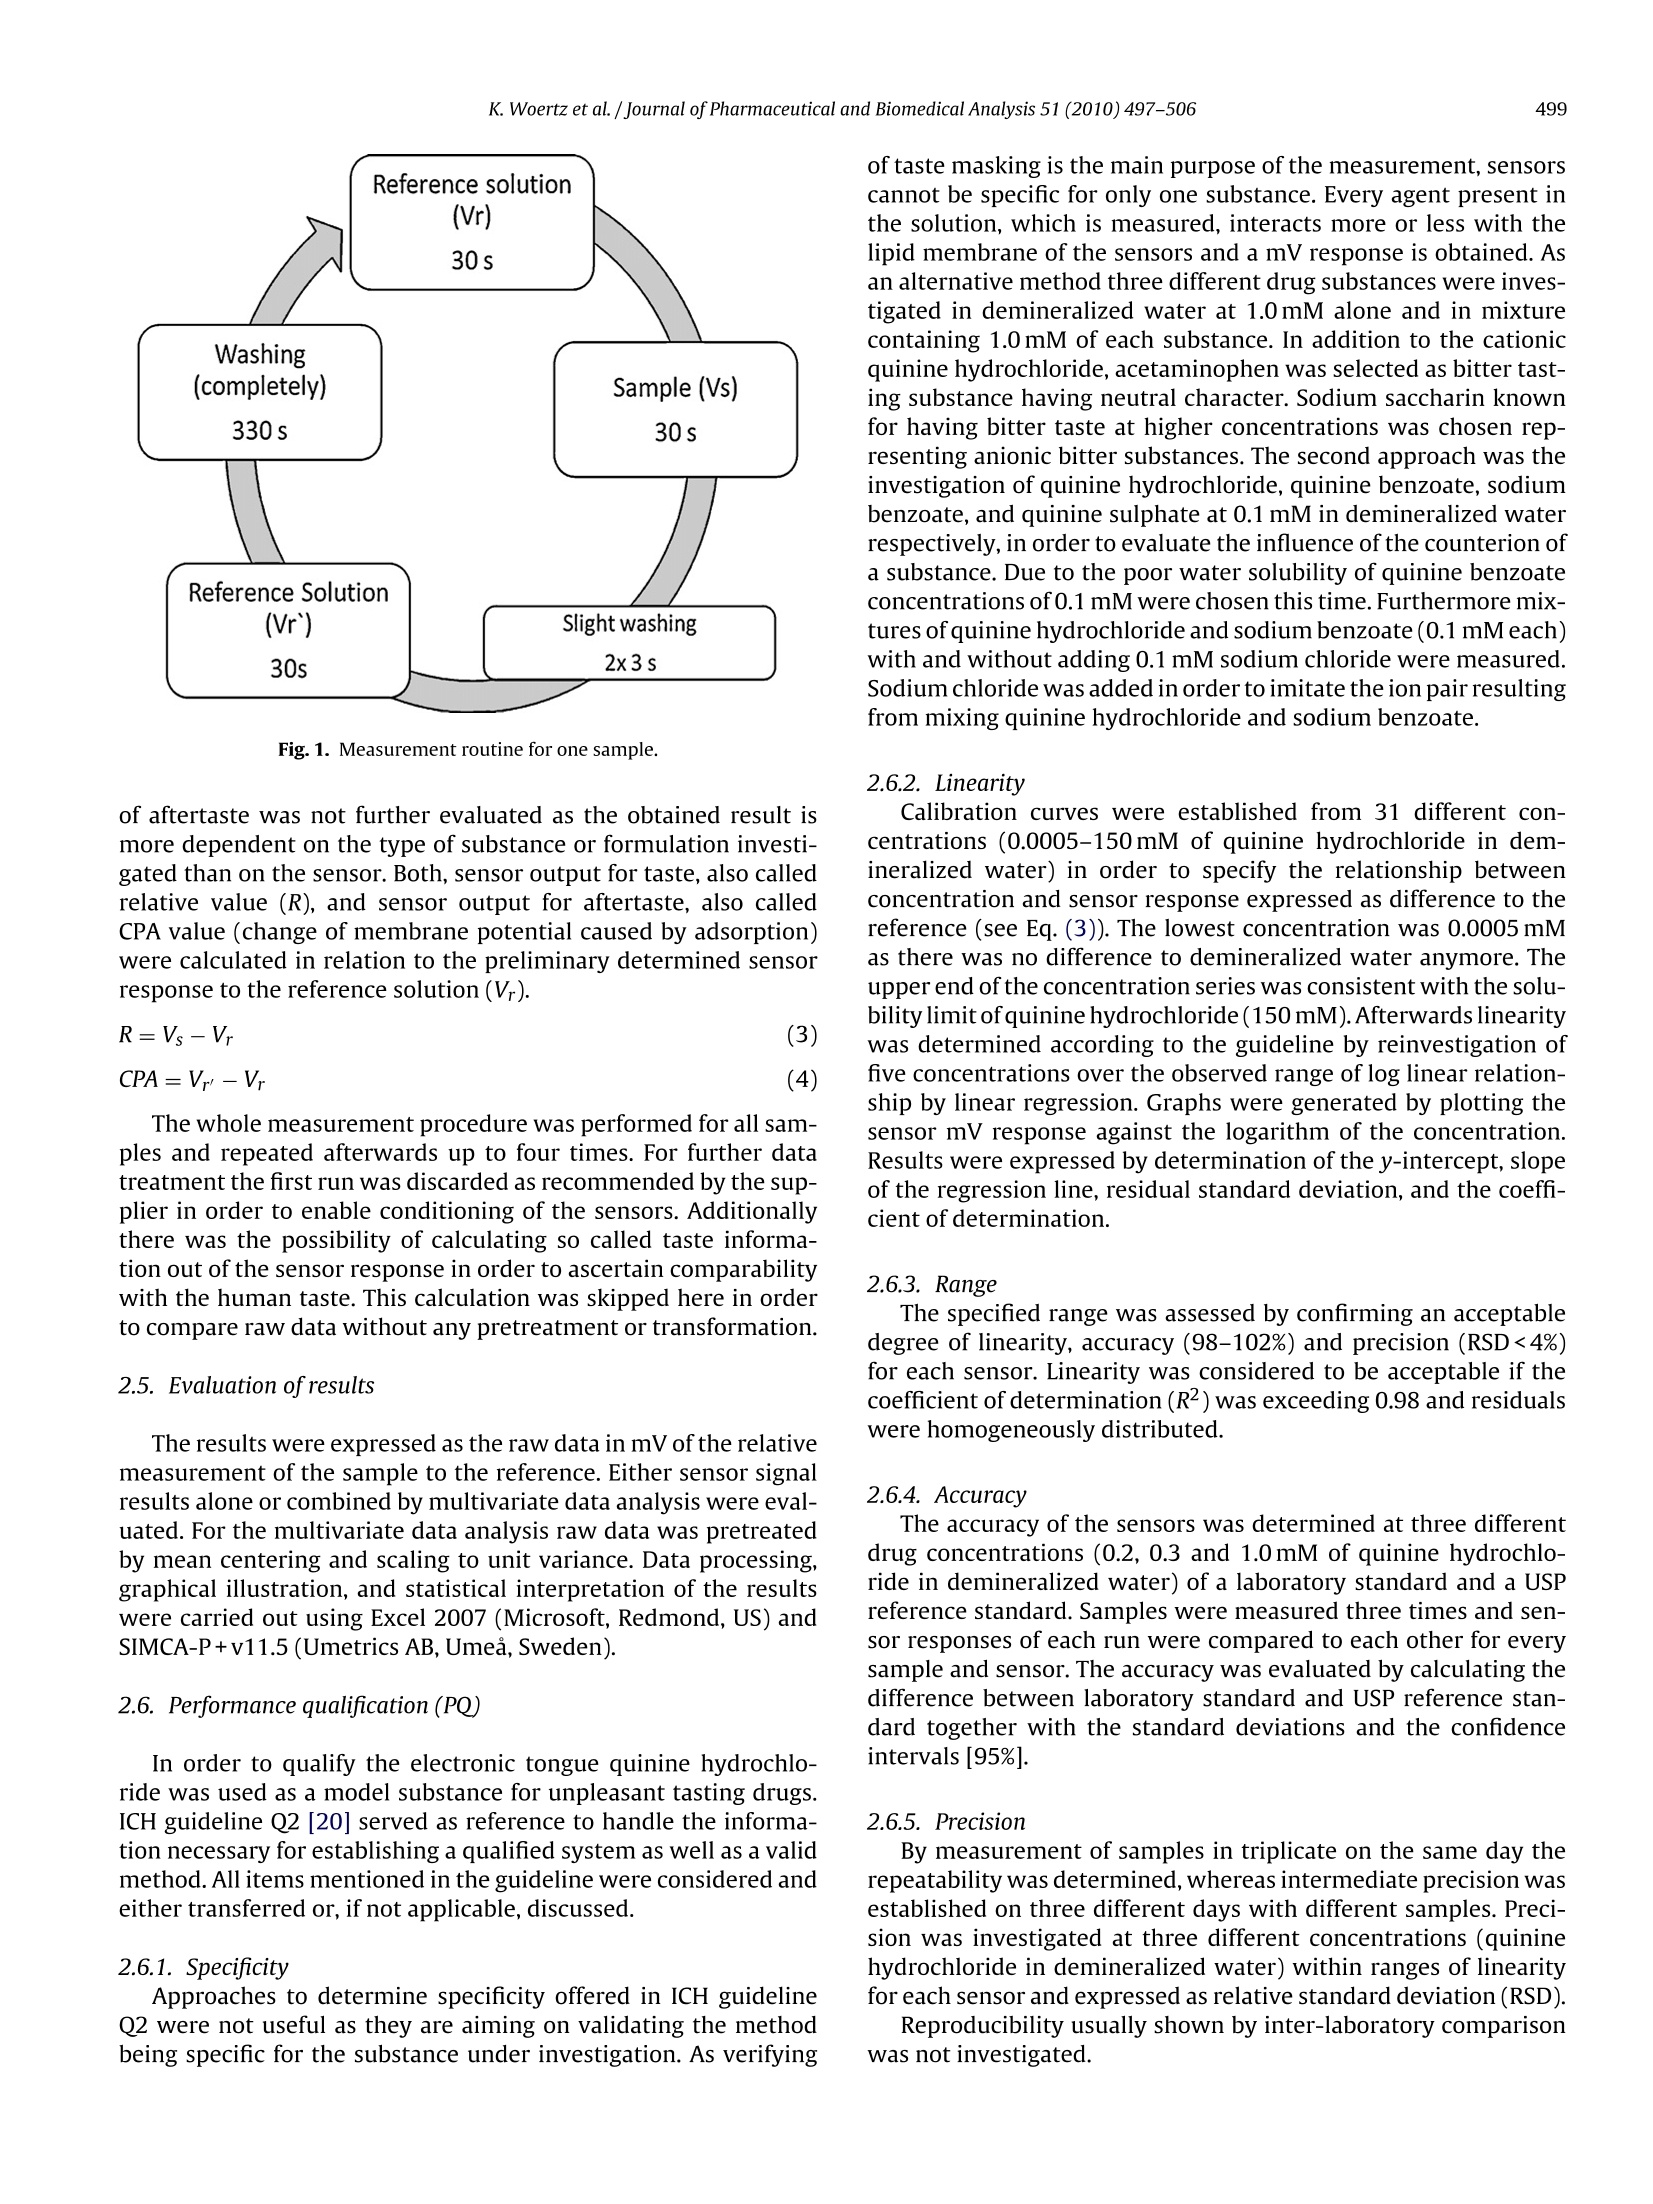
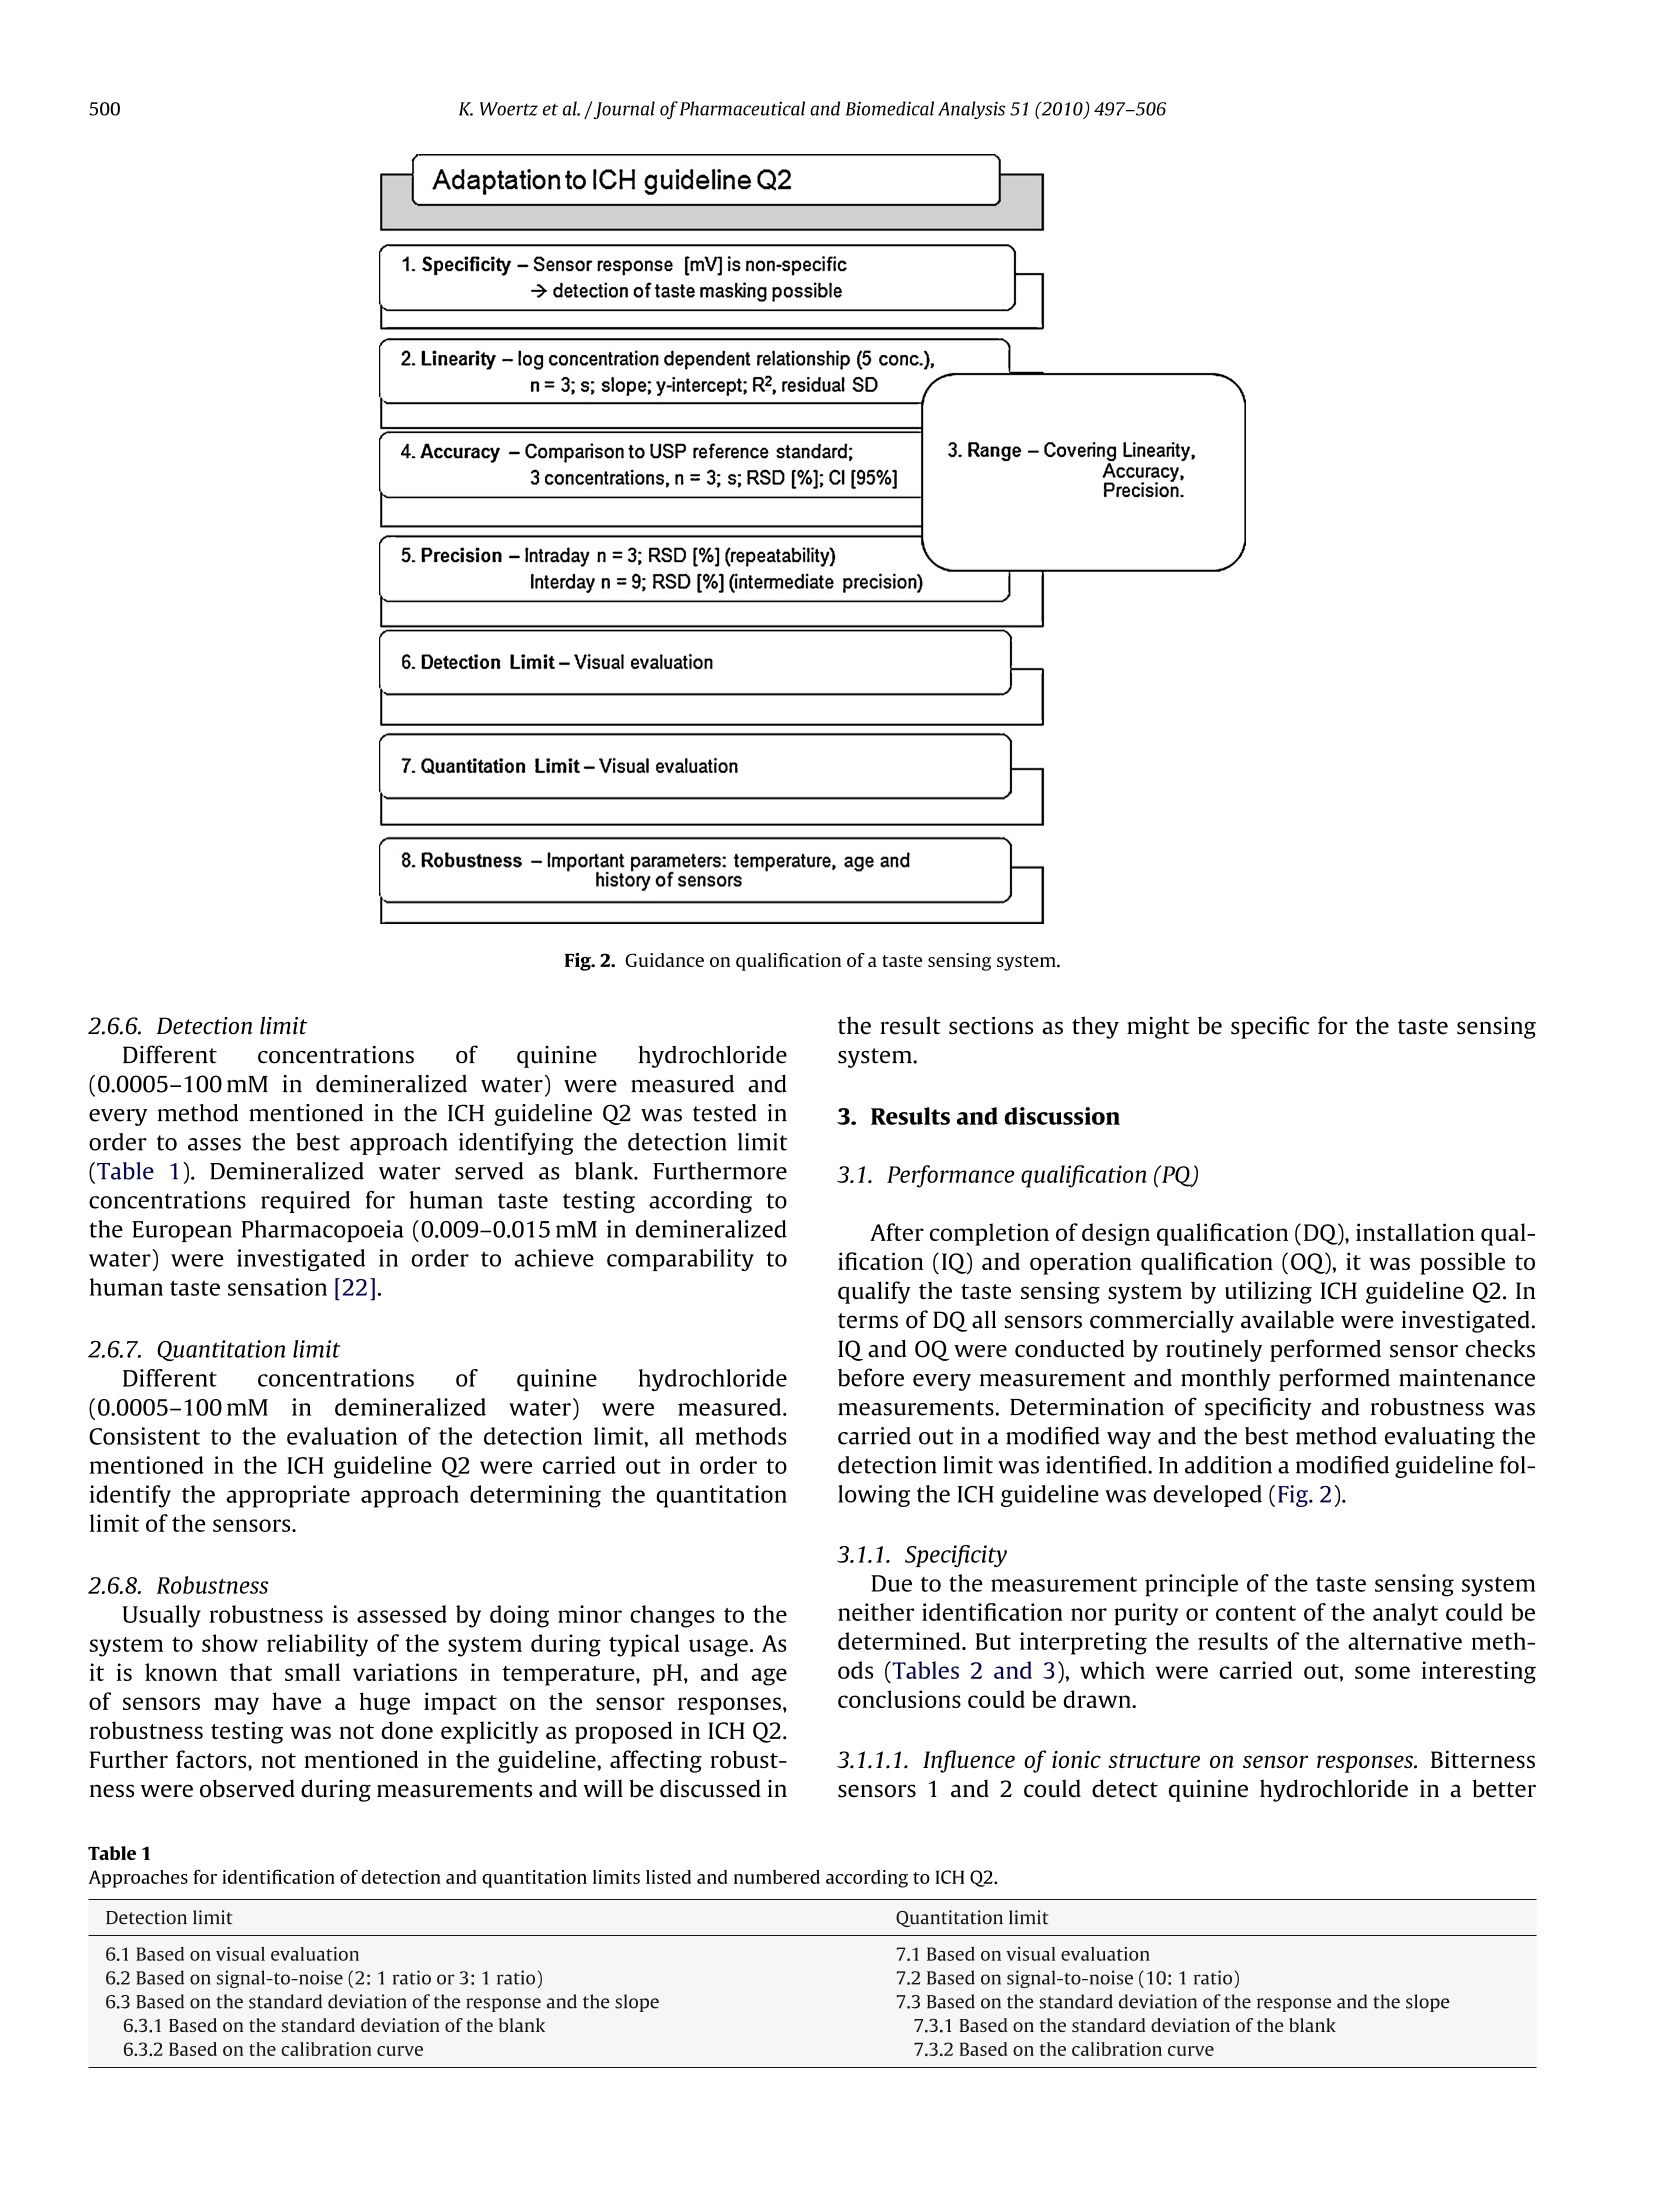
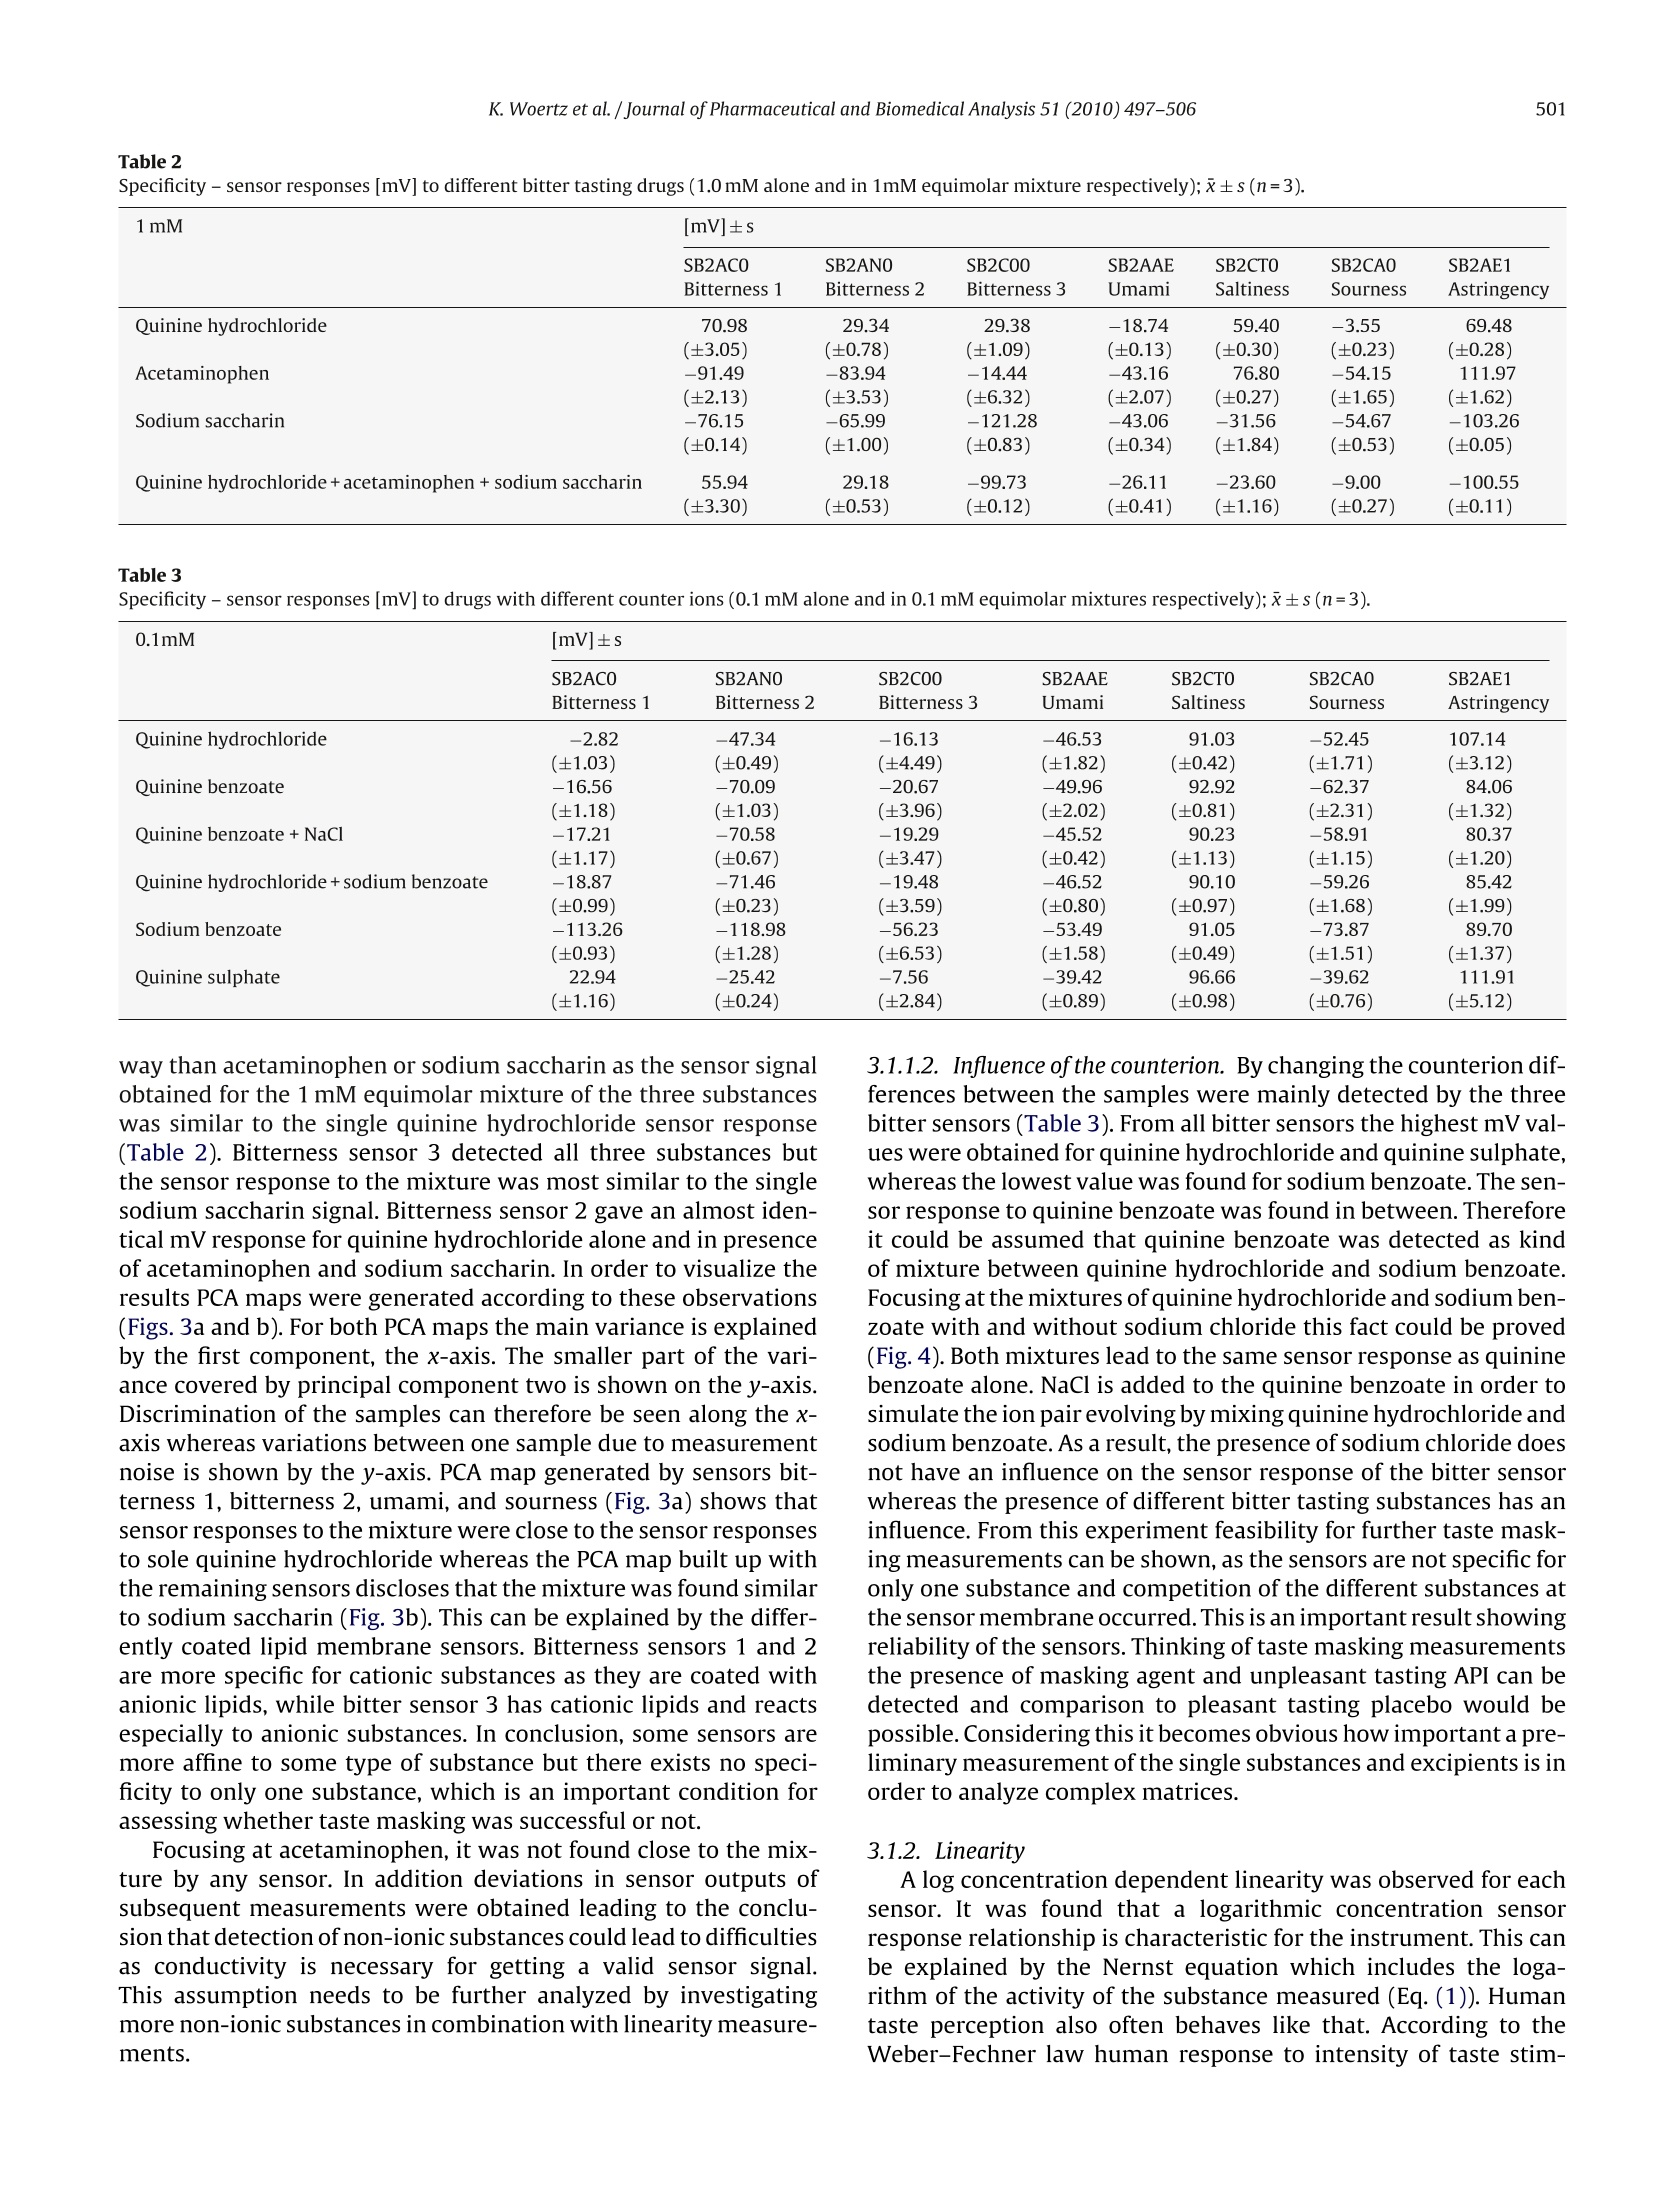
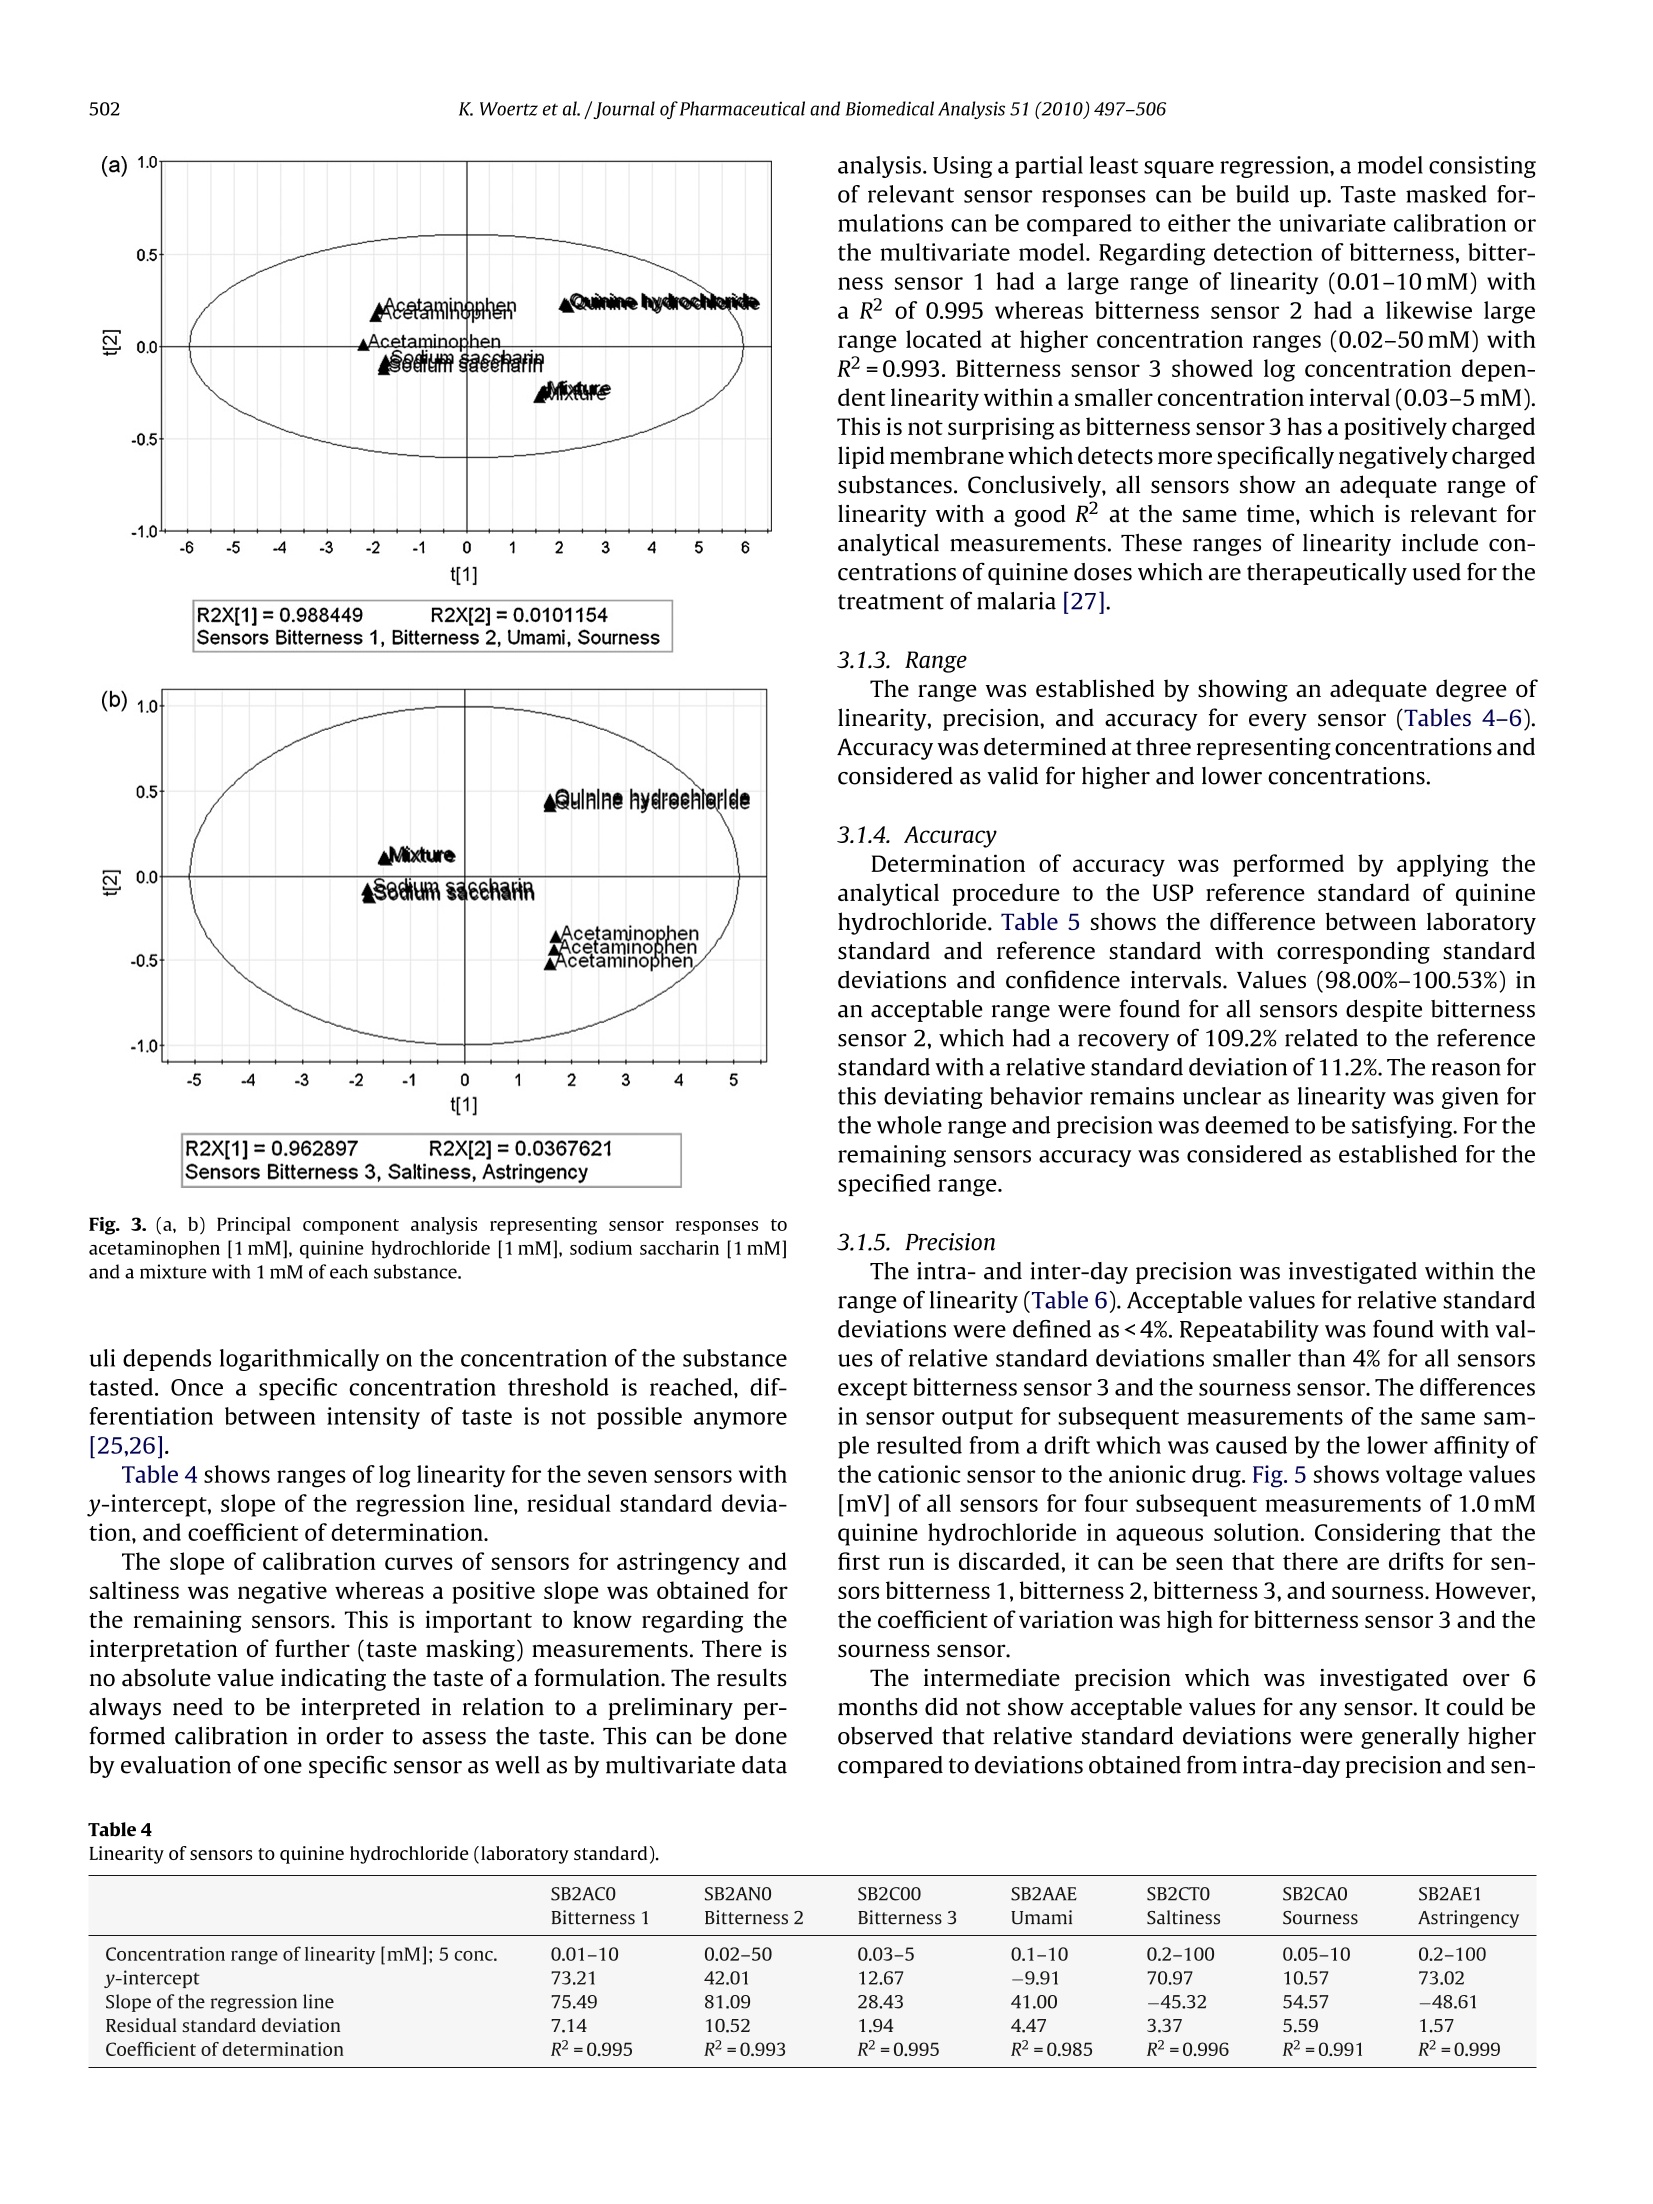
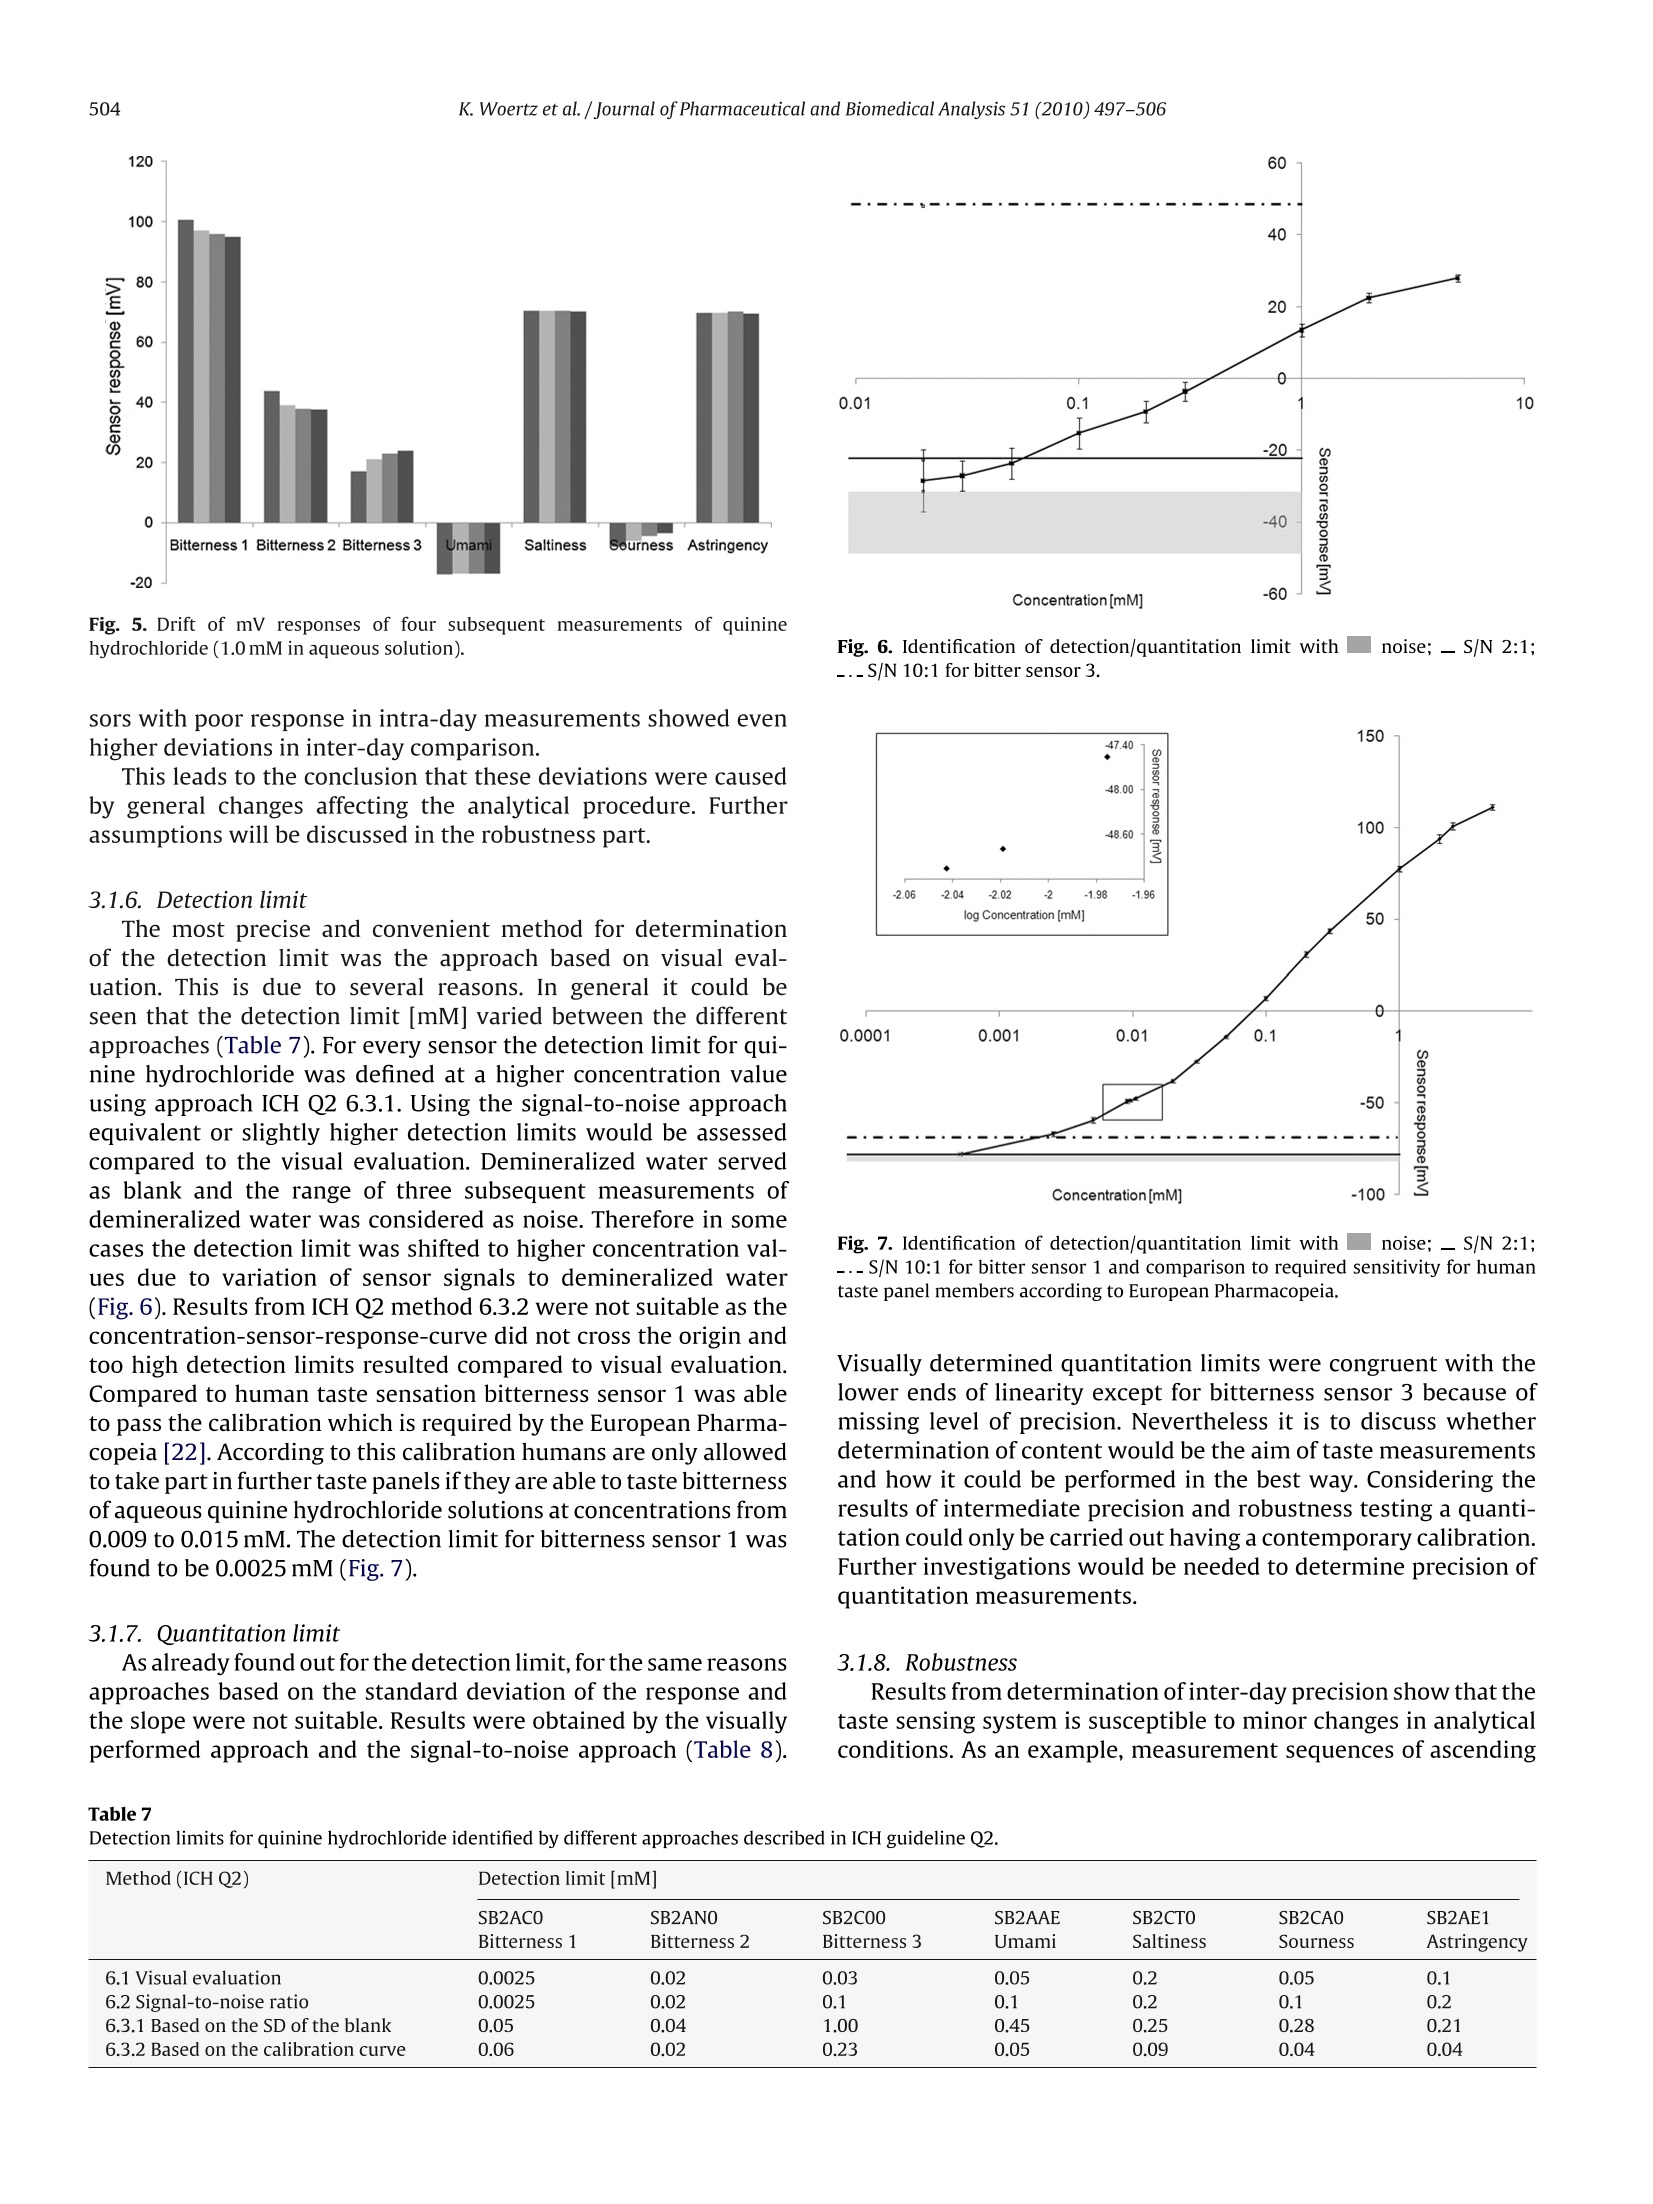
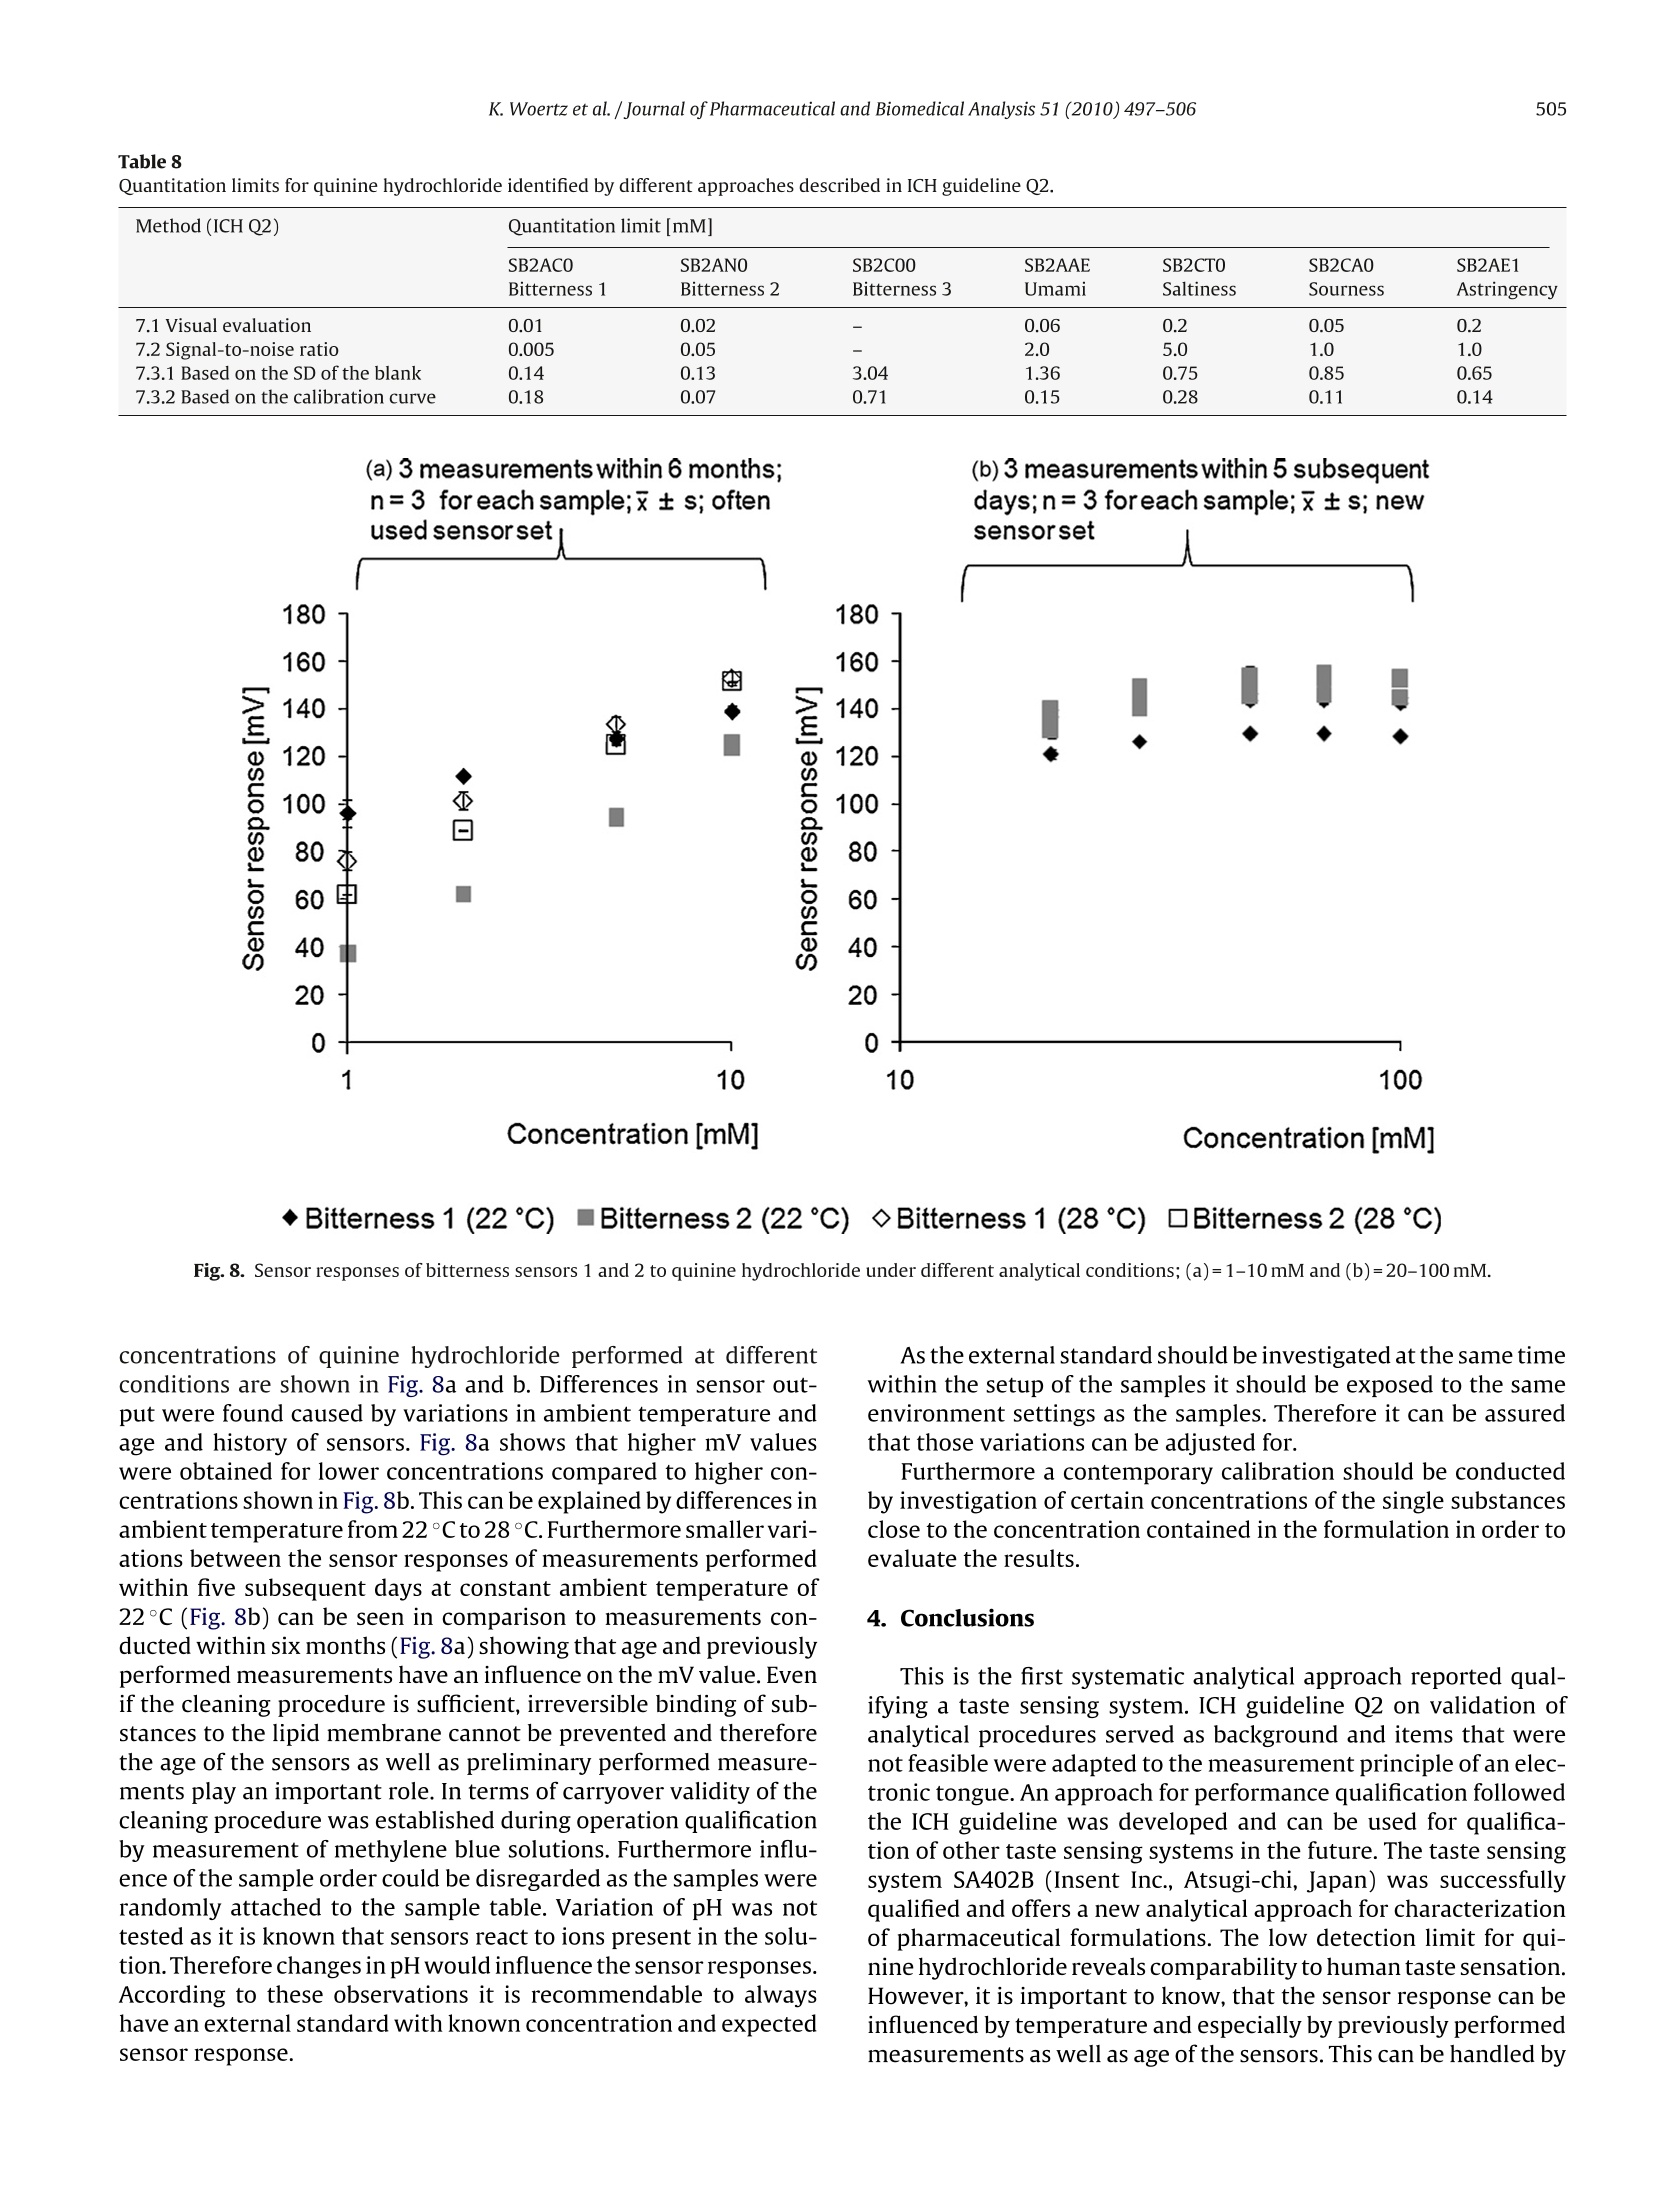
Journal of Pharmaceutical and Biomedical Analysis 51 (2010) 497-506Contents lists available at ScienceDirectJournal of Pharmaceutical and Biomedical Analysis K. Woertz et al./Journal of Pharmaceutical and Biomedical Analysis 51 (2010) 497-506498 ELSEVIER journal homepage:www.elsevier.com/locate/jpba Performance qualification of an electronic tongue based on ICH guideline Q2 Katharina Woertz, Corinna Tissen, Peter Kleinebudde,Joerg Breitkreutz* Institute of Pharmaceutics and Biopharmaceutics, Heinrich-Heine-University Duesseldorf, Universitaetsstr. 1, 40225 Duesseldorf, Germany ARTICLE INFO ABSTRACT Article history:Received 9 July 2009Received in revised form11 September 2009Accepted 19 September 2009Available online 27 September 2009 Recent progress in sensor technology has led to the development and application of electronic tastesensing systems. Especially taste prediction of pharmaceutical formulations is a matter of particularinterest and is increasingly performed using electronic tongues. Several studies have dealt with electronictongues before, but an analytical approach describing successfully conducted qualification has not beenreported yet. Keywords: Electronic tongueICH guideline Q2Quinine hydrochlorideSystem qualificationTaste sensing system Performance qualification of the taste sensing system SA402B (Insent Inc., Atsugi-chi,Japan) equippedwith seven lipid membrane sensors was undertaken with special regard to bitter taste assessment. Thesesensors represent the gustatory stimuli bitterness, umami, saltiness, sourness, and the nociceptive sen-sation astringency. Specificity, linearity,range, accuracy, precision,detection and quantitation limit aswell as robustness were established for each sensor type referring to ICH guideline Q2 (R1). Some itemsmentioned in the guideline were applicable whereas others had to be modified due to differences of thesystem to other commonly used analytical techniques. Quinine hydrochloride being one of the bitterestdrugs served as model substance. A large range of linearity (0.01-100mM) with corresponding precision(RSD<4%) was found for most sensors. One sensor had a lower detection threshold (0.0025mM) for qui-nine hydrochloride than humans typically have.Different methods for determination of detection andquantitation limits were implemented and discussed with respect to rationality and feasibility. Thereforethe approach based on visual evaluation was found as most adequate. An adapted guidance followingICH guideline Q2 was developed serving qualification of taste sensing systems in the future. 1. Introduction Today, the use of human taste panels is a commonly appliedmethod for taste assessment of pharmaceutical formulations. How-ever, there are some limitations which led to the development ofalternative methods in the past. The human sense of taste is a highlydeveloped mechanism but it also varies between individuals [1].Even if members of a taste panel are trained and calibrated, tastesensing remains subjective. Other drawbacks of human panelingare ethical and safety concerns coming up due to possible toxicityof the active pharmaceutical ingredients especially for new chemi-cal entities.Furthermore children do have difficulties to make validstatements of differences in taste perception [2].Particularly in thepediatric population, challenges conducting taste studies can ariseand a general approach applicable to the specific characteristics ofchildren has not been established yet [3]. As an alternative electronic taste sensing systems weredeveloped and are increasingly used for taste prediction of phar- ( * C orresponding author. Tel.: +49 211 8114220; fax: +49 211 8114251. ) E-mail addresses: Katharina.Woertz@uni-duesseldorf.de(K. Woertz), ( C ori n na.T i ssen@uni-d u e s seldorf.d e (C. Tissen),K l e i nebudde@uni-duesseldorf . de ) ( (P. Kleinebudde),Joerg.Breitkreut z @un i -duesseldorf.de (J. Breitkreutz). ) ( 0731-7085/$- see front matter O 2009 Elsevier B.V. All ri g hts reserved. doi:10.101 6 /j.jpba . 2009 . 09.029 ) maceutical formulations [4-6]. By using electronic tongues possibleethical concerns about taste assessment of medicinal products canbe reduced as the absolute number ofsamples for human taste pan-els may be reduced. In particular taste assessment at an early stageof formulation development can be conducted without knowingtoxicity data of the drug. Furthermore there are numerous fields ofapplication as quality control, stability testing, and screening thetaste of ingredients [7,8]. Two electronic tongue systems are commerciallyavailable: thetaste sensing system SA402B (Insent Inc., Atsugi-chi,Japan) andthe a-ASTREE e-tongue (Alpha M.O.S, Toulouse, France) [9]. Bothmeasure changes in electronic potential while investigating liquidsamples but the underlying sensor technologies are different. Thetaste sensing system SA402B is equipped with lipid membranesensors [10-14] whereas the a-ASTREE uses chemical field effecttransistor (ChemFET) technology. In addition other taste sensingsystems are under development as for example a voltammetricelectronic tongue [9]. To date several studies have been performed using electronictongues [15-17]. Taste masking by production of sodium benzoatelipid pellets was investigated utilizing electronic tongues, dissolu-tion testing, and a human taste panel [18].Results of these methodswere compared to each other. A correlation between electronictongue taste prediction and dissolution testing as well as human taste sensation was possible. Kayumba et al.[19] developed coatedpellets containing quinine sulphate and the o-ASTREE electronictongue was used for detection of evolution of bitterness intensityas function of time. Therefore the electronic tongue served as toolfor selecting the optimal formulation among pellets with differentcoating thicknesses.S. However, there is still the need to learn more about the tastesensing systems. None of the studies has dealt with a method val-idation before and there is still no systematic approach in orderto test the limitations of those systems. Researchers and pharma-ceutical industry claim for reliable and reproducible analytical data[8]. Qualification consists of four basic elements. Design qualifi-cation (DQ) meaning specification of what exactly the analyticalscientist requires the equipment to do, installation qualification(IQ) in which functionality according to the manufacturer’s spec-ification is tested, operational qualification (OQ) showing correctworking according to the analytical scientist's requirements, andperformance qualification (PQ) establishing continuation of opera-tion within the parameters monitored [20]. While IQ and OQ havebeen investigated and reported in other studies, performance qual-ification has not been shown for taste sensing systems yet. In thisstudy the taste sensing system SA402B was used for measurementsin order to establish a qualified system. Seven lipid membranesensors representing the different taste stimuli were investigatedregarding specificity,linearity,range,accuracy,precision,detectionand quantitation limit as well as robustness. Approaches accordingto International Conference on Harmonization (ICH) guideline Q2[21] were tested and adapted alternatives were implemented. As active pharmaceutical ingredients often exhibit a bitter taste,which can lead to non-compliance,quinine hydrochloride was cho-sen as model drug. Quinine hydrochloride is one of the bitterestdrugs coming up with a bitterness value of 200,000 [22]. Accordingto the European Pharmacopoeia the bitterness value is defined as“the reciprocal of the dilution of a compound, a liquid or an extractthat still has a bitter taste". For qualification for human taste paneltests,panelmembers are required to taste certain concentrations ofaqueous solutions of quinine hydrochloride. By testing these solu-tion members are calibrated or excluded from the panel, if theyare not able to taste the highest concentration (0.015mM). Nev-ertheless, the focus was more to find out whether it is possible toestablish a qualified system and a valid method than characteriz-ing quinine hydrochloride. The aim was to gain more experienceand knowledge about the taste sensing system as well as to deter-mine how and to what extent an electronic tongue can be used asanalytical tool. 2. Experimental 2.1. Chemicals and reagents Quinine hydrochloride was purchased from Caesar & LoretzGmbH (Hilden, Germany). The USP reference standard for quininehydrochloride was purchased from PHAST Quality standards GmbH(Homburg, Germany). Potassium chloride was acquired fromGriissing GmbH (Filsum, Germany). Tartaric acid was purchasedfrom Sigma-Aldrich Laborchemikalien GmbH (Seelze, Germany).Water was demineralized by reverse osmosis. Distilled water wasobtained by in-lab distillation of demineralized water. Absoluteethanol (purity 99.8%) was purchased from VWR International(Leuven, Belgium). Hydrochloric acid (1 mol/l) and potassiumhydroxide solution (0.1 mol/l) were acquired from Merck KGaA(Darmstadt,Germany). Theinner solution for sensors and referenceelectrodes consisting of 3.33 mol/l potassium chloride in saturatedsilver chloride solution was provided by Insent Inc. (Atsugi-chi, Japan). Acetaminophen was obtained from Rhodia DeutschlandGmbH (Freiburg, Germany), sodium benzoate from Sigma-AldrichLaborchemikalien GmbH (Seelze, Germany), sodium chloride fromVWR International (Leuven, Belgium), and quinine sulphate andsodium saccharin were purchased from Caesar & Loretz GmbH(Hilden,Germany). Quinine benzoate was kindly donated by S.C.Microsin S.R.L (Bucharest,Romania). 2.2. Sensors Sensors and reference electrodes were purchased from TecLabSEurope OHG (Essen, Germany). To enable reproducible electro-chemical measurements 0.2 ml saturated AgCl solution called"inner solution” (see Section 2.1) was filled into each sensor priorto the experiments. The reference electrode was completely filledup with inner solution. All sensors were preconditioned in standardsolution for one day before the measurement. 2.3. Preparation of standard, washing and sample solutions Quinine hydrochloride solutions were prepared in deminer-alized water at different concentrations (0.0005-150mM). Twowashing solutions for negatively and positively charged sensorsrespectively were made by diluting absolute ethanol to ethanol30% with distilled water and adding 100 mM hydrochloric acid forthe negatively charged sensors or 100 mM potassium chloride and10 mM potassium hydroxide for the positively charged sensors. Astandard solution serving as cleaning and also as “reference solu-tion”was prepared by dissolving 30 mM potassium chloride and0.3 mM tartaric acid in distilled water. 2.4. Electronic tongue system and measurement setup All measurements were performed by the taste sensing systemSA402B (Insent Inc., Atsugi-chi, Japan). This electronic tongue isequipped with seven lipid membrane sensors providing differenttaste qualities and three corresponding reference electrodes. Theunderlying measurement principle is potentiometric and sensorresponses are obtained as mV values consequently. According tothe Nernst equation the electrode potential depends logarithmi-cally on the activity of the substance [23,24] where U=electrode potential; U=standard electrode potential;R=universal gas constant; T=temperature (K); z=ionic valence ofthe substance; F=Faraday constant; aj=activity of the substance. ai=fci (2) where ci=concentration of the substance;fi=activity coefficient ofthe substance. There are three sensors specific for bitterness,bitterness sensor1 (SB2AC0), bitterness sensor 2 (SB2AN0), and bitterness sensor 3(SB2C0O). The other sensors represent the gustatory stimuli umami(SB2AAE), saltiness (SB2CT0), sourness (SB2CA0), and astringency(SB2AE1). Furthermore an aftertaste can be measured for bitter-ness, umami, and astringency. A sensor check was conducted routinely before every measure-ment in order to assure that sensors were working in the correctmV range. Each sample was measured four times, whereas onemeasurement cycle (Fig. 1) consisted of measuring the referencesolution(Vr), afterwards the sample solution (Vs), a short (2xthreeseconds) cleaning procedure and measurement of the aftertaste(Vr). The aftertaste was measured by determining the change ofmembrane potential caused by adsorption of the substance to thelipid membrane after the short cleaning procedure. Interpretation Fig. 1. Measurement routine for one sample. of aftertaste was not further evaluated as the obtained result ismore dependent on the type of substance or formulation investi-gated than on the sensor. Both, sensor output for taste, also calledrelative value (R), and sensor output for aftertaste, also calledCPA value (change of membrane potential caused by adsorption)were calculated in relation to the preliminary determined sensorresponse to the reference solution(Vr). The whole measurement procedure was performed for all sam-ples and repeated afterwards up to four times. For further datatreatment the first run was discarded as recommended by the sup-plier in order to enable conditioning of the sensors. Additionallythere was the possibility of calculating so called taste informa-tionout of the sensor response in order to ascertain comparabilitywith the human taste. This calculation was skipped here in orderto compare raw data without any pretreatment or transformation. 2.5. Evaluation ofresults The results were expressed as the raw data in mV of the relativemeasurement of the sample to the reference. Either sensor signalresults alone or combined by multivariate data analysis were eval-uated. For the multivariate data analysis raw data was pretreatedby mean centering and scaling to unit variance. Data processing,graphical illustration, and statistical interpretation of the resultswere carried out using Excel 2007 (Microsoft, Redmond, US) andSIMCA-P+v11.5 (Umetrics AB,Umea, Sweden). 2.6. Performance qualification (PQ) In order to qualify the electronic tongue quinine hydrochlo-ride was used as a model substance for unpleasant tasting drugs.ICH guideline Q2 [20] served as reference to handle the informa-tion necessary for establishing a qualified system as well as a validmethod. All items mentioned in the guideline were considered andeither transferred or, if not applicable, discussed. 2.6.1. Specificity Approaches to determine specificity offered in ICH guidelineQ2 were not useful as they are aiming on validating the methodbeing specific for the substance under investigation. As verifying of taste masking is the main purpose of the measurement, sensorscannot be specific for only one substance. Every agent present inthe solution, which is measured, interacts more or less with thelipid membrane of the sensors and a mV response is obtained. Asan alternative method three different drug substances were inves-tigated in demineralized water at 1.0 mM alone and in mixturecontaining 1.0mM of each substance. In addition to the cationicquinine hydrochloride, acetaminophen was selected as bitter tast-ing substance having neutral character. Sodium saccharin knownfor having bitter taste at higher concentrations was chosen rep-resenting anionic bitter substances. The second approach was theinvestigation of quinine hydrochloride, quinine benzoate, sodiumbenzoate, and quinine sulphate at 0.1 mM in demineralized waterrespectively, in order to evaluate the influence of the counterion ofa substance. Due to the poor water solubility of quinine benzoateconcentrations of 0.1 mM were chosen this time. Furthermore mix-tures of quinine hydrochloride and sodium benzoate(0.1mM each)with and without adding 0.1 mM sodium chloride were measured.Sodium chloride was added in order to imitate the ion pair resultingfrom mixing quinine hydrochloride and sodium benzoate. 2.6.2. Linearity Calibration curves were established from 31 different con-centrations (0.0005-150mM of quinine hydrochloride in dem-ineralized water) in order to specify the relationship betweenconcentration and sensor response expressed as difference to thereference (see Eq. (3)). The lowest concentration was 0.0005 mMas there was no difference to demineralized water anymore. Theupper end of the concentration series was consistent with the solu-bility limit of quinine hydrochloride(150mM).Afterwards linearitywas determined according to the guideline by reinvestigation offive concentrations over the observed range of log linear relation-ship by linear regression. Graphs were generated by plotting thesensor mV response against the logarithm of the concentration.Results were expressed by determination of the y-intercept, slopeof the regression line, residual standard deviation, and the coeffi-cient of determination. 2.6.3. Range The specified range was assessed by confirming an acceptabledegree of linearity, accuracy (98-102%) and precision (RSD<4%)for each sensor. Linearity was considered to be acceptable if thecoefficient of determination(R-) was exceeding 0.98 and residualswere homogeneously distributed. 2.6.4. Accuracy The accuracy of the sensors was determined at three differentdrug concentrations (0.2, 0.3 and 1.0 mM of quinine hydrochlo-ride in demineralized water) of a laboratory standard and a USPreference standard.Samples were measured three times and sen-sor responses of each run were compared to each other for everysample and sensor. The accuracy was evaluated by calculating thedifference between laboratory standard and USP reference stan-dard together with the standard deviations and the confidenceintervals [95%]. 2.6.5. Precision By measurement of samples in triplicate on the same day therepeatability was determined, whereas intermediate precision wasestablished on three different days with different samples. Preci-sion was investigated at three different concentrations (quininehydrochloride in demineralized water) within ranges of linearityfor each sensor and expressed as relative standard deviation (RSD). Reproducibility usually shown by inter-laboratory comparisonwas not investigated. 2.6.6. Detection limit Different concentrations of quinine hydrochloride(0.0005-100mM in demineralized water) were measured andevery method mentioned in the ICH guideline Q2 was tested inorder to asses the best approach identifying the detection limit(Table 1). Demineralized water served as blank. Furthermoreconcentrations required for human taste testing according tothe European Pharmacopoeia (0.009-0.015mM in demineralizedwater) were investigated in order to achieve comparability tohuman taste sensation [22]. 2.6.7. Quantitation limit Different concentrations of quinine hydrochloride(0.0005-100 mM in demineralizedd water)weremeasured.Consistent to the evaluation of the detection limit, all methodsmentioned in the ICH guideline Q2 were carried out in order toidentify the appropriate approach determining the quantitationlimit of the sensors. 2.6.8. Robustness Usually robustness is assessed by doing minor changes to thesystem to show reliability of the system during typical usage. Asit is known that small variations in temperature, pH, and ageof sensors may have a huge impact on the sensor responses,robustness testing was not done explicitly as proposed in ICH Q2.Further factors, not mentioned in the guideline, affecting robust-ness were observed during measurements and will be discussed in the result sections as they might be specific for the taste sensingsystem. 3. Results and discussion 3.1. Performance qualification (PQ) After completion of design qualification (DQ), installation qual-ification (IQ) and operation qualification (OQ), it was possible toqualify the taste sensing system by utilizing ICH guideline Q2. Interms of DQ all sensors commercially available were investigated.IQ and OQ were conducted by routinely performed sensor checksbefore every measurement and monthly performed maintenancemeasurements. Determination of specificity and robustness wascarried out in a modified way and the best method evaluating thedetection limit was identified. In addition a modified guideline fol-lowing the ICH guideline was developed (Fig.2). 3.1.1. Specificity Due to the measurement principle of the taste sensing systemneither identification nor purity or content of the analyt could bedetermined. But interpreting the results of the alternative meth-ods (Tables 2 and 3), which were carried out, some interestingconclusions could be drawn. 3.1.1.1. Influence ofionic structure on sensor responses. Bitternesssensors 1 and 2 could detect quinine hydrochloride in a better Approaches for identification of detection and quantitation limits listed and numbered according to ICH Q2. Detection limit Quantitation limit 6.1 Basedon visual evaluation 7.1 Based on visual evaluation 6.2 Based on signal-to-noise (2: 1 ratio or 3: 1 ratio) 7.2 Based on signal-to-noise (10: 1 ratio) 6.3 Based on the standard deviation of the response and the slope 7.3 Based on the standard deviation of the response and the slope 6.3.1 Based on the standard deviation of the blank 7.3.1 Based on the standard deviation of the blank 6.3.2 Based on the calibration curve 7.3.2 Based on the calibration curve Table 2Specificity - sensor responses [mV] to different bitter tasting drugs (1.0 mM alone and in 1mM equimolar mixture respectively);x±s(n=3). 1mM [mV]±s SB2ACO SB2ANO SB2C00 SB2AAE SB2CTO SB2CAO SB2AE1 Bitterness 1 Bitterness 2 Bitterness 3 Umami Saltiness Sourness Astringency Quinine hydrochloride 70.98 29.34 29.38 -18.74 59.40 -3.55 69.48 (±3.05) (±0.78) (±1.09) (±0.13) (十0.30) (±0.23) (±0.28) Acetaminophen -91.49 -83.94 -14.44 -43.16 76.80 -54.15 111.97 (±2.13) (±3.53) (±6.32) (±2.07) (±0.27) (±1.65) (±1.62) Sodium saccharin -76.15 -65.99 -121.28 -43.06 -31.56 -54.67 -103.26 (±0.14) (±1.00) (±0.83) (±0.34) (±1.84) (±0.53) (±0.05) Quinine hydrochloride+acetaminophen + sodium saccharin 55.94 29.18 -99.73 -26.11 -23.60 -9.00 -100.55 (±3.30) (±0.53) (±0.12) (±0.41) (±1.16) (±0.27) (±0.11) Table 3 Specificity- sensor responses [mV] to drugs with different counter ions (0.1 mM alone and in 0.1 mM equimolar mixtures respectively);x±s (n=3). 0.1mM [mV]±S SB2ACO SB2AN0 SB2C00 SB2AAE SB2CTO SB2CAO SB2AE1 Bitterness 1 Bitterness 2 Bitterness 3 Umami Saltiness Sourness Astringency Quinine hydrochloride -2.82 -47.34 -16.13 -46.53 91.03 -52.45 107.14 (±1.03) (±0.49) (±4.49) (±1.82) (±0.42) (±1.71) (±3.12) Quinine benzoate -16.56 -70.09 -20.67 -49.96 92.92 -62.37 84.06 (±1.18) (±1.03) (±3.96) (±2.02) (±0.81) (±2.31) (±1.32) Ouinine benzoate +NaCl -17.21 -70.58 -19.29 -45.52 90.23 -58.91 80.37 (±1.17) (±0.67) (±3.47) (±0.42) (±1.13) (±1.15) (±1.20) Quinine hydrochloride+sodium benzoate -18.87 -71.46 -19.48 -46.52 90.10 -59.26 85.42 (±0.99) (±0.23) (±3.59) (±0.80) (±0.97) (±1.68) (±1.99) Sodium benzoate -113.26 -118.98 -56.23 -53.49 91.05 -73.87 89.70 (±0.93) (±1.28) (±6.53) (±1.58) (±0.49) (±1.51) (±1.37) Quinine sulphate 22.94 -25.42 -7.56 -39.42 96.66 -39.62 111.91 (±1.16) (±0.24) (±2.84) (±0.89) (±0.98) (±0.76) (±5.12) way than acetaminophen or sodium saccharin as the sensor signalobtained for the 1mM equimolar mixture of the three substanceswas similar to the single quinine hydrochloride sensor response(Table 2). Bitterness sensor 3 detected all three substances butthe sensor response to the mixture was most similar to the singlesodium saccharin signal. Bitterness sensor 2 gave an almost iden-tical mV response for quinine hydrochloride alone and in presenceof acetaminophen and sodium saccharin. In order to visualize theresults PCA maps were generated according to these observations(Figs. 3a and b). For both PCA maps the main variance is explainedby the first component, the x-axis. The smaller part of the vari-ance covered by principal component two is shown on the y-axis.Discrimination of the samples can therefore be seen along the x-axis whereas variations between one sample due to measurementnoise is shown by the y-axis. PCA map generated by sensors bit-terness 1, bitterness 2, umami, and sourness (Fig. 3a) shows thatsensor responses to the mixture were close to the sensor responsesto sole quinine hydrochloride whereas the PCA map built up withtheremaining sensors discloses that the mixture was found similarto sodium saccharin (Fig. 3b). This can be explained by the differ-ently coated lipid membrane sensors. Bitterness sensors 1 and 2are more specific for cationic substances as they are coated withanionic lipids, while bitter sensor 3 has cationic lipids and reactsespecially to anionic substances. In conclusion, some sensors aremore affine to some type of substance but there exists no speci-ficity to only one substance, which is an important condition forassessing whether taste masking was successful or not. Focusing at acetaminophen, it was not found close to the mix-ture by any sensor. In addition deviations in sensor outputs ofsubsequent measurements were obtained leading to the conclu-sion that detection of non-ionic substances could lead to difficultiesas conductivity is necessary for getting a valid sensor signal.This assumption needs to be further analyzed by investigatingmore non-ionic substances in combination with linearity measure-ments. 3.1.1.2. Influence of the counterion. By changing the counterion dif-ferences between the samples were mainly detected by the threebitter sensors (Table3). From all bitter sensors the highest mVval-ues were obtained for quinine hydrochloride and quinine sulphate,whereas the lowest value was found for sodium benzoate. The sen-sor response to quinine benzoate was found in between. Thereforeit could be assumed that quinine benzoate was detected as kindof mixture between quinine hydrochloride and sodium benzoate.Focusing at the mixtures of quinine hydrochloride and sodium ben-zoate with and without sodium chloride this fact could be proved(Fig.4). Both mixtures lead to the same sensor response as quininebenzoate alone. NaCl is added to the quinine benzoate in order tosimulate the ion pair evolving by mixing quinine hydrochloride andsodium benzoate. As a result, the presence of sodium chloride doesnot have an influence on the sensor response of the bitter sensorwhereas the presence of different bitter tasting substances has aninfluence. From this experiment feasibility for further taste mask-ing measurements can be shown, as the sensors are not specific foronly one substance and competition of the different substances atthe sensor membrane occurred. This is an important result showingreliability of the sensors. Thinking of taste masking measurementsthe presence of masking agent and unpleasant tasting API can bedetected and comparison to pleasant tasting placebo would bepossible. Considering this it becomes obvious how important a pre-liminary measurement of the single substances and excipients is inorder to analyze complex matrices. 3.1.2. Linearity A log concentration dependent linearity was observed for eachsensor. It was found that a logarithmic concentration sensorresponse relationship is characteristic for the instrument. This canbe explained by the Nernst equation which includes the loga-rithm of the activity of the substance measured (Eq. (1)). Humantaste perception also often behaves like that. According to theWeber-Fechner law human response to intensity of taste stim- R2X[1]=0.988449 R2X[2]=0.0101154 Sensors Bitterness 1, Bitterness 2, Umami, Sourness Fig. 3. (a, b) Principal component analysis representing sensor responses toacetaminophen [1mM], quinine hydrochloride [1 mM], sodium saccharin [1 mM]and a mixture with 1 mM of each substance. uli depends logarithmically on the concentration of the substancetasted. Once a specific concentration threshold is reached, dif-ferentiation between intensity of taste is not possible anymore[25,261. Table 4 shows ranges of log linearity for the seven sensors withy-intercept, slope of the regression line, residual standard devia-tion, and coefficient of determination. The slope of calibration curves of sensors for astringency andsaltiness was negative whereas a positive slope was obtained forthe remaining sensors. This is important to know regarding theinterpretation of further (taste masking) measurements. There isno absolute value indicating the taste of a formulation.The resultsalways need to be interpreted in relation to a preliminary per-formed calibration in order to assess the taste. This can be doneby evaluation of one specific sensor as well as by multivariate data analysis.Using a partial least square regression, a model consistingof relevant sensor responses can be build up. Taste masked for-mulations can be compared to either the univariate calibration orthe multivariate model. Regarding detection of bitterness, bitter-ness sensor 1 had a large range of linearity (0.01-10mM) witha R2 of 0.995 whereas bitterness sensor 2 had a likewise largerange located at higher concentration ranges (0.02-50mM) withR2=0.993. Bitterness sensor 3 showed log concentration depen-dent linearity within a smaller concentration interval(0.03-5mM).This is not surprising as bitterness sensor 3 has a positively chargedlipid membrane which detects more specifically negatively chargedsubstances. Conclusively, all sensors show an adequate range oflinearity with a good R2at the same time, which is relevant foranalytical measurements. These ranges of linearity include con-centrations of quinine doses which are therapeutically used for thetreatment of malaria [27]. 3.1.3. Range The range was established by showing an adequate degree oflinearity, precision, and accuracy for every sensor (Tables 4-6).Accuracy was determined at three representing concentrations andconsidered as valid for higher and lower concentrations. 3.1.4. Accuracy Determination of accuracy was performed by applying theanalytical procedure to the USP reference standard of quininehydrochloride. Table 5 shows the difference between laboratorystandard and reference standard with corresponding standarddeviations and confidence intervals. Values (98.00%-100.53%) inan acceptable range were found for all sensors despite bitternesssensor 2, which had a recovery of 109.2% related to the referencestandard with a relative standard deviation of 11.2%. The reason forthis deviating behavior remains unclear as linearity was given forthe whole range and precision was deemed to be satisfying. For theremaining sensors accuracy was considered as established for thespecified range. 3.1.5. Precision The intra- and inter-day precision was investigated within therange of linearity (Table 6). Acceptable values for relative standarddeviations were defined as<4%. Repeatability was found with val-ues of relative standard deviations smaller than 4% for all sensorsexcept bitterness sensor 3 and the sourness sensor. The differencesin sensor output for subsequent measurements of the same sam-ple resulted from a drift which was caused by the lower affinity ofthe cationic sensor to the anionic drug. Fig. 5 shows voltage values[mV] of all sensors for four subsequent measurements of 1.0 mMquinine hydrochloride in aqueous solution. Considering that thefirst run is discarded, it can be seen that there are drifts for sen-sors bitterness 1, bitterness 2, bitterness 3, and sourness. However,the coefficient of variation was high for bitterness sensor 3 and theSourness sensor. The intermediate precision which was investigated over 6months did not show acceptable values for any sensor. It could beobserved that relative standard deviations were generally highercompared to deviations obtained from intra-day precision and sen- Linearity of sensors to quinine hydrochloride (laboratory standard). SB2AC0 SB2ANO SB2C00 SB2AAE SB2CTO SB2CA0 SB2AE1 Bitterness 1 Bitterness 2 Bitterness 3 Umami Saltiness Sourness Astringency Concentration range of linearity [mM]; 5 conc. 0.01-10 0.02-50 0.03-5 0.1-10 0.2-100 0.05-10 0.2-100 y-intercept 73.21 42.01 12.67 -9.91 70.97 10.57 73.02 Slope of the regression line 75.49 81.09 28.43 41.00 -45.32 54.57 -48.61 Residual standard deviation 7.14 10.52 1.94 4.47 3.37 5.59 1.57 Coefficient of determination R2=0.995 R2=0.993 R2=0.995 R2=0.985 R2=0.996 R2=0.991 R2=0.999 Benzoate Bitterness sensor 3Benzoate +Mixture Quinine Quinine Sodium Quinine NaCl Benzoate QuinineHCl (c) sulphate -10 -30Ecoaoc -50 -70 -90 -110 -130 Fig. 4. Sensor responses of bitterness sensors 1-3 to quinine hydrochloride, quinine benzoate, quinine benzoate+sodium chloride, mixture of quinine hydrochloride andsodium benzoate, and quinine sulphate (0.1 mM each);x±s(n=3). Table 5Accuracy-comparison of quinine hydrochloride laboratory standard to USP reference standard. mM| Accuracy between laboratory standard and USP reference standard [%] SB2ACO SB2ANO SB2CO0 SB2AAE SB2CTO SB2CA0 SB2AE1 Bitterness 1 Bitterness 2 Bitterness 3 Umami Saltiness Sourness Astringency 0.2 97.90 108.85 101.39 100.21 99.23 101.41 99.94 0.3 97.21 121.61 98.48 100.57 100.08 103.81 99.35 1.0 98.88 97.12 101.72 100.13 100.64 96.24 101.20 Average value [%] 98.00 109.19 100.53 100.30 99.98 100.49 100.16 Standard deviation 0.84 12.25 1.78 0.23 0.71 3.87 0.95 Relative standard deviation [%] 0.86 11.22 1.77 0.23 0.71 3.85 0.95 95%CI (from) 97.04 95.33 98.52 100.04 99.18 96.11 99.09 95% CI (to) 98.95 123.06 102.55 100.57 100.79 104.87 101.24 Table 6Precision for quinine hydrochloride at three concentrations within the assessed range of linearity - intra-day n=3;inter-dayn=9. SB2AC0 SB2ANO SB2C00 SB2AAE SB2CTO SB2CA0 SB2AE1 Bitterness 1 Bitterness 2 Bitterness 3 Umami Saltiness Sourness Astringency Concentration range of linearity [mM] 0.01-10 0.02-50 0.03-5 0.1-10 0.2-100 0.05-10 0.2-100 Repeatability (intra-day) RSD [%] 0.01 mM 0.02mM 0.03mM 0.1mM 0.2mM 0.05mM 0.2mM 1.92 3.35 10.17 2.63 0.69 4.35 1.86 1mM 2mM 1mM 1mM 2mM 5mM 2mM 1.39 0.82 7.51 0.47 0.03 6.65 0.19 10mM 50mM 5mM 10mM 100mM 10mM 100mM 0.47 1.19 3.02 1.89 1.8 5.03 0.71 Intermediate precision (inter-day) RSD [%] 0.01mM 0.02mM 0.03 mM 0.1mM 0.2mM 0.05mM 0.2mM 32.29 20.07 32.38 0.92 8.52 8.01 3.87 1mM 2mM 1mM 1mM 2mM 5mM 2mM 12.76 21.40 54.75 11.65 7.97 25.63 4.00 10mM 50mM 5mM 10mM 100mM 10mM 100mM 5.55 3.17 6.72 10.96 2.37 22.31 2.47 Fig. 5. Drift of mV responses of four subsequent measurements of quininehydrochloride (1.0 mM in aqueous solution). sors with poor response in intra-day measurements showed evenhigher deviations in inter-day comparison. This leads to the conclusion that these deviations were causedby general changes affecting the analytical procedure. Furtherassumptions will be discussed in the robustness part. 3.1.6. Detection limit The most precise and convenient method for determinationof the detection limit was the approach based on visual eval-uation. This is due to several reasons. In general it could beseen that the detection limit [mM] varied between the differentapproaches (Table 7). For every sensor the detection limit for qui-nine hydrochloride was defined at a higher concentration valueusing approach ICH Q2 6.3.1. Using the signal-to-noise approachequivalent or slightly higher detection limits would be assessedcompared to the visual evaluation. Demineralized water servedas blank and the range of three subsequent measurements ofdemineralized water was considered as noise. Therefore in somecases the detection limit was shifted to higher concentration val-ues due to variation of sensor signals to demineralized water(Fig.6). Results from ICH Q2 method 6.3.2 were not suitable as theconcentration-sensor-response-curve did not cross the origin andtoo high detection limits resulted compared to visual evaluation.Compared to human taste sensation bitterness sensor 1 was ableto pass the calibration which is required by the European Pharma-copeia [22]. According to this calibration humans are only allowedtotake part in further taste panels if they are able to taste bitternessof aqueous quinine hydrochloride solutions at concentrations from0.009 to 0.015mM. The detection limit for bitterness sensor 1 wasfound to be 0.0025mM (Fig.7). 3.1.7. Quantitation limit As already found out for the detection limit, for the same reasonsapproaches based on the standard deviation of the response andthe slope were not suitable. Results were obtained by the visuallyperformed approach and the signal-to-noise approach (Table8). Table 7Detection limits for quinine hydrochloride identified by different approaches described in ICH guideline Q2. 10 Fig. 6. Identification of detection/quantitation limit withnoise; _ S/N 2:1;_._S/N 10:1 for bitter sensor 3. Fig. 7. Identification of detection/quantitation limit with noise; _S/N 2:1;_. _S/N 10:1 for bitter sensor 1 and comparison to required sensitivity for humantaste panel members according to European Pharmacopeia. Visually determined quantitation limits were congruent with thelower ends of linearity except for bitterness sensor 3 because ofmissing level of precision. Nevertheless it is to discuss whetherdetermination of content would be the aim of taste measurementsand how it could be performed in the best way. Considering theresults ofintermediate precision and robustness testing a quanti-tation could only be carried out having a contemporary calibration.Further investigations would be needed to determine precision ofquantitation measurements. 3.1.8. Robustness Results from determination of inter-day precision show that thetaste sensing system is susceptible to minor changes in analyticalconditions. As an example, measurement sequences of ascending Method (ICH Q2) Detection limit [mM] SB2ACO SB2ANO SB2C00 SB2AAE SB2CTO SB2CA0 SB2AE1 Bitterness 1 Bitterness 2 Bitterness 3 Umami Saltiness Sourness Astringency 6.1 Visual evaluation 0.0025 0.02 0.03 0.05 0.2 0.05 0.1 6.2 Signal-to-noise ratio 0.0025 0.02 0.1 0.1 0.2 0.1 0.2 6.3.1 Based on the SD of the blank 0.05 0.04 1.00 0.45 0.25 0.28 0.21 6.3.2 Based on the calibration curve 0.06 0.02 0.23 0.05 0.09 0.04 0.04 Method (ICHQ2) Quantitation limit [mM] SB2AC0 SB2ANO SB2C00 SB2AAE SB2CTO SB2CAO SB2AE1 Bitterness 1 Bitterness 2 Bitterness 3 Umami Saltiness Sourness Astringency 7.1 Visual evaluation 0.01 0.02 0.06 0.2 0.05 0.2 7.2 Signal-to-noise ratio 0.005 0.05 一 2.0 5.0 1.0 1.0 7.3.1 Basedon the SD of the blank 0.14 0.13 3.04 1.36 0.75 0.85 0.65 7.3.2 Based on the calibration curve 0.18 0.07 0.71 0.15 0.28 0.11 0.14 (a) 3 measurements within 6 months; (b) 3 measurements within 5 subsequent ◆ Bitterness 1 (22°℃)) ■Bitterness 2 (22℃)◇Bitterness 1 (28℃) 口Bitterness 2 (28℃) concentrations of quinine hydrochloride performed at differentconditions are shown in Fig. 8a and b. Differences in sensor out-put were found caused by variations in ambient temperature andage and history of sensors. Fig. 8a shows that higher mV valueswere obtained for lower concentrations compared to higher con-centrations shown in Fig. 8b. This can be explained by differences inambient temperature from22°Cto28°C. Furthermore smaller vari-ations between the sensor responses of measurements performedwithin five subsequent days at constant ambient temperature of22°C (Fig. 8b) can be seen in comparison to measurements con-ducted within six months (Fig.8a) showing that age and previouslyperformed measurements have an influence on the mV value. Evenif the cleaning procedure is sufficient, irreversible binding of sub-stances to the lipid membrane cannot be prevented and thereforethe age of the sensors as well as preliminary performed measure-ments play an important role. In terms of carryover validity of thecleaning procedure was established during operation qualificationby measurement of methylene blue solutions. Furthermore influ-ence of the sample order could be disregarded as the samples wererandomly attached to the sample table. Variation of pH was nottested as it is known that sensors react to ions present in the solu-tion.Therefore changes in pH would influence the sensor responses.According to these observations it is recommendable to alwayshave an external standard with known concentration and expectedsensor response. As the external standard should be investigated at the same timewithin the setup of the samples it should be exposed to the sameenvironment settings as the samples. Therefore it can be assuredthat those variations can be adjusted for. Furthermore a contemporary calibration should be conductedby investigation of certain concentrations of the single substancesclose to the concentration contained in the formulation in order toevaluate the results. 4. Conclusions This is the first systematic analytical approach reported qual-ifying a taste sensing system. ICH guideline Q2 on validation ofanalytical procedures served as background and items that werenot feasible were adapted to the measurement principle of an elec-tronic tongue. An approach for performance qualification followedthe ICH guideline was developed and can be used for qualifica-tion of other taste sensing systems in the future. The taste sensingsystem SA402B (Insent Inc., Atsugi-chi, Japan) was successfullyqualified and offers a new analytical approach for characterizationof pharmaceutical formulations. The low detection limit for qui-nine hydrochloride reveals comparability to human taste sensation.However, it is important to know, that the sensor response can beinfluenced by temperature and especially by previously performedmeasurements as well as age of the sensors. This can be handled by performing a contemporary calibration or using an external stan-dard. A method validation for formulations containing an activepharmaceutical ingredient and a system suitability test would bethe next steps to obtain a reliable method for taste assessment. Acknowledgements Our gratitude goes to Insent Inc., Atsugi-chi,Japan, and TecLabSEurope OHG, Germany for providing the taste sensing system andoffering technical support as well as scientific advice. References ( [1] L.M. Bartoshuk, Chem. Senses 25 (2000) 447-460. ) ( [2]J.Sjovall, A . Fogh, B. Huitfeldt, G. Karlsson, O. N ylen, Eur. J. Pediatr. 141 (1984) 243-247. ) 3| E.H. Davies, C. Tuleu,J. Pediatr. 153(2008)599-604.4日 ( | P. Ciosek, W. Wroblewski, Analys t 132 (2007)963-978. ) ( ] T . Ishizaka, Y. Miyanaga,J. Mukai, K. Asaka, Y. Nakai, E. Tsuji, T.Uc h ida, Chem. P harm. Bull. 52(2004)943-948. ) ( [6] A. Tanigake, Y. Miyanaga, T.Nakamura, E. Tsuji, K . Matsuyama, M. Kunitomo, T .Uchida, Chem. Pharm. Bull. 51 (2003)1241-1245. ) ( [7] R. Daniels, Pharm. Ind. 67 (2005)945-949. ) ( [8] R. Daniels, Pharm. Ind. 67 (2005) 1096-1 1 00. ) ( [9] ] 1 V.Anand, M . Kataria,V. Kukkar,V.Saharan, P.K. Choudhury,Drug Discov.Today 12(2007)257-265. ) ( [10] K . Toko , T. Matsuno, K. Yamafuji, K. Hayashi, H . Ikezaki, K.Sato, R. Toukubo, S . Kawarai, B iosens. Bioelectron. 9(1994)359-364. ) ( [ 11] K . T oko, T.M a tsuno, K. Ya m afuji, Int . J. I n tell. Syst. 12(1997)31 1 -322. ) ( [12] K.Toko, Electroanalysi s 10(1998)657-669. ) ( [ 1 3]K . Toko, Biosens. B ioelectron. 13 (1998)701-70 9 . ) ( [14] K . Toko, M. Habara, Chem. Senses 30 (Suppl.1)(2005)i256-i257. ) ( [15] A . L egin, A . R udnitskaya, D . C l apham, B. Seleznev, K. L or d , Y. Vla s ov, Ana l . B ioanal. Chem.380(2004)36-45. ) ( [ 1 6] S . Takagi, K . Toko, K . Wada, T . Ohki, J. Pharm. Sci. 90 ( 2001)2042-2048. ) ( [17]A . Y: Vlasov, A . Legin, Rudnitskaya, Anal. Bioanal. Chem. 373 (2002) 1 3 6-146. ) ( [ 1 8] J . Krause, Novel p ediatric f ormulations f o r t h e d r ug sodium ben z oate, Ph.D . t hesis, Heinrich-Heine-University, Duesseldorf, 2008. ) ( [19] P .C. Kayumba,N.Huyghebaert, C. Cordella, J.D. Ntawukuliryayo, C. Vervaet,J.P. R emon, Eu r . J. Pharm. Biopharm. 66(2007) 460-465. ) ( [20] C . Burgess, D.G. Jones, R.D. McDowall, Analyst 1 2 3 (1998)1879-1886. ) ( [21 I nternational C onference on H a rmonisation of Technical Requirements for Registration o f Pharmaceuticals for H u man Use (ICH), Q2 (R1) : Validation of Analytical Procedures: Text and Methodology. ) ( [22] E u ropean Pharmacopoeia, 6th ed.(6. 4 ),Strasbourg Cedex, Fra n ce, 2008, pp. 255-256, pp. 2800-2801. ) ( [23] J .G.Schindler,M.M. Schindler, Bioelektrochemische Membranelektroden, Wal- t er de Gruyter, Berlin , 1983 . ) ( [24] J .A. Plambeck, Electroanalytical C h emistry: Basic Principles and App l ications, Wiley-VCH,New York, 1 982. ) ( [25] R .F. Schmidt, Physiologie des Menschen, 30th ed. , Springer, Heidelberg, Ger- many,2007. ) [26] E. Mutschler, H.-G. Schaible, P. Vaupel, Anatomie, Physiologie, Pathophysiolo-gie des Menschen, 6th ed., Wissenschaftliche Verlagsgesellschaft, Stuttgart,Germany,2007. [27] World health organization, Guidelines for the treatment of malaria, Geneva,Switzerland2,006, http://apps.who.int/malaria/docs/TreatmentGuidelines2006.pdf. Katharina Woertz born in 1983 in Essen, Germany, has studied pharmacyat the Heinrich-Heine-University Duesseldorf. After graduating in 2006, shewent abroad for a six months research internship at the Department of Phar-maceutical Outcomes and Policy at the University of Florida (Gainesville) in2007. Since April 2008 she is doing her PhD at the Institute of Pharma-ceutics and Biopharmaceutics (Heinrich-Heine-University Duesseldorf) undersupervision of Prof. Joerg Breitkreutz. Her research work is focused on taste mask-ing of unpleasant tasting drugs and characterizing the same using electronictongues. ( Corinna Tissen studied pharmacy at the Heinrich-Heine-University Duesseldorf, Germany.(2002-2006). During her practical year, she worked at the Aesculap phar - m acy and the Paracelsus pharmacy in Viersen. After receiving her approbation as a pharmacist she started h er PhD-studies at the Institute of Pharmaceutics and Bio- pharmaceutics at the Heinrich-Heine-University. Cor i nna Tissen is wor k ing in theresearch group o f P rofessor Kleinebudde a nd her m a in research i n terest is taste m asking o f multi-unit solid dosage forms. ) Prof. Dr. Peter Kleinebudde studied Pharmacy at the Universities of Regensburgand Hamburg. He received his Ph.D. from the University Kiel in 1987. He then spentsome years at Glaxo GmbH, Germany,in Pharmaceutical Development and Bulk Pro-duction.Between 1991 and 1997 he worked as research scientist at the UniversityKiel and received the German 'Habilitation' about work on pellets. During a stay atthe Royal Danish School of Pharmacy he was appointed as associate professor at theUniversity Halle-Wittenberg in 1998. In 2003 he was nominated as full professor atthe Heinrich-Heine-University Duesseldorf. ( J org Breitkreutz studied Pharmacy from 1987 to 199 1 at the University of Munster, Germany. He finished his PhD in 1996 at the Institute for Pharmaceutical Technology a nd Biopharmaceutics in Miinster under supervision of Prof. Groning. From 1 9 96 to 1 997 he j oined Thiemann Arzneimittel GmbH in Waltrop, Germany, as the head of P roduct Coordination. From 1997 to 2004 he worked on his habilitation on paediatric d rug formulations. In 2 004 he b e came professor for ph a rmaceutical technology at the Heinrich-Heine-University in D i isseldorf, Germany. Since 2009 he is head ofthe Pharmacy department. His research focuses o n paediatric drug f o rmulations a n d p rocess a nalytical technologies. )
确定
还剩8页未读,是否继续阅读?

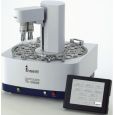
北京盈盛恒泰科技有限责任公司为您提供《中药中有效成分含量分析检测方案 》,该方案主要用于中药制剂中其他检测,参考标准--,《中药中有效成分含量分析检测方案 》用到的仪器有电子舌
推荐专场
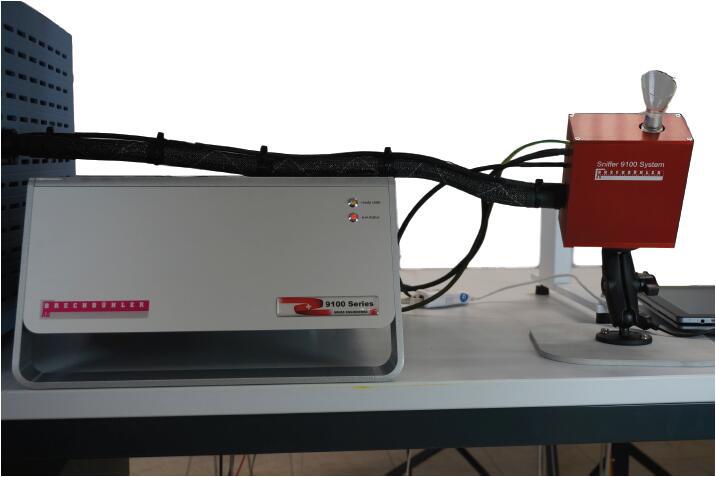
感官智能分析系统(电子鼻/电子舌)
相关方案
更多
该厂商其他方案
更多