


方案详情
文
If exposed to bulk water flow, fish lateral line afferents respond only to flow fluctuations (AC) and not to the steady (DC) component of the
flow. Consequently, a single lateral line afferent can encode neither bulk flow direction nor velocity. It is possible, however, for a fish to
obtain bulk flow information using multiple afferents that respond only to flow fluctuations. We show by means of particle image
velocimetry that, if a flow contains fluctuations, these fluctuations propagate with the flow.Across-correlation of water motion measured
at an upstream point with that at a downstream point can then provide information about flow velocity and flow direction. In this study,
we recorded from pairs of primary lateral line afferents while a fish was exposed to either bulk water flow, or to the water motion caused
by a moving object.Weconfirm that lateral line afferents responded to the flow fluctuations and not to theDCcomponent of the flow, and
that responses of many fiber pairs were highly correlated, if they were time-shifted to correct for gross flow velocity and gross flow
direction. To prove that a cross-correlation mechanism can be used to retrieve the information about gross flow velocity and direction, we
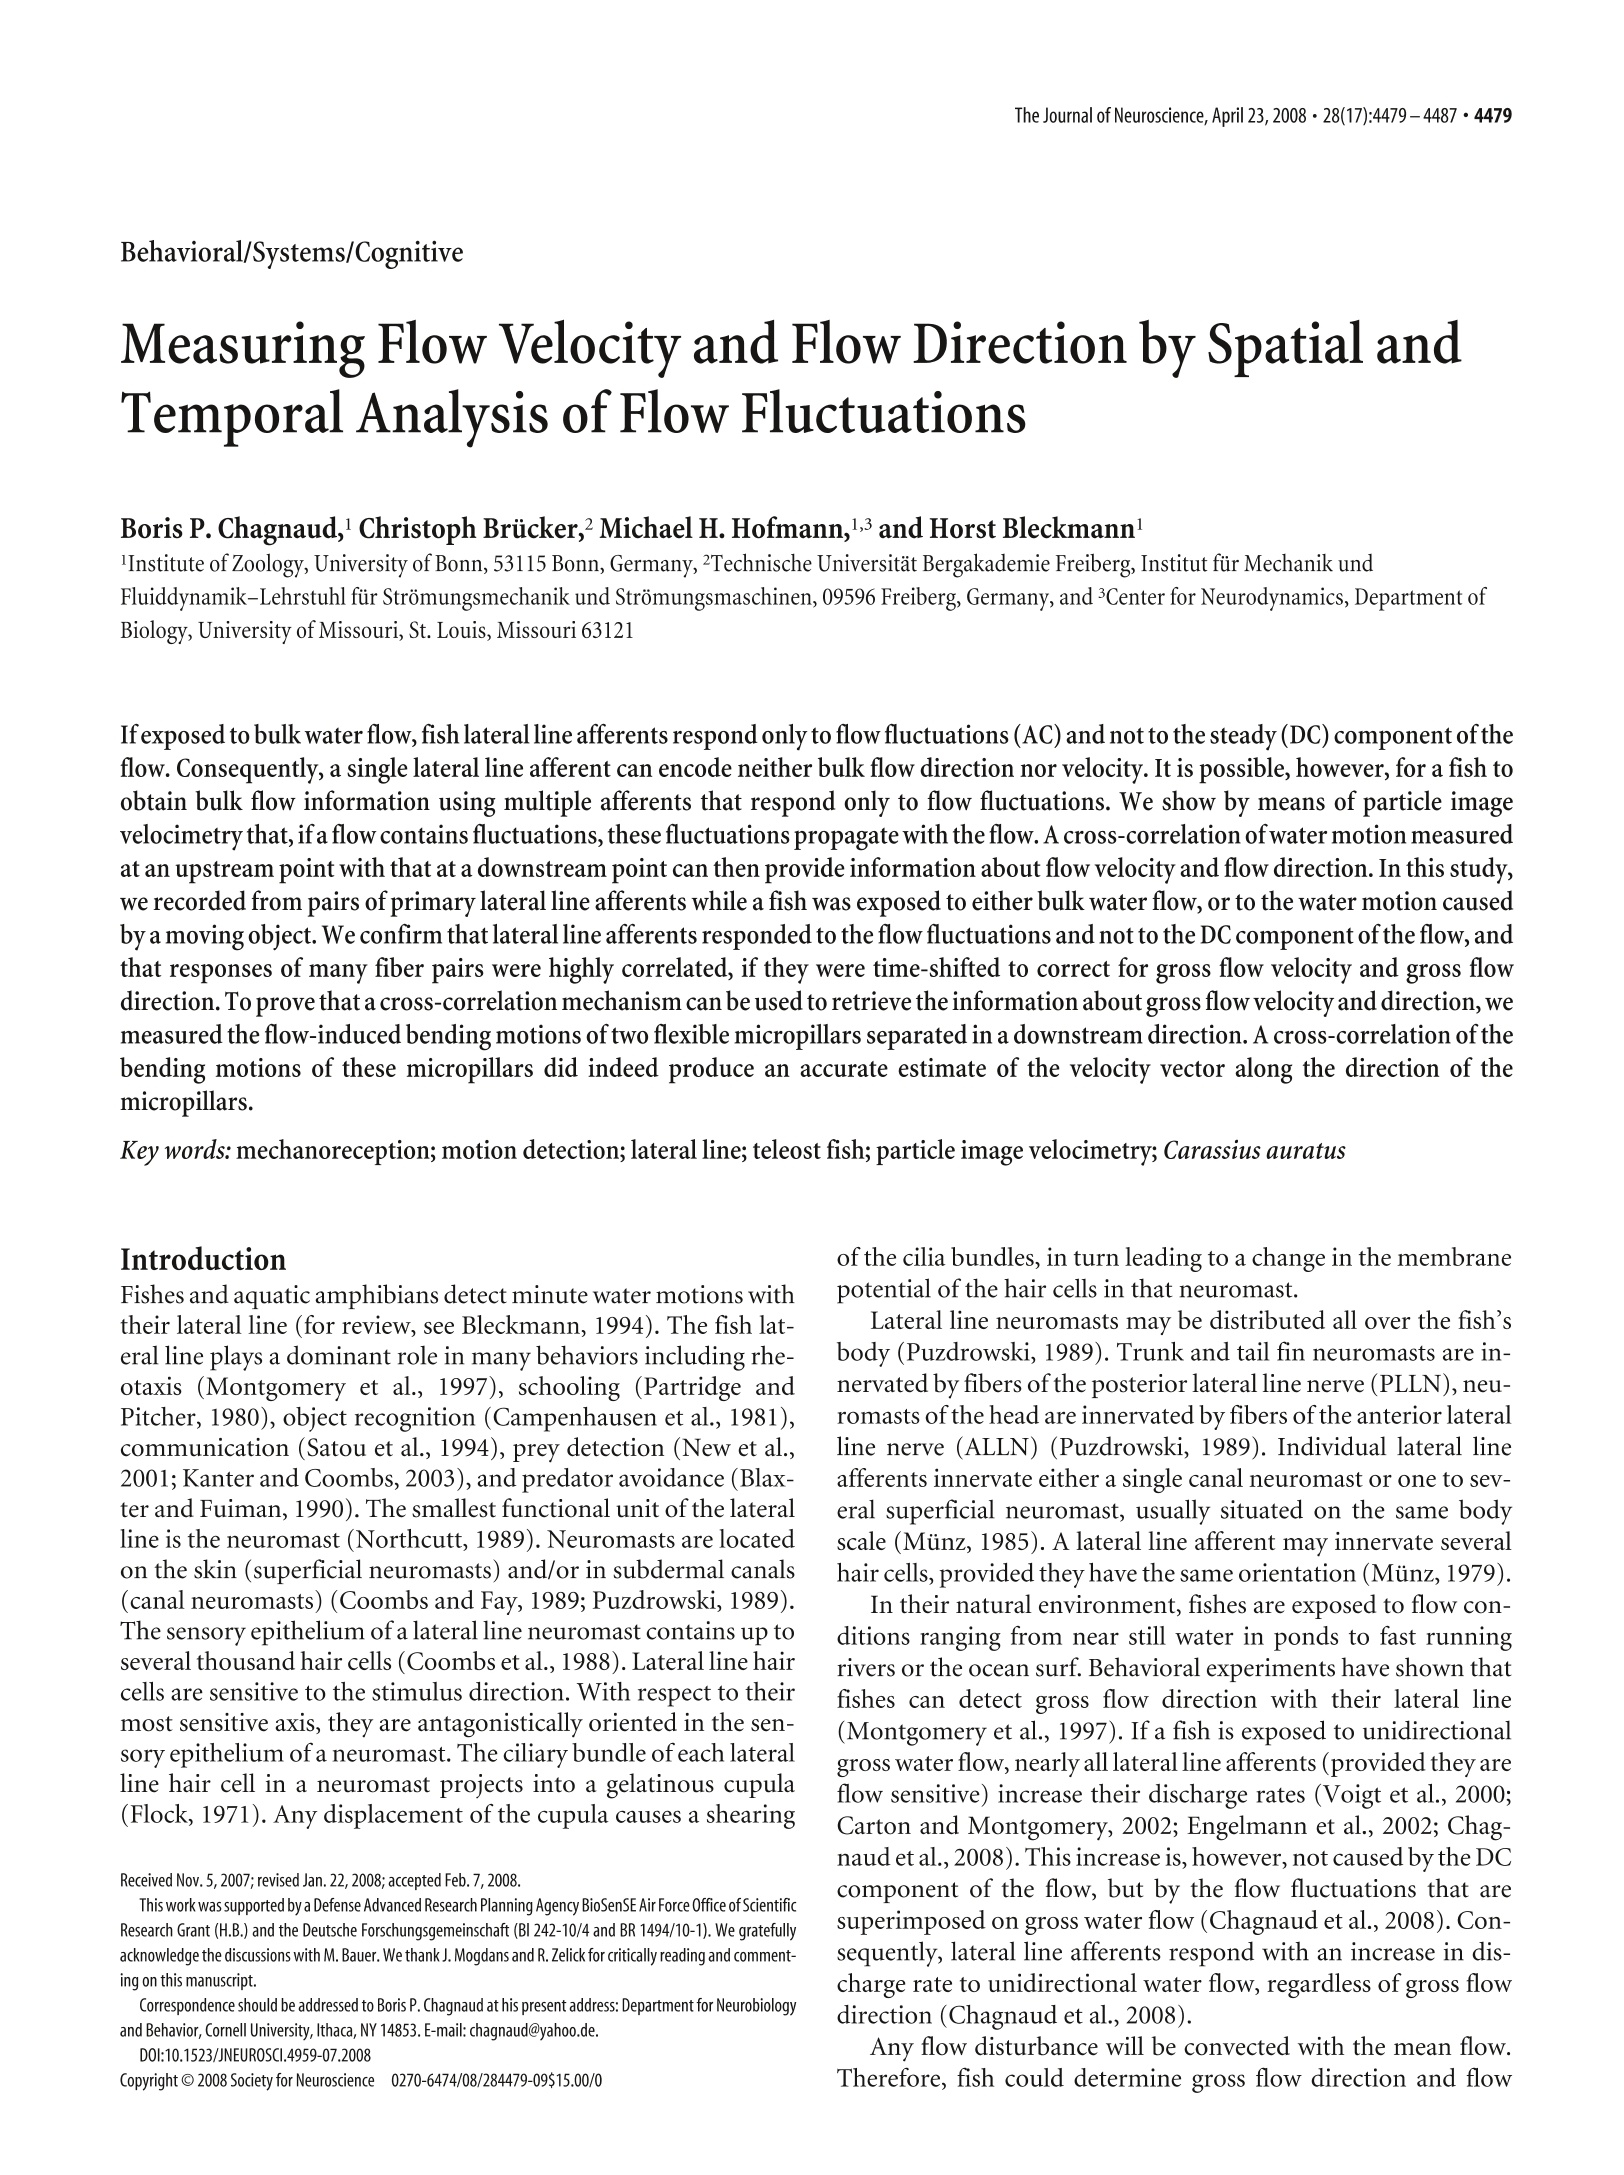
measured the flow-induced bending motions of two flexible micropillars separated in a downstream direction. A cross-correlation of the
bending motions of these micropillars did indeed produce an accurate estimate of the velocity vector along the direction of the
micropillars.
方案详情

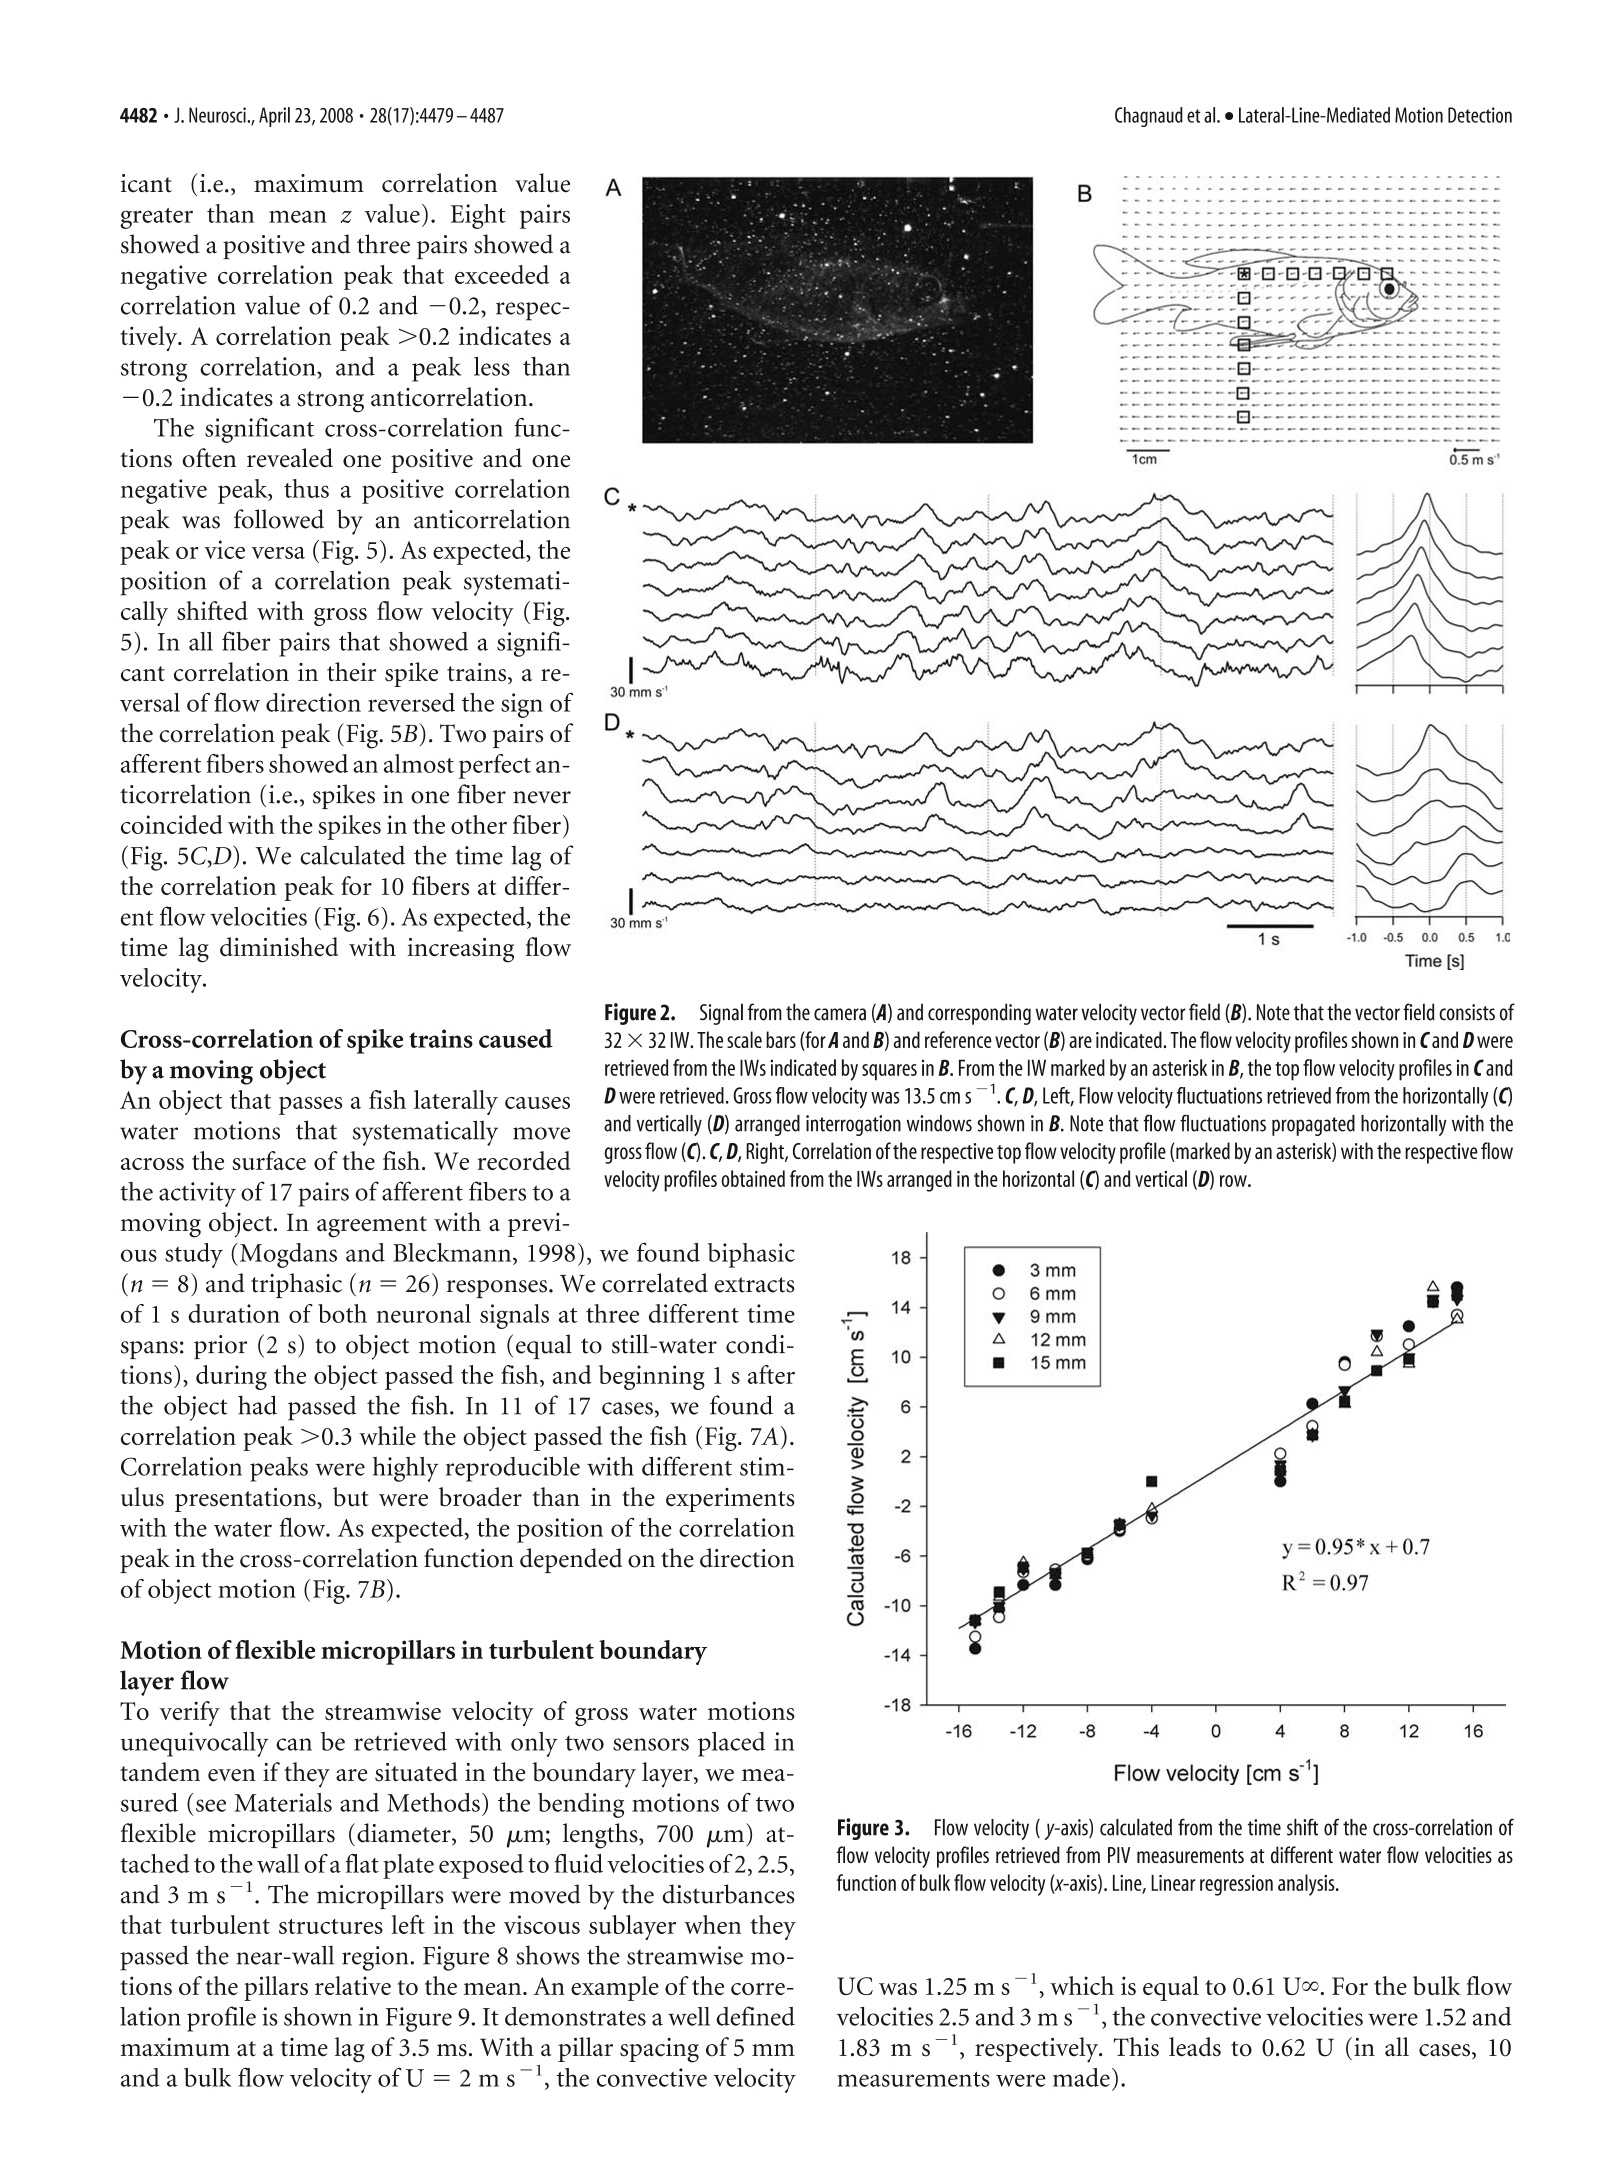
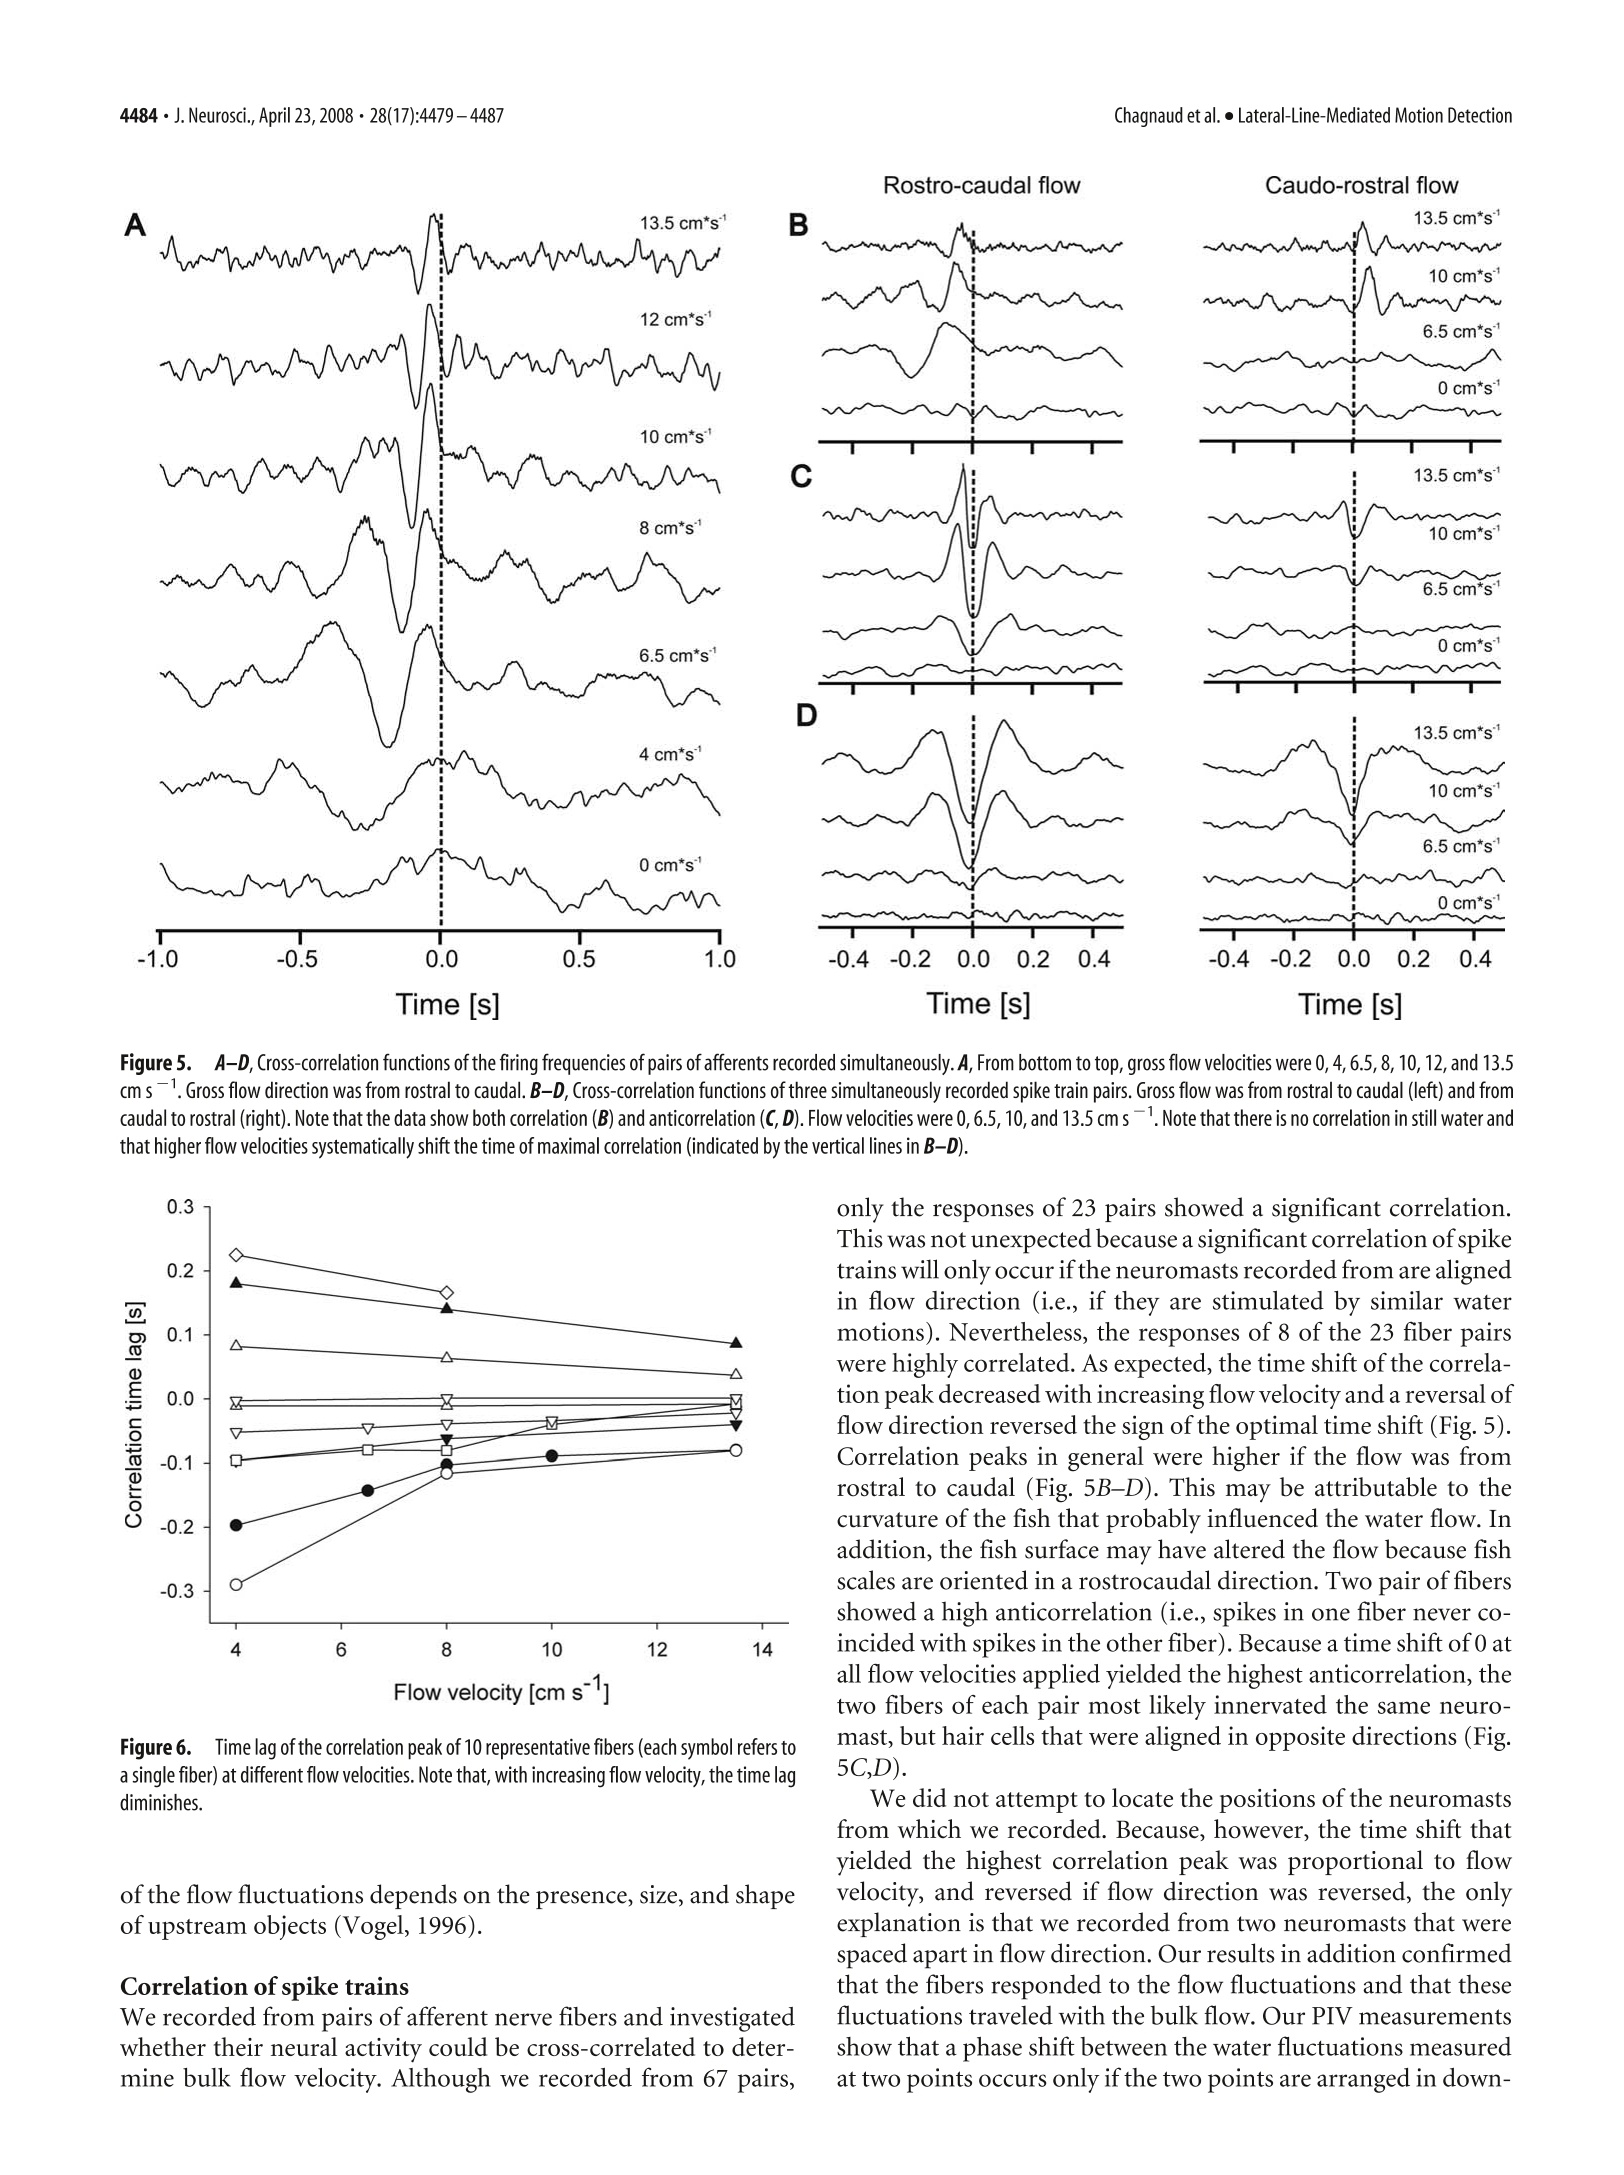
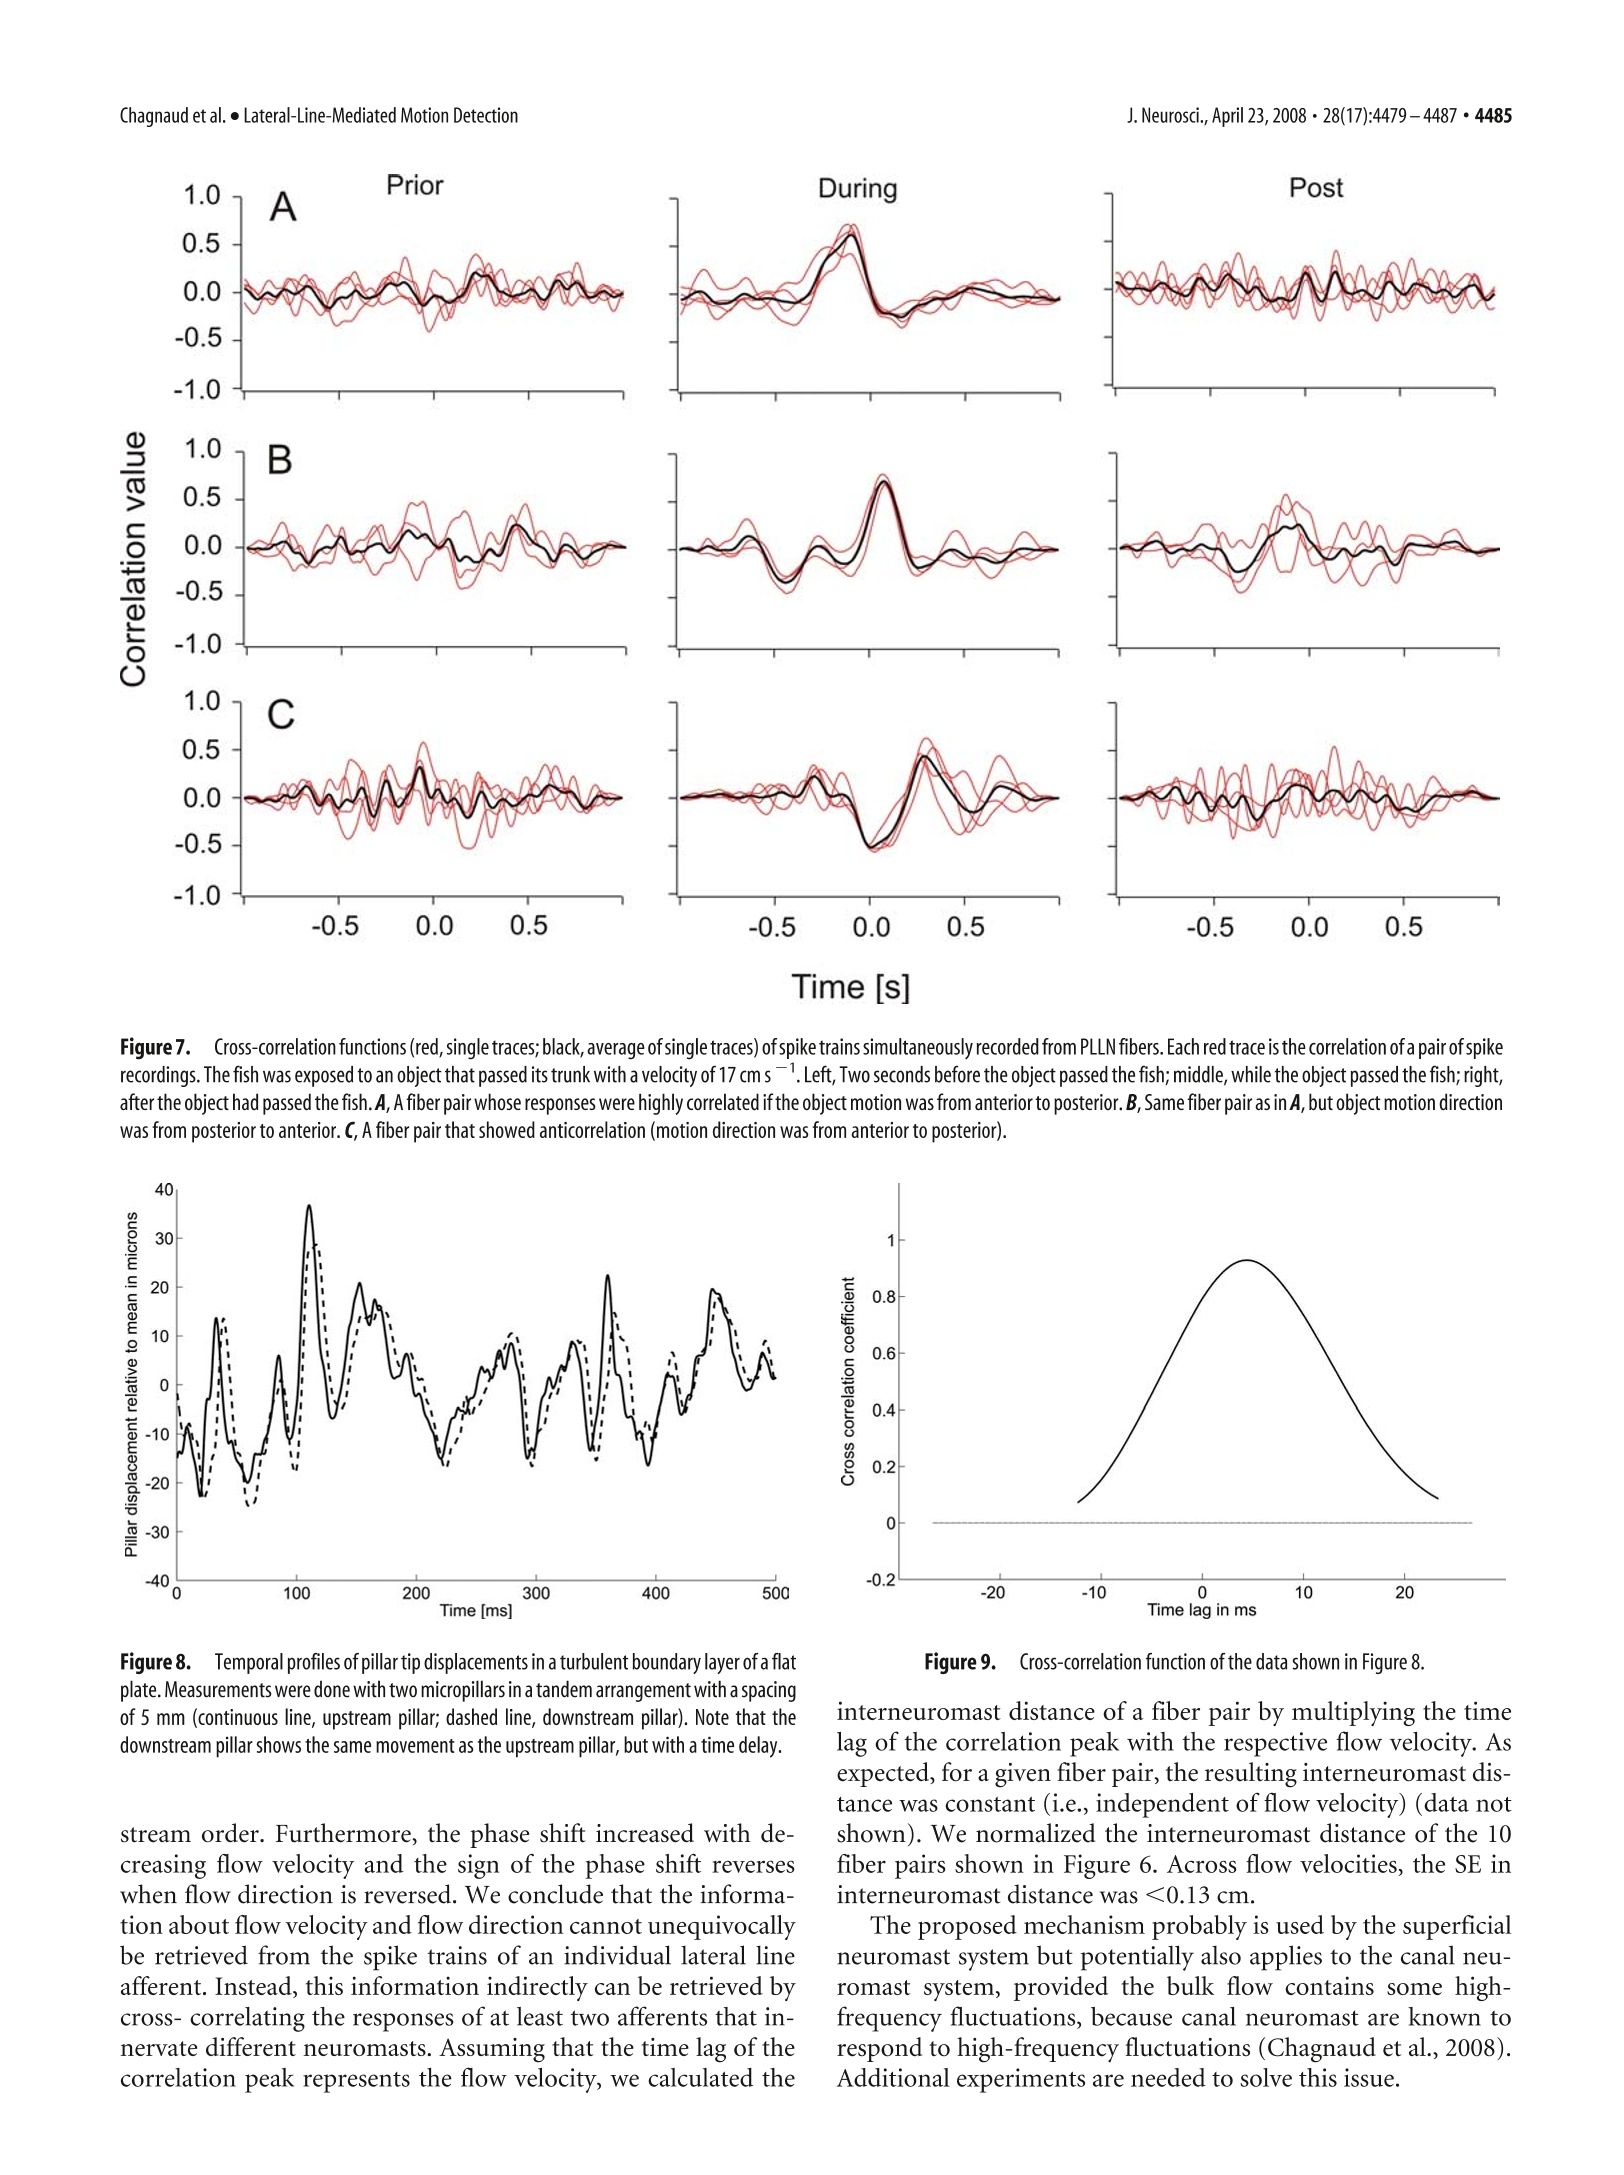
The Journal of Neuroscience, April 23,2008·28(17):4479-4487·4479Behavioral/Systems/Cognitive 4480· J. Neurosci., April 23, 2008·28(17):4479-4487Chagnaud et al.·Lateral-Line-Mediated Motion Detection Measuring Flow Velocity and Flow Direction by Spatial andTemporal Analysis of Flow Fluctuations Boris P. Chagnaud, Christoph Bruicker,Michael H. Hofmann,1,3and Horst Bleckmann lInstitute of Zoology, University of Bonn,53115 Bonn, Germany,2Technische Universitat Bergakademie Freiberg, Institut fur Mechanik und Fluiddynamik-Lehrstuhl fur Stromungsmechanik und Stromungsmaschinen, 09596 Freiberg, Germany, and 3Center for Neurodynamics, Department ofBiology, University of Missouri, St. Louis, Missouri 63121 Ifexposedto bulk water flow, fish lateral line afferents respond only to flow fluctuations (AC) and not to the steady (DC) component oftheflow. Consequently, a single lateral line afferent can encode neither bulk flow direction nor velocity. It is possible, however, for a fish toobtain bulk flow information using multiple afferents that respond only to flow fluctuations. We show by means of particle imagevelocimetry that, ifa flow contains fluctuations, these fluctuations propagate with the flow. A cross-correlation ofwater motion measuredat an upstream point with that at a downstream point can then provide information about flow velocity and flow direction. In this study,we recorded from pairs of primary lateral line afferents while a fish was exposed to either bulk water flow, or to the water motion causedby a moving object. We confirm that lateral line afferents responded to the flow fluctuations and not to the DC component ofthe flow, andthat responses of many fiber pairs were highly correlated, if they were time-shifted to correct for gross flow velocity and gross flowdirection. To prove that a cross-correlation mechanism can be used to retrieve the information about gross flow velocity and direction, wemeasured the flow-induced bending motions of two flexible micropillars separated in a downstream direction. A cross-correlation ofthebending motions of these micropillars did indeed produce an accurate estimate of the velocity vector along the direction of themicropillars. Key words: mechanoreception; motion detection; lateral line; teleost fish; particle image velocimetry; Carassius auratus Introduction Fishes and aquatic amphibians detect minute water motions withtheir lateral line (for review, see Bleckmann, 1994). The fish lat-eral line plays a dominant role in many behaviors including rhe-otaxis (Montgomery et al, 1997), schooling (Partridge andPitcher, 1980), object recognition (Campenhausen et al., 1981),communication (Satou et al., 1994), prey detection (New et al.,2001; Kanter and Coombs, 2003), and predator avoidance (Blax-ter and Fuiman,1990). The smallest functional unit of the lateralline is the neuromast (Northcutt,1989). Neuromasts are locatedon the skin (superficial neuromasts) and/or in subdermal canals(canal neuromasts) (Coombs and Fay, 1989; Puzdrowski, 1989).The sensory epithelium of a lateral line neuromast contains up toseveral thousand hair cells (Coombs et al., 1988). Lateral line haircells are sensitive to the stimulus direction. With respect to theirmost sensitive axis, they are antagonistically oriented in the sen-sory epithelium of a neuromast. The ciliary bundle of each lateralline hair cell in a neuromast projects into a gelatinous cupula(Flock,1971). Any displacement of the cupula causes a shearing ( R eceived N o v. 5 , 2007; re v ised Jan. 22,20 0 8; accepted Feb . 7,2008. ) ( T his work was supported by a Defense Advanced Research Plann i ng Agency BioSenSE Air Force Office of Scientific R esearch Grant (H.B . ) a nd the D eutsche F o rschungsgemeinschaft (BI 242-10/4 and BR 1494/10-1). We g r ate f ully a cknowledge the discussions w i th M. B a uer. We thank J. Mogdans an d R. Z e lick for critically reading and comment- i ng o n this manuscript. ) ( C orrespondence should be addressed to Boris P. C hagnaud at h i s pre s ent address: Department for Neurobiology a nd B e havior, C o rnell University, I thaca, NY 14853. E-mail: chagnaud@yahoo.de. ) ( DOI:10.1523/JNEUROSCI.4959-07.2008 ) ( C opyrightO 2008 Society for Neuroscience e 0 2 70-6474/08/284479-09$15.00/0 ) of the cilia bundles, in turn leading to a change in the membranepotential of the hair cells in that neuromast. Lateral line neuromasts may be distributed all over the fish’sbody (Puzdrowski, 1989). Trunk and tail fin neuromasts are in-nervated by fibers of the posterior lateral line nerve (PLLN),neu-romasts of the head are innervated by fibers of the anterior lateralline nerve (ALLN) (Puzdrowski, 1989). Individual lateral lineafferents innervate either a single canal neuromast or one to sev-eral superficial neuromast, usually situated on the same bodyscale (Munz, 1985). A lateral line afferent may innervate severalhair cells,provided they have the same orientation (Miinz, 1979). In their natural environment, fishes are exposed to flow con-ditions ranging from near still water in ponds to fast runningrivers or the ocean surf. Behavioral experiments have shown thatfishes can detect gross flow direction with their lateral line(Montgomery et al., 1997). If a fish is exposed to unidirectionalgross water flow, nearly all lateral line afferents (provided they areflow sensitive) increase their discharge rates (Voigt et al., 2000;Carton and Montgomery,2002; Engelmann et al., 2002; Chag-naudet al.,2008). This increase is, however, not caused by the DCcomponent of the flow, but by the flow fluctuations that aresuperimposed on gross water flow (Chagnaud et al.,2008). Con-sequently, lateral line afferents respond with an increase in dis-charge rate to unidirectional water flow, regardless of gross flowdirection (Chagnaud et al., 2008). Any flow disturbance will be convected with the mean flow.Therefore, fish could determine gross flow direction and flow velocity by monitoring the direction and velocity of individualflow disturbances while they move across its body surface. Here,we show that spike trains, recorded simultaneously from pairs offlow-sensitive lateral line afferents, are often correlated and thatthe correlation depends on flow velocity and flow direction. Thissuggests that fish might use a cross-correlation mechanism (co-incidence detector) to determine gross flow velocity and grossflow direction. To verify that such a mechanism is plausible whenhydrodynamic sensors must operate in a boundary layer (i.e.,very close to the skin surface) flexible micropillars were used asnear-wall flow sensors (cf. Brucker et al.,2005,2007). A cross-correlation of the bending motions of these pillars did indeedproduce an accurate estimate of the velocity vector along thedirection of the neuromasts (micropillars). The micropillar dataalso show that this principle can even be used in turbulentboundary layer flows because the typical near-wall structures areconvected in the near-wall region with a velocity of 0.6 Umean· Materials and Methods Experimental animals. Data were collected from 14 goldfish, ranging inlength from 8 to 13 cm. Fish were acquired from commercial dealers andwere maintained in 250 L aquaria at an ambient room temperature on adaily 10-14hlight/dark cycle. Before surgery, fish were anesthetized withMS-222 (0.001%) and immobilized with 1-2 ul of pancuronium bro-mide (Organon Teknika, Durham,NC). During surgery, animals wereventilated with fresh water. To prevent drying of the skin, fish werecontinuously rinsed with fresh water. A small piece of skin was removed,and the PLLN was exposed at its entry to the medulla by drilling a holeinto the skull. After surgery, fish were positioned in a stainless-steelholder that consisted of a mouthpiece for artificial ventilation with freshwater and two screws, which kept the head in a fixed position. A cord,attached to the tail of the fish, prevented lateral movements of the fish’strunk and tail. Fish were positioned such that the water could not enterthe brain cavity. To avoid inactivation of the lateral line receptors byMS-222 (Spath and Schweickert, 1977; Palmer and Mensinger, 2004),recordings were not begun until 1 h after preparation. Depending on thestimuli applied, fish and holder were either transferred to a flow tank orto an experimental aquarium (see below). The experiments reported on in this study comply with the currentanimalprotection lawof theFederalRepublic of Germany(Tierschutzgesetz). Generation of unidirectional water flow. The experiments involvingunidirectional water flow were conducted in a flow tank (canal width, 15cm; water depth, 16 cm) that rested on a vibration-isolated table (TMC,Peabody,MA). Water flow was generated with a propeller (diameter, 8cm;Aeronaut) coupled to a DC motor (Conrad Electronic, Berlin, Ger-many) that was driven by a power supply (Voltcraft Digi35; ConradElectronic). The propeller was suspended from a holder on the side of thetank that was opposite to the recording section. The tank contained oneupstream and one downstream flow collimator. Fish were oriented withtheir heads toward the flow and were exposed to different flow velocitiesranging from 0 to 15 cm s. In some experiments, flow direction wasreversed. Flow velocity was calibrated with a flow meter (Ott; Z 200)placed at the position of the fish. Flow measurements lasted for 60 s andwere not begun before the water flow reached its desired velocity. Moving object stimulus. A rectangular Plexiglas object (1.2× 1.2 ×8cm) oriented with its long axis vertically was moved on a circular orbit(radius,13.5 cm) along the side of the fish. The object was mounted ontothe edge ofa disc, which was positioned on the bottom of the experimen-tal tank. Thus, the object protruded upright from below the animalacross most of its dorsoventral extent but did not penetrate the watersurface. The disc was turned under water by driving its center axis (30mm diameter Plexiglas cylinder at a distance of 14.5 cm from the fish)with a DC motor from above the water surface.Standard object velocitywas 17 cm s-. The fish was positioned just outside the orbit, tangentialto its perimeter [cf. Muller et al. (1996), their Fig. 1]. The position of thefish relative to the orbit of the moving object was such that a minimum lateral distance between object and fish (=3 cm) was reached1 cm be-hind the operculum. Because of the circular orbit of the moving object,the lateral distance between object and fish was not constant along theentire length of the fish. To reduce water surface waves, a 100-mm-widePlexiglas plate was placed on the water surface between fish and disc axis.The DC voltage that determined motor speed and thus object speed wascontrolled by a custom-built device (P. Maier, Electronic Shop, Univer-sity of Bielefeld, Bielefeld, Germany) and monitored on an oscilloscope(DL 1300 A; Yokogawa, Tokyo, Japan). Onset of object motion wastriggered with a 5 V pulse delivered from a pulse generator (model 146;Wavetek, San Diego, CA) to the motor control. During an experiment,the object was moved along the side of the fish and around the perimeterof the circular orbit. One such movement was defined as one stimuluspresentation. Object motion was stopped by turning off the voltage to themotor. Data acquisition. Neural activity of PLLN fibers was recorded withglass micropipettes filled with 3 M KCl (impedance, 50-90 MQ). Elec-trodes were placed on the nerve and advanced with motorized micro-drives (Nanostepper MPC; Science Products Trading). Action potentialswere amplified (VF 180;Bio-Logic, Claix, France),low-pass filtered (cut-off frequency, 1 or 10 kHz), displayed on an oscilloscope (YokogawaDL-1800 A), and stored on-line (Superscope II). Neural activity wasmonitored with a loudspeaker (audio monitor). Experimental protocol. All fibers were tested for their responses to wa-ter movements created by moving a handheld pipette through the tank(aquarium), or to small water jets that were generated by the pipette anddirected to the skin of the fish. Fibers that did not respond to these watermotions were assumed to be efferent fibers or to innervate damagedneuromasts and were therefore excluded from additional investigations.Ongoing activity of afferent fibers was recorded for 60 s. We did notattempt to determine the positions of the neuromasts from which werecorded because of the limited recording time. Because many units werelost before the entire experimental protocol could be completed, thesample size for different stimulus conditions may vary. Data analysis. We determined the instantaneous frequency of eachafferent fiber by calculating the reciprocals of inter spike time intervals.Because afferent lateral line nerve fibers differed in their spontaneousactivity, we calculated the relative instantaneous firing frequency (IF) byalways subtracting the mean firing frequency of each fiber over the entirerecording time. Instantaneous frequency values were smoothed (Gauss-ian smooth function, factor 2; see IGOR reference manual) and the re-sponses (IFs) of two simultaneously recorded fibers were cross- corre-lated using IGOR 4.0 (Wavemetrics, Lake Oswego, OR). The resultingcorrelation function was normalized to values between l and -1. Foreach of the two simultaneously recorded spike trains, we also shuffled thesequence of intervals such that the sequence of all intervals was random-ized, thus destroying any temporal relationships between intervals. Wethen correlated the instantaneous frequencies of the shuffled spike trainsas described above. The correlation of the shuffled data were used asbaseline correlation. We calculated the z score of the correlation. We useda z score of 5.61 to determine whether the correlation exceeds a signifi-cance value of p<0.001. Under flow conditions, the spike train pairs recorded simultaneouslyfor 60 s were cross- correlated. If the lateral line was stimulated with amoving object under still-water condition, the response sequences usedfor the cross-correlation had durations of 1 s. We correlated the neuronalactivity recorded before object motion (control), while the object passedthe fish (while the two fibers showed marked responses to the watermotions caused by the moving object), and 1 s after the object had passedthe fish. The stimulus was presented three to four times. The values reported herein are, if not otherwise stated, mean ± SD. Nis the number of animals, and n is the number of fibers. Particle image velocimetry. A high-speed particle image velocimetry(PIV) system (Highspeedstar 4; LaVision, Goettingen, Germany) wasused to visualize and quantify water motions.Neutrally buoyant particles(Sphericel 110P8; LaVision), suspended in the water, were illuminatedwith a light plane (<1mm) that was generated with a laser. The lightplane was oriented parallel to the rostrocaudal axis ofthe fish at a distanceof~1.5 mm from the fish's surface. Measurements were performed with Figure 1.TTop view of a sensor with the pair of flexible micropillars spaced 5 mm apart inmean flow direction. Pillars had a length of ~500 um. a fish placed in the flow tank. Individual pictures were taken at a framerate of 250 Hz (i.e., the temporal resolution of the PIV was 4 ms). Recon-struction of the vector plots was performed with Davis 7 (LaVision)software. Successive frames were analyzed by time series sequential cross-correlation with an interrogation window size of 256 × 256 pixel (16 ×16 vectors). To improve the spatial resolution, an overlap of 50% be-tween neighboring interrogation windows was applied which resulted ina final map of 32 × 32 vectors. Application of a multipass filter furtherreduced the error of the calculated vectors. This filter executed iterative(n=2) evaluations of the same pair of images. In the first pass, a vectorwas computed and used as a reference for the following pass. In thesecond pass, the interrogation window of the first frame was shifted byone-half the amount of the reference vector and in the opposite direc-tion, whereas the interrogation window of the second frame was shiftedin the direction of the reference vector by one-half of the amount of thereference vector.Thus, the correlation in the second pass anticipates themain motion direction ofthe particles and adjusts the interrogation areasuch that the maximum number of particles is included. This enhancesthe precision of the PIV. Finally, a median filter was used to compute themedian vector for eight neighboring interrogation windows. Ifthe centervector (surrounded by the eight neighbors) differed from the medianvector by more than three times the root mean square, the center vectorwas replaced by the mean vector. After the vector computation, the vec-tor plots were postprocessed using the same median filter and smoothingas during the computation of the vector plots. Flexible micropillars. To verify the conclusions drawn from our elec-trophysiological experiments, we monitored the tip movements of twomicropillars in tandem arrangement (spaced 5 mm apart) that were ex-posed to turbulent fluid flow. The flexible micropillars bend in the flowbecause of the viscous drag forces (cf. Brucker et al., 2005, 2007). Themicropillars had a uniform circular cross-section with a planar base andtip (Fig. 1).Micropillars were fabricated according the method describedby Schmitz et al. (2005). In all experiments, pillars with a diameter of 50um and lengths of 500 um were used. The PDMS (poly-dimethyl-siloxane) had a density of p=1050 kg m-and a Young's modulus ofE=2.2×10°Nmafter being cured. The natural frequency, ω, of themicropillars in vacuum was 1020 Hz. The measurements were performedin a flat plate turbulent boundary layer flow at Re=3.5-5.0×10. Theviscous sublayer thickness was in the range of 400-500 um. A pair ofpillars was placed in tandem at the wall within the viscous sublayer instreamwise direction, and pillar movements were recorded with a high-speed camera (3000 frames per second; APX-RS; Photron, San Diego,CA) equipped with a lens of magnification M= 3. Standard image pro-cessing routines were used to detect the pillar tip with high resolution. Results Spatial analysis of water flow In a previous study, we found that flow fluctuations were themain cause for the increase in discharge rate and the irregulartemporal discharge patterns of primary lateral line afferents ex-posed to running water (Chagnaud et al., 2008). Although we quantified the flow with high-speed PIV, the spatiotemporalcharacteristics of the flow remained elusive. The spatial structuresof the flow fluctuations were investigated by comparing the indi-vidual flow profiles in an array of 32 ×32 interrogation windows(IWs) in the PIV plane. For each IW (size,~3× 3 mm), flowvelocity was calculated for a period of 8 s [Chagnaud et al. (2008),their Fig. 9]. Because we were only interested in the flow fluctu-ations, the mean flow velocity was subtracted from each vector.Figure 2 shows the flow velocity profiles obtained from seven IWsspaced 6 mm apart in a horizontal (Fig. 2C) and in a vertical row(Fig. 2D). We cross-correlated the velocity profile of the IWmarked by an asterisk in Figure 2 B with each velocity profile ofsix IWs spaced either horizontally or vertically. At larger dis-tances, flow fluctuations were uncorrelated vertically, but stillcorrelated horizontally (i.e., in flow direction) with a timeshift that was proportional to the distance between the IWscompared (Fig. 2C,D,right). Thus, flow fluctuations propa-gated with the flow (i.e., they were highly correlated in thedirection of the flow). The time shift of the correlation not only should depend onthe distance between the IWs but also on flow velocity. To verifythis, we determined whether the time shifts of the highest corre-lation values for pairs of IWs separated by 3, 6, 9, 12, and 15 mmsystematically shifted with flow velocity. We than calculated thegross flow velocity by using the correlation peak time shift and thedistance between the IWs investigated. The calculated velocitywas then plotted against the velocity obtained from the PIV data(Fig. 3). A linear regression analysis revealed a high correlation(y=0.95×x +0.7; R²= 0.97). Absolute flow velocities andflow direction could be retrieved only if both the distance be-tween the IWs and the time shift necessary to get the maximalcorrelation value was known. Physiology Single-unit recordings were made from 116 fibers of the right(ipsilateral) PLLN of goldfish (N= 10). Most fibers (104 of the116) responded to hydrodynamic stimuli (see Materials andMethods), judged by listening to the audio monitor and/or byviewing discharge patterns. The remaining 12 fibers did not re-spond to hydrodynamic stimuli and thus were not further inves-tigated. In still water, the average ongoing activity of the respon-sive fibers was 19.1 ±15.3 spikes s(median, 15.3 spikes s;n= 104). Ongoing activities were unimodal but not normallydistributed (Shapiro-Wilk's test, p<0.001). Cross-correlation of simultaneously recorded pairs ofspike trains We recorded the activity of 67 pairs of afferent lateral line fibers,while stimulating the animals with unidirectional water flow(0-15 cms). Most fibers (n =91) responded with an increasein discharge rate (Wilcoxon’s test, p<0.05) ifexposed to unidi-rectional gross water flow. In all but 13 fibers (Wilcoxon’s test,p> 0.05), neural responses increased with increasing flowvelocity. To find out whether the gross flow velocity could be retrievedfrom the neuronal data, the relative IFs (see Materials and Meth-ods) of pairs of spike trains that were recorded simultaneouslywere cross-correlated (Fig. 4). Under still-water conditions (n=61 pairs), three pairs of fibers exceeded the significance valuecalculated by the zvalue (Table 1). Under flow conditions (10 cmS; n= 67), most spike train pairs (n = 44 of 67) showed amaximum correlation value less than the mean z value.Twenty-three spike train pairs showed a correlation peak that was signif- icant (i.e., maximum correlation valuegreater than mean z value). Eight pairsshowed a positive and three pairs showed anegative correlation peak that exceeded acorrelation value of 0.2 and -0.2,respec-tively. A correlation peak >0.2 indicates astrong correlation, and a peak less than-0.2 indicates a strong anticorrelation. The significant cross-correlation func-tions often revealed one positive and onenegative peak, thus a positive correlationpeak was followed by an anticorrelationpeak or vice versa (Fig.5). As expected, theposition of a correlation peak systemati-cally shifted with gross flow velocity (Fig.5). In all fiber pairs that showed a signifi-cant correlation in their spike trains, a re-versal of flow direction reversed the sign ofthe correlation peak (Fig.5B). Two pairs ofafferent fibers showed an almost perfect an-ticorrelation (i.e., spikes in one fiber nevercoincided with the spikes in the other fiber)(Fig.5C,D). We calculated the time lag ofthe correlation peak for 10 fibers at differ-ent flow velocities (Fig.6). As expected, thetime lag diminished with increasing flowvelocity. Cross-correlation of spike trains causedby a moving object An object that passes a fish laterally causeswater motions that systematically moveacross the surface of the fish. We recordedthe activity of 17 pairs of afferent fibers to amoving object. In agreement with a previ- 1cm 0.5m s C Figure 2. Signal from the camera (A) and corresponding water velocity vector field (B). Note that the vector field consists of32×32 IW. The scale bars (for A and B) and reference vector (B) are indicated. The flow velocity profiles shown in Cand D wereretrieved from the lWs indicated by squares in B. From the lW marked by an asterisk in B, the top flow velocity profiles in CandD were retrieved. Gross flow velocity was 13.5 cm s.C, D, Left, Flow velocity fluctuations retrieved from the horizontally (C)and vertically (D) arranged interrogation windows shown in B. Note that flow fluctuations propagated horizontally with thegross flow (C). C, D,Right, Correlation of the respective top flow velocity profile (marked by an asterisk) with the respective flowvelocity profiles obtained from the lWs arranged in the horizontal (C) and vertical (D) row. ous study (Mogdans and Bleckmann, 1998), we found biphasic (n = 8) and triphasic (n=26) responses. We correlated extractsof 1 s duration of both neuronal signals at three different timespans: prior (2 s) to object motion (equal to still-water condi-tions), during the object passed the fish, and beginning 1 s afterthe object had passed the fish. In 11 of 17 cases, we found acorrelation peak >0.3 while the object passed the fish (Fig. 7A).Correlation peaks were highly reproducible with different stim-ulus presentations, but were broader than in the experimentswith the water flow. As expected, the position of the correlationpeak in the cross-correlation function depended on the directionof object motion (Fig. 7B). Motion of flexible micropillars in turbulent boundarylayer flow To verify that the streamwise velocity of gross water motionsunequivocally can be retrieved with only two sensors placed intandem even if they are situated in the boundary layer, we mea-sured (see Materials and Methods) the bending motions of twoflexible micropillars (diameter, 50 um; lengths, 700 um) at-tached to the wall of a flat plate exposed to fluid velocities of 2, 2.5,and 3 m s-. The micropillars were moved by the disturbancesthat turbulent structures left in the viscous sublayer when theypassed the near-wall region. Figure 8 shows the streamwise mo-tions of the pillars relative to the mean. An example of the corre-lation profile is shown in Figure 9. It demonstrates a well definedmaximum at a time lag of 3.5 ms. With a pillar spacing of 5 mmand a bulk flow velocity ofU = 2 m s, the convective velocity Flow velocity [cm s'] Figure3.FFlow velocity (y-axis) calculated from the time shift of the cross-correlation offlow velocity profiles retrieved from PIV measurements at different water flow velocities asfunction of bulk flow velocity (x-axis). Line, Linear regression analysis. UC was 1.25 ms, which is equal to 0.61 Uo. For the bulk flowvelocities 2.5 and 3mss, the convective velocities were 1.52 and1.83 m s, respectively.This leads to 0.62 U (in all cases, 10measurements were made). Figure 4.A-D,Cross-correlation of neuronal data.A, Original traces of simultaneously recorded spike trains. B, Relative instantaneous frequency (IF,mean subtracted) of the spike trains shownin A. C, Superimposed IF of both spike trains shown in B.D,Cross-correlation function (blue) ofthe two IFs and of the shuffled data (black) shown in C. The dashed lines indicate the positive and thenegative z value of the shuffled data. The black bars in A-C represent a timescale of 0.2s. Table 1. Significant correlation peaks and Z values for the pairs of afferent fibers recorded under still- and running-water conditions Mean maximum peak Mean Z value Significant Condition Positive Negative Positive Negative Positive Negative Still water (n=61) (range) 0.102(0.007-0.184) -0.081(-0.101to-0.052) 0.136(0.037-0.157) -0.137(-0.146 to -0.039) 3 of 61 0 of 61 Running water (n =67) (10cms s-)(range) 0.141(0.057-0.808) -0.104(-0.456to-0.049) 0.120(0.010-0.802) -0.121(-0.149 to -0.089) 23 of 67 10 of 67 Discussion Flow measurement with PIV and flexible micropillars Although our goal was to producecompletely laminar flow, thecollimators in our flow were not perfect and some flow fluctua-tions were always present (Fig. 2C,D). By cross-correlating theflow fluctuations measured at different downstream interroga-tion windows, the net flow velocities could be calculated from thecross-correlation function. In contrast, water motions measuredat interrogation windows oriented vertically (i.e., perpendicularto gross flow direction) showed only a weak (if the interrogationwindows were spaced close together) or no correlation. Lateral line Fish use the lateral line to orient in running water, a behaviorcalled rheotaxis (Montgomery et al., 1997; Baker and Montgom-ery, 1999). To do so, a fish must be able to detect gross flowdirection. Because of its intrinsic directional sensitivity (Flockand Wersall, 1962), a single neuromast (primary lateral line af-ferent) in principle could code gross flow direction, provided that lateral line hair cells do not adapt to DC stimuli (i.e., to a flow thatis perfectly laminar). As with auditory hair cells (Hudspeth et al.,2000), however, lateral line hair cells rapidly adapt to a constantdeflection of their ciliary bundles (S. van Netten, personal com-munication). In natural waters, perfectly laminar flow is highlyunlikely (Vogel,1996). The flow in our tank also showed somefluctuations at all the flow velocities used, but these were smallerthan the flow fluctuations measured in a small creek (RMS, 70mm s-; water velocity, 11-25 cm s-l) (Hanke, 2001). Undernonlaminar conditions, lateral line nerve fibers do respond tounidirectional water flow, but mainly respond to the flow fluctu-ations and not to the DC component of the flow (Chagnaudet al.,2008). Therefore, a single lateral line afferent cannot encode grossflow direction under nonlaminar flow conditions. All else beingequal, an increase in flow velocity results in an increase in flowfluctuations (Chagnaud et al.,2008).Because flow-sensitive lat-eral line nerve fibers are highly sensitive to flow fluctuations,these fluctuations may provide an indirect measure of flow veloc-ity. However, this is not a reliable measure because the magnitude Time [s] Figure 5. A-D, Cross-correlation functions of the firing frequencies of pairs of afferents recorded simultaneously. A, From bottom to top, gross flow velocities were 0, 4,6.5,8,10, 12, and 13.5cm s. Gross flow direction was from rostral to caudal. B-D, Cross-correlation functions of three simultaneously recorded spike train pairs. Gross flow was from rostral to caudal (left) and fromcaudal to rostral (right). Note that the data show both correlation (B) and anticorrelation (C, D). Flow velocities were 0, 6.5, 10, and 13.5 cms . Note that there is no correlation in still water andthat higher flow velocities systematically shift the time of maximal correlation (indicated by the vertical lines in B-D). Figure6. Time lag of the correlation peak of 10 representative fibers (each symbol refers toasingle fiber) at different flow velocities. Note that, with increasing flow velocity, the time lagdiminishes. of the flow fluctuations depends on the presence, size, and shapeof upstream objects (Vogel, 1996). Correlation of spike trains We recorded from pairs of afferent nerve fibers and investigatedwhether their neural activity could be cross-correlated to deter-mine bulk flow velocity. Although we recorded from 67 pairs, only the responses of 23 pairs showed a significant correlation.This was not unexpected because a significant correlation of spiketrains will only occur ifthe neuromasts recorded from are alignedin flow direction (i.e., if they are stimulated by similar watermotions). Nevertheless, the responses of 8 of the 23 fiber pairswere highly correlated. As expected, the time shift ofthe correla-tion peak decreased with increasing flow velocity and a reversal offlow direction reversed the sign of the optimal time shift (Fig. 5).Correlation peaks in general were higher if the flow was fromrostral to caudal (Fig. 5B-D). This may be attributable to thecurvature of the fish that probably influenced the water flow. Inaddition, the fish surface may have altered the flow because fishscales are oriented in a rostrocaudal direction. Two pair of fibersshowed a high anticorrelation (i.e., spikes in one fiber never co-incided with spikes in the other fiber). Because a time shift of 0 atall flow velocities applied yielded the highest anticorrelation, thetwo fibers of each pair most likely innervated the same neuro-mast, but hair cells that were aligned in opposite directions (Fig.5C,D). We did not attempt to locate the positions of the neuromastsfrom which we recorded. Because, however, the time shift thatyielded the highest correlation peak was proportional to flowvelocity, and reversed if flow direction was reversed, the onlyexplanation is that we recorded from two neuromasts that werespaced apart in flow direction. Our results in addition confirmedthat the fibers responded to the flow fluctuations and that thesefluctuations traveled with the bulk flow. Our PIV measurementsshow that a phase shift between the water fluctuations measuredat two points occurs only if the two points are arranged in down- Time [s] Figure7..Cross-correlation functions (red, single traces; black, average of single traces) of spike trains simultaneously recorded from PLLN fibers. Each red trace is the correlation of a pair ofspikerecordings. The fish was exposed to an object that passed its trunk with a velocity of 17 cms-. Left, Two seconds before the object passed the fish; middle, while the object passed the fish; right,after the object had passed the fish. A, A fiber pair whose responses were highly correlated ifthe object motion was from anterior to posterior. B, Same fiber pair as in A, but object motion directionwas from posterior to anterior. C, A fiber pair that showed anticorrelation (motion direction was from anterior to posterior). Figure8. Temporal profiles of pillar tip displacements in a turbulent boundary layer ofa flatplate.Measurements were done with two micropillars in a tandem arrangement with a spacingof 5 mm (continuous line, upstream pillar; dashed line, downstream pillar). Note that thedownstream pillar shows the same movement as the upstream pillar, but with a time delay. Figure 9.Cross-correlation function of the data shown in Figure 8. interneuromast distance of a fiber pair by multiplying the timelag of the correlation peak with the respective flow velocity. Asexpected, for a given fiber pair, the resulting interneuromast dis-tance was constant (i.e., independent of flow velocity) (data notshown). We normalized the interneuromast distance of the 10fiber pairs shown in Figure 6. Across flow velocities, the SE ininterneuromast distance was <0.13 cm. stream order. Furthermore, the phase shift increased with de-creasing flow velocity and the sign of the phase shift reverseswhen flow direction is reversed.We conclude that the informa-tion about flow velocity and flow direction cannot unequivocallybe retrieved from the spike trains of an individual lateral lineafferent. Instead, this information indirectly can be retrieved bycross-correlating the responses of at least two afferents that in-nervate different neuromasts. Assuming that the time lag of thecorrelation peak represents the flow velocity, we calculated the The proposed mechanism probably is used by the superficialneuromast system but potentially also applies to the canal neu-romast system, provided the bulk flow contains some high-frequency fluctuations, because canal neuromast are known torespond to high-frequency fluctuations (Chagnaud et al., 2008).Additional experiments are needed to solve this issue. Correlation coefficient For a perfect correlation (i.e., a correlation value of 1), one needsidentical signals that can be time shifted. To account for the fibersdifferent ongoing activities we subtracted, before the correlation,the mean ongoing activity from the respective IFs. This does notresult, however, in identical firing amplitudes if the neuromastsare exposed to the same flow fluctuations. This is attributable toseveral reasons: (1) The neuromasts may have different sensitiv-ities, (2) the neuromasts’most sensitive axes might be oriented indifferent directions, (3) a fiber pair might consist of a superficialand a canal neuromast, and (4) the neuromasts are not posi-tioned in a straight horizontal alignment. Thus, even if the signalis identical, we cannot always expect high correlation values. Wewere able to show, however, that the phase shift of the correlationpeaks depends on flow velocity and flow direction; thus, the cor-relation peaks are not artificial. Moving object Pairs of spike trains of lateral line fibers stimulated by a movingobject showed a broad correlation peak during the time when theobject passed the fish. This most probably was attributable to thedifferent water motions caused by the moving object duringthe time of correlation. A moving object causes water motionsranging from 0 up to 30 cm s[Mogdans and Bleckmann(1998), their Fig. 14]. Although the object has a certain velocity,the water that is dragged behind the object shows a broad contin-uum of velocities, and thus one cannot expect a distinct phaseshift in the neural responses.However, it became apparent that atleast object direction can be coded because the broad correlationpeak flipped from positive to negative and vice versa if objectdirection was altered. Interestingly, neurons in the torus semicir-cularis of the goldfish show only a directional sensitivity and novelocity sensitivity to a moving object (Muller et al., 1996). This isin accordance with our data and with the fact that the flow veloc-ity changes rapidly if a moving object passes a fish. Coincidence detector The mechanism proposed for the determination of flow speedand flow direction has (to our knowledge) never been suggestedbefore for the mechanosensory lateral line. However, the pro-posed mechanism has been shown previously in the visual systemof flies. In flies, a visual motion detector uses a combination of atemporal delay and a multiplication of the detector input chan-nels to measure the degree of coincidence of the signals at itsinput stages, or, in other words, the visual system of flies performsa spatiotemporal cross-correlation (Borst and Haag, 2002). Manyneurons in the medial octavolateralis nucleus of fish have largereceptive fields (i.e., these neurons integrate the input of two ormore neuromasts widely spaced apart) (Mogdans and Krother,2001). This is one of the prerequisites for a mechanism based oncoincidence detection. A second prerequisite is that the spikesgenerated in a neuromast situated more caudally should propa-gate faster than the spikes generated in a neuromast situated morerostrally (i.e., that the conduction velocity of primary lateral lineafferents compensates for fiber length). This indeed has beenfound in the lateral line system (Schellart and Kroese,2002). Neuronal delay lines are commonly found in the brain whentime comparisons must be made. For example, in the auditorysystem of barn owls, delay lines are used to determine interauraltime differences (Carr and Konishi, 1990) and bats also use delaylines to determine the distance to a target (Covey and Casseday,1999).Whether delay lines are implemented in the fish centrallateral line pathway is not known; thus, we cannot say whether the lateral line system of fish extracts the velocity and directionalinformation in the way proposed here. It is unlikely that thecentral lateral line performs a time-intensive cross-correlationanalysis as we did (correlation of time signals of 60 s and/or 1 sduration, and only using pairs of afferents), but a more rapidanalysis could be performed by the fish if it simultaneouslysummed signals from many afferents. In this case, the lateral lineshould be able to use much shorter time sequences for a cross-correlation analysis. In addition, comparison across receptorswith different spacing would allow the lateral system to resolvedifferent flow velocities (i.e., the time difference of the responsesfrom closely spaced neuromasts permits resolution of low flowvelocities, whereas comparison of more distantly spaced neuro-masts is better suited to determine high flow velocities). The proposed cross-correlation mechanism may also be ap-plied to artificial hydrodynamic sensory systems that are recentlydeveloped to equip underwater vehicles with a new sensory mo-dality (Gray, 2006). With a two-dimensional array of receptors,flow velocity and flow direction could be extracted with receptorsthat do not have to be calibrated or to respond linearly to the flowvelocity. The use of flow fluctuations as a measurement of flowdirection and flow velocity is not limited to the aquatic mediumand thus should also be applicable in different mechanosensorysystems used to detect flow velocity and flow direction. References Baker CF,Montgomery JC (1999) The sensory basis ofrheotaxis in the blindMexican cave fish, Astyanax fasciatus. J Comp Physiol A Neuroethol SensNeural Behav PhysiolV 184:519-527. Blaxter JHS, Fuiman LA (1990) The role of the sensory systems of herringlarvae in evading predatory fishes. J Mar Biol Ass UK 70:413-427. Bleckmann H (1994) Reception of hydrodynamic stimuli in aquatic andsemiaquatic animals. Stuttgart: Gustav Fischer. Borst A, Haag J (2002) Neural networks in the cockpit of the fly. J CompPhysiol A Neuroethol Sens Neural Behav Physiol 188:419-437. Brucker C, Spatz J, Schroder W (2005) Feasability study of wall shear stressimaging using microstructured surfaces with flexible micropillars. ExpFluids 39:464-474. Brucker C, Bauer D, Chaves H (2007) Dynamic response of micro-pillarsensors measuring fluctuating wall-shear-stress. Exp Fluids 42:737-749./生9. Campenhausen C, Riess I, Weissert R (1981) Detection of stationary objectsby the blind cave fish Anoptichthys jordani (Characidae). J Comp PhysiolA Neuroethol Sens Neural Behav Physiol 143:369-374. Carr C, Konishi M(1990) A circuit for detection of interaural time differ-ences in the brain stem of the barn owl. J Neurosci 10:3227-3246. Carton AG, Montgomery JC (2002) Responses of lateral line receptors towater flow in the Antarctic notothenioid, Trematomus bernacchii. PolarBiol 25:789-793. Chagnaud BP, Bleckmann H, Hofmann MH (2008) Lateral line nerve fibersdo not code bulk water flow direction in turbulent flow. Zoology111:204-217. Coombs S, Fay RR (1989) The temporal evolution of masking and fre-quency selectivity in the goldfish (Carassius auratus). J Acoust Soc Am86:925-933. Coombs S, Janssen J, Webb JF (1988) Diversity of lateral line systems: evo-lutionary and functional considerations. In: Sensory biology of aquaticanimals (Atema J, Fay RR, Popper AN, Tavolga WN, eds), pp 553-593.New York: Springer. Covey E, Casseday JH (1999) Timing in the auditory system ofthe bat. AnnuRev Physiol 61:457-476. Engelmann J, Hanke W, Bleckmann H (2002) Lateral line reception in still-and running water. JComp Physiol A Neuroethol Sens Neural BehavPhysiol188:513-526. Flock A (1971) Thelateral line organ mechanoreceptors. In: Fish physiology(Hoar W, Randall D, eds), pp 241-263. New York: Academic. Flock A, Wersall J (1962) A study of the orientation of the sensory hairs ofthe receptor cells in the lateral line organ of fish, with special reference tothe function of the receptors. J Cell Biol 15:19-27. Gray B (2006) Bioengineering. Artificial arrays could help submarines makelike a fish. Science 313:1382-1383. Hanke W (2001) Hydrodynamische Spuren schwimmender Fische und ihremogliche Bedeutung fur das Jagdverhalten fischfressender Tiere. PhDthesis, Department of Zoology, University of Bonn. ( Hudspeth AJ, Choe Y, Mehta AD, Martin P ( 2 000) P u tting ion channels towork: mechanoelectrical t ransduction, adaptation, and amplification by h air cells . Proc Nat l Acad Sc i USA 97:11765-11 7 72. ) ( K anter MJ, Coombs S (20 0 3) Rhe o t axis and prey detection in uniform cur- rents by Lake M ichigan m o ttled s c ulpin ( C ottus b a irdi). J E xp Biol 206:59-70. ) ( Mogdans J, Bleckmann H (1 9 98) Responses ofthe goldfish trunk lateral lineto moving objects. J Comp P hysiol A Neuroethol S ens N eural B ehav Physiol 182:659-676. ) Mogdans J,Krother S (2001) Brainstem lateral line responses to sinusoidalwave stimuli in the goldfish, Carassius auratus. Zoology 104:153-166. MontgomeryJ, Baker CF, Carton AG (1997) The lateral line can mediaterheotaxis in fish. Nature 389:960-963. Muller HM, Fleck A, Bleckmann H (1996) The responses of central octavol-ateralis cells to moving sources. J Comp Physiol A Neuroethol Sens Neu-ral Behav Physiol 179:455-471. Munz H (1979) Morphology and innervation of the lateral line system ofSarotherodon niloticus L. (Cichlidae, Teleostei). Zoomorphology93:73-86. ( Munz H (1985) Sing l e unit acti v ity in the peripheral lateral lin e system ofthe cichlid fish, Sarotherodon niloticus L . J Comp Physiol A Neuroethol Sens Neural Behav Physiol 157:555-568. ) ( New J G , Alborg Fewkes L, K han AN (2 0 01) St r ike feeding behavior in t he muskellunge, E s ox m a squinongy:contributions of the lateral line and v i -sual sensory systems. J Exp Biol 204:1207-1221. ) Northcutt G (1989) The phylogenetic distribution and innervation of cra-ny1niate mechanoreceptive lateral lines. In: The mechanosensory lateral line:neurobiology and evolution. (Coombs S, Gorner P, Munz H, eds), pp17-78. New York: Springer. Palmer LM, Mensinger AF (2004) Effect ofthe anesthetic tricaine (MS-222)on nerve activity in the anterior lateral line ofthe oyster toadfish, Opsanustau. JNeurophysiol 92:1034-1041. Partridge BL, Pitcher TJ (1980) The sensory basis of fish schools: relativeroles of lateral line and vision. J Comp Physiol A Neuroethol Sens NeuralBehav Physiol 135:315-325. Puzdrowski RL (1989) Peripheral distribution and central projections ofthelateral-line nerves in goldfish, Carassius auratus. Brain Behav Evol34:110-131. Satou M, Takeuchi H-A,Nishii J,Tanabe M, Kitamura S,Okumoto N, IwataM (1994) Behavioral and electrophysiological evidences that the lateralline is involved in the inter-sexual vibrational communication of the himesalmon (landlocked red salmon, Oncorhynchus nerka). J Comp Physiol ANeuroethol Sens Neural Behav Physiol174:539-549. Schellart NA, Kroese AB (2002) Conduction velocity compensation for af-ferent fiber length in the trunk lateral line of the trout. J Comp Physiol ANeuroethol Sens Neural Behav Physiol 188:561-576. Schmitz GJ, Brucker C, Jacobs P (2005) Manufacture of high-aspect-ratiomicro-hair sensor arrays. J Micromech Microeng 15:1904-1910. ( Spath M , Schweickert W (1 9 77) The effect of me t acaine (MS-222) on the a ctivity o fthe efferent a n d afferent nerves in the t eleost la te ral-line system. Naunyn Schmiedebergs Arch Pharmacol 297:9-16. ) ( VogelS ( 1 9 9 6) Li f e in moving fluids. Princeton, NJ: P r inceton UP. ) ( Voigt R, Carton A G, Montgomery JC ( 20 0 0) Resp o nses of anterior lateral line afferent neurones to water flow. J Exp Biol 203:2495-2502. )
确定

还剩7页未读,是否继续阅读?

产品配置单


北京欧兰科技发展有限公司为您提供《流体中速度场,流动方向检测方案(粒子图像测速)》,该方案主要用于其他中速度场,流动方向检测,参考标准--,《流体中速度场,流动方向检测方案(粒子图像测速)》用到的仪器有德国LaVision PIV/PLIF粒子成像测速场仪、LaVision HighSpeedStar 高帧频相机
推荐专场


相关方案
更多
该厂商其他方案
更多