


方案详情
文
Within the framework of an investigation into valve operating strategies for homogeneous charge
direct injection spark ignition engines under part load conditions this paper discusses the in-cylinder flow
fields developed by running an optical engine with an early inlet valve closing strategy with a lift of 3.9 mm
that produces 3bar IMEP at 3500 rpm under firing conditions. The experimental facilities are similar to
previous work but measurement technique has been optimized with the significant aspect of this work being
that the flow fields were determined in three vertical planes and one horizontal plane to highlight the three
dimensional and the highly cyclic nature of the flow. These characteristics have significant impact on
the application of the PIV technique and data processing to ensure a high degree of confidence in
the flow fields generated. The time varying nature of this three dimensional flow field is discussed and
how it impacts on the PIV measurement technique particularly as regards data acquisition and data
processing. The true extent of the complex three dimensional flow field is readily seen and that, even though
the combustion chamber geometry is symmetrical, the swirl flow field is not. The main features of the
vertical flow structure are described over a crankangle period from 90oCA to 120oCA which
highlight the dominant feature as being a wall jet flow which interacts with the piston crown to
generate a strong reverse tumble flow.
方案详情

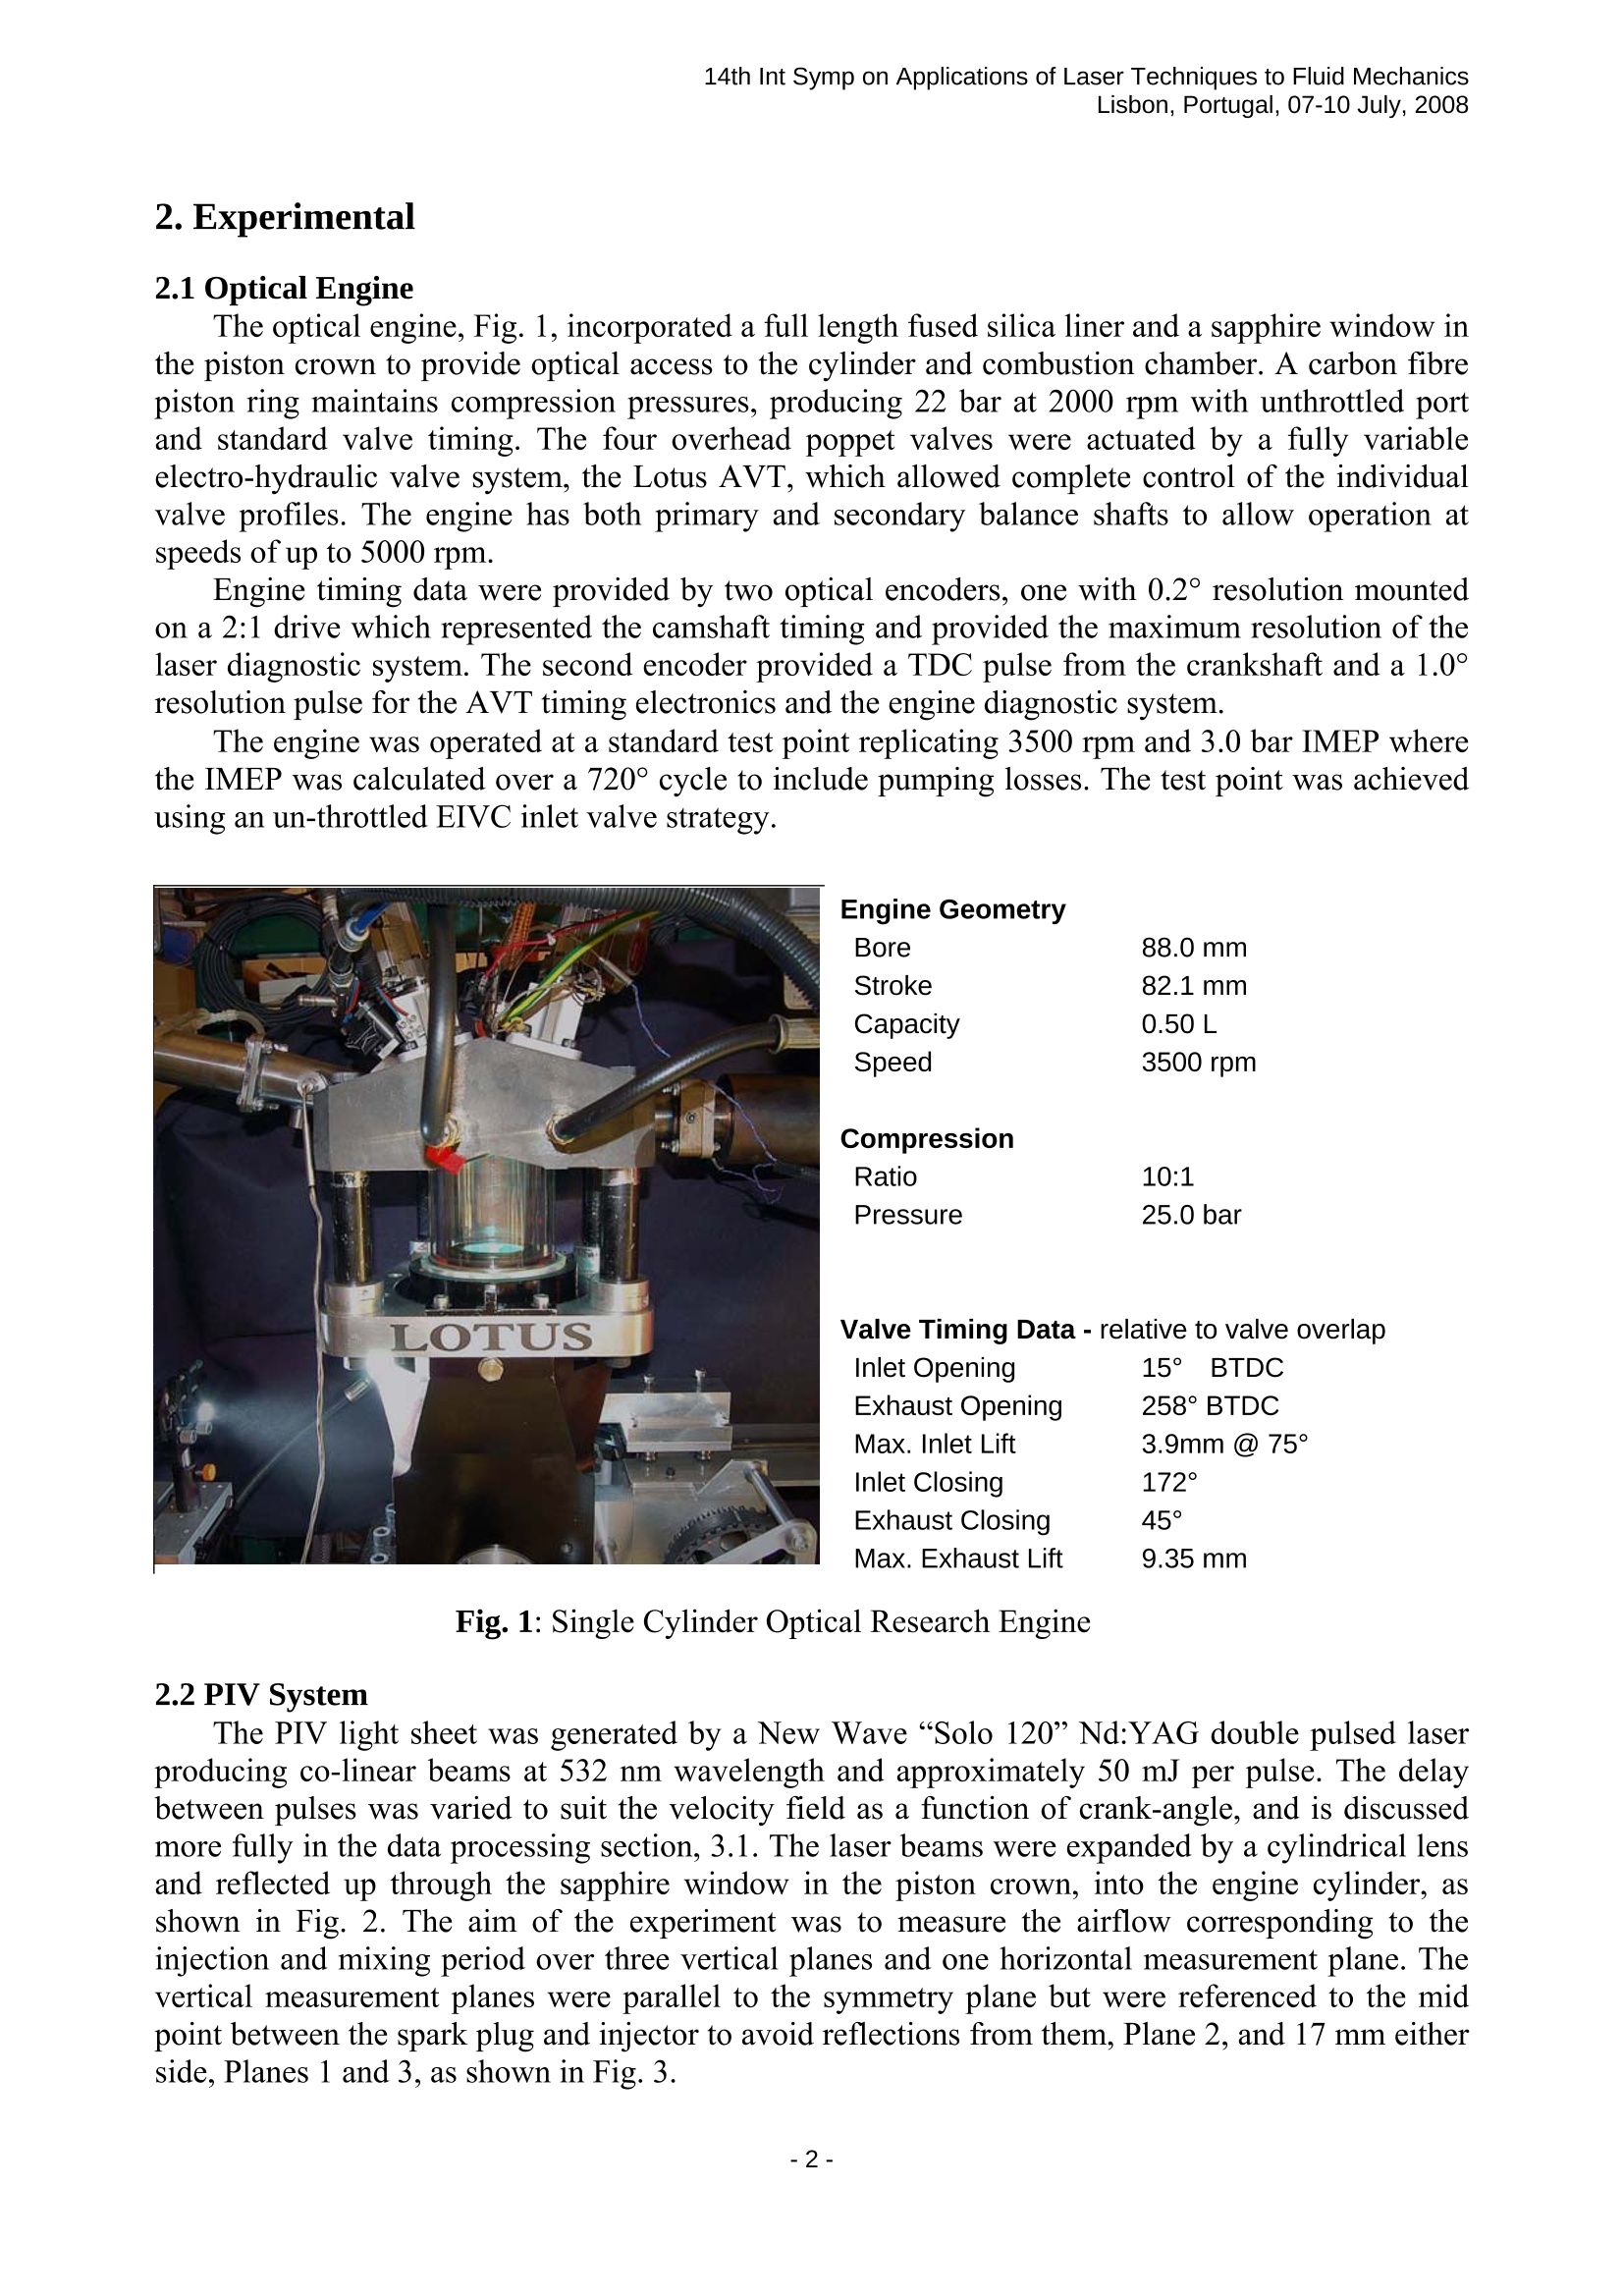
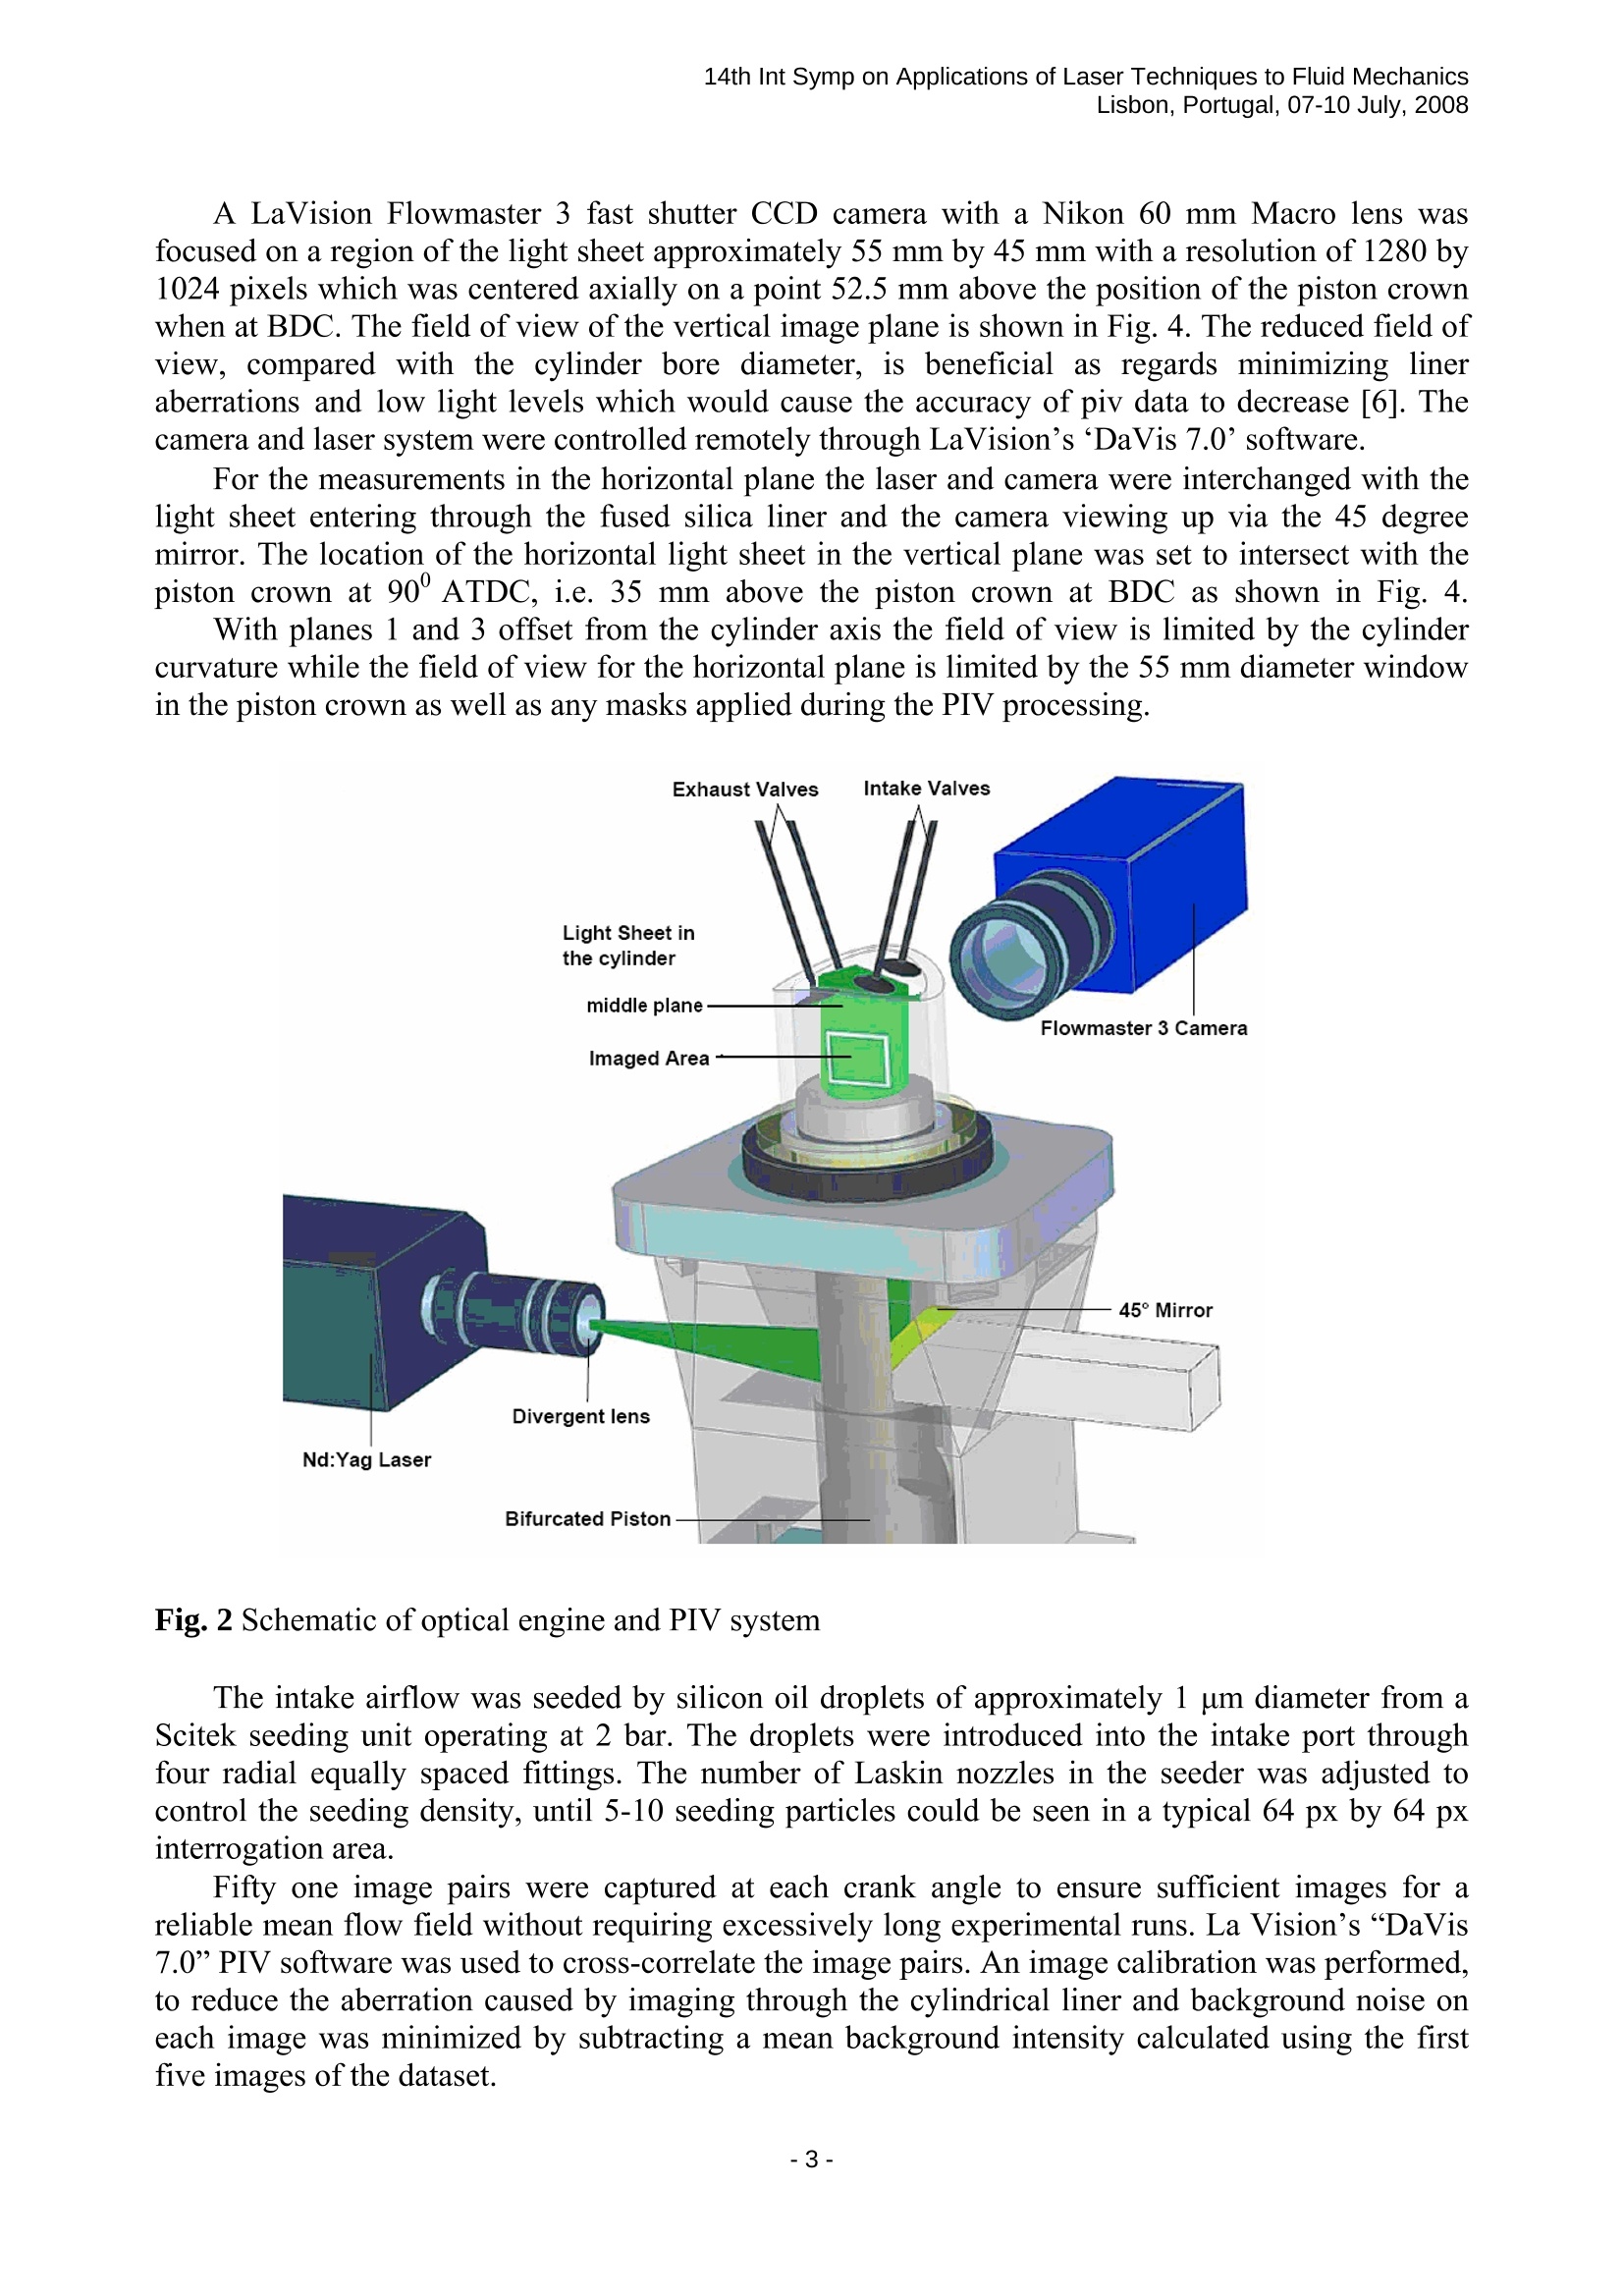
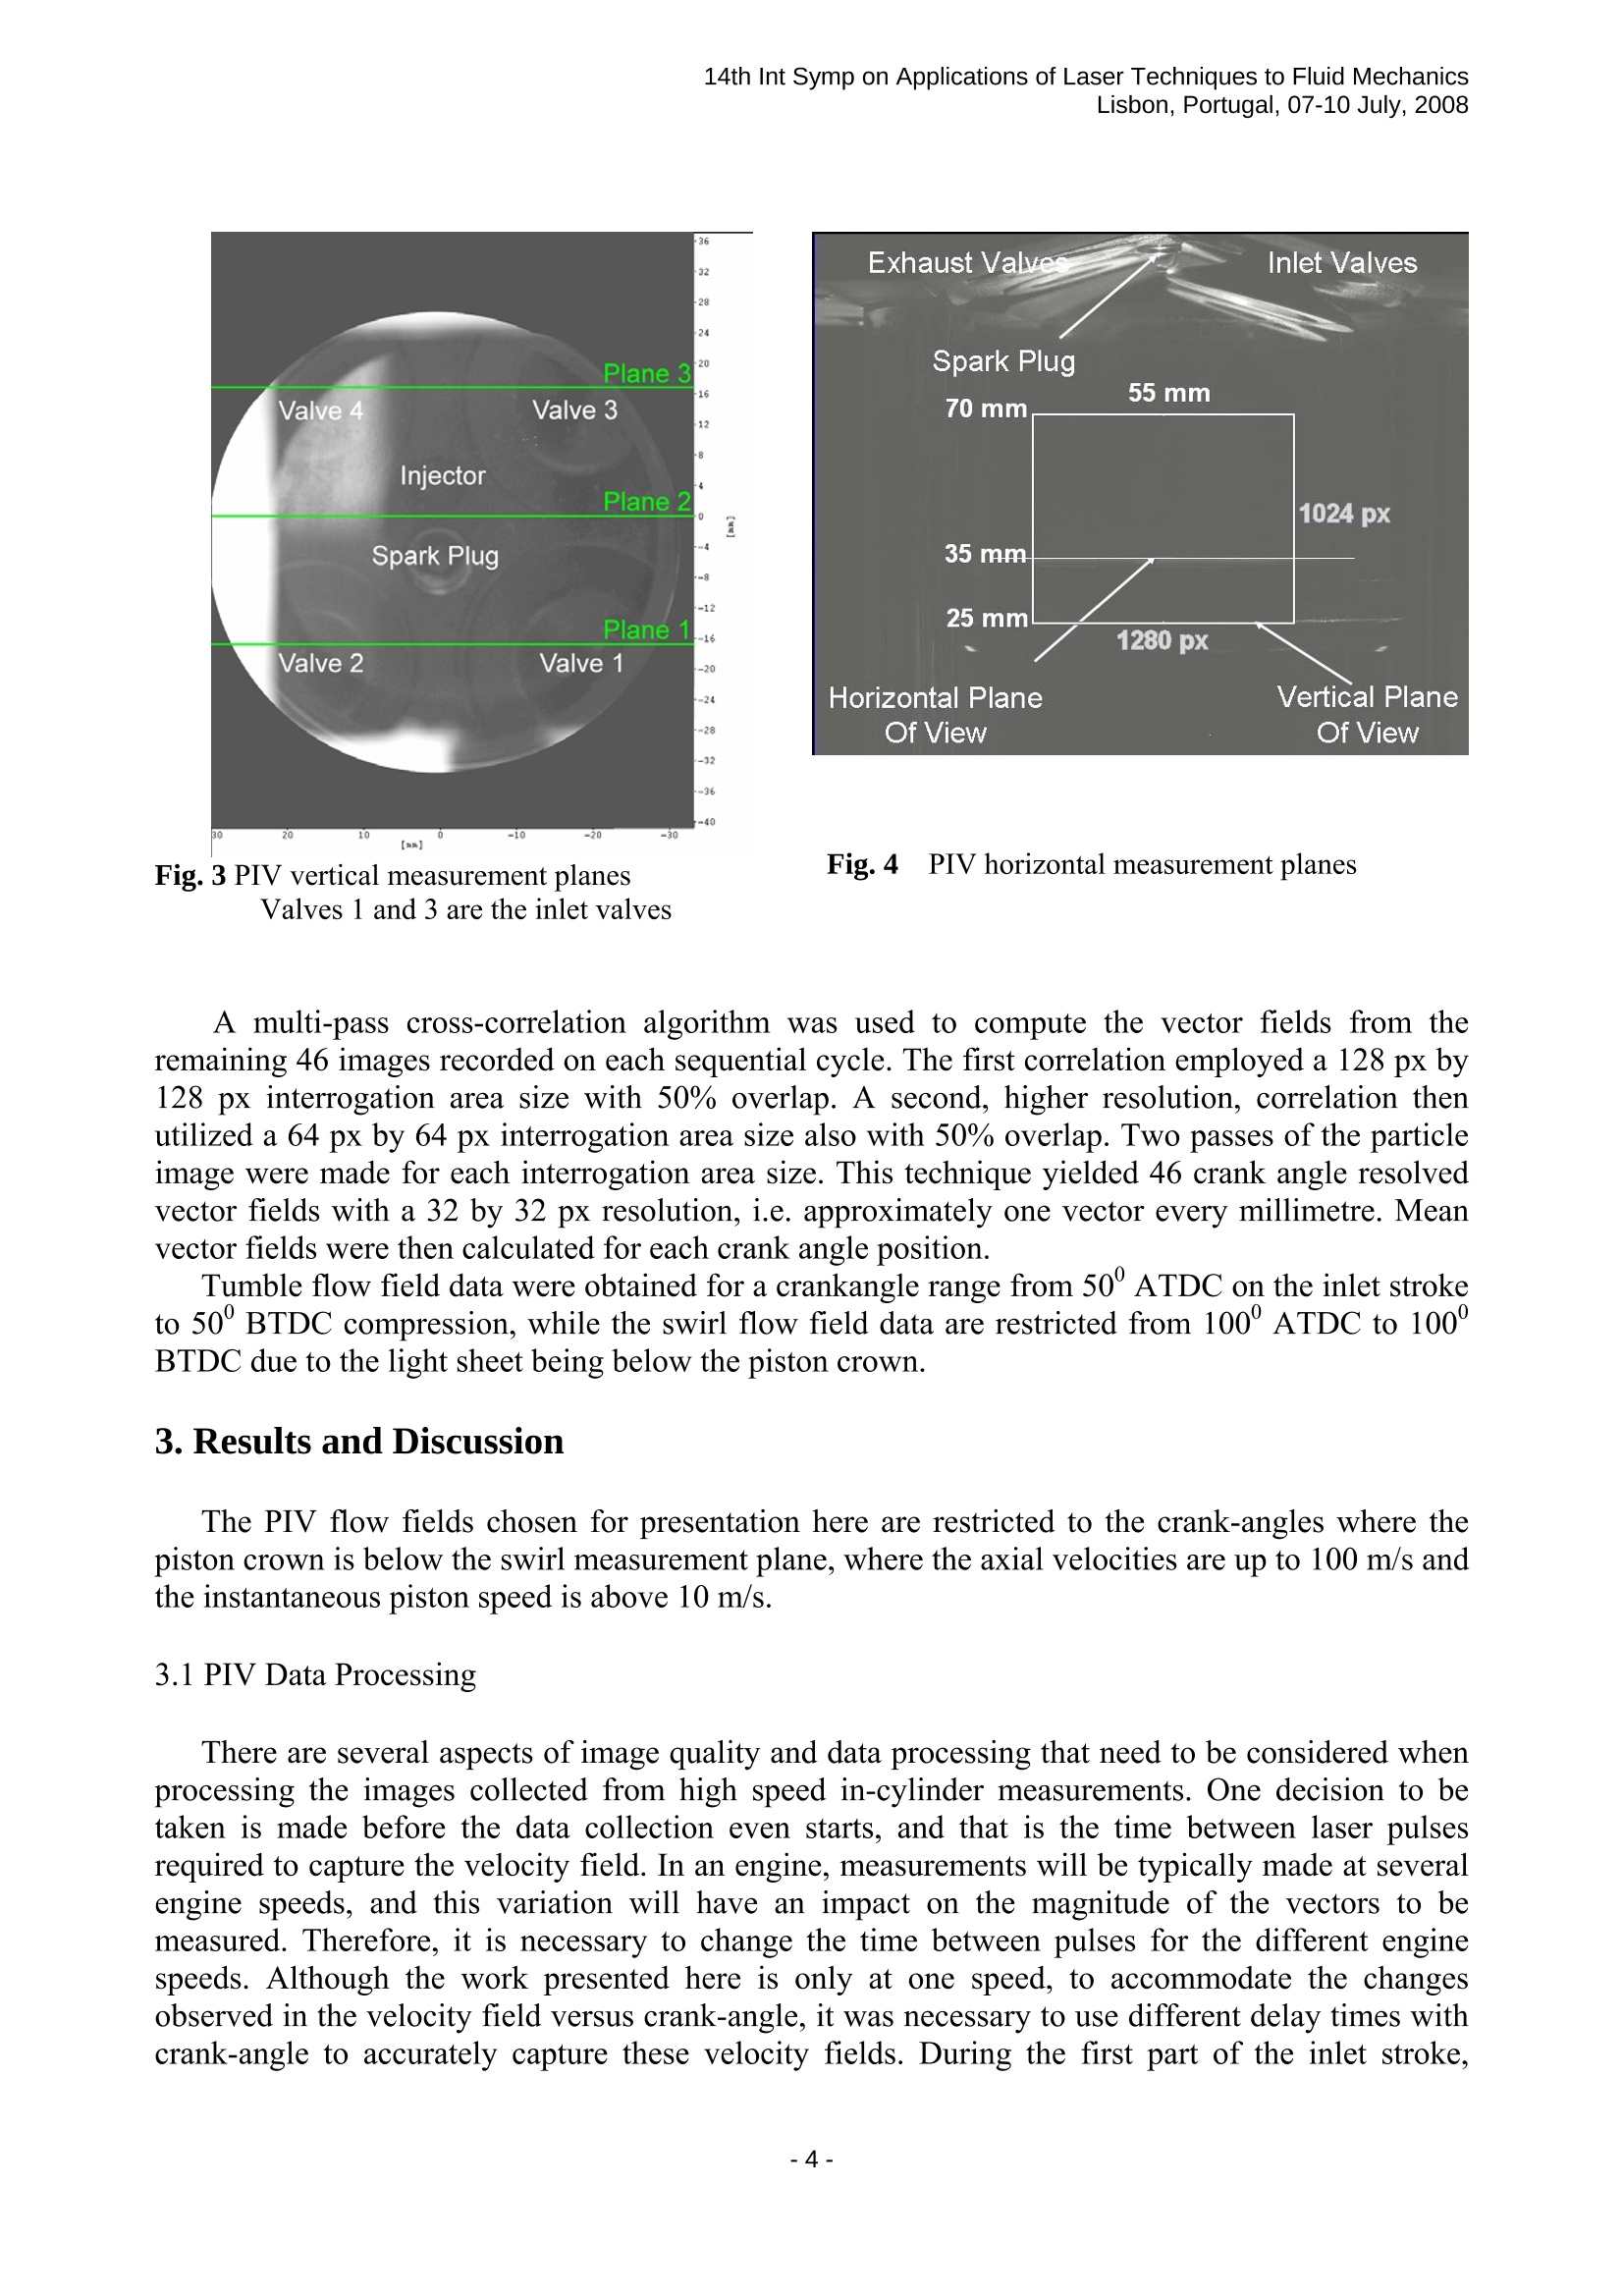
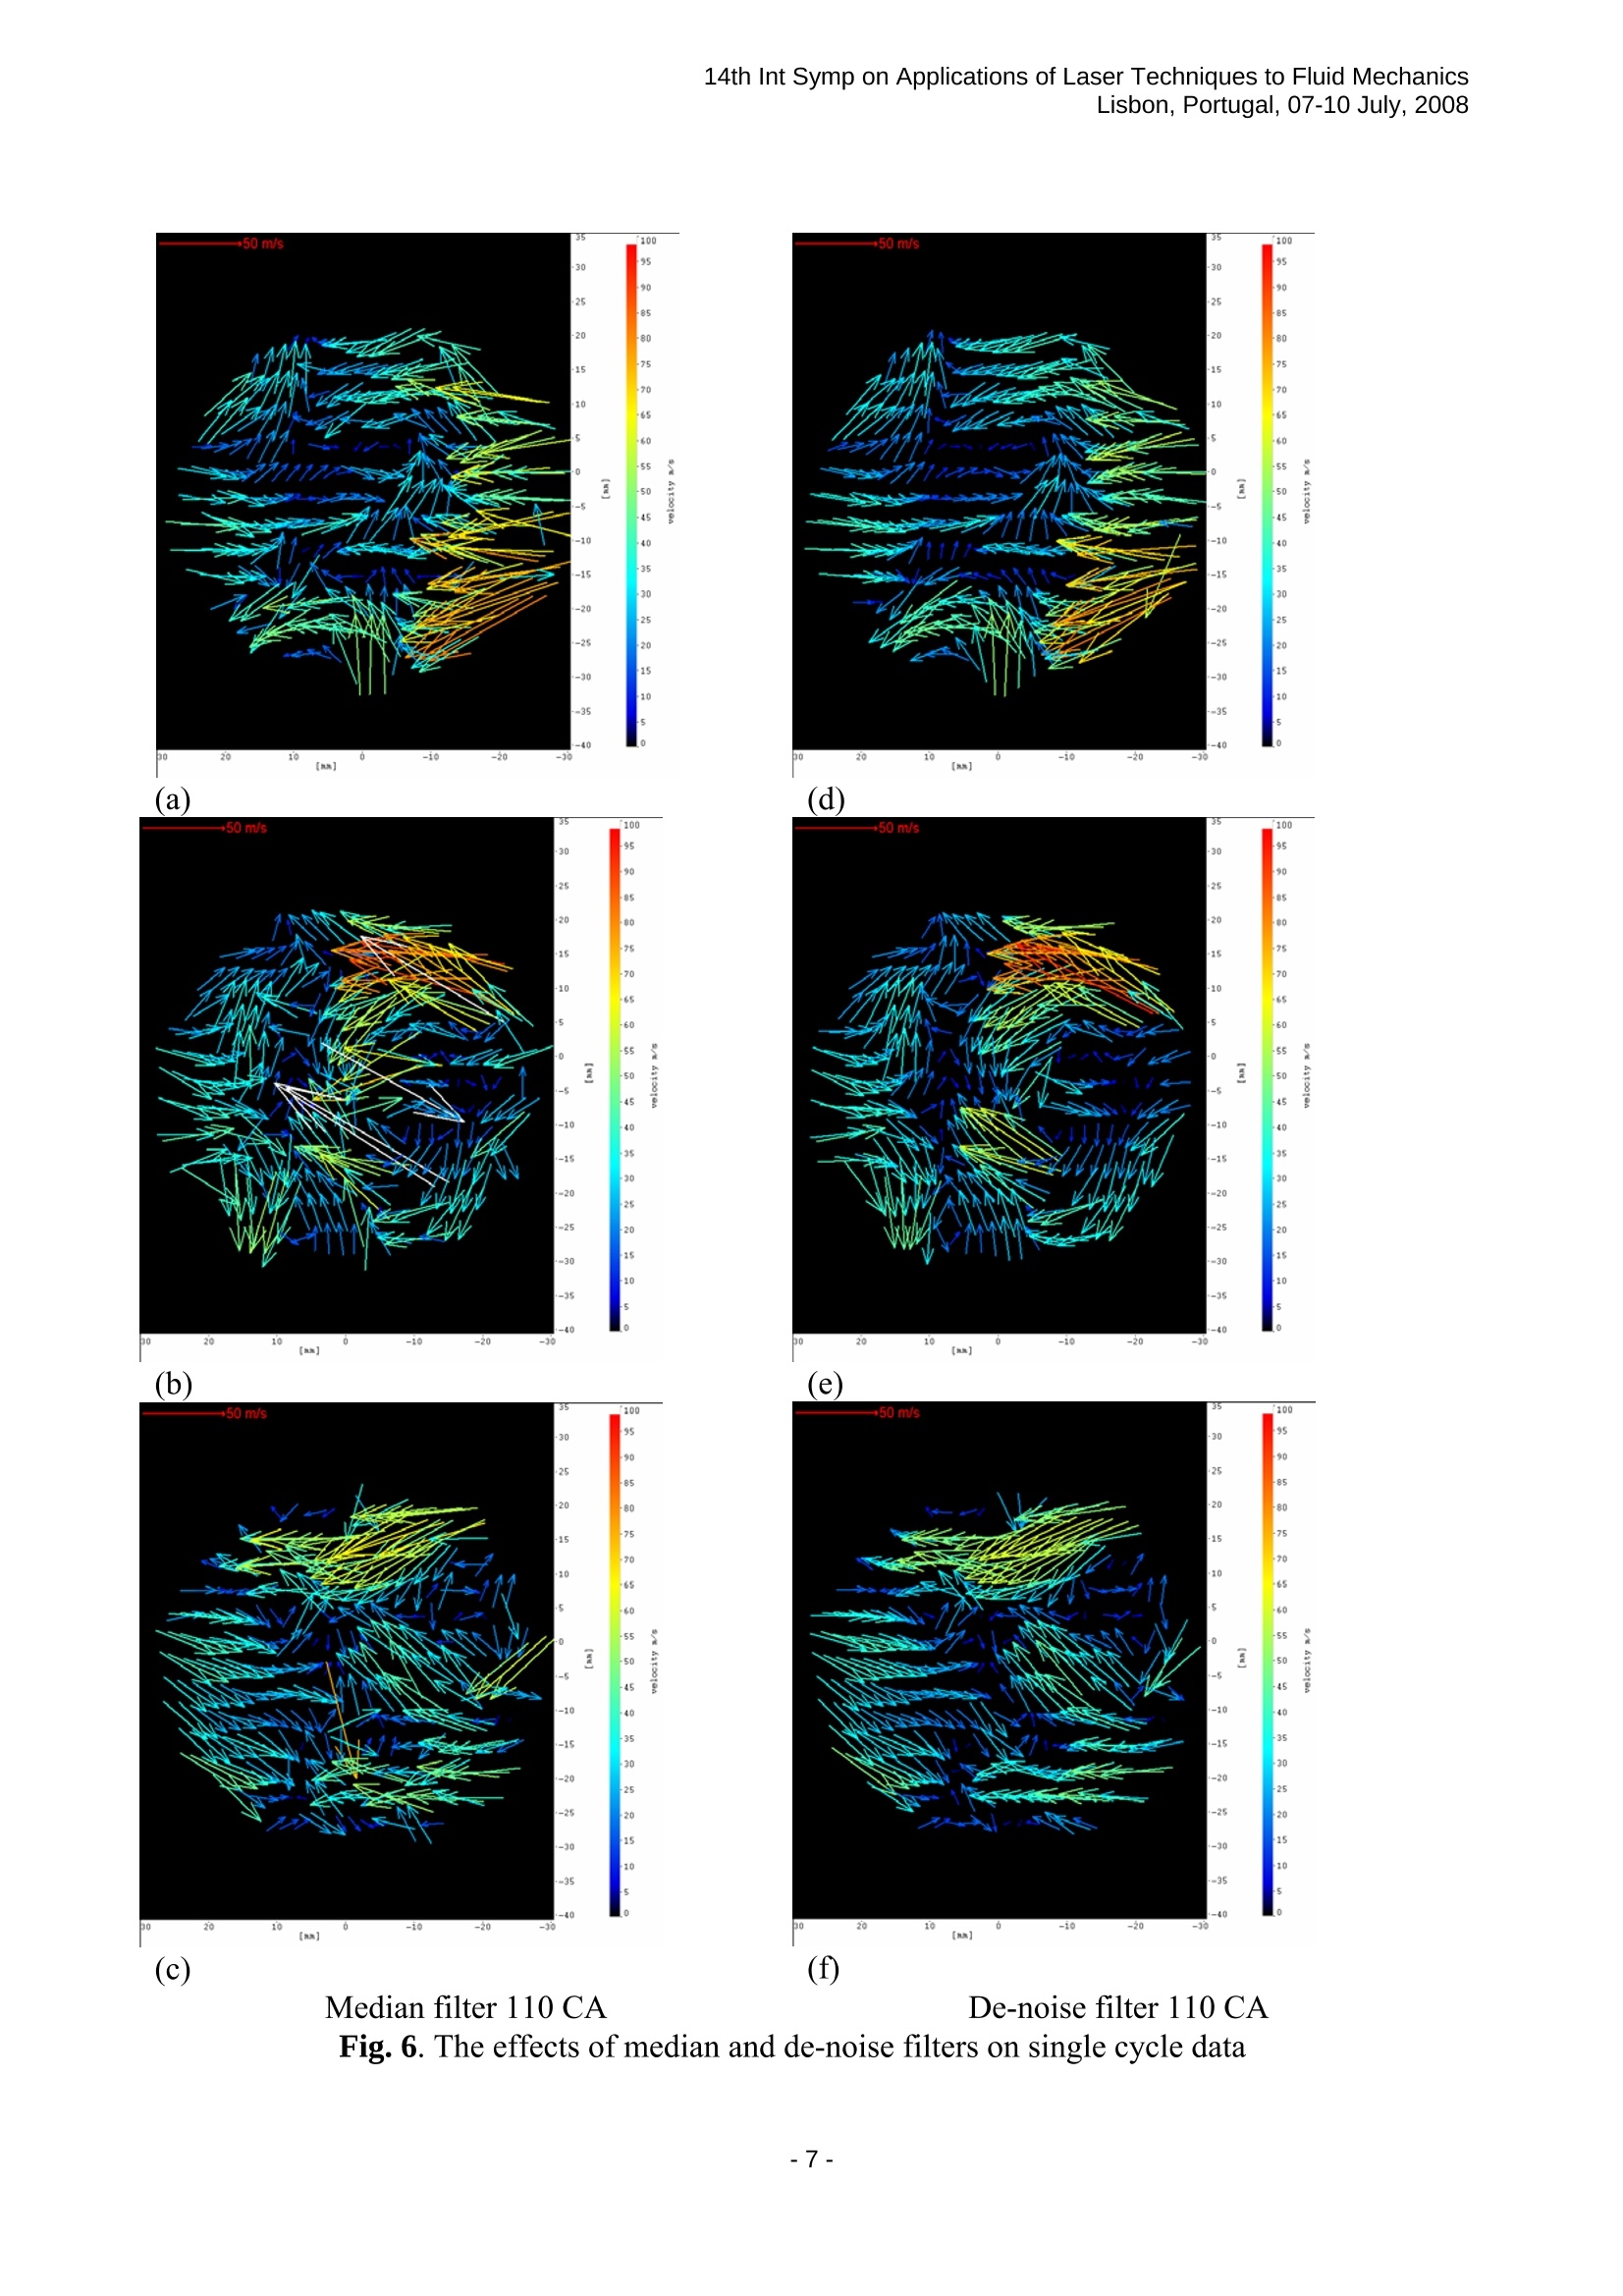
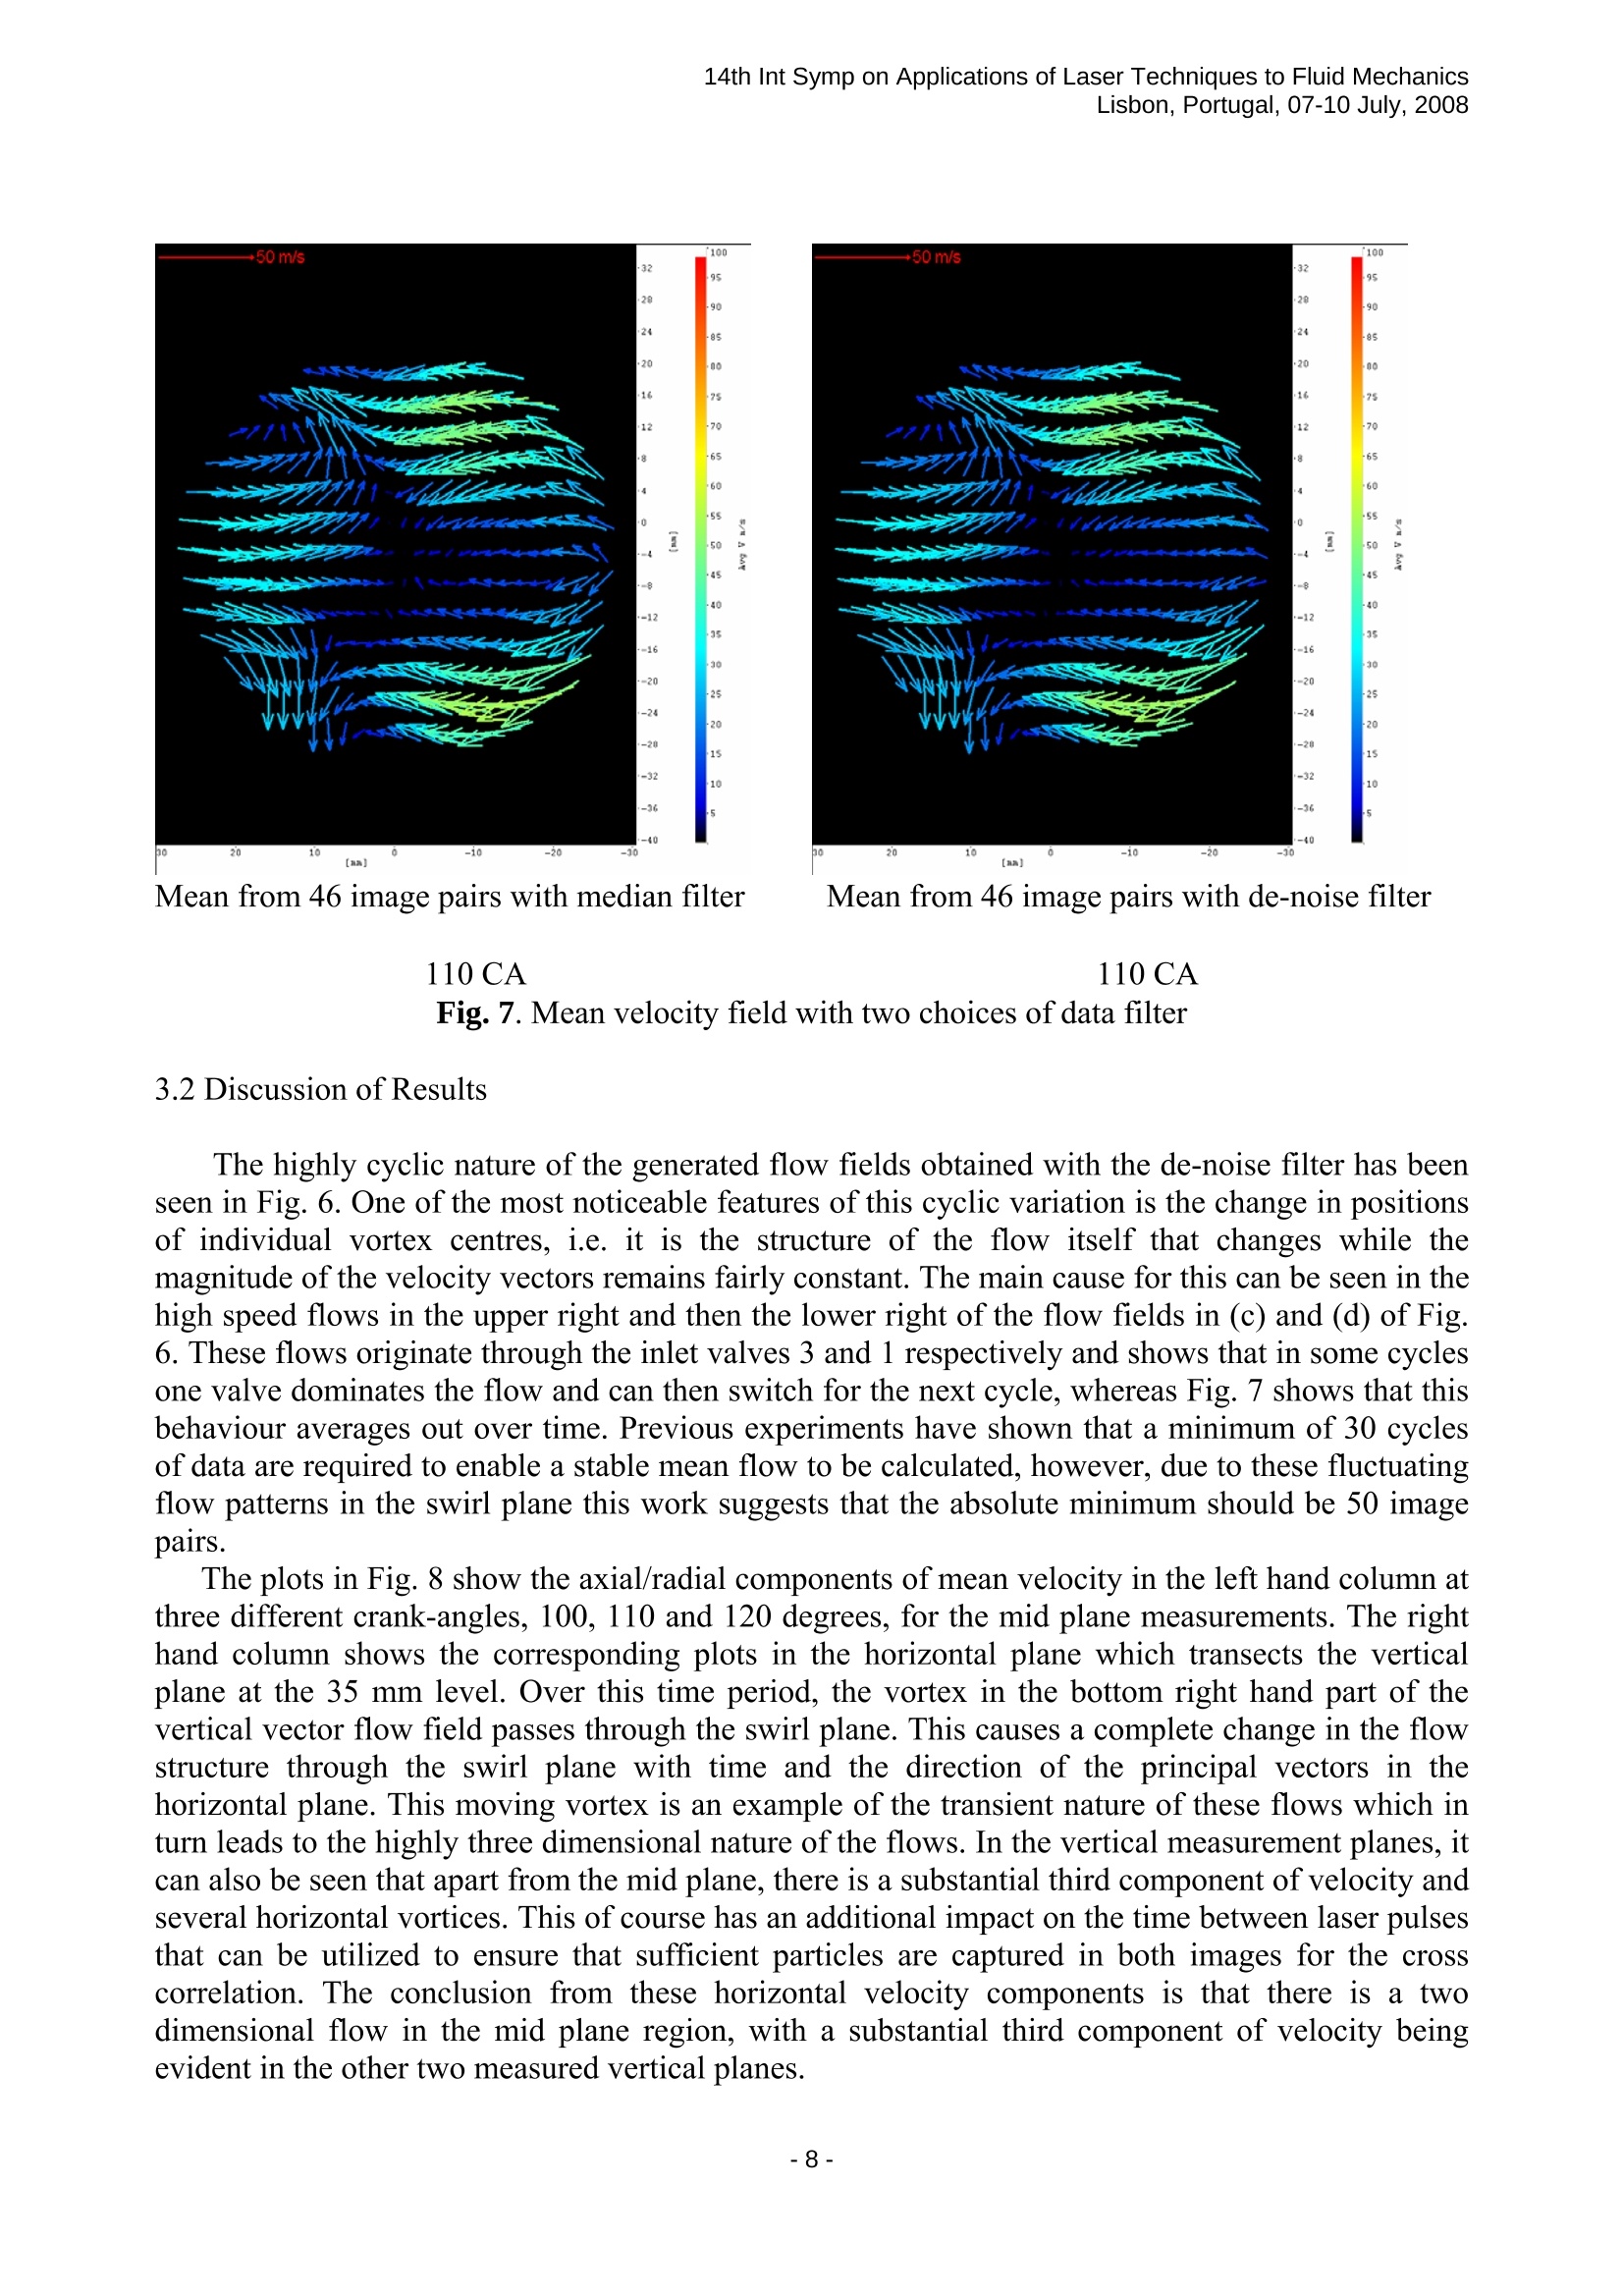
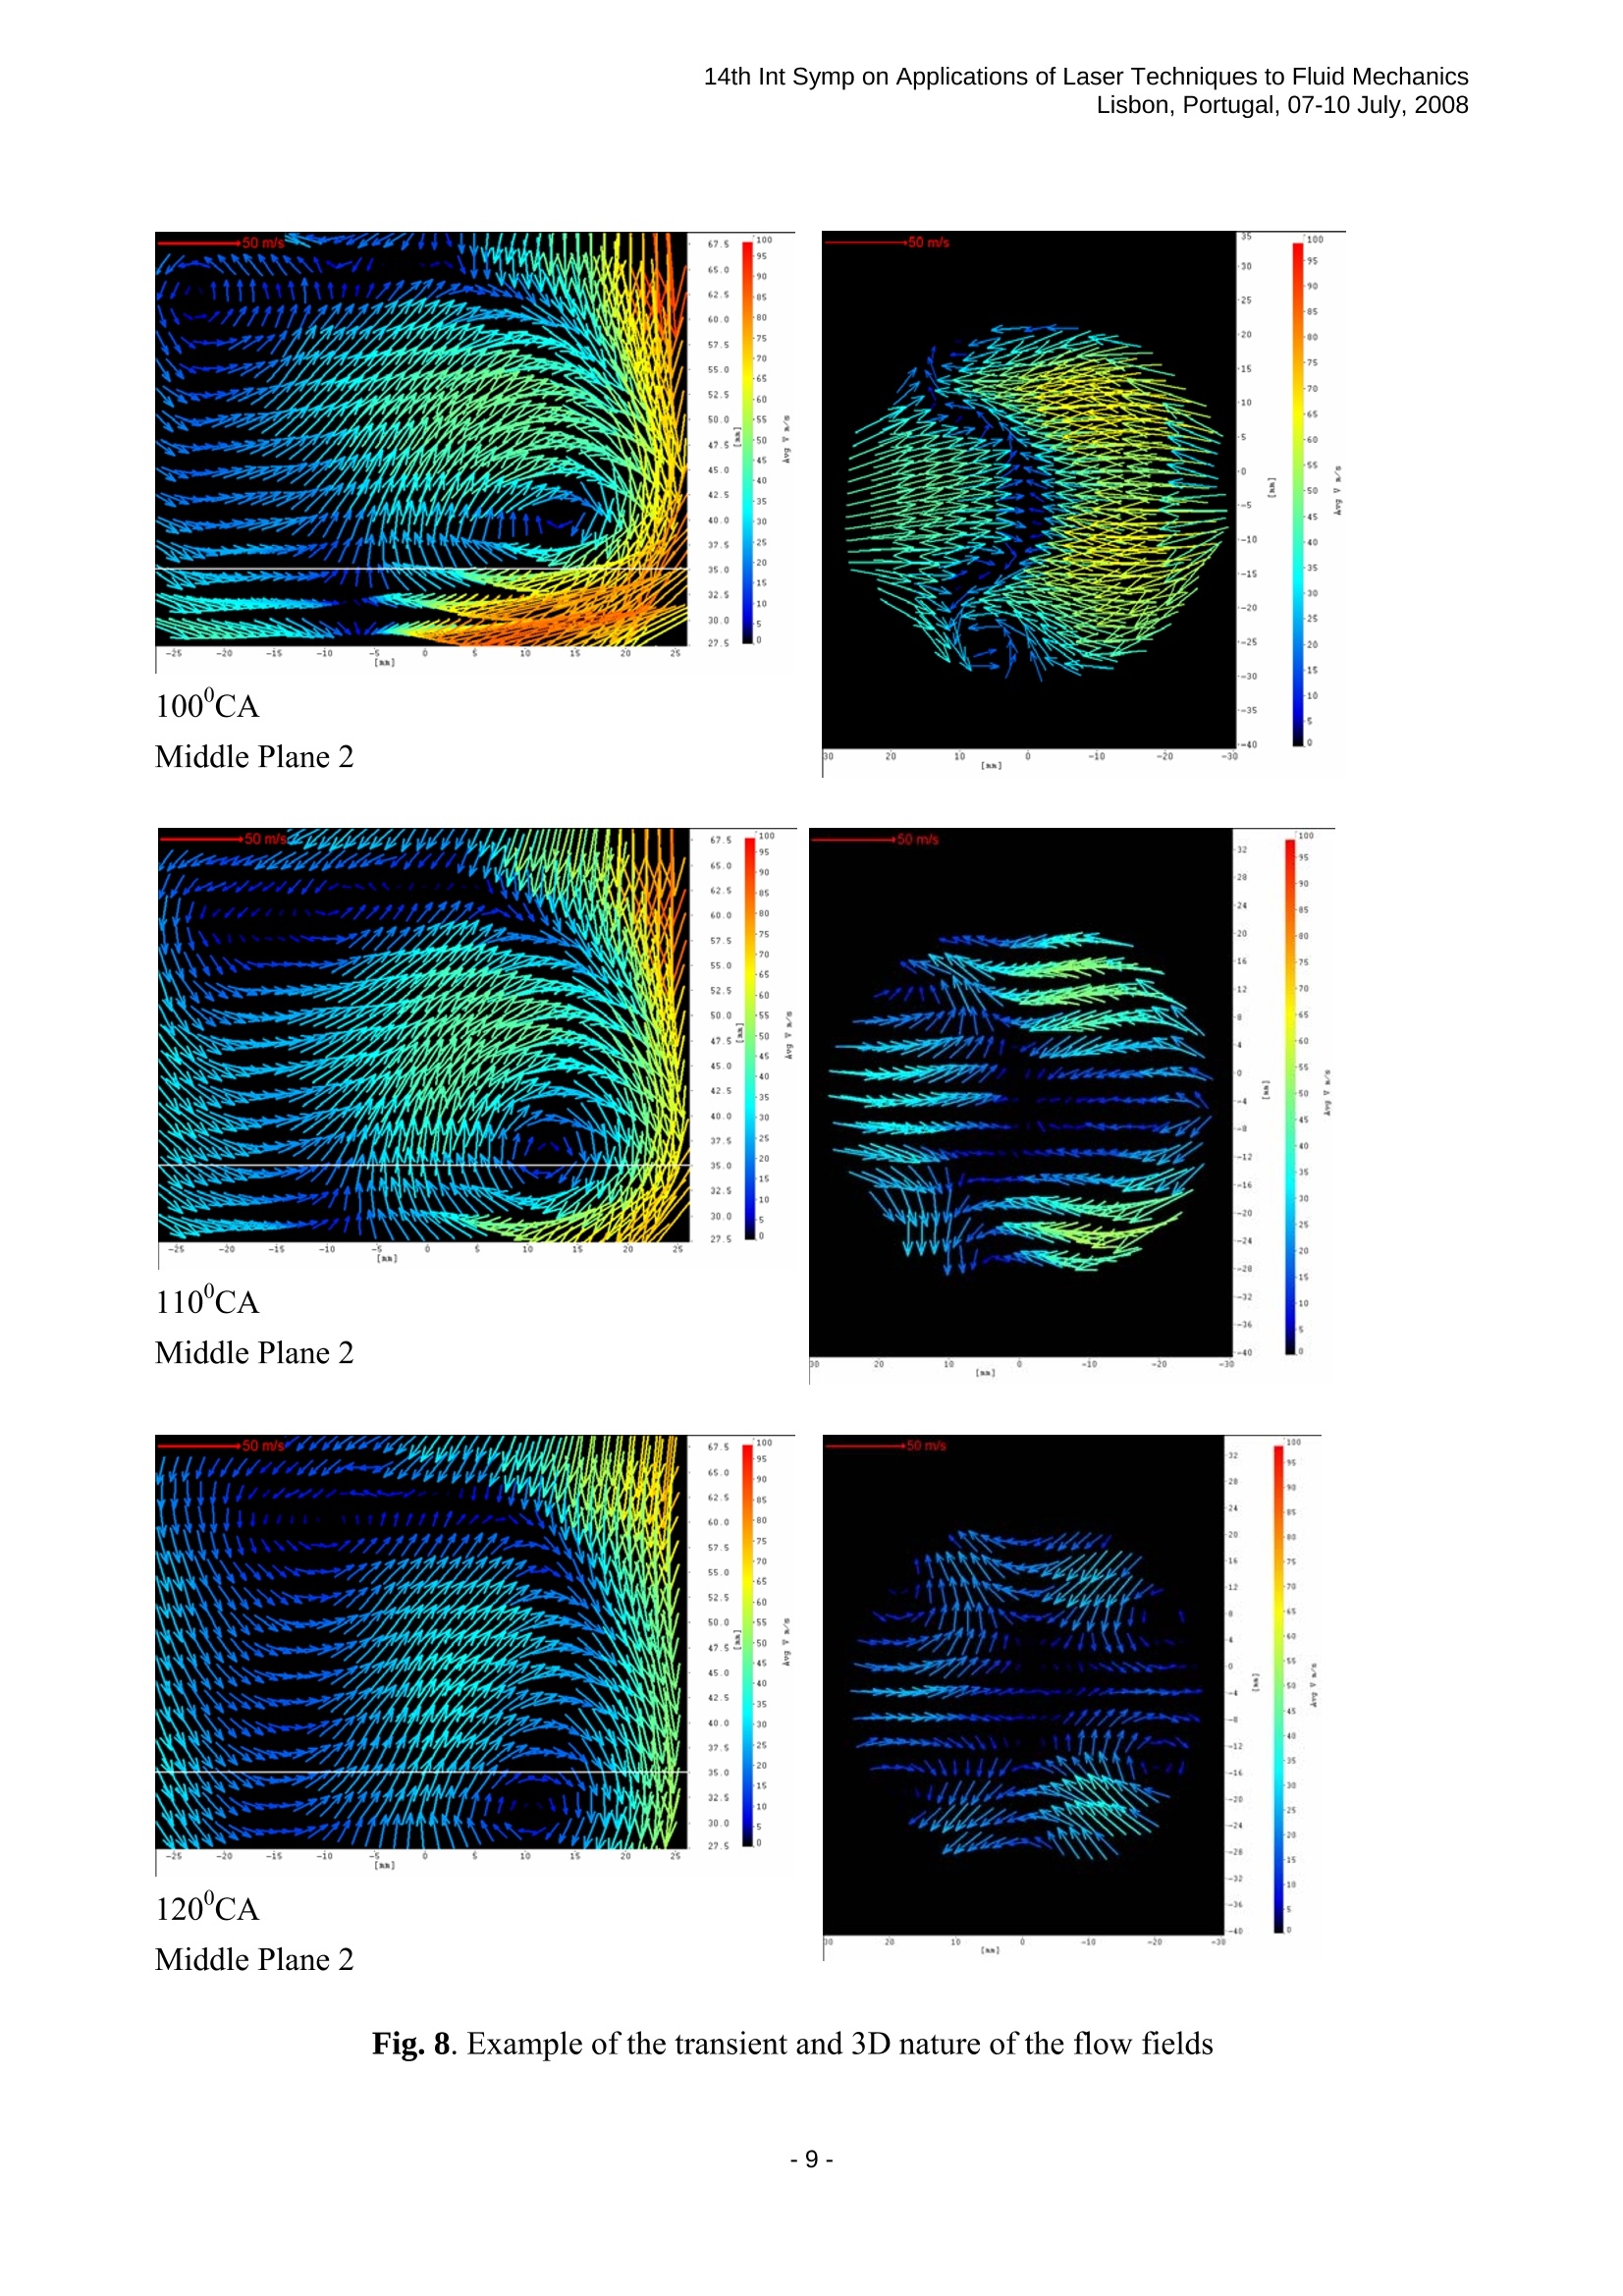
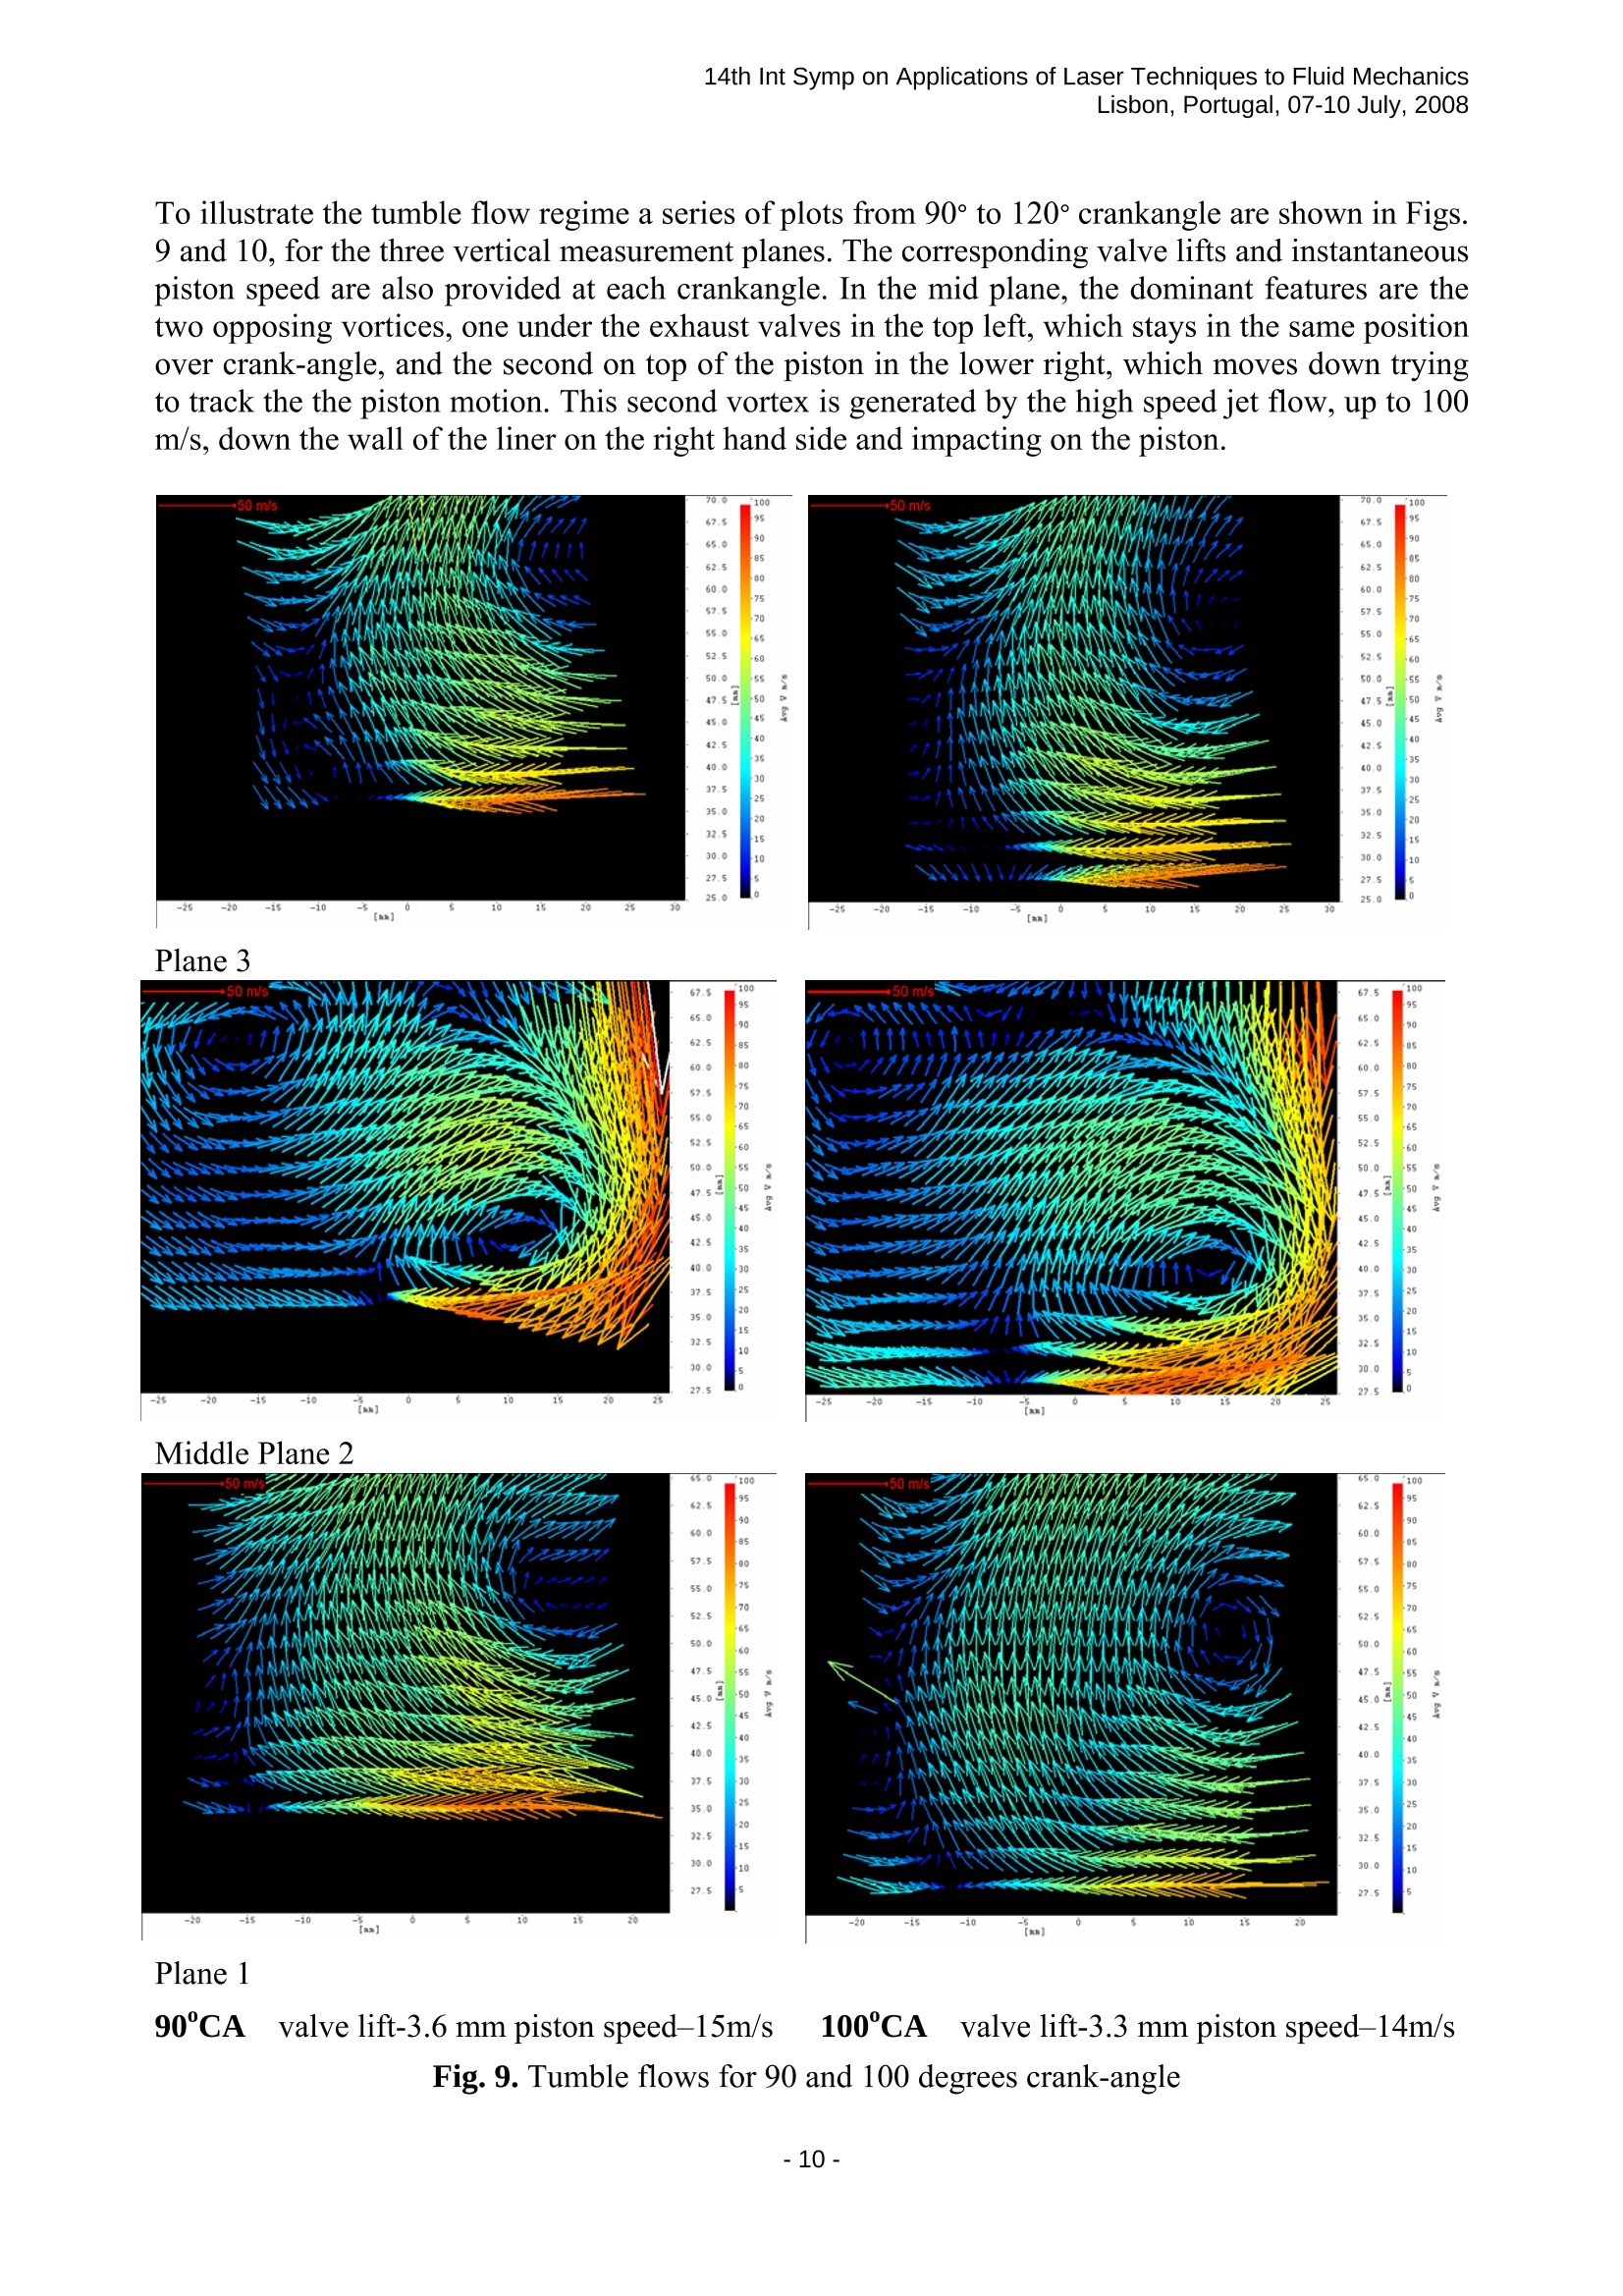
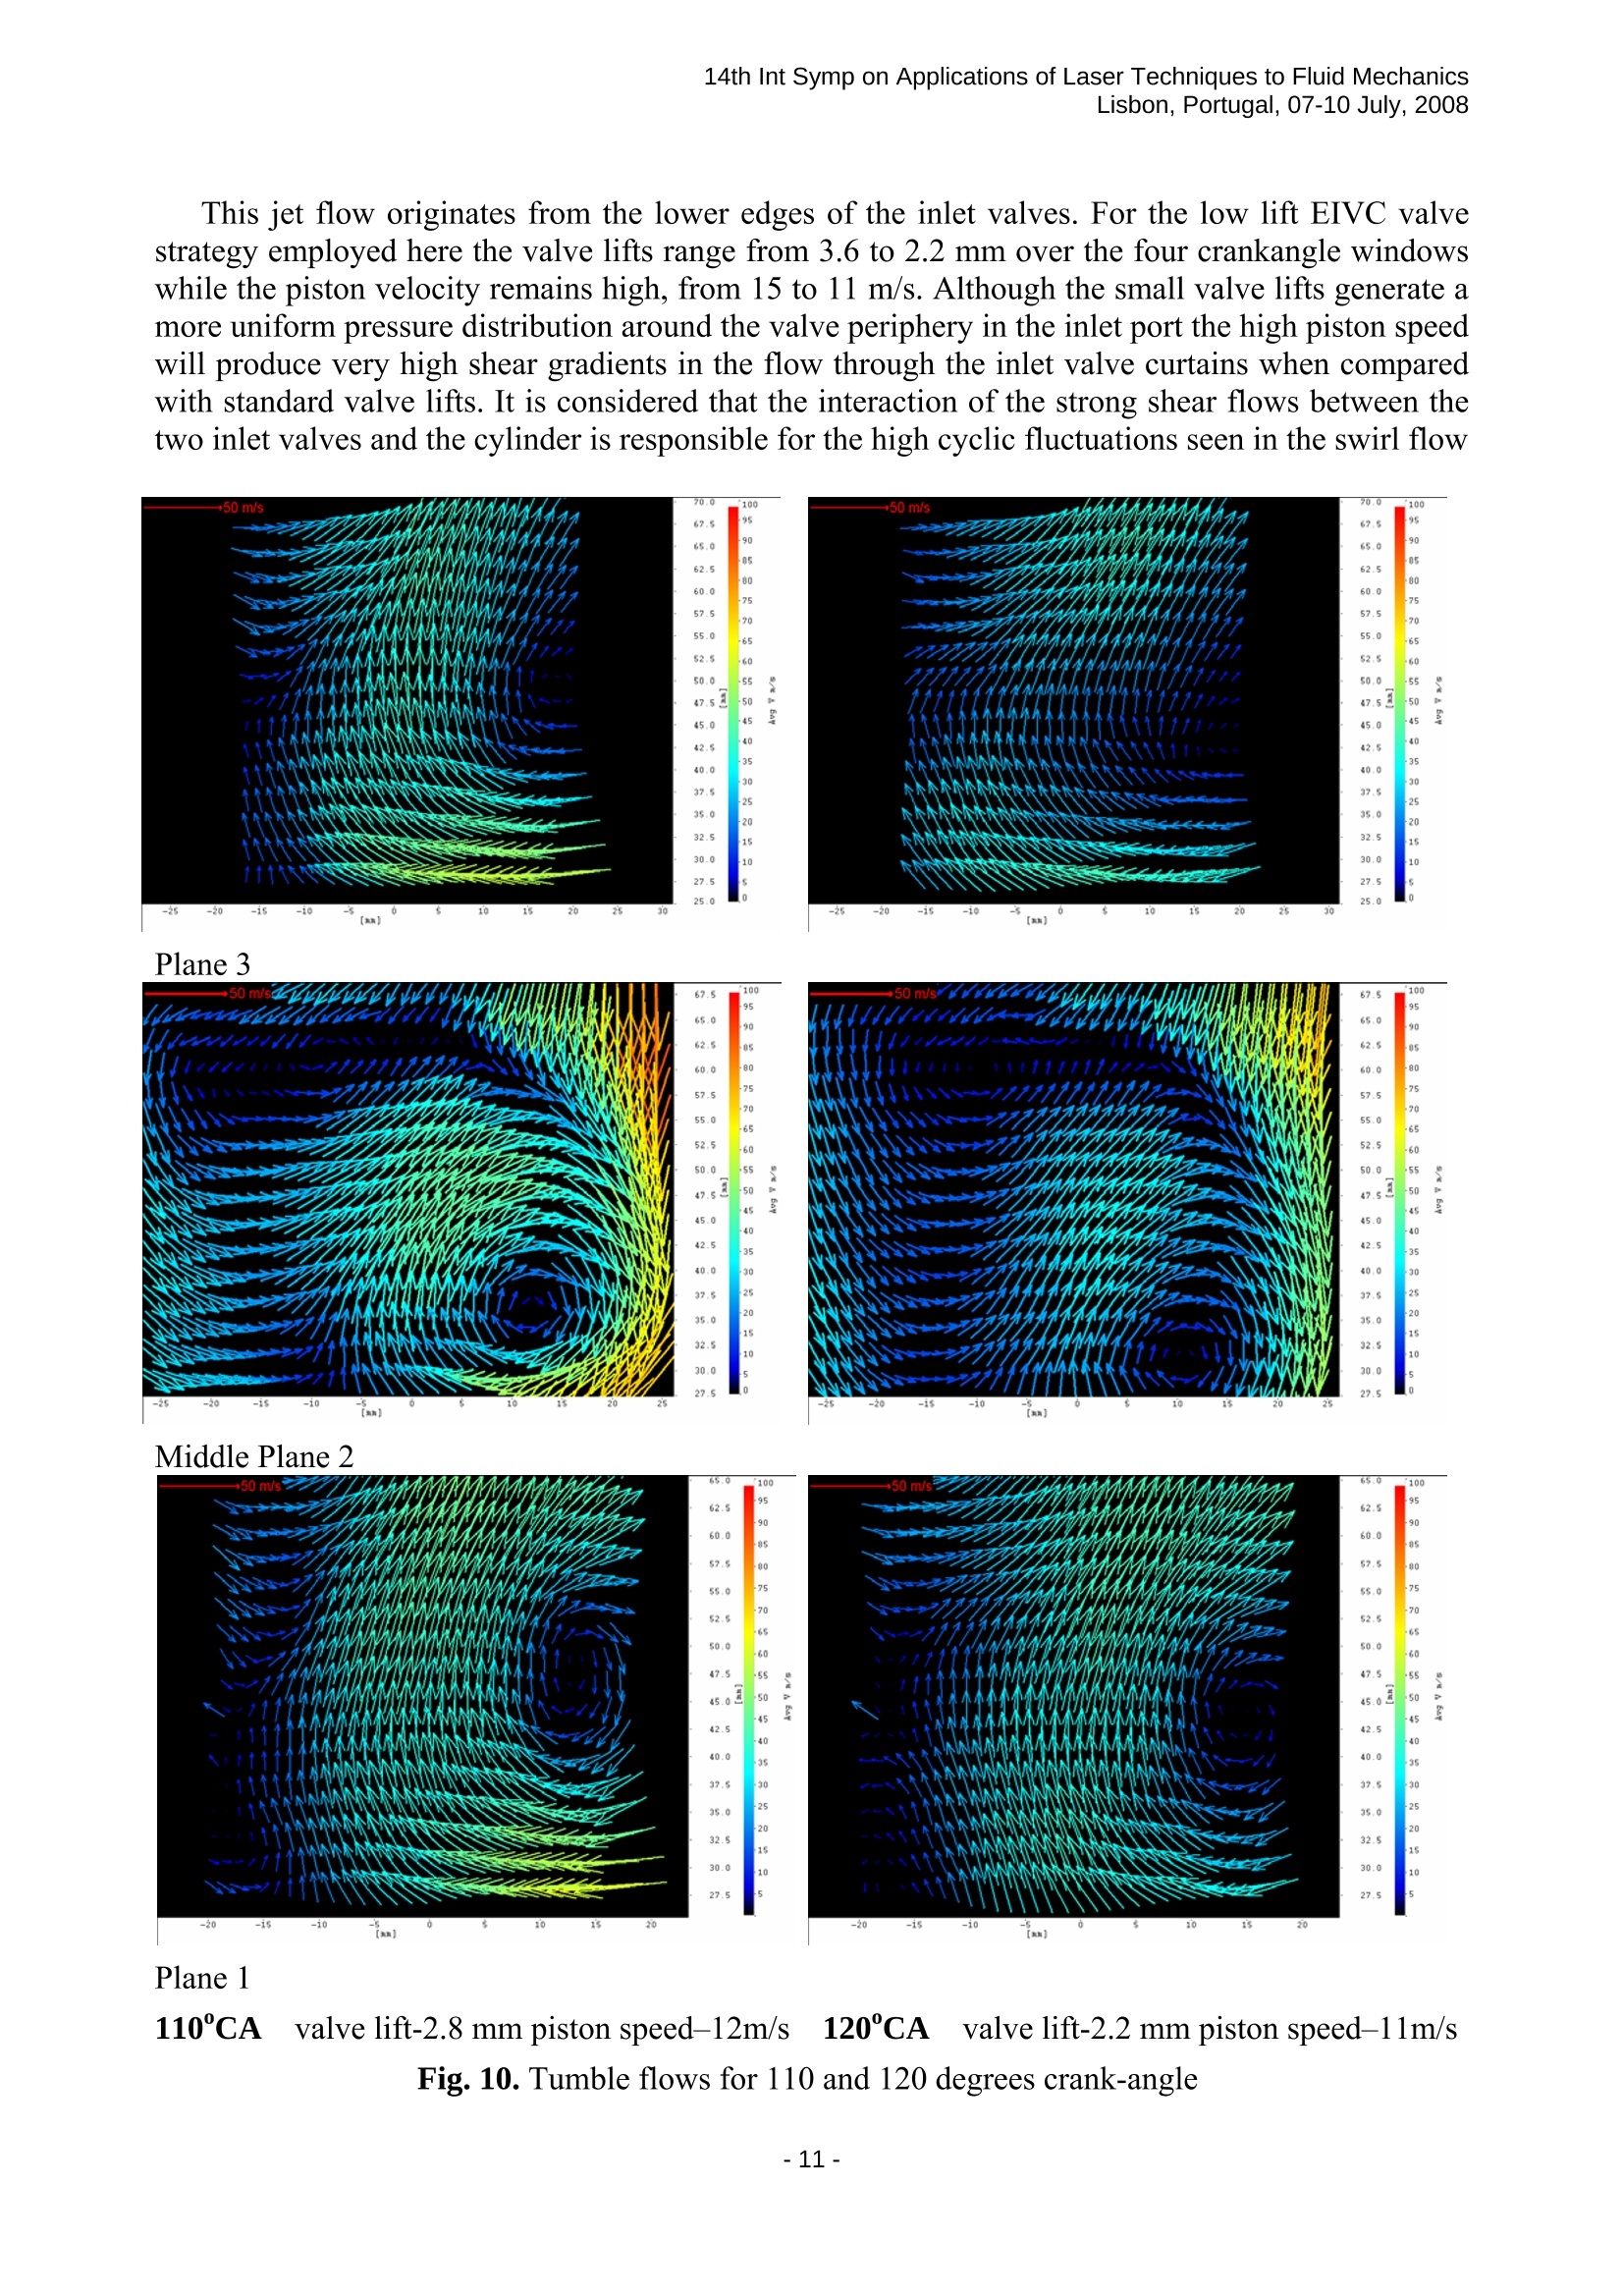
14th Int Symp on Applications of Laser Techniques to Fluid MechanicsLisbon, Portugal, 07-10 July, 2008 A Multi -plane PIV Analysis of In-Cylinder Flow Structures in an OpticalEngine under Part Load Conditions at 3500 rpm Graham Pitcher, Phil Stansfield, Graham Wigley’and Dave Hollis’ 1: Powertrain Research, Lotus Engineering Ltd, Hethel, Norwich, UK, gpitcher@lotuscars.co.uk 2: Aeronautical and Automotive Engineering, Loughborough University, Leics, UK, g.wigley@lboro.ac.uk 3: LaVision UK Ltd, Grove Technology Park, OX12 9FF, UK, d.hollis@lavision.com AbstractWithin the framework of an investigation into valve operating strategies for homogeneous chargedirect injection spark ignition engines under part load conditions this paper discusses the in-cylinder flowfields developed by running an optical engine with an early inlet valve closing strategy with a lift of 3.9 mmthat produces 3bar IMEP at 3500 rpm under firing conditions. The experimental facilities are similar toprevious work but measurement technique has been optimized with the significant aspect of this work beingthat the flow fields were determined in three vertical planes and one horizontal plane to highlight the threedimensional and the highly cyclic nature of the flow. These characteristics have significant impact onthe application of the PIV technique and data processing to ensure a high degree of confidence inthe flow fields generated. The time varying nature of this three dimensional flow field is discussed andhow it impacts on the PIV measurement technique particularly as regards data acquisition and dataprocessing. The true extent of the complex three dimensional flow field is readily seen and that, even thoughthe combustion chamber geometry is symmetrical, the swirl flow field is not. The main features of thevertical flow structure are described over a crankangle period from 90CA to 120℃A whichhighlight the dominant feature as being a wall jet flow which interacts with the piston crown togenerate a strong reverse tumble flow. 1.Introduction In-cylinder PIV measurements have been previously reported in an unthrottled 4-valve singlecylinder optical gasoline direct injection engine motored at speeds of 750, 2000 and 3500 rpm [1].Mean vector flow fields were produced during the latter half of the intake stroke in the symmetryplane between the valve pairs and tumble ratios presented. Within the framework of aninvestigation into valve operating strategies for homogeneous charge direct injection spark ignitionengines under part load conditions this paper discusses the in-cylinder flow fields developed byped byrunning the engine un-throttled with an early inlet valve closing strategy and valve lift of 3.9 mmthat produces 3bar IMEP at 3500 rpm under fi...11:+1,ring conditions. Unthrottled engine operation withvariable intake valve lift, duraValtion and timing is seen as a potential candidate for improving partload engine efficiency [2]. The experimental facilities are similar to those reported in [1] but the measurement technique asapplied here has been optimised with a significant benefit for this work in the determination of theflow fields in three vertical planes and one horizontal plane to highlight the cyclic variability andthe three dimensional nature of the flow. The time varying nature of these high speed, three dimensional flow fields with strong cyclicvariations is well known, [3, 4 and 5], and will be discussed here in terms of its impact on the PIVmeasurement technique and data processing. This will be followed by a description of the engineflows as a function of crankangle. 14th Int Symp on Applications of Laser Techniques to Fluid MechanicsLisbon, Portugal, 07-10 July, 2008 2. Experimental 2.1 Optical Engine The optical engine, Fig. 1, incorporated a full length fused silica liner and a sapphire window inthe piston crown to provide optical access to the cylinder and combustion chamber. A carbon fibrepiston ring maintains compression pressures, producing 22 bar at 2000 rpm with unthrottled portand standard valve timing. The four overhead poppet valves were actuated by a fully variableelectro-hydraulic valve system, the Lotus AVT, which allowed complete control of the individualvalve profiles. The engine has both primary and secondary balance shafts to allow operation atspeeds of up to 5000 rpm. Engine timing data were provided by two optical encoders, one with 0.2° resolution mountedon a 2:1 drive which represented the camshaft timing and provided the maximum resolution of thelaser diagnostic system. The second encoder provided a TDC pulse from the crankshaft and a 1.0°resolution pulse for the AVT timing electronics and the engine diagnostic system. The engine was operated at a standard test point replicating 3500 rpm and 3.0 bar IMEP wherethe IMEP was calculated over a 720°cycle to include pumping losses. The test point was achievedusing an un-throttled EIVC inlet valve strategy. Engine Geometry Bore 88.0 mm Stroke 82.1 mm Capacity 0.50 L Speed 3500 rpm Compression Ratio 10:1 Pressure 25.0 bar Inlet Opening 15° BTDC Exhaust Opening 258°BTDC Max.Inlet Lift 3.9mm @ 75° Inlet Closing 172° Exhaust Closing 45° Max. Exhaust Lift 9.35 mm Fig. 1: Single Cylinder Optical Research Engine 2.2 PIV System The PIV light sheet was generated by a New Wave “Solo 120”Nd:YAG double pulsed laserproducing co-linear beams at 532 nm wavelength and approximately 50 mJ per pulse. The delaybetween pulses was varied to suit the velocity field as a function of crank-angle, and is discussedmore fully in the data processing section, 3.1. The laser beams were expanded by a cylindrical lensand reflected up through the sapphire window in the piston crown, into the engine cylinder, asshown in Fig. 2. The aim of the experiment was to measure the airflow corresponding to theinjection and mixing period over three vertical planes and one horizontal measurement plane. Thevertical measurement planes were parallel to the symmetry plane but were referenced to the midpoint between the spark plug and injector to avoid reflections from them, Plane 2, and 17 mm eitherside, Planes 1 and 3, as shown in Fig. 3. A LaVision Flowmaster 3 fast shutter CCD camera with a Nikon 60 mm Macro lens wasfocused on a region of the light sheet approximately 55 mm by 45 mm with a resolution of 1280 by1024 pixels which was centered axially on a point 52.5 mm above the position of the piston crownwhen at BDC. The field of view of the vertical image plane is shown in Fig. 4. The reduced field ofview, compared with the cylinder bore diameter, is beneficial as regards minimizing lineraberrations and low light levels which would cause the accuracy of piv data to decrease [6].Thecamera and laser system were controlled remotely through LaVision’s ‘DaVis 7.0’software. For the measurements in the horizontal plane the laser and camera were interchanged with thelight sheet entering through the fused silica liner and the camera viewing up via the 45 degreemirror. The location of the horizontal light sheet in the vertical plane was set to intersect with thepiston crown at 90ATDC, i.e. 35 mm above the piston crown at BDC as shown in Fig. 4. With planes 1 and 3 offset from the cylinder axis the field of view is limited by the cylindercurvature while the field of view for the horizontal plane is limited by the 55 mm diameter windowin the piston crown as well as any masks applied during the PIV processing. Fig. 2 Schematic of optical engine and PIV system The intake airflow was seeded by silicon oil droplets of approximately 1 um diameter from aScitek seeding unit operating at 2 bar. The droplets were introduced into the intake port throughfour radial equally spaced fittings. The number of Laskin nozzles in the seeder was adjusted tocontrol the seeding density, until 5-10 seeding particles could be seen in a typical 64 px by 64 pxinterrogation area. Fifty one image pairs were captured at each crank angle to ensure sufficient images for areliable mean flow field without requiring excessively long experimental runs. La Vision’s“DaVis7.0”PIV software was used to cross-correlate the image pairs. An image calibration was performed,to reduce the aberration caused by imaging through the cylindrical liner and background noise oneach image was minimized by subtracting a mean background intensity calculated using the firstfive images of the dataset. A multi-pass cross-correlation algorithm was used to compute the vector fields from theremaining 46 images recorded on each sequential cycle. The first correlation employed a 128 px by128 px interrogation area size with 50% overlap. A second, higher resolution, correlation thenutilized a 64 px by 64 px interrogation area size also with 50% overlap. Two passes of the particleimage were made for each interrogation area size. This technique yielded 46 crank angle resolvedvector fields with a 32 by 32 px resolution, i.e. approximately one vector every millimetre. Meanvector fields were then calculated for each crank angle position. Tumble flow field data were obtained for a crankangle range from 50°ATDC on the inlet stroketo 50°BTDC compression, while the swirl flow field data are restricted from 100° ATDC to 100°BTDC due to the light sheet being below the piston crown. 3. Results and Discussion The PIV flow fields chosen for presentation here are restricted to the crank-angles where thepiston crown is below the swirl measurement plane,where the axial velocities are up to 100 m/s andthe instantaneous piston speed is above 10 m/s. 3.1 PIV Data Processing There are several aspects of image quality and data processing that need to be considered whenprocessing the images collected from high speed in-cylinder measurements. One decision to betaken is made before the data collection even starts, and that is the time between laser pulsesrequired to capture the velocity field. In an engine, measurements will be typically made at severalengine speeds, and this variation will have an impact on the magnitude of the vectors to bemeasured. Therefore, it is necessary to change the time between pulses for the different enginespeeds. Although the work presented here is only at one speed, to accommodate the changesobserved in the velocity field versus crank-angle, it was necessary to use different delay times withcrank-angle to accurately capture these velocity fields. During the first part of the inlet stroke, where there was a fast incoming jet through the inlet valves, the delay time was set to 3us. This wasincreased to 5us for the end part of the induction stroke and the beginning of the compressionstroke, as the flow field decayed, and was increased even further, to 10us, during the remainder ofthe stroke as the velocity field continued to decay in magnitude. These times utilized for the axialmeasurements had to be changed again to reflect the different magnitudes observed in the horizontalplane, where the delay times used were 10us, 15us and 20us for the corresponding parts of theengine cycle. The use of a variable delay time proved to be an enabling technique for thesemeasurements at high engine speeds. The axial/radial components of velocity have been measured through the cylinder liner, and sosuffer from a distortion effect due to the curved surfaces of the liner which obviously increases withradius. To correct for this a calibration mask with known marker positions is placed in the liner andan image collected. The software can then calculate a de-warping function to correct for thedistortion caused by the curved surfaces. The second pre-processing technique involved subtracting the background image. Thisincreased the signal to noise ratio during the correlation. As subtraction of a reference image wouldnot account for the seeding deposits accumulating on the liner, DaVis’dynamic backgroundsubtraction, known as ‘subtract sliding minimum over time’ was used instead. This took a specifiednumber of images, typically five, from the start of the dataset, and calculated the minimum intensityat each pixel location. This produced a new image, Imin which was then subtracted from the middleimage of the five images. A new Imin was then calculated for images 2 to 6 and this was subtractedfrom image four. The process continued for all images of the dataset. Although this techniquereduced the number of images available for analysis, (by four in this example), sufficient imagesfrom the engine were taken (typically 50), for this to be insignificant. With a running engine, even under motored conditions, there is the problem of window foulingover time, which can have a detrimental effect on the ima1ege quality, leading to a smearing in theimages, Fig. 5. The upper and lower left hand plots show images collected through a dirty windowand a clean window respectively, while the right hand plots show the corresponding vector plots,using only standard processing, obtained from these images. Despite the top image havingseemingly considerable smearing effects, it has still been possible for the software to extract anacceptable vector field. However, it is considered that the window integrity is close to the limitwhere acceptable image quality can be captured. The upper image in Fig.5 also shows the importance of accurate masking of the image beforeprocessing, to ensure that only those parts of the image containing real data are processed. In themagnified part of the image a reflection of particles can be seen in the sapphire piston crown, wherethe laser light is input. Additionally, there are some bright flare spots where the laser beam isimpinging on deposits on the window. All of these parts of the image have to be masked out toobtain good quality and reliable velocity vector information. The left hand, raw data, images also shows the difference in seeding density that occurs in anengine cylinder, where the in-cylinder volume is changing with time. This gives a different numberof particle pairs in the interrogation region at different times in the engine cycle. For this work, itwas attempted to have a minimum of 5 particle pairs per interrogation area, and this had to be set atthe point in the engine cycle with the lowest seeding density, typically bottom dead centre, butpossibly later if a significant amount of seeding vaporization was taking place on the compressionstroke.。 Raw image at 90 CA showing smearing Vector field using standard processing 6 ·44 6056·52484036 32 100 90 80 0 5040 30 20 10 Raw image at 130 CA after cleaning Vector field using standard processing Fig. 5. The effects of smeared images Careful setup and alignment of the PIV system gave between 90% to 95% first choice vectorsfor each image pair collected, i.e., for these vectors the main peak of the cross correlation functionwas substantially above the next highest peak. However, to further improve the consistency acrossthe whole vector field, a search for rogue vectors was performed using two different filters. The firstfilter used was a median filter, where the median and RMS values of the surrounding 8 vectors wasfound,and the central vector was only accepted if it fell between the median minus the RMS andthe median plus the RMS. The results of this filter are shown for the single cycle flow fields, (a), (b)and(c) in the left hand column of Fig. 6. In regions of high turbulence, where the RMS value forthe surrounding vectors can be expected to be high, this filter fails to remove all the rogue vectors. To help overcome these limitations a second filter was tried, termed a de-noise filter. This fits apolynomial function through each vector and its surrounding vectors, ignoring specified outliers toensure rogue vectors are not used to calculate the curve. This curve is then used to de-noise thevector field. This is a stronger filter than the median filter but can be more successful in identifyingrogue vectors. The disadvantage of this filter is that it can introduce smoothing and so erode steepvelocity gradients. However, for regions without any rogue vectors these velocity gradients wouldbe preserved. The results of this filter, for the same set of data, are shown in (d), (e) and (f) in theright hand column of Fig.6. It can clearly be seen that the flow fields have a smoother and moreconsistent look to them. The advantage of this filter is for when single cycle images are beingstudied, the cycle to cycle variation in a spark ignition engine is well known and can be readilyidentified in Fig. 6. The means from 46 image pairs are shown in Fig. 7, where the left hand plothas used the median filter and the right hand plot has used the de-noise filter. For these mean plotsit can be seen that the choice of filter has no visible effect on the final processed vector field. 50m/s 100 30 25 85 80 -75 70 61 -59 4-49 [nm] (d) 50 m/s ·30 25 20 00 -15 -75 -10 50 -5 -45 -10 -15 --20 -=25 -30 -35 -10 [nx] (e) 00 -30 +=35 10 -10 [nm [N] (c) (f) Median filter 110 CA De-noise filter 110 CA Fig. 6. The effects of median and de-noise filters on single cycle data Mean from 46 image pairs with median filter Mean from 46 image pairs with de-noise filter 110 CA 110 CA Fig. 7. Mean velocity field with two choices of data filter 3.2 Discussion of Results The highly cyclic nature of the generated flow fields obtained with the de-noise filter has beenseen in Fig. 6. One of the most noticeable features of this cyclic variation is the change in positionsof individual vortex centres, i.e. it is the structure of the flow itself that changes while themagnitude of the velocity vectors remains fairly constant. The main cause for this can be seen in thehigh speed flows in the upper right and then the lower right of the flow fields in (C) and (d) of Fig.6. These flows originate through the inlet valves 3 and 1 respectively and shows that in some cyclesone valve dominates the flow and can then switch for the next cycle, whereas Fig. 7 shows that thisbehaviour averages out over time. Previous experiments have shown that a minimum of 30 cyclesof data are required to enable a stable mean flow to be calculated, however, due to these fluctuatingflow patterns in the swirl plane this work suggests that the absolute minimum should be 50 imagepairs. The plots in Fig. 8 show the axial/radial components of mean velocity in the left hand column atthree different crank-angles, 100, 110 and 120 degrees, for the mid plane measurements. The righthand column shows the corresponding plots in the horizontal plane which transects the verticalplane at the 35 mm level. Over this time period, the vortex in the bottom right hand part of thevertical vector flow field passes through the swirl plane. This causes a complete change in the flowstructure through the swirl plane with time and the direction of the principal vectors in thehorizontal plane. This moving vortex is an example of the transient nature of these flows which inturn leads to the highly three dimensional nature of the flows. In the vertical measurement planes, itcan also be seen that apart from the mid plane, there is a substantial third component of velocity andseveral horizontal vortices. This of course has an additional impact on the time between laser pulsesthat can be utilized to ensure that sufficient particles are captured in both images for the crosscorrelation. The conclusion from these horizontal velocity components is that there is a twodimensional flow in the mid plane region, with a substantial third component of velocity beingevident in the other two measured vertical planes. 100 62.5 52.5 50.0 47-592 45.0 37.5 100℃A Middle Plane 2 [3] 110CAMiddle Plane 2 120°CA -36 Middle Plane 2 [mm】 Fig. 8. Example of the transient and 3D nature of the flow fields To illustrate the tumble flow regime a series of plots from 90° to 120°crankangle are shown in Figs.9 and 10, for the three vertical measurement planes. The corresponding valve lifts and instantaneouspiston speed are also provided at each crankangle. In the mid plane, the dominant features are thetwo opposing vortices, one under the exhaust valves in the top left, which stays in the same positionover crank-angle,and the second on top of the piston in the lower right, which moves down tryingto track the the piston motion. This second vortex is generated by the high speed jet flow, up to 100m/s, down the wall of the liner on the right hand side and impacting on the piston. +50 m/s 90°CA valve lift-3.6 mm piston speed-15m/s 100CA valve lift-3.3 mm piston speed-14m/s Fig. 9. Tumble flows for 90 and 100 degrees crank-angle This jet flow originates from the lower edges of the inlet valves. For the low lift EIVC valvestrategy employed here the valve lifts range from 3.6 to 2.2 mm over the four crankangle windowswhile the piston velocity remains high, from 15 to 11 m/s. Although the small valve lifts generate amore uniform pressure distribution around the valve periphery in the inlet port the high piston speedwill produce very high shear gradients in the flow through the inlet valve curtains when comparedwith standard valve lifts. It is considered that the interaction of the strong shear flows between thetwo inlet valves and the cylinder is responsible for the high cyclic fluctuations seen in the swirl flow Plane 3 Middle Plane 2 Plane 1 110°CA valve lift-2.8 mm piston speed-12m/s120°CA valve lift-2.2 mm piston speed-11m/s Fig. 10. Tumble flows for 110 and 120 degrees crank-angle patterns of Fig. 7. As the inlet valves close the wall jet flow decays rapidly such that the maximumvelocity at 120°CA is down to 70 m/s and the penetration down the wall is significantly reduced. In planes 1 and 3, the vortex under the exhaust valve is only just visible as it sits much higher inthe cylinder and there does not appear to be much movement of the vortex centre over the fourcrankangle windows. The second vortex on the other side of the cylinder is much weaker and thereis less axial movement than for the vortex in the mid plane. This may be due to the low pressureregion that would form under the inlet valves during the inlet stroke being a more significant andstabilizing force than that generated by the downward movement of the piston. The main feature ofthese flow patterns is of a strong reverse tumble flow generated by the interaction of the wall jetflow with the piston crown. 4. Conclusions A multi -plane PIV analysis of the in-cylinder flow structures generated during the intake strokeof an engine operating with a early inlet valve closing strategy at an engine speed of 3500 rpm. Theflow patterns in three vertical planes and a one horizontal plane show that the flows structures arehighly transient and three dimensional with a high cyclic variability. These characteristics have hadsignificant impact on the application of the PIV technique and data processing to ensure a highdegree of confidence in the flow fields generated. The effects of image smearing, due to seedingdeposition, and the need for careful masking have been identified. The high speed transient natureof the flow requires the inter-frame delay time to be varied as a function of engine crankangle. Toensure a high degree of consistency for an analysis of the flow patterns on a cycle by cycle basis thePIV data have been filtered using a local polynomial filter rather than a linear median filter toremove inappropriate vectors. The main features of the flow structure has been described over acrankangle period from 90℃A to 120℃A which highlight the dominant feature as being a wall jetflow which interacts with the piston crown to generate a strong reverse tumble flow. 5. References ( [1] Stansfield, P ., Wigley, G. , Justham, T., C atto, J . a nd Pitcher, G ., ( 2007), P IV analysis of in-cylinder flow structures over a range of realistic engine speeds, E xperiments in F luids, Vol.43, No.1,pp 135-146 ) ( [2] Cleary, D. and Silvas, G., (2007),Unthrottled Engine operation with Variable Intake V a lve Lift,Duration and Timing, SAE P aper: 2007-01-1282 ) ( [3] Towers, D.P. and Towers C. E.,(2004), d C yclic variability measurements ofin-cylinder engineflows using high-speed particle image velocimetry, Meas.Sci.Technol. 15. pp.1917-1925 ) ( [4] Li, Y., Zhao,H., Peng, Z. and Ladommatos, N., (2002) Tumbling flow analysis in a four valvespark ignition engine using particle image velocimetry Int. J. Eng. Res., Vo l ume 3, Number 3, 1 , pp.139-155(17) ) ( [5] Jarvis, S., Justham, T. , Clarke, A., Garner, C.P., Hargrave, G.K. and Richardson D., (2006),Motored SI IC engine in-cylinder flow field measurement using Time resolved Digital PIV forCharacterisation of Cyclic Variation, Society of Automotive E ngineers: 2006-01-1044 ) ( [6] Reuss, D. L. , Megerle, M. and Sick, V . (2002), Particle-image velocimetry measurement errorswhen imaging through a transparent engine cylinder, Meas. Sci. Technol. 13 p.1029-1035 ) -- --
确定

还剩10页未读,是否继续阅读?

产品配置单


北京欧兰科技发展有限公司为您提供《流体,光学发动机中速度矢量场检测方案(粒子图像测速)》,该方案主要用于其他中速度矢量场检测,参考标准--,《流体,光学发动机中速度矢量场检测方案(粒子图像测速)》用到的仪器有德国LaVision PIV/PLIF粒子成像测速场仪、Imager sCMOS PIV相机
推荐专场


相关方案
更多
该厂商其他方案
更多