


The dynamics of high energetic electrons (11.7 eV) in a modified industrial
confined dual-frequency capacitively coupled RF discharge (Exelan, Lam
Research Inc.), operated at 1.937MHz and 27.118 MHz, is investigated by
means of phase resolved optical emission spectroscopy. Operating in a He–O2
plasma with small rare gas admixtures the emission is measured, with
one-dimensional spatial resolution along the discharge axis. Both the low and
high frequency RF cycle are resolved. The diagnostic is based on time
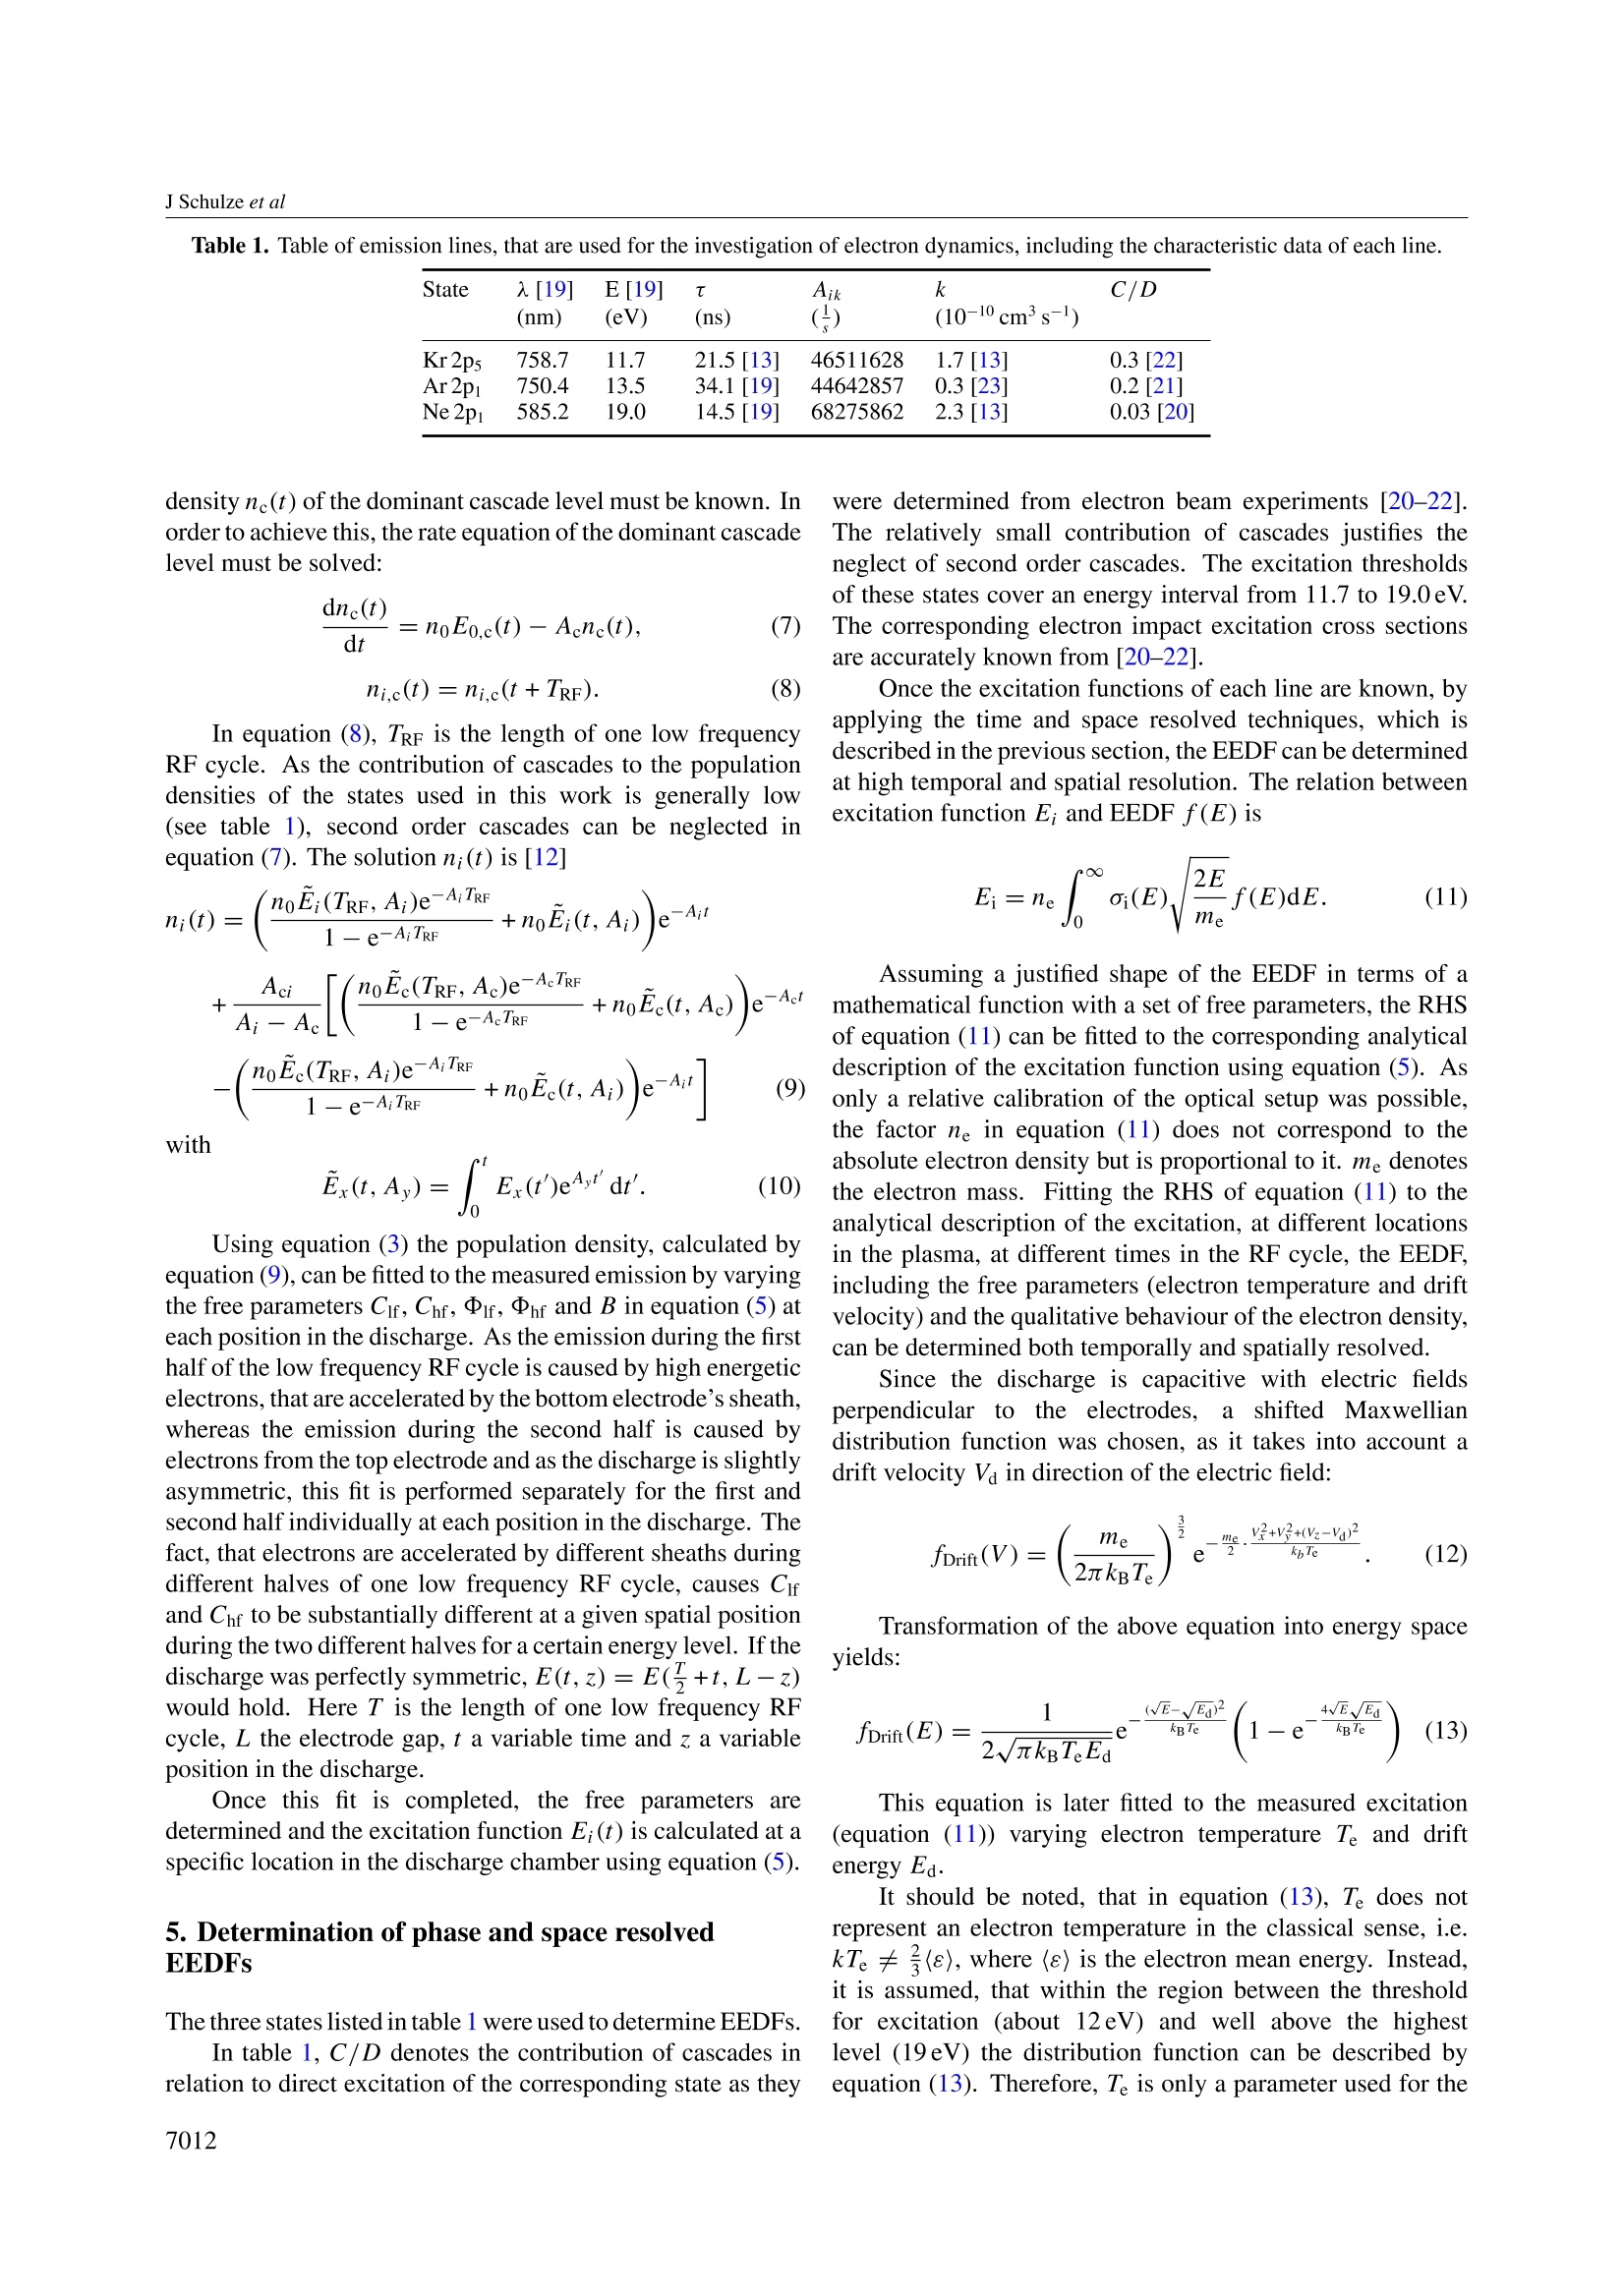
dependent measurements of the population densities of specifically chosen
excited rare gas states. A time dependent model, based on rate equations,
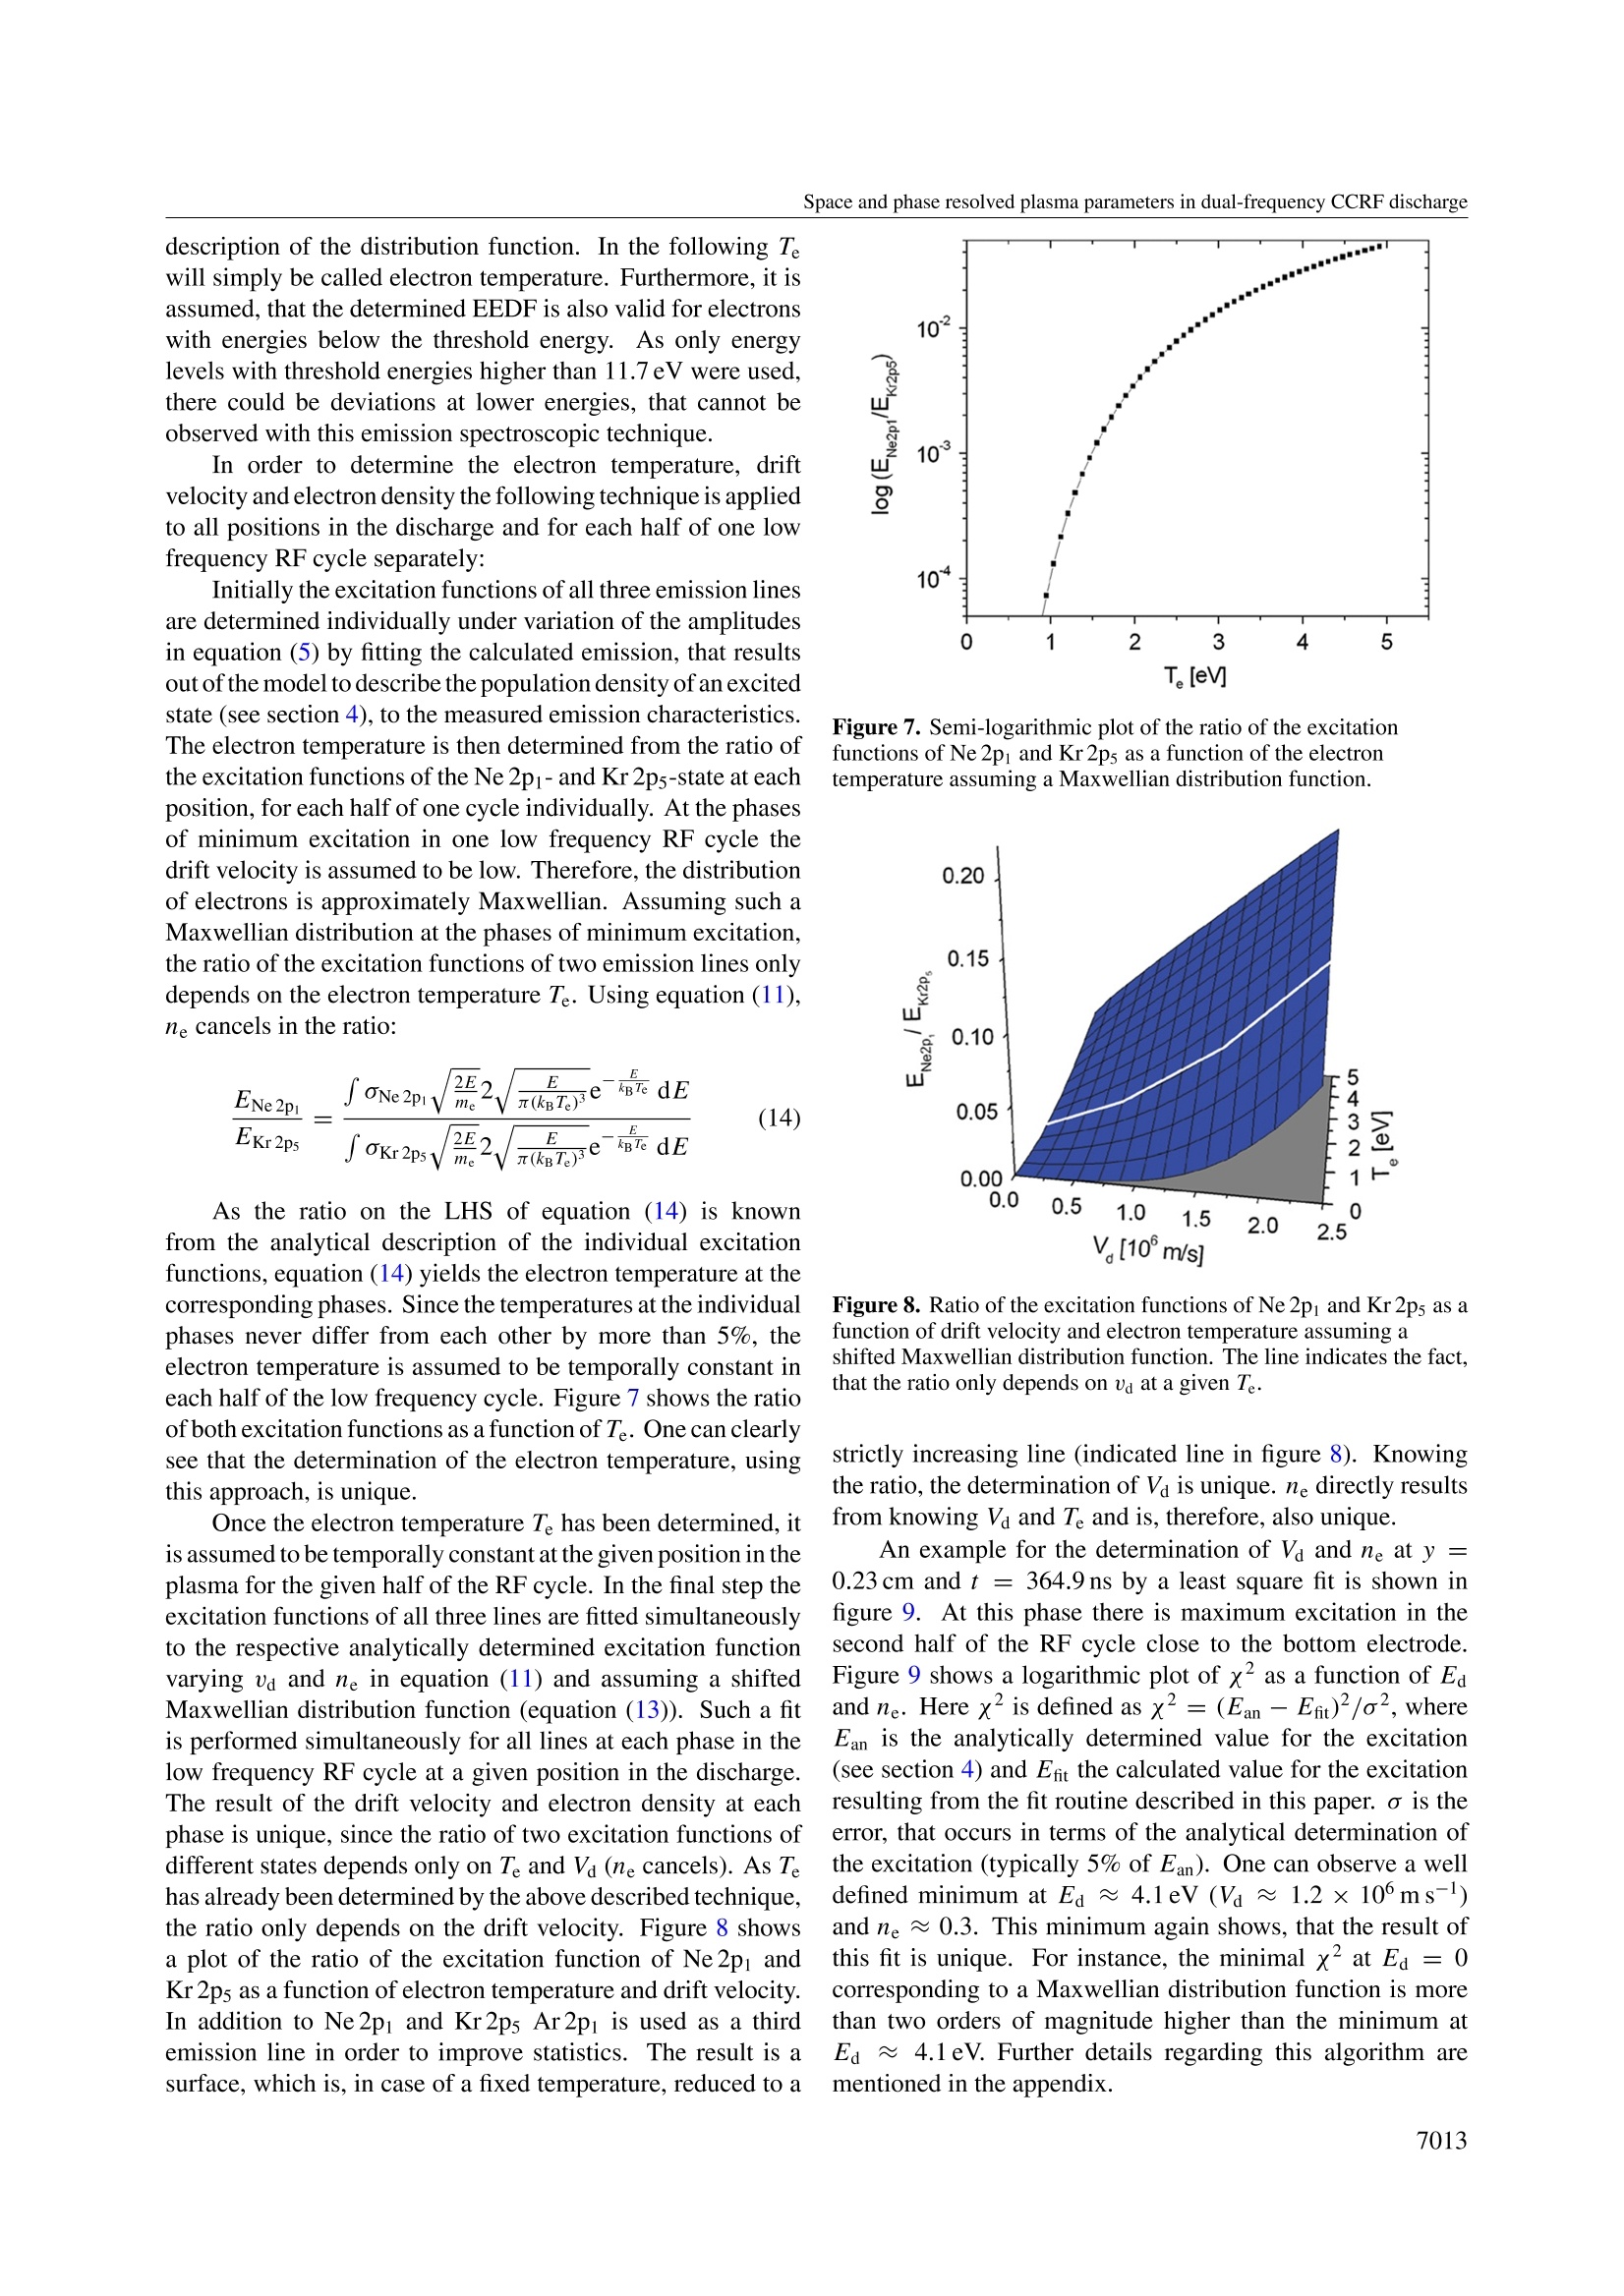
describes the dynamics of the population densities of these levels. Based on
this model and the comparison of the excitation of various rare gas states, with
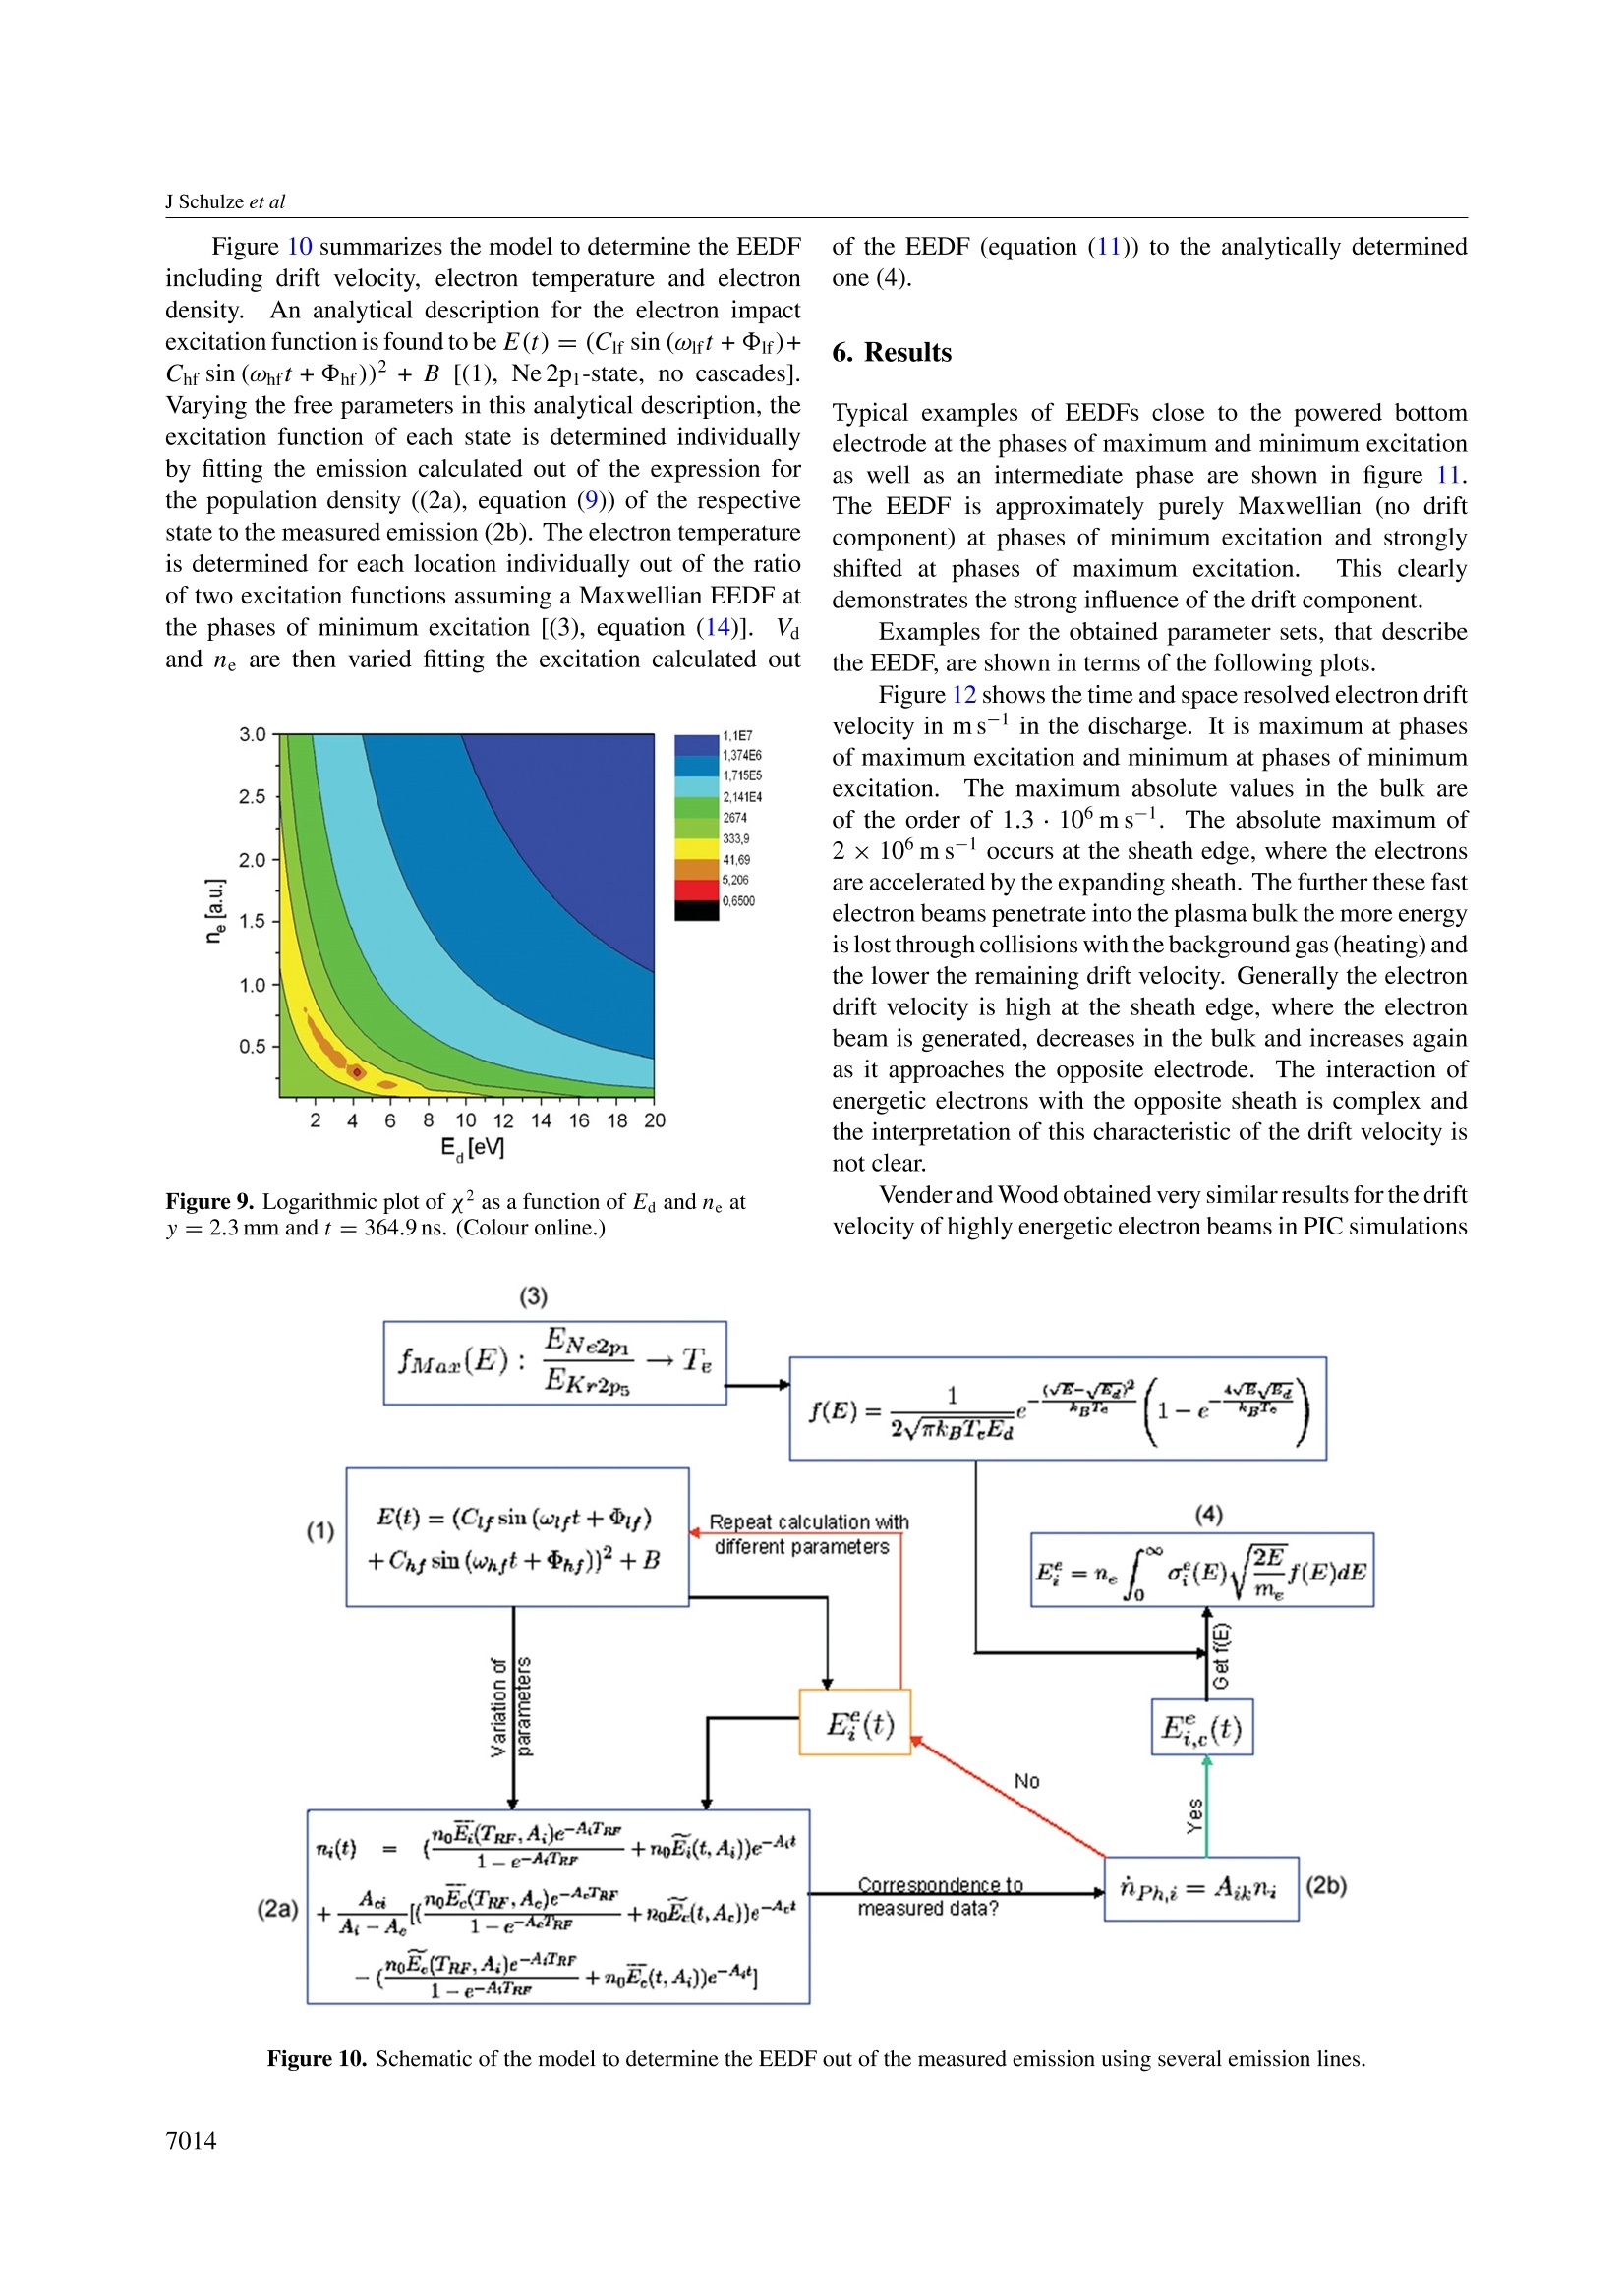
different excitation thresholds, time and space resolved electron temperature,
propagation velocity and qualitative electron density as well as electron energy
distribution functions are determined. This information leads to a better
understanding of the dual-frequency sheath dynamics and shows, that separate
control of ion energy and electron density is limited.
方案详情

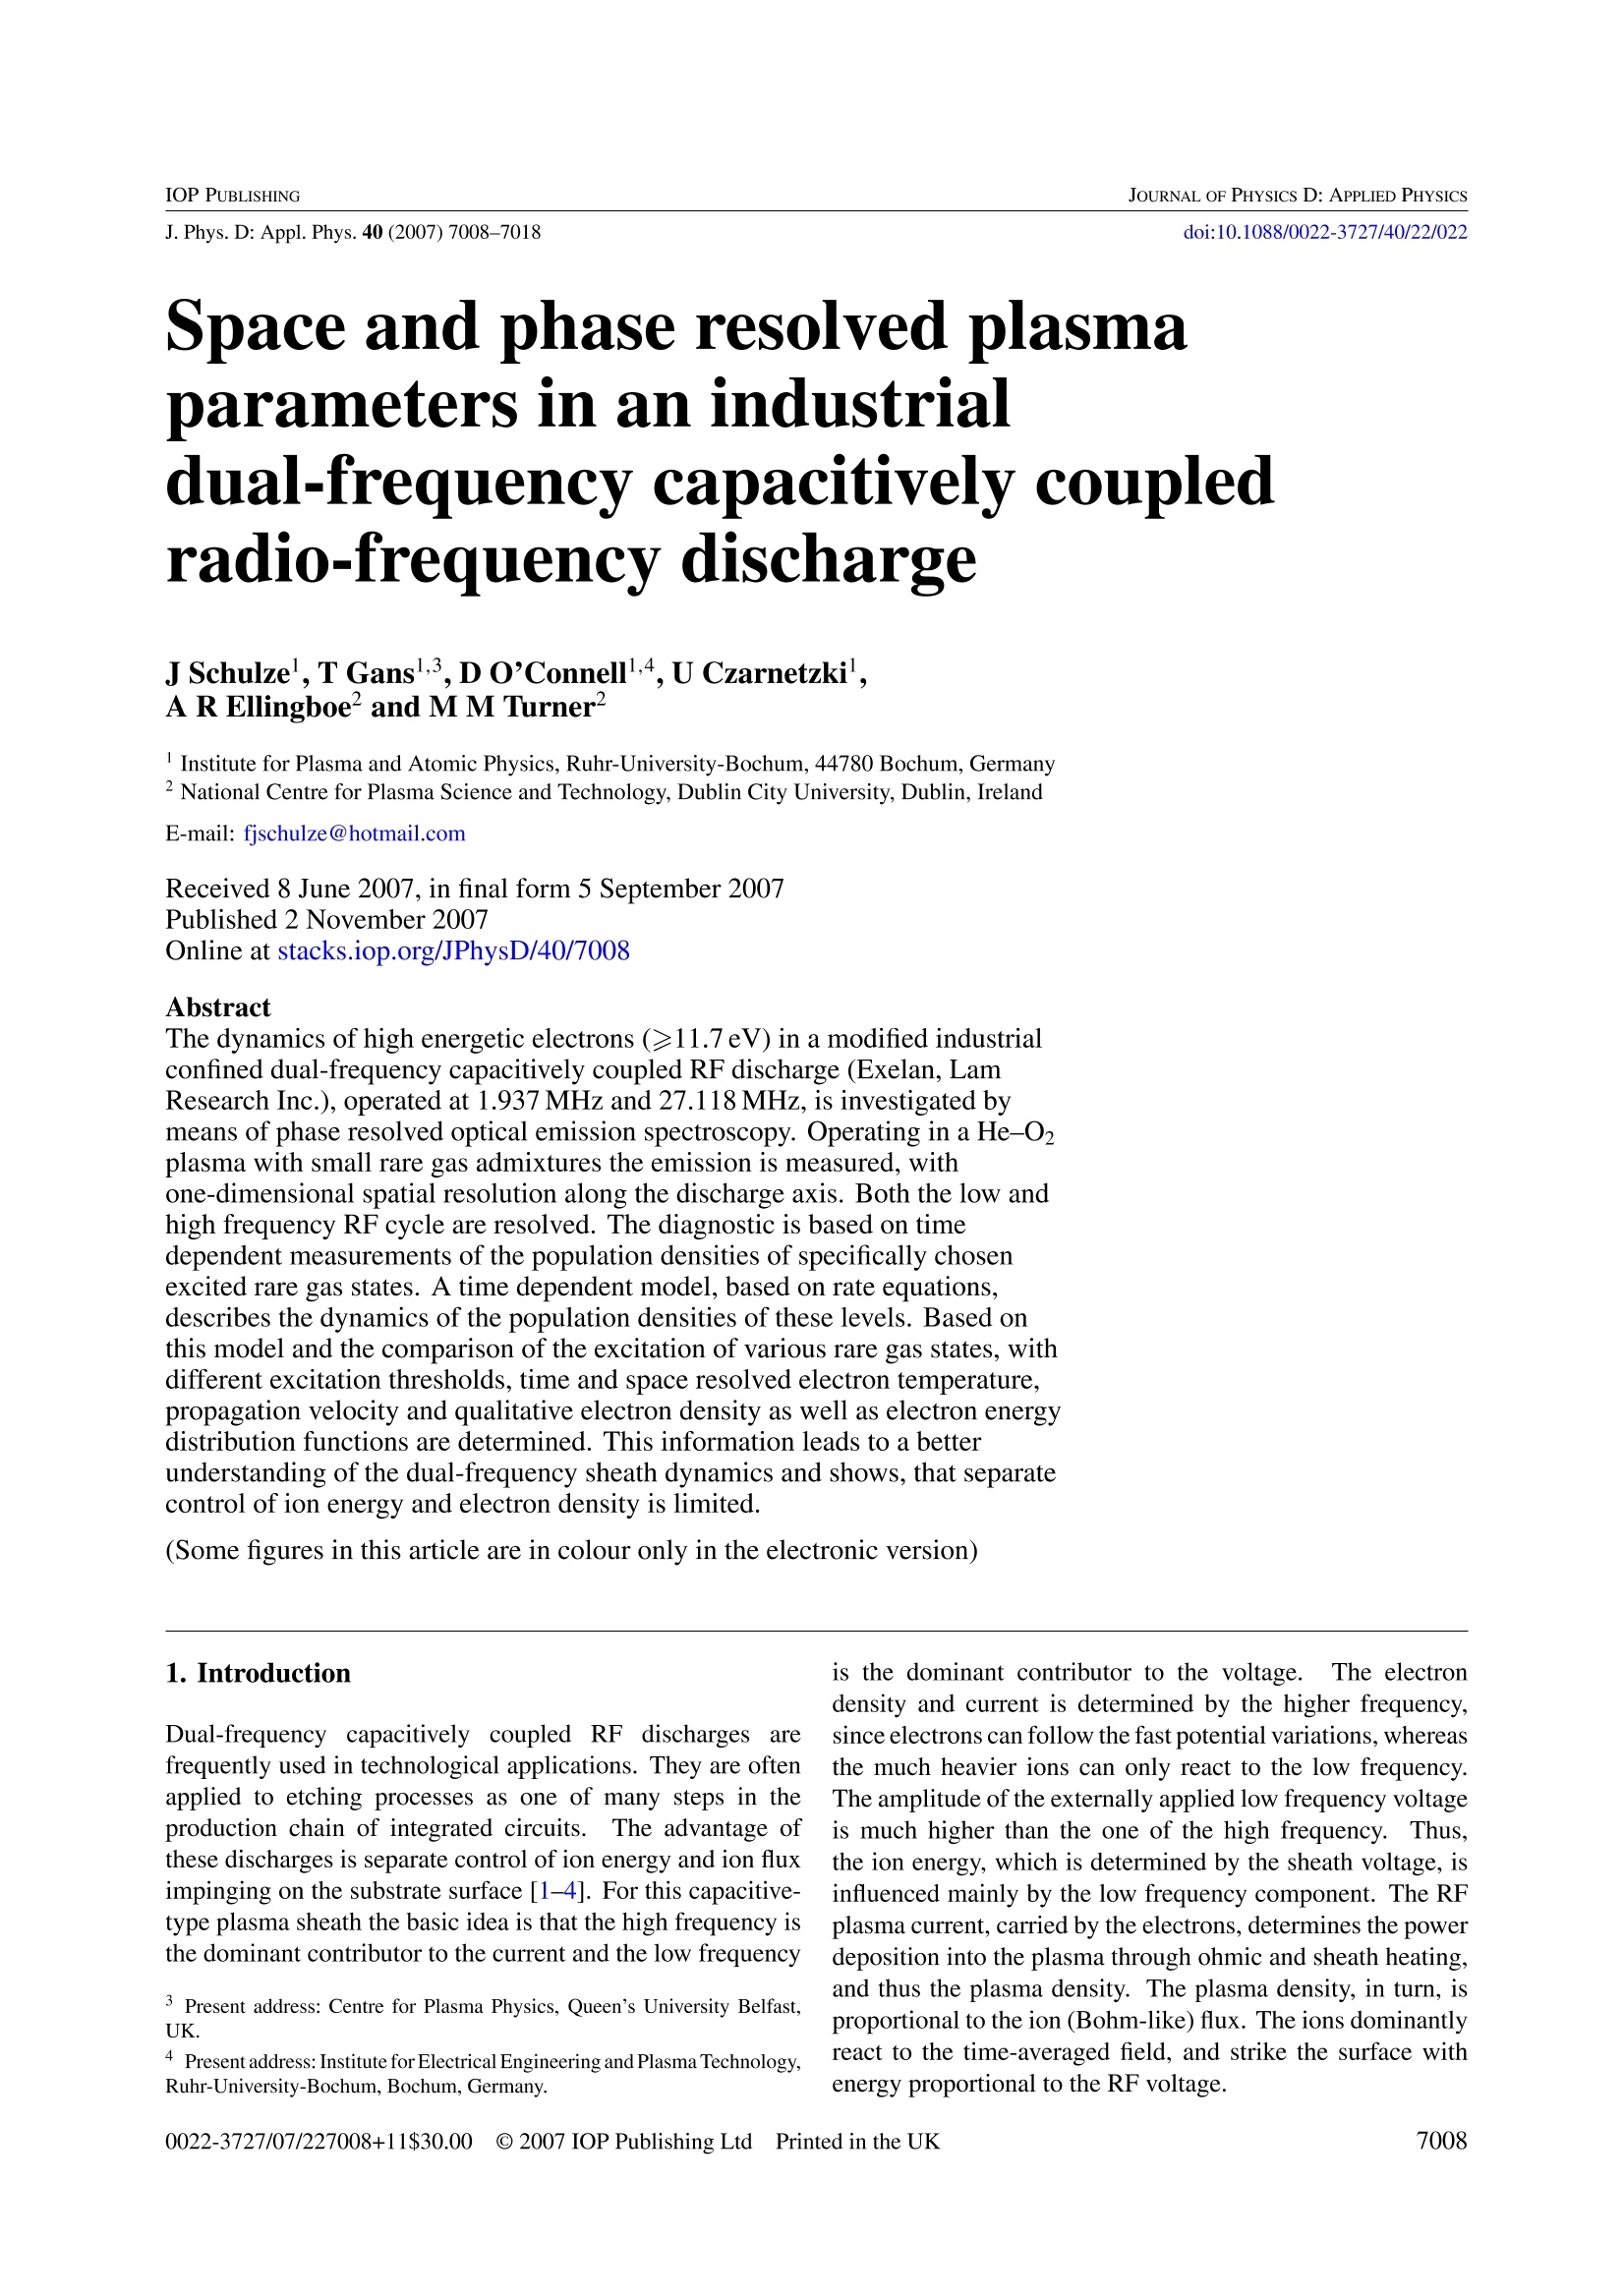
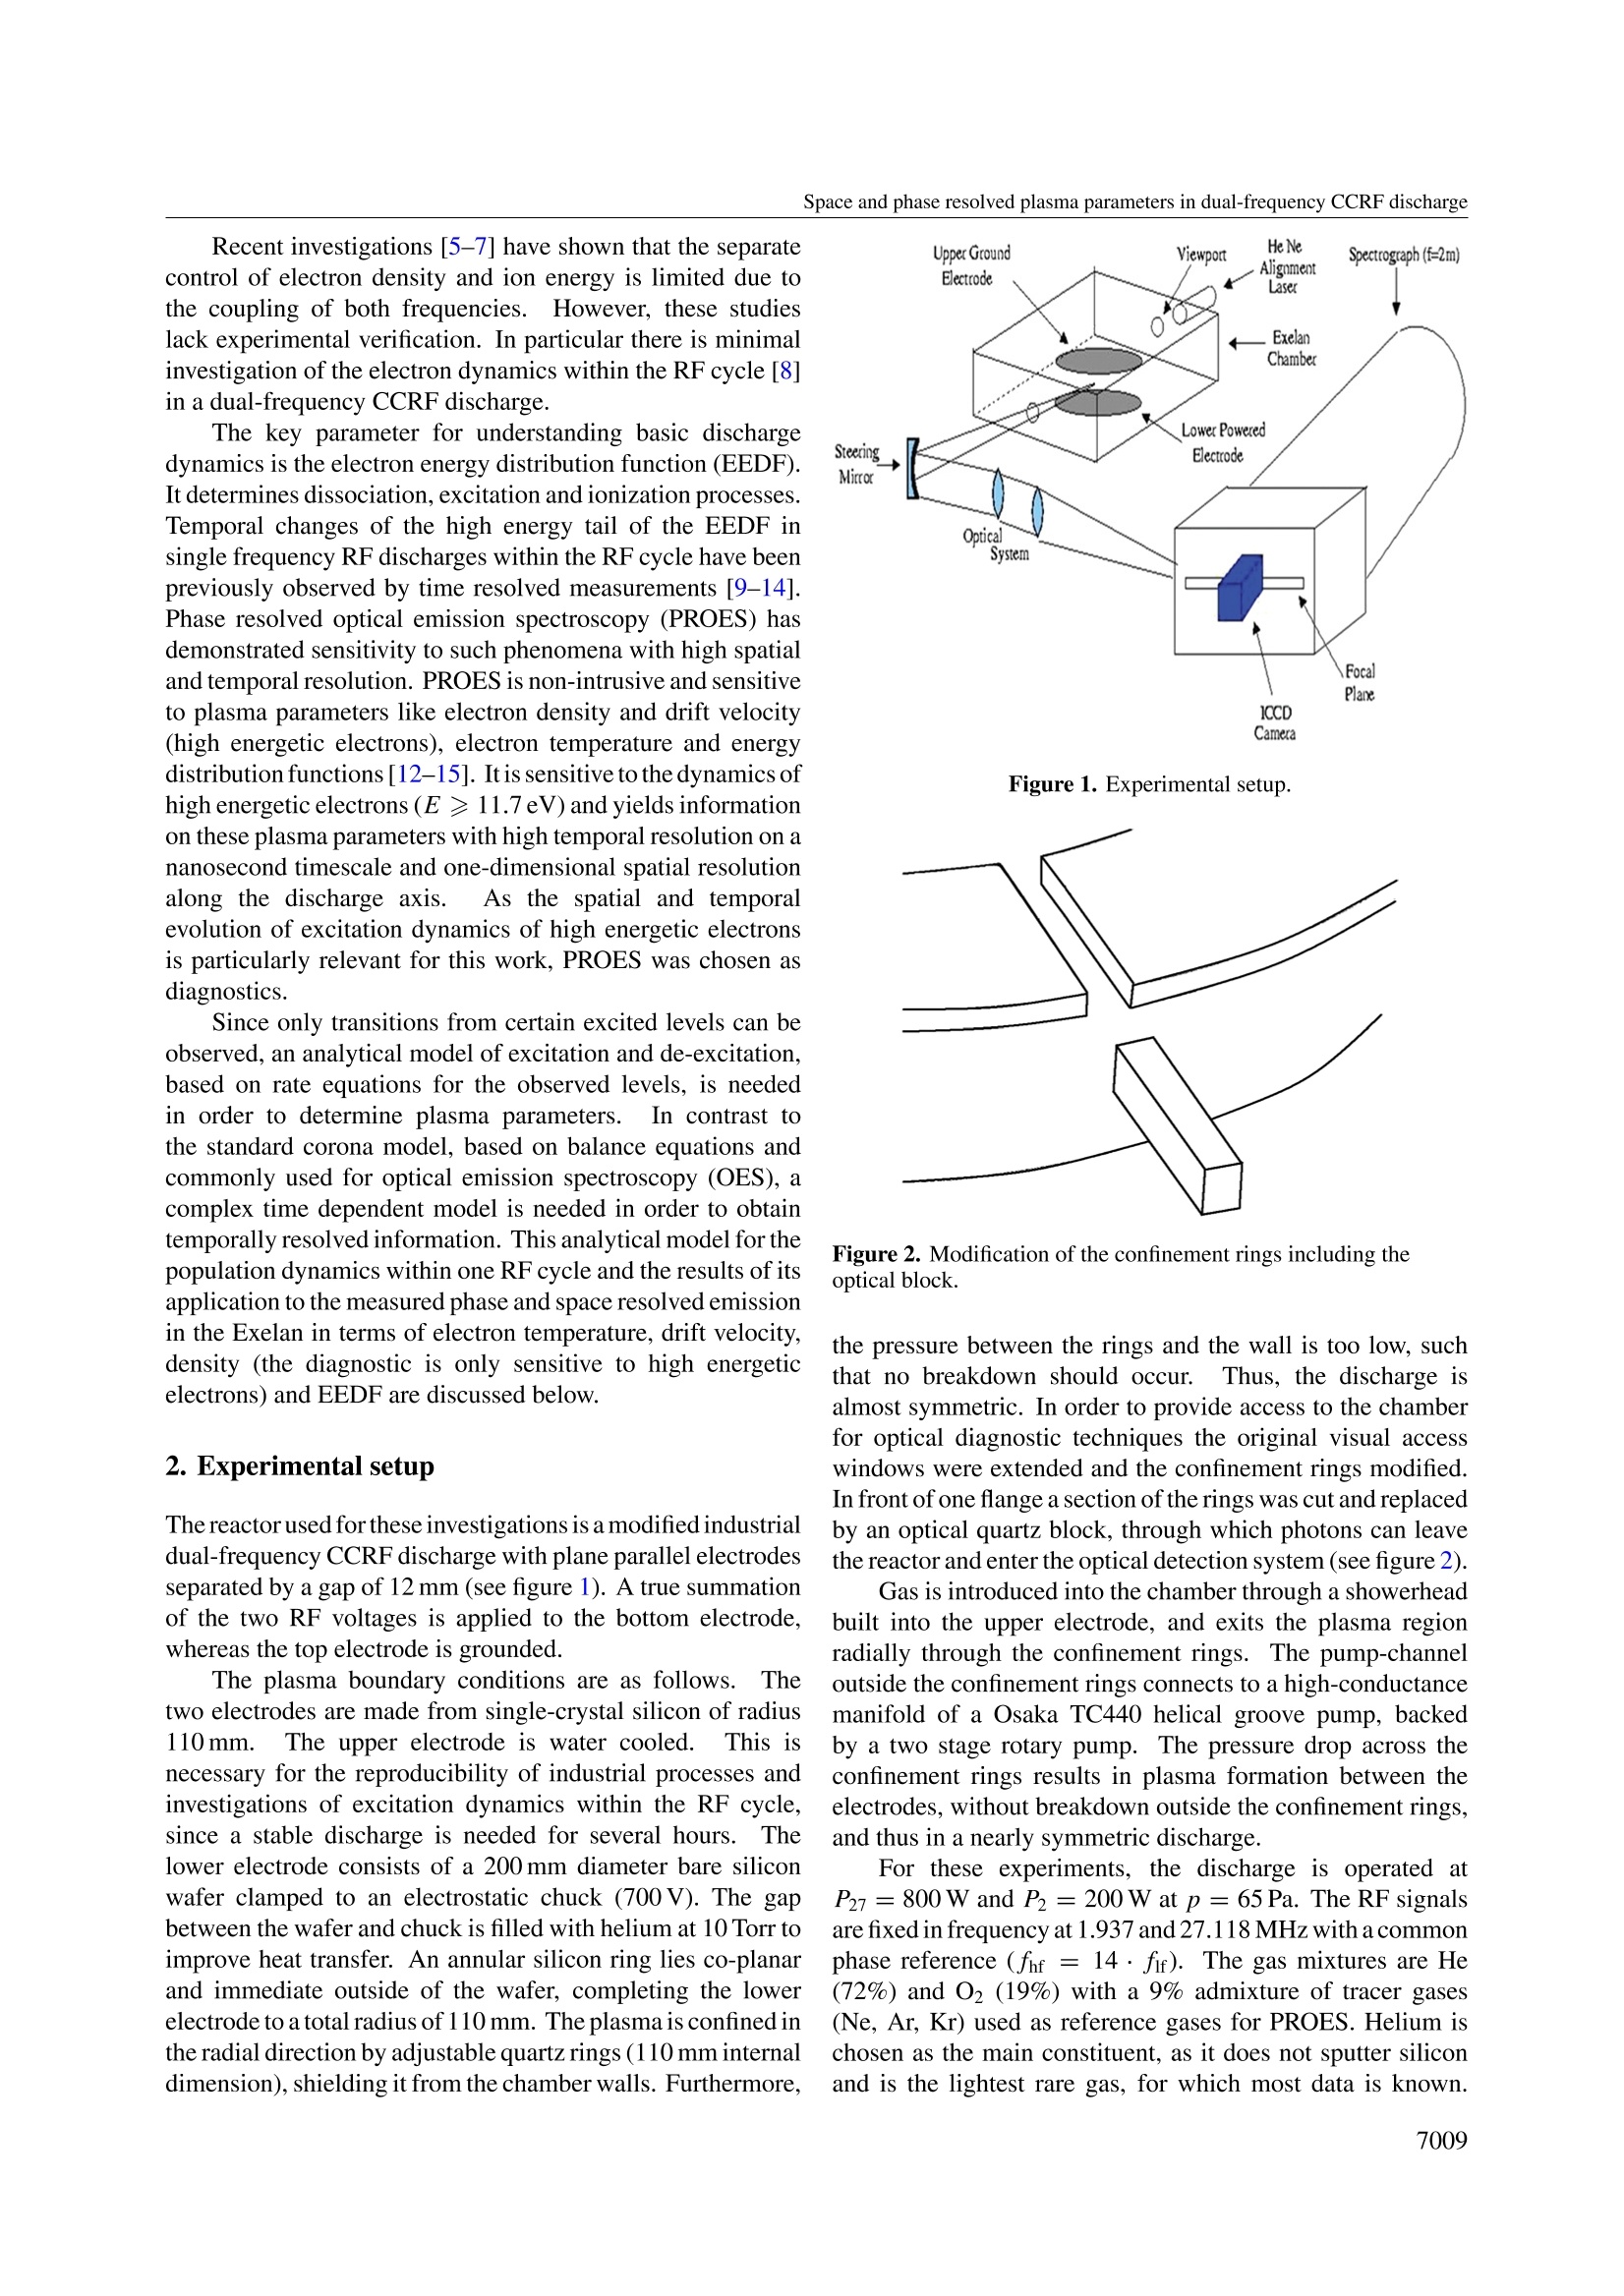
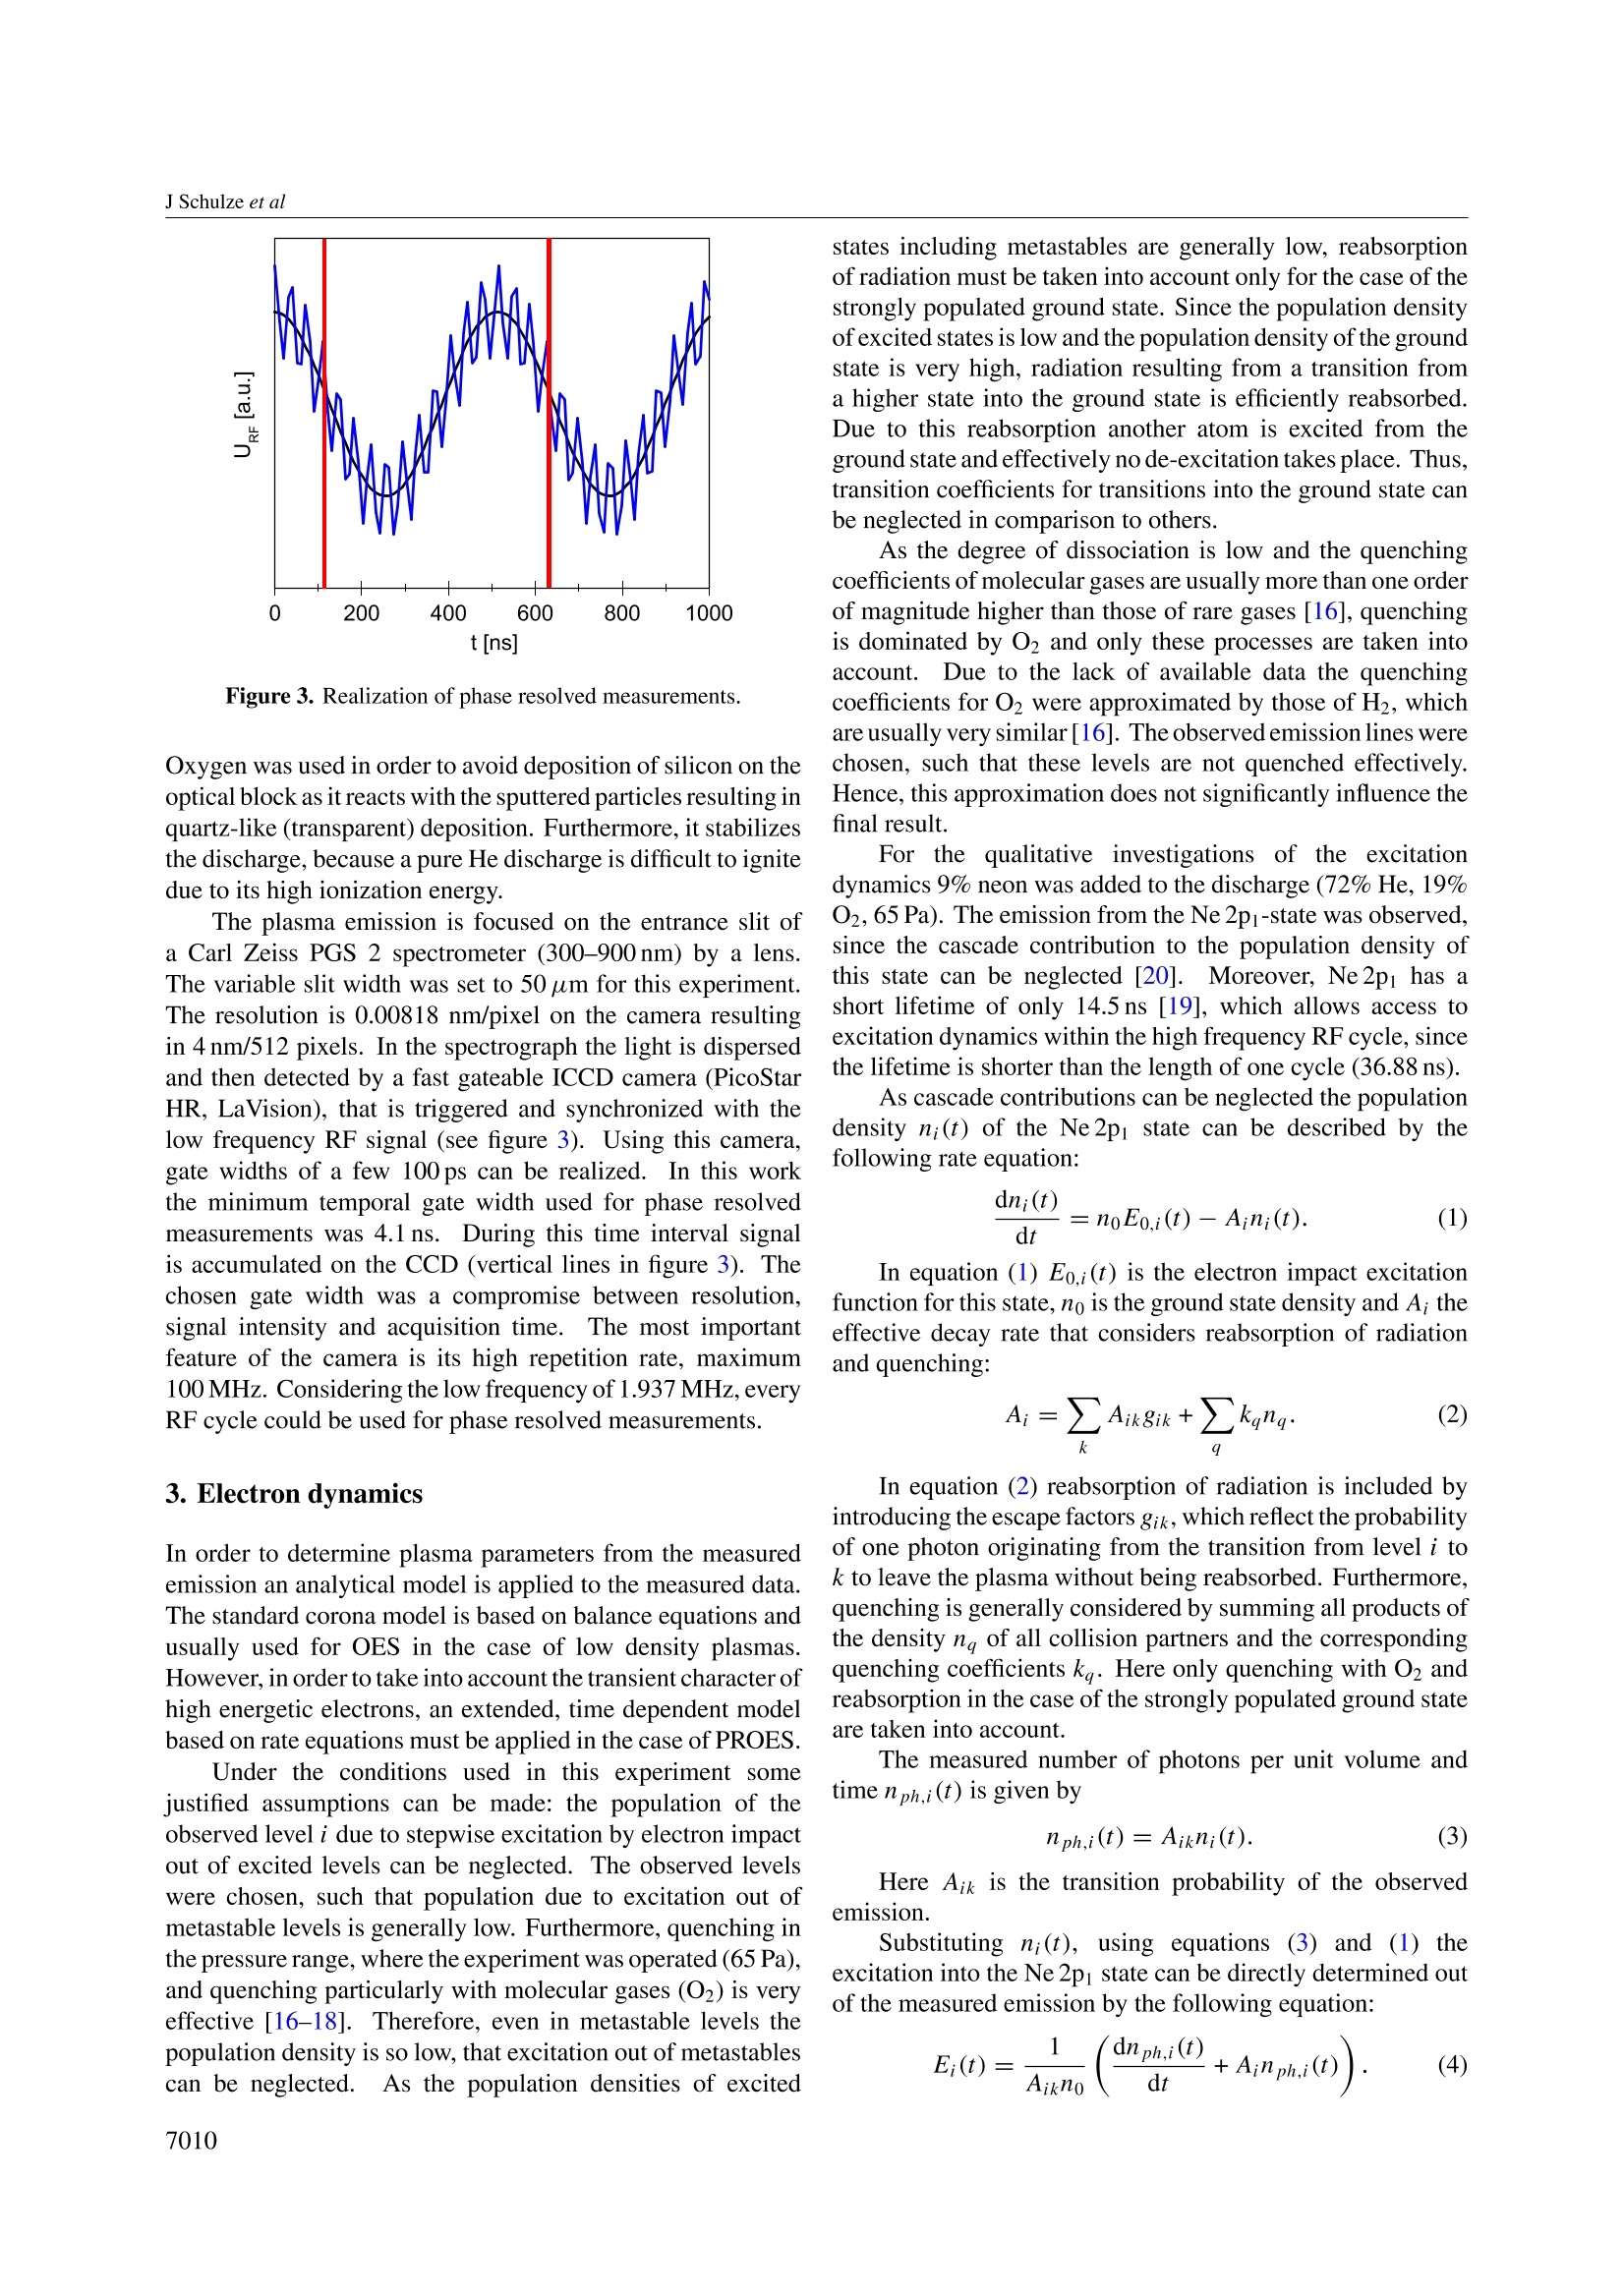
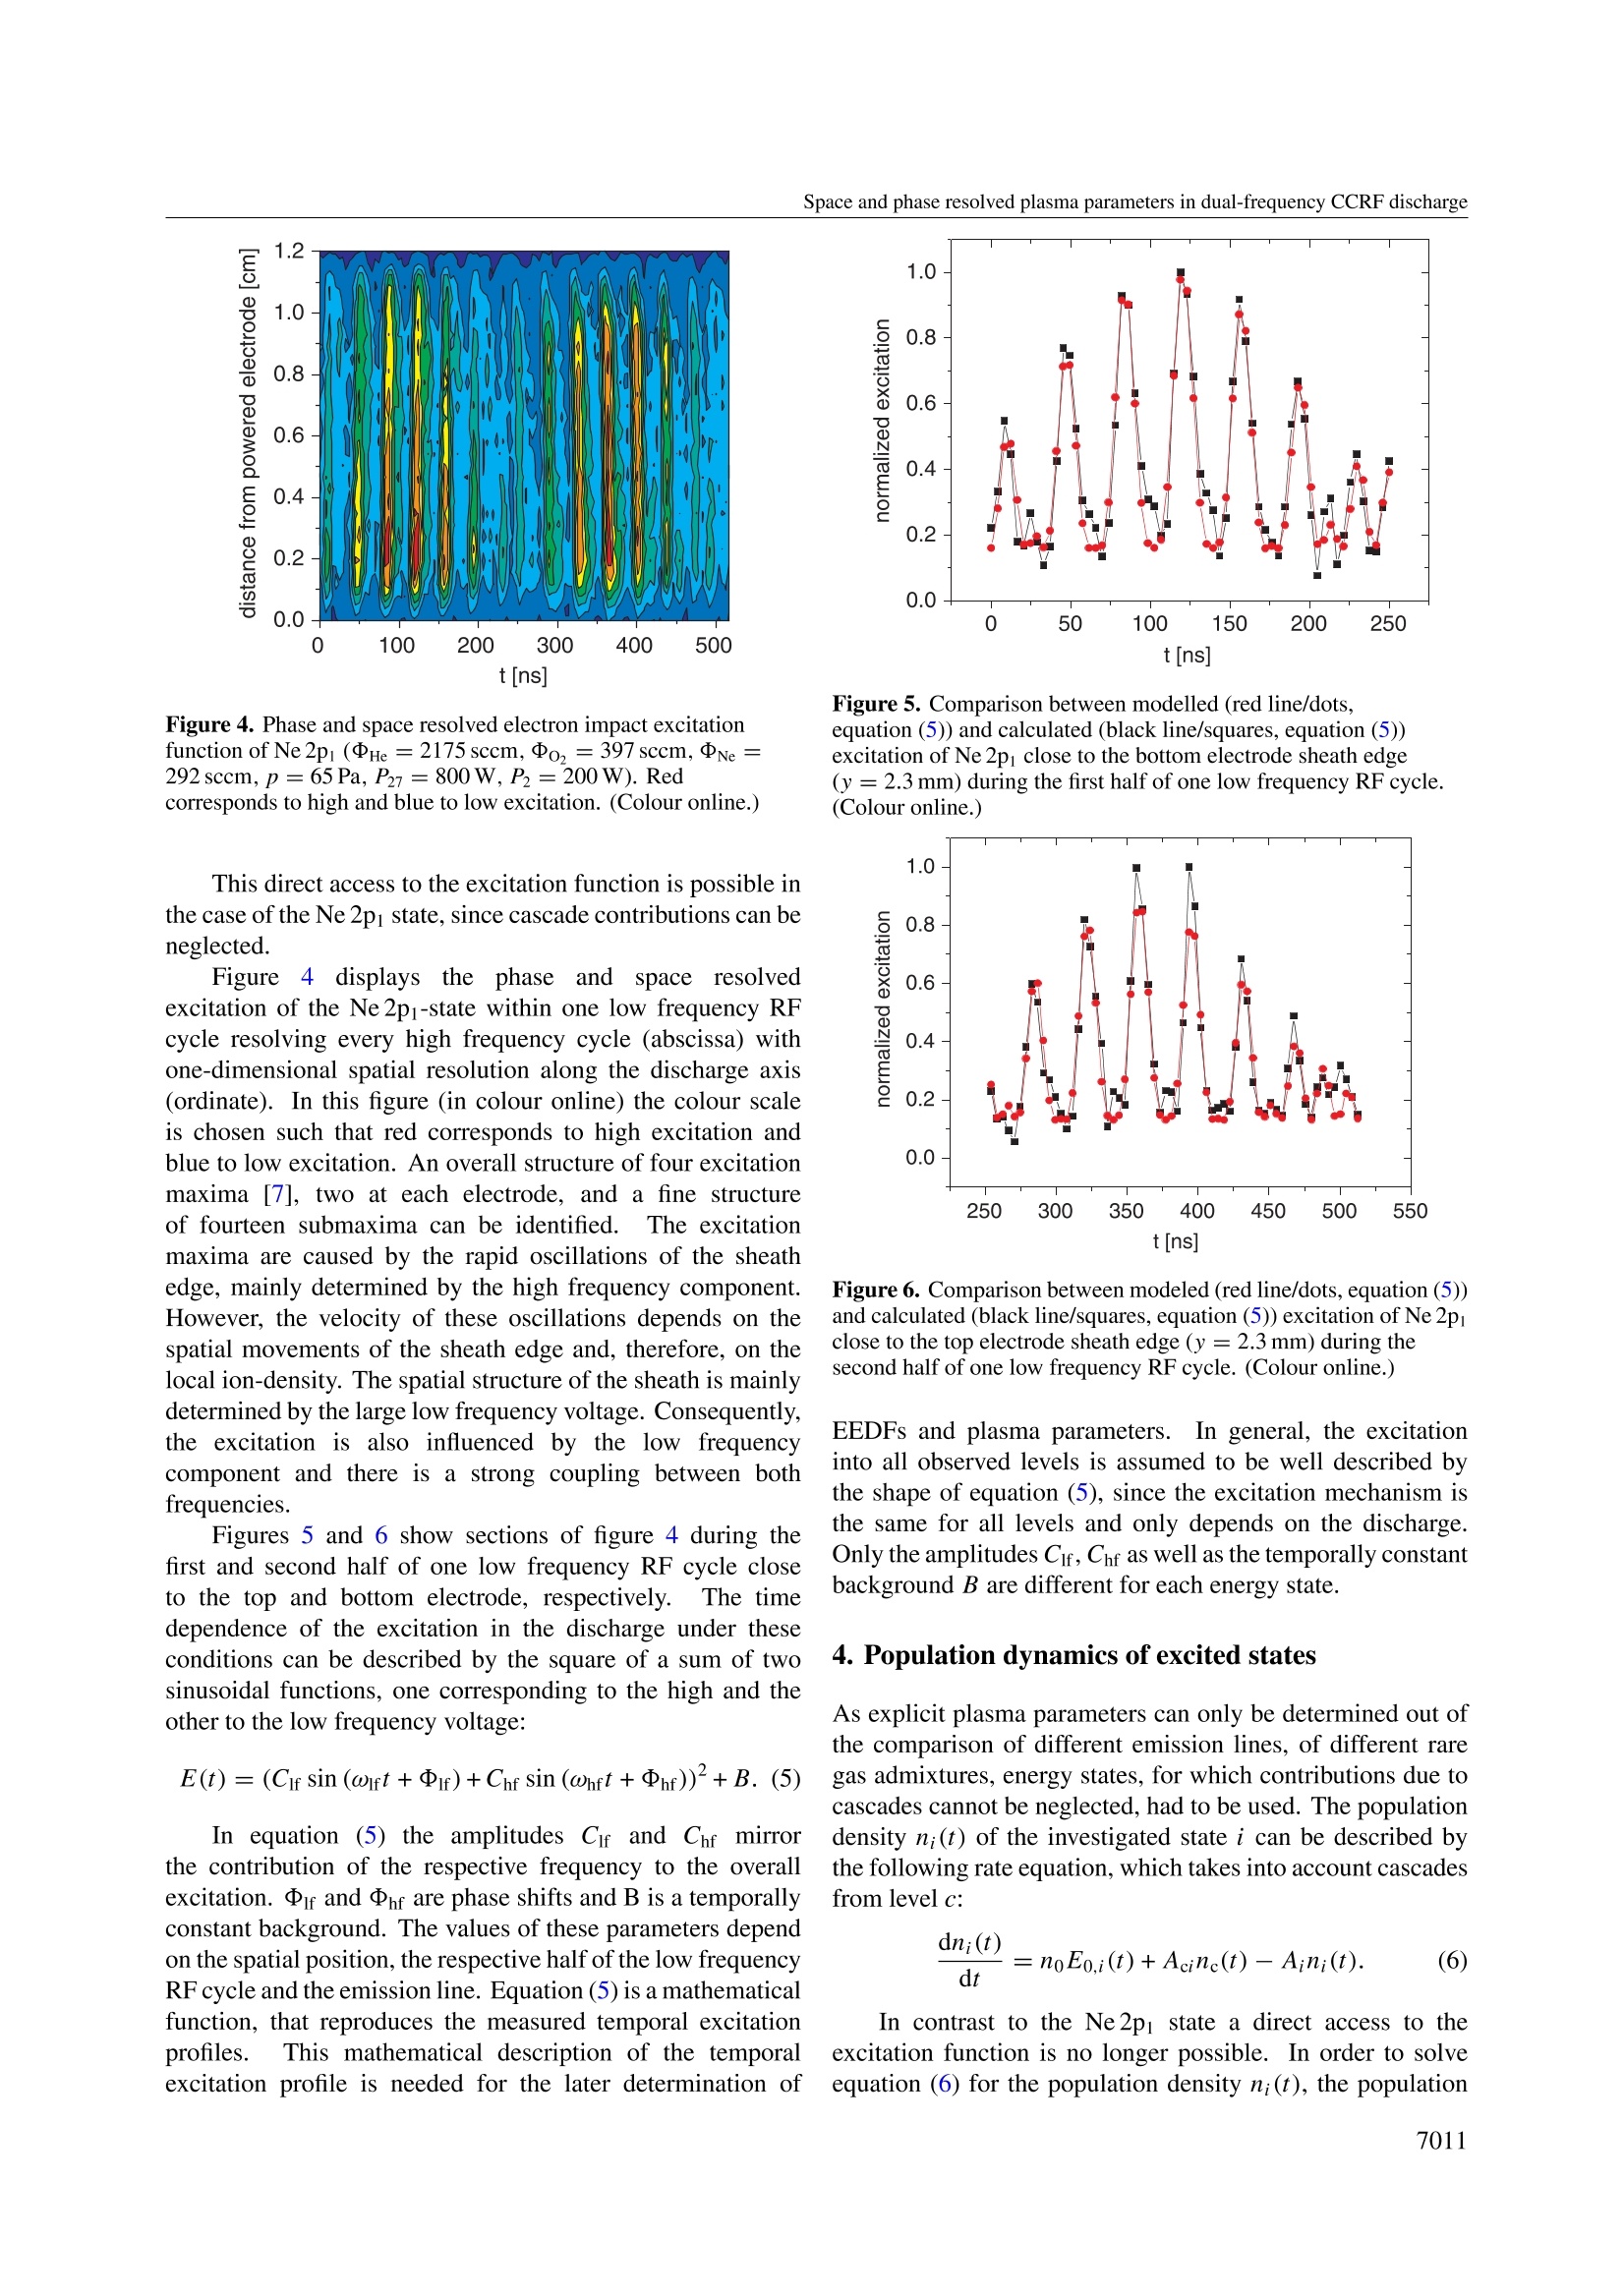
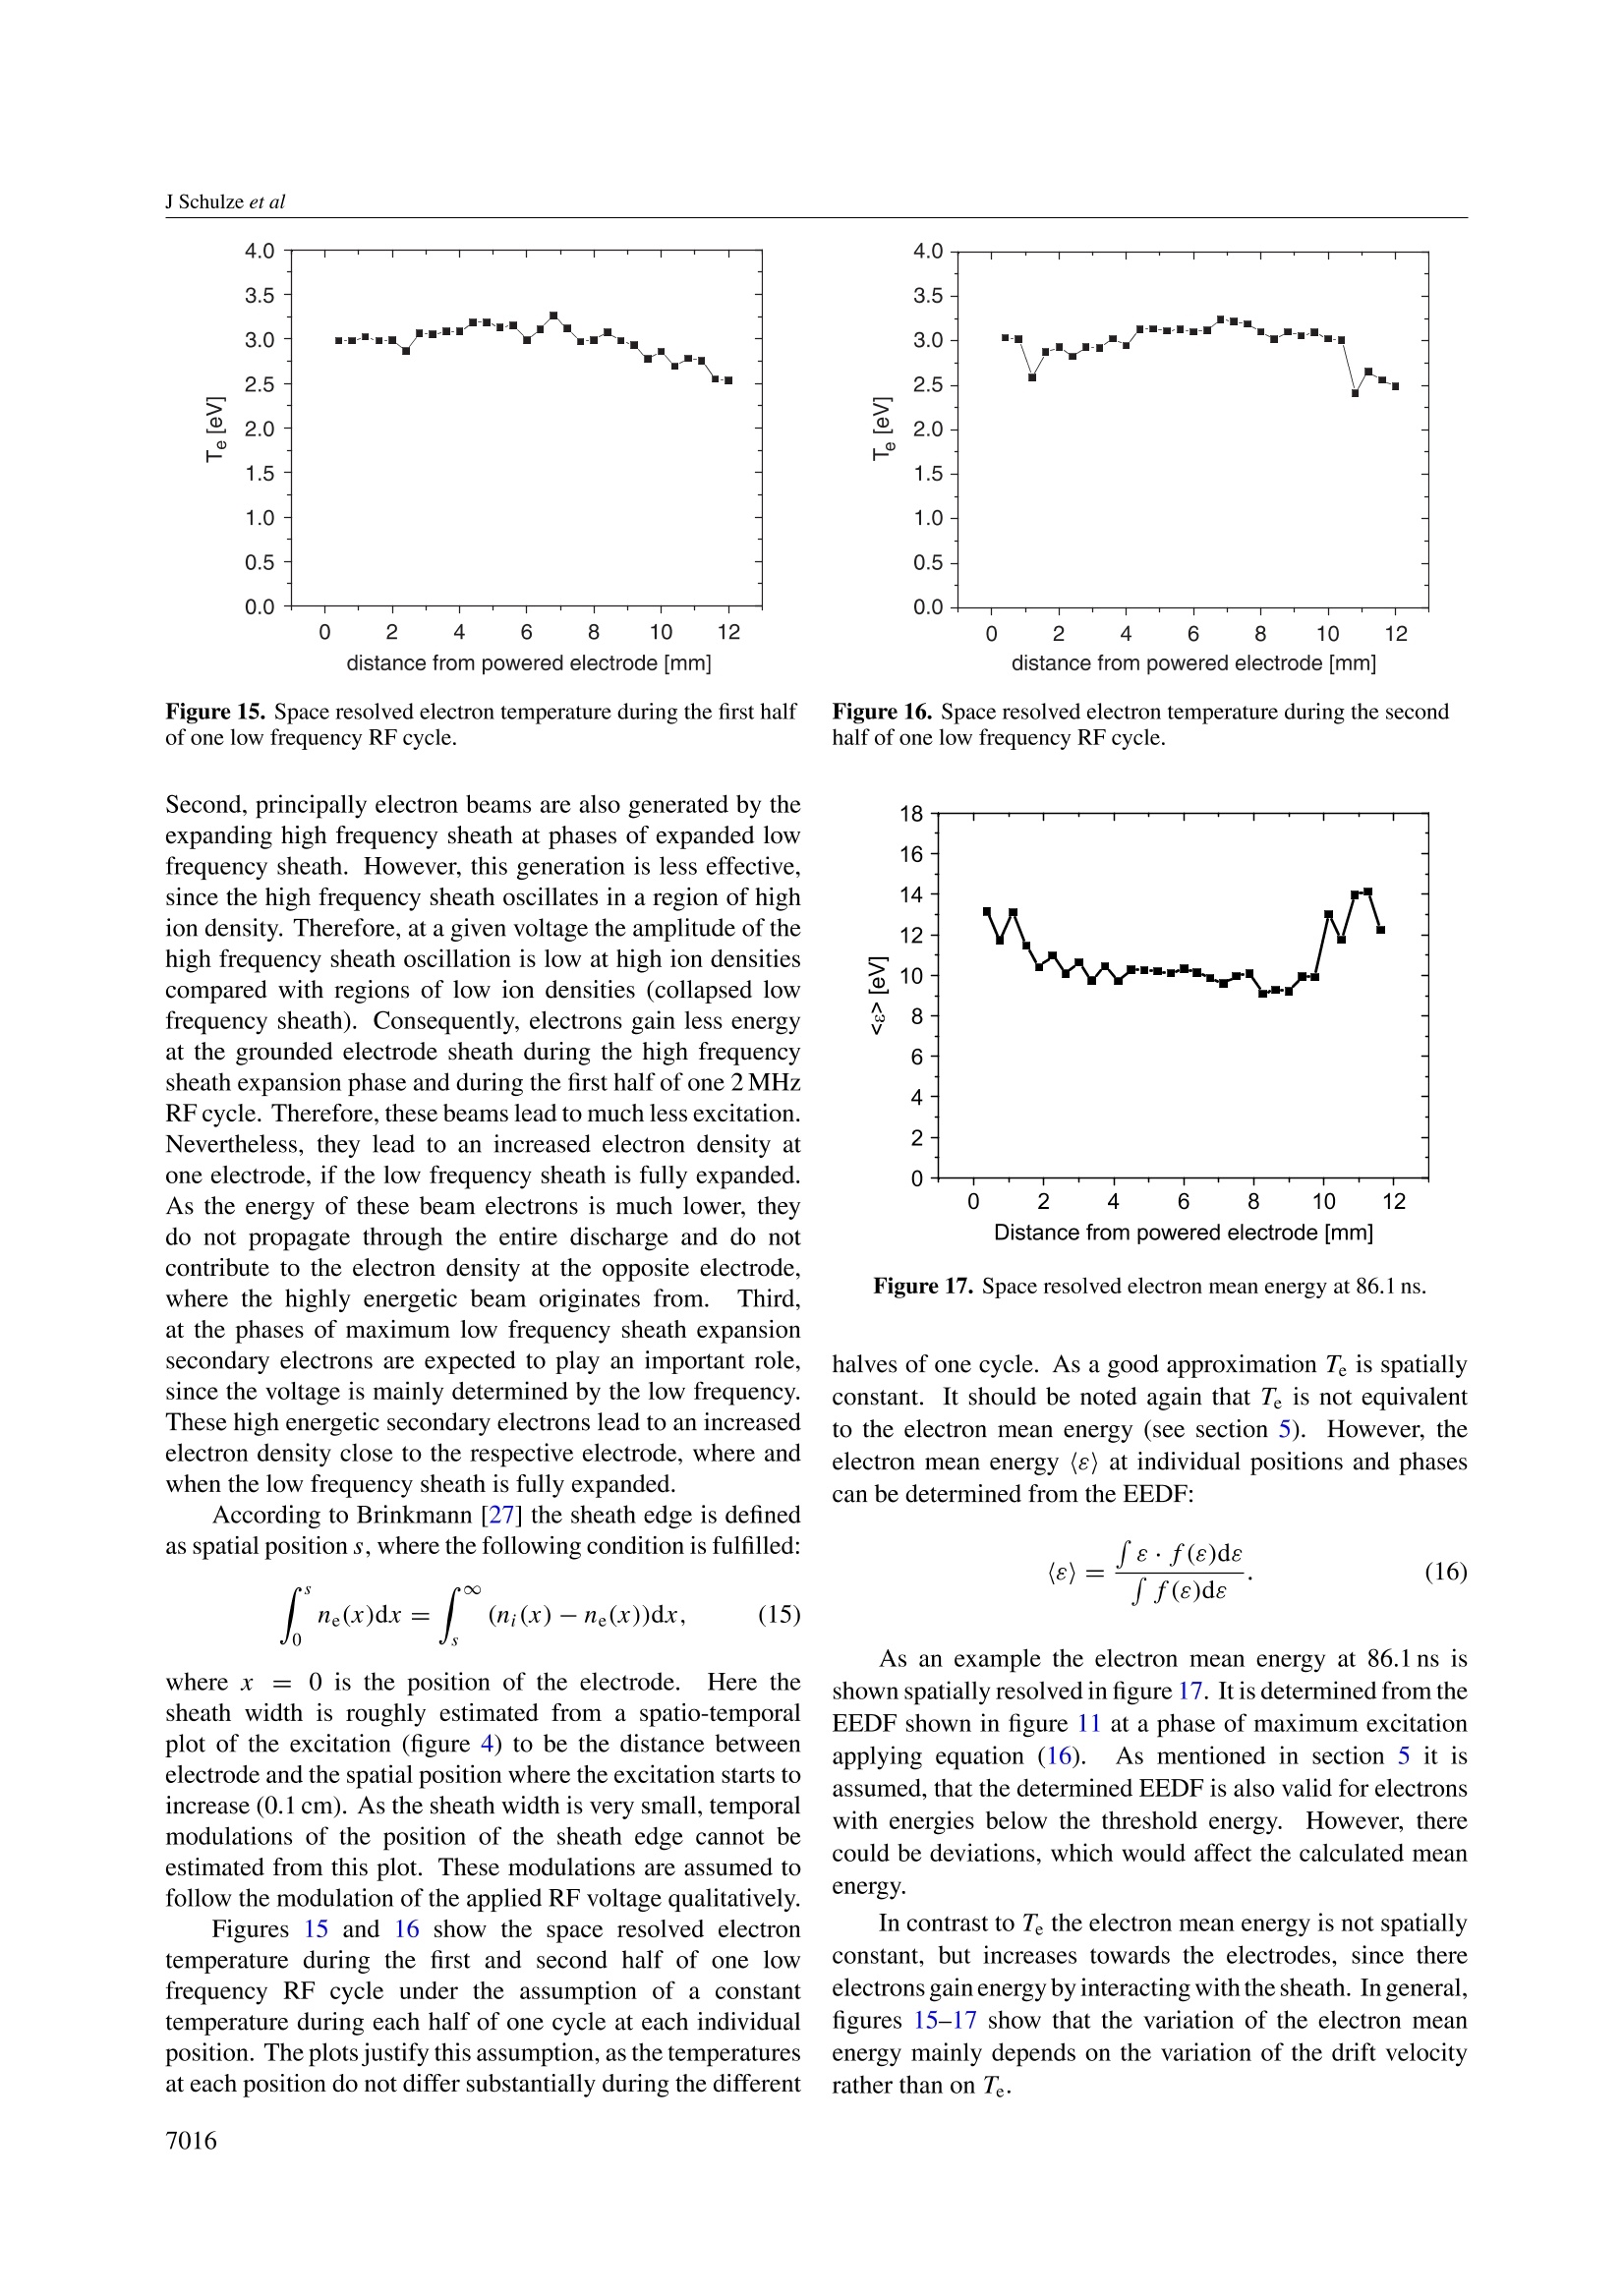
iopscience.iop.org JOURNAL OF PHYSICS D: APPLIED PHYSICsIOP PUBLISHINGJ. Phys. D: Appl. Phys. 40 (2007) 7008-7018doi:10.1088/0022-3727/40/22/022 Home Search Collections Journals AbouttContact usMy lOPscience Space and phase resolved plasma parameters in an industrial dual-frequency capacitivelycoupled radio-frequency discharge This article has been downloaded from IOPscience. Please scroll down to see the full text article.2007 J. Phys. D: Appl. Phys. 40 7008(http://iopscience.iop.org/0022-3727/40/22/022) View the table of contents for this issue, or go to the journal homepage for more Download details: IP Address: 148.6.27.70 The article was downloaded on 26/07/2010 at 10:16 Please note that terms and conditions apply. Space and phase resolved plasmaparameters in an industrialdual-frequency capacitively coupledradio-frequency discharge J Schulzel, T Gans1.3, D O’Connell.124, U Czarnetzki',A R Ellingboe and M M Turner’ Institute for Plasma and Atomic Physics, Ruhr-University-Bochum, 44780 Bochum, Germany"National Centre for Plasma Science and Technology, Dublin City University, Dublin, Ireland E-mail: fjschulze@hotmail.com Received 8 June 2007, in final form 5 September 2007Published 2November 2007 Online at stacks.iop.org/JPhysD/40/7008 Abstract The dynamics of high energetic electrons (≥11.7eV) in a modified industrialconfined dual-frequency capacitively coupled RF discharge (Exelan, LamResearch Inc.), operated at 1.937 MHz and 27.118 MHz, is investigated bymeans of phase resolved optical emission spectroscopy. Operating in a He-O2plasma with small rare gas admixtures the emission is measured, withone-dimensional spatial resolution along the discharge axis. Both the low andhigh frequency RF cycle are resolved. The diagnostic is based on timedependent measurements of the population densities of specifically chosenexcited rare gas states. A time dependent model, based on rate equations,describes the dynamics of the population densities of these levels. Based onthis model and the comparison of the excitation of various rare gas states, withdifferent excitation thresholds, time and space resolved electron temperature,propagation velocity and qualitative electron density as well as electron energydistribution functions are determined. This information leads to a betterunderstanding of the dual-frequency sheath dynamics and shows, that separatecontrol of ion energy and electron density is limited. (Some figures in this article are in colour only in the electronic version) 1. Introduction Dual-frequency capacitively coupled RF discharges arefrequently used in technological applications. They are oftenapplied to etching processes as one of many steps in theproduction chain of integrated circuits.The advantage ofthese discharges is separate control of ion energy and ion fluximpinging on the substrate surface [1-4]. For this capacitive-type plasma sheath the basic idea is that the high frequency isthe dominant contributor to the current and the low frequency ’ Present address: Centre for Plasma Physics, Queen’s University Belfast,UK. ( 4 P resent address: Institute for Electrical Engineering and Plasma Technology,Ruhr-University-Bochum, Bochum, Germany. ) is the dominant contributor to the voltage.The electrondensity and current is determined by the higher frequency,since electrons can follow the fast potential variations, whereasthe much heavier ions can only react to the low frequency.The amplitude of the externally applied low frequency voltageis much higher than the one of the high frequency. Thus,the ion energy, which is determined by the sheath voltage, isinfluenced mainly by the low frequency component. The RFplasma current, carried by the electrons, determines the powerdeposition into the plasma through ohmic and sheath heating,and thus the plasma density. The plasma density, in turn, isproportional to the ion (Bohm-like) flux. The ions dominantlyreact to the time-averaged field, and strike the surface withenergy proportional to the RF voltage. Recent investigations [5-7] have shown that the separatecontrol of electron density and ion energy is limited due tothe coupling of both frequencies. However, these studieslack experimental verification. In particular there is minimalinvestigation of the electron dynamics within the RF cycle [8]in a dual-frequency CCRF discharge. The key parameter for understanding basic dischargedynamics is the electron energy distribution function (EEDF).It determines dissociation, excitation and ionization processes.Temporal changes of the high energy tail of the EEDF insingle frequency RF discharges within the RF cycle have beenpreviously observed by time resolved measurements [9-14].Phase resolved optical emission spectroscopy (PROES) hasdemonstrated sensitivity to such phenomena with high spatialand temporalresolution. PROES is non-intrusive and sensitiveto plasma parameters like electron density and drift velocity(high energetic electrons), electron temperature and energydistribution functions [12-15]. It is sensitive to the dynamics ofhigh energetic electrons(E ≥11.7 eV) and yields informationon these plasma parameters with high temporal resolution on ananosecond timescale and one-dimensional spatial resolutionalong the discharge axis. As the spatial and temporalevolution of excitation dynamics of high energetic electronsis particularly relevant for this work, PROES was chosen asdiagnostics. Since only transitions from certain excited levels can beobserved, an analytical model of excitation and de-excitation,based on rate equations for the observed levels, is neededin order to determine plasma parameters. In contrast tothe standard corona model, based on balance equations andcommonly used for optical emission spectroscopy (OES), acomplex time dependent model is needed in order to obtaintemporally resolved information. This analytical model for thepopulation dynamics within one RF cycle and the results of itsapplication to the measured phase and space resolved emissionin the Exelan in terms of electron temperature, drift velocity,density (the diagnostic is only sensitive to high energeticelectrons) and EEDF are discussed below. 2. Experimental setup The reactor used for these investigations is a modified industrialdual-frequency CCRF discharge with plane parallel electrodesseparated by a gap of 12 mm (see figure 1). A true summationof the two RF voltages is applied to the bottom electrode,whereas the top electrode is grounded. The plasma boundary conditions are as follows.Thetwo electrodes are made from single-crystal silicon of radius110mm.The upper electrode is water cooled. This isnecessary for the reproducibility of industrial processes andinvestigations of excitation dynamics within the RF cycle,since a stable discharge is needed for several hours.; Thelower electrode consists of a 200 mm diameter bare siliconwafer clamped to an electrostatic chuck (700V). The gapbetween the wafer and chuck is filled with helium at 10 Torr toimprove heat transfer. An annular silicon ring lies co-planarand immediate outside of the wafer, completing the lowerelectrode to a total radius of 110 mm. The plasma is confined inthe radial direction by adjustable quartz rings (110 mm internaldimension),shielding it from the chamber walls. Furthermore, Figure 1.Experimental setup. Figure 2. Modification of the confinement rings including theoptical block. the pressure between the rings and the wall is too low, suchthat no breakdown should occur.Thus, the discharge isalmost symmetric. In order to provide access to the chamberfor optical diagnostic techniques the original visual accesswindows were extended and the confinement rings modified.In front of one flange a section of the rings was cut and replacedby an optical quartz block, through which photons can leavethe reactor and enter the optical detection system (see figure 2). Gas is introduced into the chamber through a showerheadbuilt into the upper electrode, and exits the plasma regionradially through the confinement rings. The pump-channeloutside the confinement rings connects to a high-conductancemanifold of a Osaka TC440 helical groove pump, backedby a two stage rotary pump. The pressure drop across theconfinement rings results in plasma formation between theelectrodes, without breakdown outside the confinement rings,and thus in a nearly symmetric discharge. For these experiments, the discharge is operated atP27=800 W and P2=200 W at p=65Pa. The RF signalsare fixed in frequency at 1.937 and27.118 MHz with a commonphase reference (fhf= 14·fir). The gas mixtures are He(72%) and O2(19%) with a 9% admixture of tracer gases(Ne, Ar, Kr) used as reference gases for PROES. Helium ischosen as the main constituent, as it does not sputter siliconand is the lightest rare gas, for which most data is known. Figure 3. Realization of phase resolved measurements. Oxygen was used in order to avoid deposition of silicon on the.optical block as it reacts with the sputtered particles resulting inquartz-like(transparent) deposition. Furthermore,it stabilizesthe discharge, because a pure He discharge is difficult to ignitedue to its high ionization energy. The plasma emission is focused on the entrance slit ofa Carl Zeiss PGS 2 spectrometer (300-900 nm) by a lensThe variable slit width was set to 50 um for this experiment.The resolution is 0.00818 nm/pixel on the camera resultingin 4 nm/512 pixels. In the spectrograph the light is dispersedand then detected by a fast gateable ICCD camera (PicoStarHR, LaVision), that is triggered and synchronized with thelow frequency RF signal (see figure 3). Using this camera,gate widths of a few 100 ps can be realized. In this workthe minimum temporal gate width used for phase resolvedmeasurements was 4.1 ns. During this time interval signalis accumulated on the CCD (vertical lines in figure3). Thechosen gate width was a compromise between resolution,signal intensity and acquisition time. The most importantfeature of the camera is its high repetition rate, maximum100 MHz. Considering the low frequency of 1.937 MHz, everyRF cycle could be used for phase resolved measurements. 3. Electron dynamics In order to determine plasma parameters from the measuredemission an analytical model is applied to the measured data.The standard corona model is based on balance equations andusually used for OES in the case of low density plasmas.However,in order to take into account the transient character ofhigh energetic electrons, an extended, time dependent modelbased on rate equations must be applied in the case of PROES. Under the conditions used in this experiment somejustified assumptions can be made: the population of theobserved level i due to stepwise excitation by electron impactout of excited levels can be neglected. The observed levelswere chosen, such that population due to excitation out ofmetastable levels is generally low. Furthermore, quenching inthe pressure range, where the experiment was operated (65 Pa),and quenching particularly with molecular gases (O2) is veryeffective [16-18]. Therefore, even in metastable levels thepopulation density is so low, that excitation out of metastablescan be neglected.As the population densities of excited states including metastables are generally low, reabsorptionof radiation must be taken into account only for the case of thestrongly populated ground state. Since the population densityof excited states is low and the population density of the groundstate is very high, radiation resulting from a transition froma higher state into the ground state is efficiently reabsorbed.Due to this reabsorption another atom is excited from theground state and effectively no de-excitation takes place. Thus,transition coefficients for transitions into the ground state canbe neglected in comparison to others. As the degree of dissociation is low and the quenchingcoefficients of molecular gases are usually more than one orderof magnitude higher than those of rare gases [16], quenchingis dominated by O2 and only these processes are taken intoaccount.Due to the lack of available data the quenchingcoefficients for O2 were approximated by those of H2, whichare usually very similar [16]. The observed emission lines werechosen, such that these levels are not quenched effectively.Hence, this approximation does not significantly influence thefinal result. For the qualitative investigations of the excitationdynamics 9% neon was added to the discharge (72% He, 19%O2,65 Pa). The emission from the Ne2pi-state was observed,since the cascade contribution to the population density ofthis state can be neglected [20]. Moreover, Ne 2pi has ashort lifetime of only 14.5 ns [19], which allows access toexcitation dynamics within the high frequency RF cycle, sincethe lifetime is shorter than the length of one cycle (36.88 ns). As cascade contributions can be neglected the populationdensity ni(t) of the Ne 2pi state can be described by thefollowing rate equation: In equation (1) Eo,i(t) is the electron impact excitationfunction for this state, no is the ground state density and A; theeffective decay rate that considers reabsorption of radiationand quenching: In equation (2) reabsorption of radiation is included byintroducing the escape factors gik, which reflect the probabilityof one photon originating from the transition from level i tok to leave the plasma without being reabsorbed. Furthermore,quenching is generally considered by summing all products ofthe density ng of all collision partners and the correspondingquenching coefficients kq. Here only quenching with O2 andreabsorption in the case of the strongly populated ground stateare taken into account. The measured number of photons per unit volume andtime n ph,i(t) is given by Here Aik is the transition probability of the observedemission. Substituting ni(t), using equations (3) and (1) theexcitation into the Ne 2pi state can be directly determined outof the measured emission by the following equation: Figure 4. Phase and space resolved electron impact excitationfunction of Ne 2pi (PHe = 2175 sccm, Do,=397 sccm, PNe =292 sccm, p=65Pa, P27=800W,P2=200W). Redcorresponds to high and blue to low excitation. (Colour online.) This direct access to the excitation function is possible inthe case of the Ne 2pi state, since cascade contributions can beneglected. Figure 44displays thee phase anddspace resolvedexcitation of the Ne 2p1-state within one low frequency RFcycle resolving every high frequency cycle (abscissa) withone-dimensional spatial resolution along the discharge axis(ordinate). In this figure (in colour online) the colour scaleis chosen such that red corresponds to high excitation andblue to low excitation. An overall structure of four excitationmaxima [7], two at each electrode, and a fine structureof fourteen submaxima can be identified. The excitationmaxima are caused by the rapid oscillations of the sheathedge, mainly determined by the high frequency component.However, the velocity of these oscillations depends on thespatial movements of the sheath edge and, therefore, on thelocal ion-density. The spatial structure of the sheath is mainlydetermined by the large low frequency voltage. Consequently.the excitation is also influenced by the low frequencycomponent and there is a strong coupling between bothfrequencies. Figures 5 and 6 show sections of figure 4 during thefirst and second half of one low frequency RF cycle closeto the top and bottom electrode, respectively. The timedependence of the excitation in the discharge under theseconditions can be described by the square of a sum of twosinusoidal functions, one corresponding to the high and theother to the low frequency voltage: In equation (5) the amplitudes Cif and Chf mirrorthe contribution of the respective frequency to the overallexcitation. Dir and Phf are phase shifts and B is a temporally1yconstant background. The values of these parameters dependon the spatial position, the respective half of the low frequencyRF cycle and the emission line. Equation (5) is a mathematicalfunction, that reproduces the measured temporal excitationprofiles.TThis mathematical description of the temporalexcitation profile is needed for the later determination of t [ns] Figure 5. Comparison between modelled (red line/dots,equation (5)) and calculated (black line/squares, equation (5))excitation of Ne 2pi close to the bottom electrode sheath edge(y=2.3 mm) during the first half of one low frequency RF cycle.(Colour online.) Figure 6. Comparison between modeled (red line/dots, equation (5))and calculated (black line/squares, equation (5)) excitation of Ne 2piclose to the top electrode sheath edge (y=2.3 mm) during thesecond half of one low frequency RF cycle. (Colour online.) EEDFs and plasma parameters. In general, the excitationinto all observed levels is assumed to be well described bythe shape of equation (5), since the excitation mechanism isthe same for all levels and only depends on the discharge.Only the amplitudes Cif, Chf as well as the temporally constantbackground B are different for each energy state. 4. Population dynamics of excited states As explicit plasma parameters can only be determined out ofthe comparison of different emission lines, of different raregas admixtures, energy states, for which contributions due tocascades cannot be neglected, had to be used. The populationdensity ni(t) of the investigated state i can be described bythe following rate equation, which takes into account cascadesfrom level c: In contrast to the Ne 2pi state a direct access to theexcitation function is no longer possible. In order to solveequation (6) for the population density n;(t), the population State 入 [19] E [19] k C/D (nm) (eV) (ns) (10-10cm’s-l) Kr2p5 758.7 11.7 21.5[13] 46511628 1.7[13] 0.3[22] Ar 2pi 750.4 13.5 34.1[19] 44642857 0.3[23] 0.2[21] Ne 2pi 585.2 19.0 14.5[19] 68275862 2.3[13] 0.03[20] density nc(t) of the dominant cascade level must be known. Inorder to achieve this, the rate equation of the dominant cascadelevel must be solved: In equation (8), TRF is the length of one low frequencyRF cycle. As the contribution of cascades to the populationdensities of the states used in this work is generally low(see table 1), second order cascades can be neglected inequation (7). The solution n;(t) is [12] Using equation (3) the population density, calculated byequation (9), can be fitted to the measured emission by varyingthe free parameters Clf, Chf, Dir, Phf and B in equation (5) ateach position in the discharge. As the emission during the firsthalf of the low frequency RF cycle is caused by high energeticelectrons, that are accelerated by the bottom electrode’s sheath,whereas the emission during the second half is caused byelectrons from the top electrode and as the discharge is slightlyasymmetric, this fit is performed separately for the first andsecond half individually at each position in the discharge. Thefact, that electrons are accelerated by different sheaths duringdifferent halves of one low frequency RF cycle, causes Ciand Chf to be substantially different at a given spatial positionduring the two different halves for a certain energy level. If thedischarge was perfectly symmetric, E(t, z)=E(+t, L-z)would hold. Here T is the length of one low frequency RFcycle, L the electrode gap, t a variable time and z a variableposition in the discharge. Once this fit is completed, the free parameters aredetermined and the excitation function E; (t) is calculated at aspecific location in the discharge chamber using equation (5). 5. Determination of phase and space resolvedEEDFs The three states listed in table 1 were used to determine EEDFs.In table 1, C/D denotes the contribution of cascades inrelation to direct excitation of the corresponding state as they were determined from electron beam experiments [20-22].The relatively small contribution of cascades justifies theneglect of second order cascades. The excitation thresholdsof these states cover an energy interval from 11.7 to 19.0 eV.The corresponding electron impact excitation cross sectionsare accurately known from [20-22]. Once the excitation functions of each line are known, byapplying the time and space resolved techniques, which isdescribed in the previous section, the EEDF can be determinedat high temporal and spatial resolution. The relation betweenexcitation function E, and EEDF f(E) is Assuming a justified shape of the EEDF in terms of amathematical function with a set of free parameters, the RHSof equation (11) can be fitted to the corresponding analyticaldescription of the excitation function using equation (5). Asonly a relative calibration of the optical setup was possible,the factor ne in equation (11) does not correspond to theabsolute electron density but is proportional to it. me denotesthe electron mass. Fitting the RHS of equation (11) to theanalytical description of the excitation, at different locationsin the plasma, at different times in the RF cycle, the EEDF,including the free parameters (electron temperature and driftvelocity) and the qualitative behaviour of the electron density,can be determined both temporally and spatially resolved. Since the discharge is capacitive with electric fieldsperpendicular to the electrodes,a shifted Maxwelliandistribution function was chosen, as it takes into account adrift velocity Vain direction of the electric field: Transformation of the above equation into energy spaceyields: This equation is later fitted to the measured excitation(equation (11)) varying electron temperature Te and driftenergy Ea. It should be noted, that in equation (13), Te does notrepresent an electron temperature in the classical sense, i.e.kTe(e), where (e) is the electron mean energy. Instead,it is assumed, that within the region between the thresholdfor excitation (about 12eV) and well above the highestlevel (19eV) the distribution function can be described byequation (13). Therefore, Te is only a parameter used for the description of the distribution function. In the following Tewill simply be called electron temperature. Furthermore, it isassumed, that the determined EEDF is also valid for electronswith energies below the threshold energy. As only energylevels with threshold energies higher than 11.7eV were used,there could be deviations at lower energies, that cannot beobserved with this emission spectroscopic technique. In order to determine the electron temperature, driftvelocity and electron density the following technique is appliedto all positions in the discharge and for each half of one lowfrequency RF cycle separately: Initially the excitation functions of all three emission linesare determined individually under variation of the amplitudesin equation (5) by fitting the calculated emission, that resultsout of the model to describe the population density of an excitedstate (see section 4), to the measured emission characteristics.The electron temperature is then determined from the ratio ofthe excitation functions of the Ne 2pi-and Kr 2p5-state at eachposition, for each half of one cycle individually. At the phasesof minimum excitation in one low frequency RF cycle thedrift velocity is assumed to be low. Therefore, the distributionof electrons is approximately Maxwellian. Assuming such aMaxwellian distribution at the phases of minimum excitation,the ratio of the excitation functions of two emission lines onlydepends on the electron temperature Te. Using equation (11)ne cancels in the ratio: As the ratio on the LHS of equation (14) is knownfrom the analytical description of the individual excitationfunctions,equation (14) yields the electron temperature at thecorresponding phases. Since the temperatures at the individualphases never differ from each other by more than 5%, theelectron temperature is assumed to be temporally constant ineach half of the low frequency cycle. Figure 7 shows the ratioof both excitation functions as a function of Te. One can clearlysee that the determination of the electron temperature, usingthis approach, is unique. Once the electron temperature Te has been determined, itis assumed to be temporally constant at the given position in theplasma for the given half of the RF cycle. In the final step theexcitation functions of all three lines are fitted simultaneouslyto the respective analytically determined excitation functionvarying ud and ne in equation (11) and assuming a shiftedMaxwellian distribution function (equation (13)). Such a fitis performed simultaneously for all lines at each phase in thelow frequency RF cycle at a given position in the discharge.The result of the drift velocity and electron density at eachphase is unique, since the ratio of two excitation functions ofdifferent states depends only on Te and Va (ne cancels). As Thas already been determined by the above described technique,the ratio only depends on the drift velocity. Figure 8 showsa plot of the ratio of the excitation function of Ne 2pi andKr 2p5 as a function of electron temperature and drift velocity.In addition to Ne 2pi and Kr 2p5 Ar 2pi is used as a thirdemission line in order to improve statistics. The result is asurface, which is, in case of a fixed temperature, reduced to a Figure 7. Semi-logarithmic plot of the ratio of the excitationfunctions of Ne 2pi and Kr 2ps as a function of the electrontemperature assuming a Maxwellian distribution function. Figure 8. Ratio of the excitation functions of Ne 2pi and Kr 2ps as afunction of drift velocity and electron temperature assuming ashifted Maxwellian distribution function. The line indicates the fact,that the ratio only depends on ua at a given Te. strictly increasing line (indicated line in figure 8). Knowingthe ratio, the determination of Va is unique. ne directly resultsfrom knowing Va and Te and is, therefore, also unique. An example for the determination of Va and ne at y =0.23 cm and t =364.9 ns by a least square fit is shown infigure 9. At this phase there is maximum excitation in thesecond half of the RF cycle close to the bottom electrode.Figure 9 shows a logarithmic plot of x’as a function of Eaand ne. Here x2 is defined as x?= (Ean -Ent)/o2, whereEan is the analytically determined value for the excitation(see section 4) and Efit the calculated value for the excitationresulting from the fit routine described in this paper. o is theerror, that occurs in terms of the analytical determination ofthe excitation (typically 5% of Ean). One can observe a welldefined minimum at Ea≈ 4.1eV (Va~ 1.2×10°ms-l)and ne ≈ 0.3. This minimum again shows, that the result ofthis fit is unique. For instance, the minimal xat Ea=0corresponding to a Maxwellian distribution function is morethan two orders of magnitude higher than the minimum atEa ~4.1eV. Further details regarding this algorithm arementioned in the appendix. Figure 10 summarizes the model to determine the EEDFincluding drift velocity, electron temperature and electrondensity. An analytical description for the electron impactexcitation function is found to be E(t)=(Cir sin (@ift+Di)+Chf sin (Whft +hf))+ B [(1), Ne 2pi-state, no cascades].Varying the free parameters in this analytical description, theexcitation function of each state is determined individuallyby fitting the emission calculated out of the expression forthe population density ((2a), equation (9)) of the respectivestate to the measured emission (2b). The electron temperatureis determined for each location individually out of the ratioof two excitation functions assuming a Maxwellian EEDF atthe phases of minimum excitation [(3), equation (14)].. Vaand ne are then varied fitting the excitation calculated out Figure 9. Logarithmic plot of x"as a function of Ea and ne aty=2.3 mm and t =364.9 ns. (Colour online.) (3) of the EEDF (equation (11)) to the analytically determinedone (4). 6. Results Typical examples of EEDFs close to the powered bottomelectrode at the phases of maximum and minimum excitationas well as an intermediate phase are shown in figure 11.The EEDF is approximately purely Maxwellian (no driftcomponent) at phases of minimum excitation and stronglyshifted at phases of maximum excitation. This clearlydemonstrates the strong influence of the drift component. Examples for the obtained parameter sets, that describethe EEDF, are shown in terms of the following plots. Figure 12 shows the time and space resolved electron driftvelocity in ms- in the discharge. It is maximum at phasesof maximum excitation and minimum at phases of minimumexcitation. The maximum absolute values in the bulk areof the order of 1.3 · 10ms-1. The absolute maximum of2×10ms-occurs at the sheath edge, where the electronsare accelerated by the expanding sheath. The further these fastelectron beams penetrate into the plasma bulk the more energyis lost through collisions with the background gas (heating) andthe lower the remaining drift velocity. Generally the electrondrift velocity is high at the sheath edge, where the electronbeam is generated, decreases in the bulk and increases againas it approaches the opposite electrode. The interaction ofenergetic electrons with the opposite sheath is complex andthe interpretation of this characteristic of the drift velocity isnot clear. Vender and Wood obtained very similar results for the driftvelocity of highly energetic electron beams in PIC simulations Figure 11. EEDFs close to the bottom electrode sheath edge(y=2.3 mm) at t=86.1 ns (maximum drift velocityVa~ 1.53×10°ms-),t =77.9 ns and t = 65.6 ns (minimum driftvelocity Va0ms-) at Te=2.85eV. Figure 13. Space resolved electron density (E≥ 11.7eV) at thephases of maximum excitation in the plasma bulk during the firsthalf of one low frequency RF cycle. 2.2E6 2.131E6 2,063日 .925 1.719E6 1,.65E 561F6 1.377 1,306 E6 1..031E6 9.625E5 838F5 3.225E5 77.563E56654 5.875E5 11 .5E5 4.813E第 433.42 33818E5 .75E5 2.063E5 1.3377755EE5 6,875E4 Figure 12. Phase and space resolved contour plot of the electrondrift velocity in the discharge. (Colour online.) distance from powered electrode [mm] of single frequency CCRF discharges in Hz [24] and argon [25]at low pressures, respectively. Gans observed similar driftvelocities experimentally in H2 at high pressures [12] andO'Connell observed beam-like highly energetic electrons in H2at low pressures [26]. All these simulations and experimentsshow the generation of highly energetic electrons with a driftvelocity of the order of 10°ms-at the sheath edge. Figures 13 and 14 show the space resolved electron densityat the phases of maximum excitation in the plasma bulk duringboth halves of one low frequency RF cycle, respectively.The density is maximum at the sheath edges, where the driftvelocities are maximum..I1t increases with time as long asconfinement of electrons is good. One can observe the collapseof the powered bottom electrode sheath during the first half andof the grounded top electrode sheath during the second half,since the density at the expanded sheath increases with timein relation to the density at the collapsed sheath. The densityprofiles in figures 13 and 14 are different, since the figures showdensity profiles during different halves of one low frequencyRF cycle. During the first half the low frequency sheath infront of the powered electrode collapses and beams propagatetowards the grounded electrode, where they hit the sheathand are reflected. During the second half, the low frequency Figure 15. Spaceresolved electron temperature during the first halfof one low frequency RF cycle. Second, principally electron beams are also generated by theexpanding high frequency sheath at phases of expanded lowfrequency sheath. However, this generation is less effective,since the high frequency sheath oscillates in a region of highion density.Therefore, at a given voltage the amplitude of thehigh frequency sheath oscillation is low at high ion densitiescompared with regions of low ion densities (collapsed lowfrequency sheath). Consequently, electrons gain less energyat the grounded electrode sheath during the high frequencysheath expansion phase and during the first half of one 2 MHzRF cycle. Therefore, these beams lead to much less excitation.Nevertheless, they lead to an increased electron density atone electrode, if the low frequency sheath is fully expanded.As the energy of these beam electrons is much lower, theydo not propagate through the entire discharge and do notcontribute to the electron density at the opposite electrode,where the highly energetic beam originates from.Third.at the phases of maximum low frequency sheath expansionsecondary electrons are expected to play an important role,since the voltage is mainly determined by the low frequency.These high energetic secondary electrons lead to an increasedelectron density close to the respective electrode, where andwhen the low frequency sheath is fully expanded. According to Brinkmann [27] the sheath edge is definedas spatial position s, where the following condition is fulfilled: where x= 0 is the position of the electrode..Here thesheath width is roughly estimated from a spatio-temporalplot of the excitation (figure 4) to be the distance betweenelectrode and the spatial position where the excitation starts toincrease (0.1cm). As the sheath width is very small, temporalmodulations of the position of the sheath edge cannot beestimated from this plot. These modulations are assumed tofollow the modulation of the applied RF voltage qualitatively. Figures 15 and 16 show the space resolved electrontemperature during the first and second half of one lowfrequency RF cycle under the assumption of a constanttemperature during each half of one cycle at each individualposition. The plots justify this assumption, as the temperaturesat each position do not differ substantially during the different Figure 16. Space resolved electron temperature during the secondhalf of one low frequency RF cycle. Figure 17. Space resolved electron mean energy at 86.1 ns. halves of one cycle. As a good approximation Te is spatiallyconstant. It should be noted again that Te is not equivalentto the electron mean energy (see section 5). However, theelectron mean energy (e) at individual positions and phasescan be determined from the EEDF: As an example the electron mean energy at 86.1 ns isshown spatially resolved in figure 17. It is determined from theEEDF shown in figure 11 at a phase of maximum excitationapplying equation (16). Ais mentioned in section 5 it isassumed, that the determined EEDF is also valid for electronswith energies below the threshold energy. However, therecould be deviations, which would affect the calculated meanenergy. In contrast to Te the electron mean energy is not spatiallyconstant, but increases towards the electrodes, since thereelectrons gain energy by interacting with the sheath. In general,figures 15-17 show that the variation of the electron meanenergy mainly depends on the variation of the drift velocityrather than on T. Important plasma parameters of an industrial dual-frequencyCCRF discharge were determined with high temporaland spatial resolution. Profiles of electron temperature,drift velocity, qualitative electron density and EEDF werecalculated out of the measured emission. In the correspondingalgorithm a time dependent model based on rate equationsis applied in order to determine the excitation functions ofvarious excited rare gas states. Under the assumption of anadequate shape of the distribution function, that depends onthe discharge geometry, the EEDF and these plasma parameterswere extracted from the measured emission. The knowledge of these plasma parameters allows adetailed analysis and understanding of electron dynamicsin dual-frequency discharges..Due to the high temporaland spatial resolution of these measurements even localizedphenomena within the high frequency RF cycle are observable. Some important characteristics of electron dynamics indual-frequency discharges could be discovered: the excitationofhigh energy states is strongly modulated with space and timeIn particular the temporal variation is complex and depends onboth frequencies. This strong coupling of both frequencies aff-ects the excitation dynamics within the low- as well as the highfrequency cycle. Therefore, the separate control of ion energyand electron density should be expected to be limited. Electronconfinement by the low frequency voltage, that shields the elecC--trodes during most of the low frequency RF cycle, might playan important role. Plasma sustainment is dominated by ener-getic electrons produced through the dynamics of the plasmaboundary sheath. The EEDF is not purely Maxwellian at allphases, but its high energy tail is strongly modulated duringmost of the RF cycle. The EEDF is not shifted at phases, wherethe sheath edge is approximately at rest and strongly shifted tohigher energies, when the sheath expands. For industrial applications an important result is the strongcoupling between both frequencies, that is most evident in thespatio-temporal excitation plots. Excitation, ionization andconsequently also electron density is not determined only bythe high frequency component. There is also a substantialmodulation of the excitation with twice the low frequency.Furthermore, the EEDF is determined at high spatial andtemporal resolution. The knowledge of the EEDF is essentialfor industrial processes, since it governs dissociation andionization. Acknowledgments This research was supported by Lam Research Inc., theEU (FP5), the DFG (SFB 591 and GRK 1051) and theStudienstiftung des dt. Volkes. The authors would like to.thank Ronan Faulkner and Paul Swift for their help with theexperimental setup. Appendix In principle the mathematical problem solved in section 5using the algorithm described in the paper could also besolved directly. From a purely mathematical point of viewa system of three equations and three variables needs to be solved. However, this system consists of implicit functionsand is, therefore, difficult to solve explicitly. If a solutionis found, it will not necessarily be physically reasonable. Thereason for this is the fact that the excitation is already the resultof a fitting routine described in section 4 and, therefore, onlyan approximation. Again from a purely mathematical point of view a functioncould be derived, that yields one plasma parameter in depen-dence of another, for example Va= Va(Te). However, such afunction does not have to be surjective. This means that notevery combination of values for the excitation of the three ene-rgy levels can be reproduced. An extreme example in case ofthree emission lines would be the following: if lines 1 and 2 forsome reason have a measured intensity of 0% at a given posi-tion and phase and line 3 an intensity of 100%, there will not bea combination of Va, Te and ne, that reproduces these values. Here the problem was simplified by reducing the numberof free parameters from 3 to 2.As described before theelectron temperature is determined separately at specificphases of minimum excitation, when the electron drift velocityis negligible, and assumed to be constant for one half ofthe low frequency RF cycle. When the electron temperatureis known, the system of equations still consists of threeequations (3 lines), but only two variables. Such a systemof equations is overdetermined and does not have a uniquesolution. Therefore, the above fitting algorithm is appliedminimizing the x. References ( [1] Boyle P C, Ellingboe A R and Turner M M 2004 PlasmaSources Sci. Technol . 13 49 3- 503 ) ( [2] Boyle P C, Ellingboe A R and Turner M M 2004 J. P hys.D : Appl. Phys. 37 697 ) ( [3] K itajima T, Takeo Y, Petrovic Z L and Makabe T 200 0 Appl. P hys. L ett. 77 489 ) ( [4] D enda T , Miyoshi Y, Komukai Y, Goto T, P etrovic Z L and M akabe T 2004 J. A ppl. Phys. 95 870 ) ( [5] Kawamura E, Lieberman M A and Lichtenberg A J 2006 Phys.Plasmas 13 053506 ) [6] Turner M M and Chabert P 2006 Phys. Rev. Lett. 96 205001 ( [7 ] G ans T, Schulze J, O’Connell D, Czarnetzki U, Faulkner R, E llingboe A R and T urner M M 2006 Appl. P h ys. Lett. 89 261502 ) ( [8] Karkari S K, Gaman C and Ellingboe A R 2006 Proc. 18thESCAMPIG (Lecce) ) ( [9] Tochikubo F, Suzuki A, Kakuta S, Terazono Y and Makabe T1990 J. Appl. Phys. 68 5 532 ) ( [ 1 0] T adokoro M, Hirata H, N akano N, Petrovic Z and Makabe T1998 Phys. Rev. E 57 1 ) ( [11] Mahony C MO and Graham W G 1999 IEEE Trans. Plasma Sci. 27 72 ) ( [12] Gans T, Schulz-von der Gathen V and Dobele H F 2004Europhys. L ett. 66 2 32-8 ) ( [13] Gans T, Lin C C, Schulz-von der Gathen V and Dobele H F 2003 Phys. Rev. A 67 012707 ) ( [ 1 4] E llingboe A R , Boswell R W, Booth J P and S adeghi N 1995Phys. Plasmas 2 1 807 ) ( [15] Gans T, Schulz-von der Gathen V and Dobele H F 2003 Proc. F rontiers in Low Temperature Plasma Physics (Bari) ) ( [ 1 8] F rancis A, Czarnetzki U, Dobele H F and Sadeghi N 1 998 E ur. Phys. J. 4 239 ) ( [19] NIST a t omic sp e ctra database ht t p ://physlab.nist.gov /c gi-bin/AtData/main _ asd ) ( [20] Chilton JE, Stewart M D and Lin C C 2000 Phys. Rev. A 6152708 ) ( [21] C hilton J E, Boffard J B, Schappe R S and Lin C C 1998 Phys. Rev. A 57 267 ) ( [22] Chilton J E, Stewart MD and Lin C C 2000 Phys. Rev. A 62 32714 ) ( [23] S adeghi N, Setzer D W,Francis A, Czarnetzki U andDobele H F 2001 J. Chem. Phys. 115 3144 ) ( [24] Vender D and Boswell R W 1990 IEEE Trans. Plasma Sci. 18 725 ) ( [27] B rinkmann R P 2 0 0 7 J. Appl. P h ys. a t press ) O IOP Publishing Ltd Printed in the UK
确定


还剩10页未读,是否继续阅读?

北京欧兰科技发展有限公司为您提供《工业双频电容耦合射频放电,等离子体中空间和相位分辨等离子体参数检测方案(CCD相机)》,该方案主要用于其他中空间和相位分辨等离子体参数检测,参考标准--,《工业双频电容耦合射频放电,等离子体中空间和相位分辨等离子体参数检测方案(CCD相机)》用到的仪器有
相关方案
更多
该厂商其他方案
更多