


方案详情
文
The draft tube of a hydraulic turbine is the component where the flow exiting the
runner is decelerated, thereby converting the excess of kinetic energy into static pressure.
However, in some refurbishment cases, the installation of an upgraded runner with an old drafttube
leads to an undesirable efficiency drop as the discharge is increased above the best
efficiency point value. It is found to be related to a corresponding sudden variation in the draft
tube pressure recovery coefficient at the same discharge. The model of a recent refurbishment
which presents this instability is installed in the CREMHyG test rig. Steady and unsteady
measurements of velocity and pressure fields of the complex and highly turbulent swirling flow
exiting the runner have been carried out at CREMHyG (Grenoble). They included the three
components of the velocity. The flow in the draft tube is rich in secondary flows and possible
flow separation due to the elbow as well as to the divergent shape of this geometry. Pressure
and velocity field measurements in the draft-tube have been performed. They let us identify
some phenomena that may explain the origin of the unusual behavior of the draft tube. Finally,
the same model, with a modified draft tube geometry that was designed to reduce the efficiency
drop phenomenon has been installed. Velocity measurements were made to validate the benefit
of such geometry modification.
方案详情

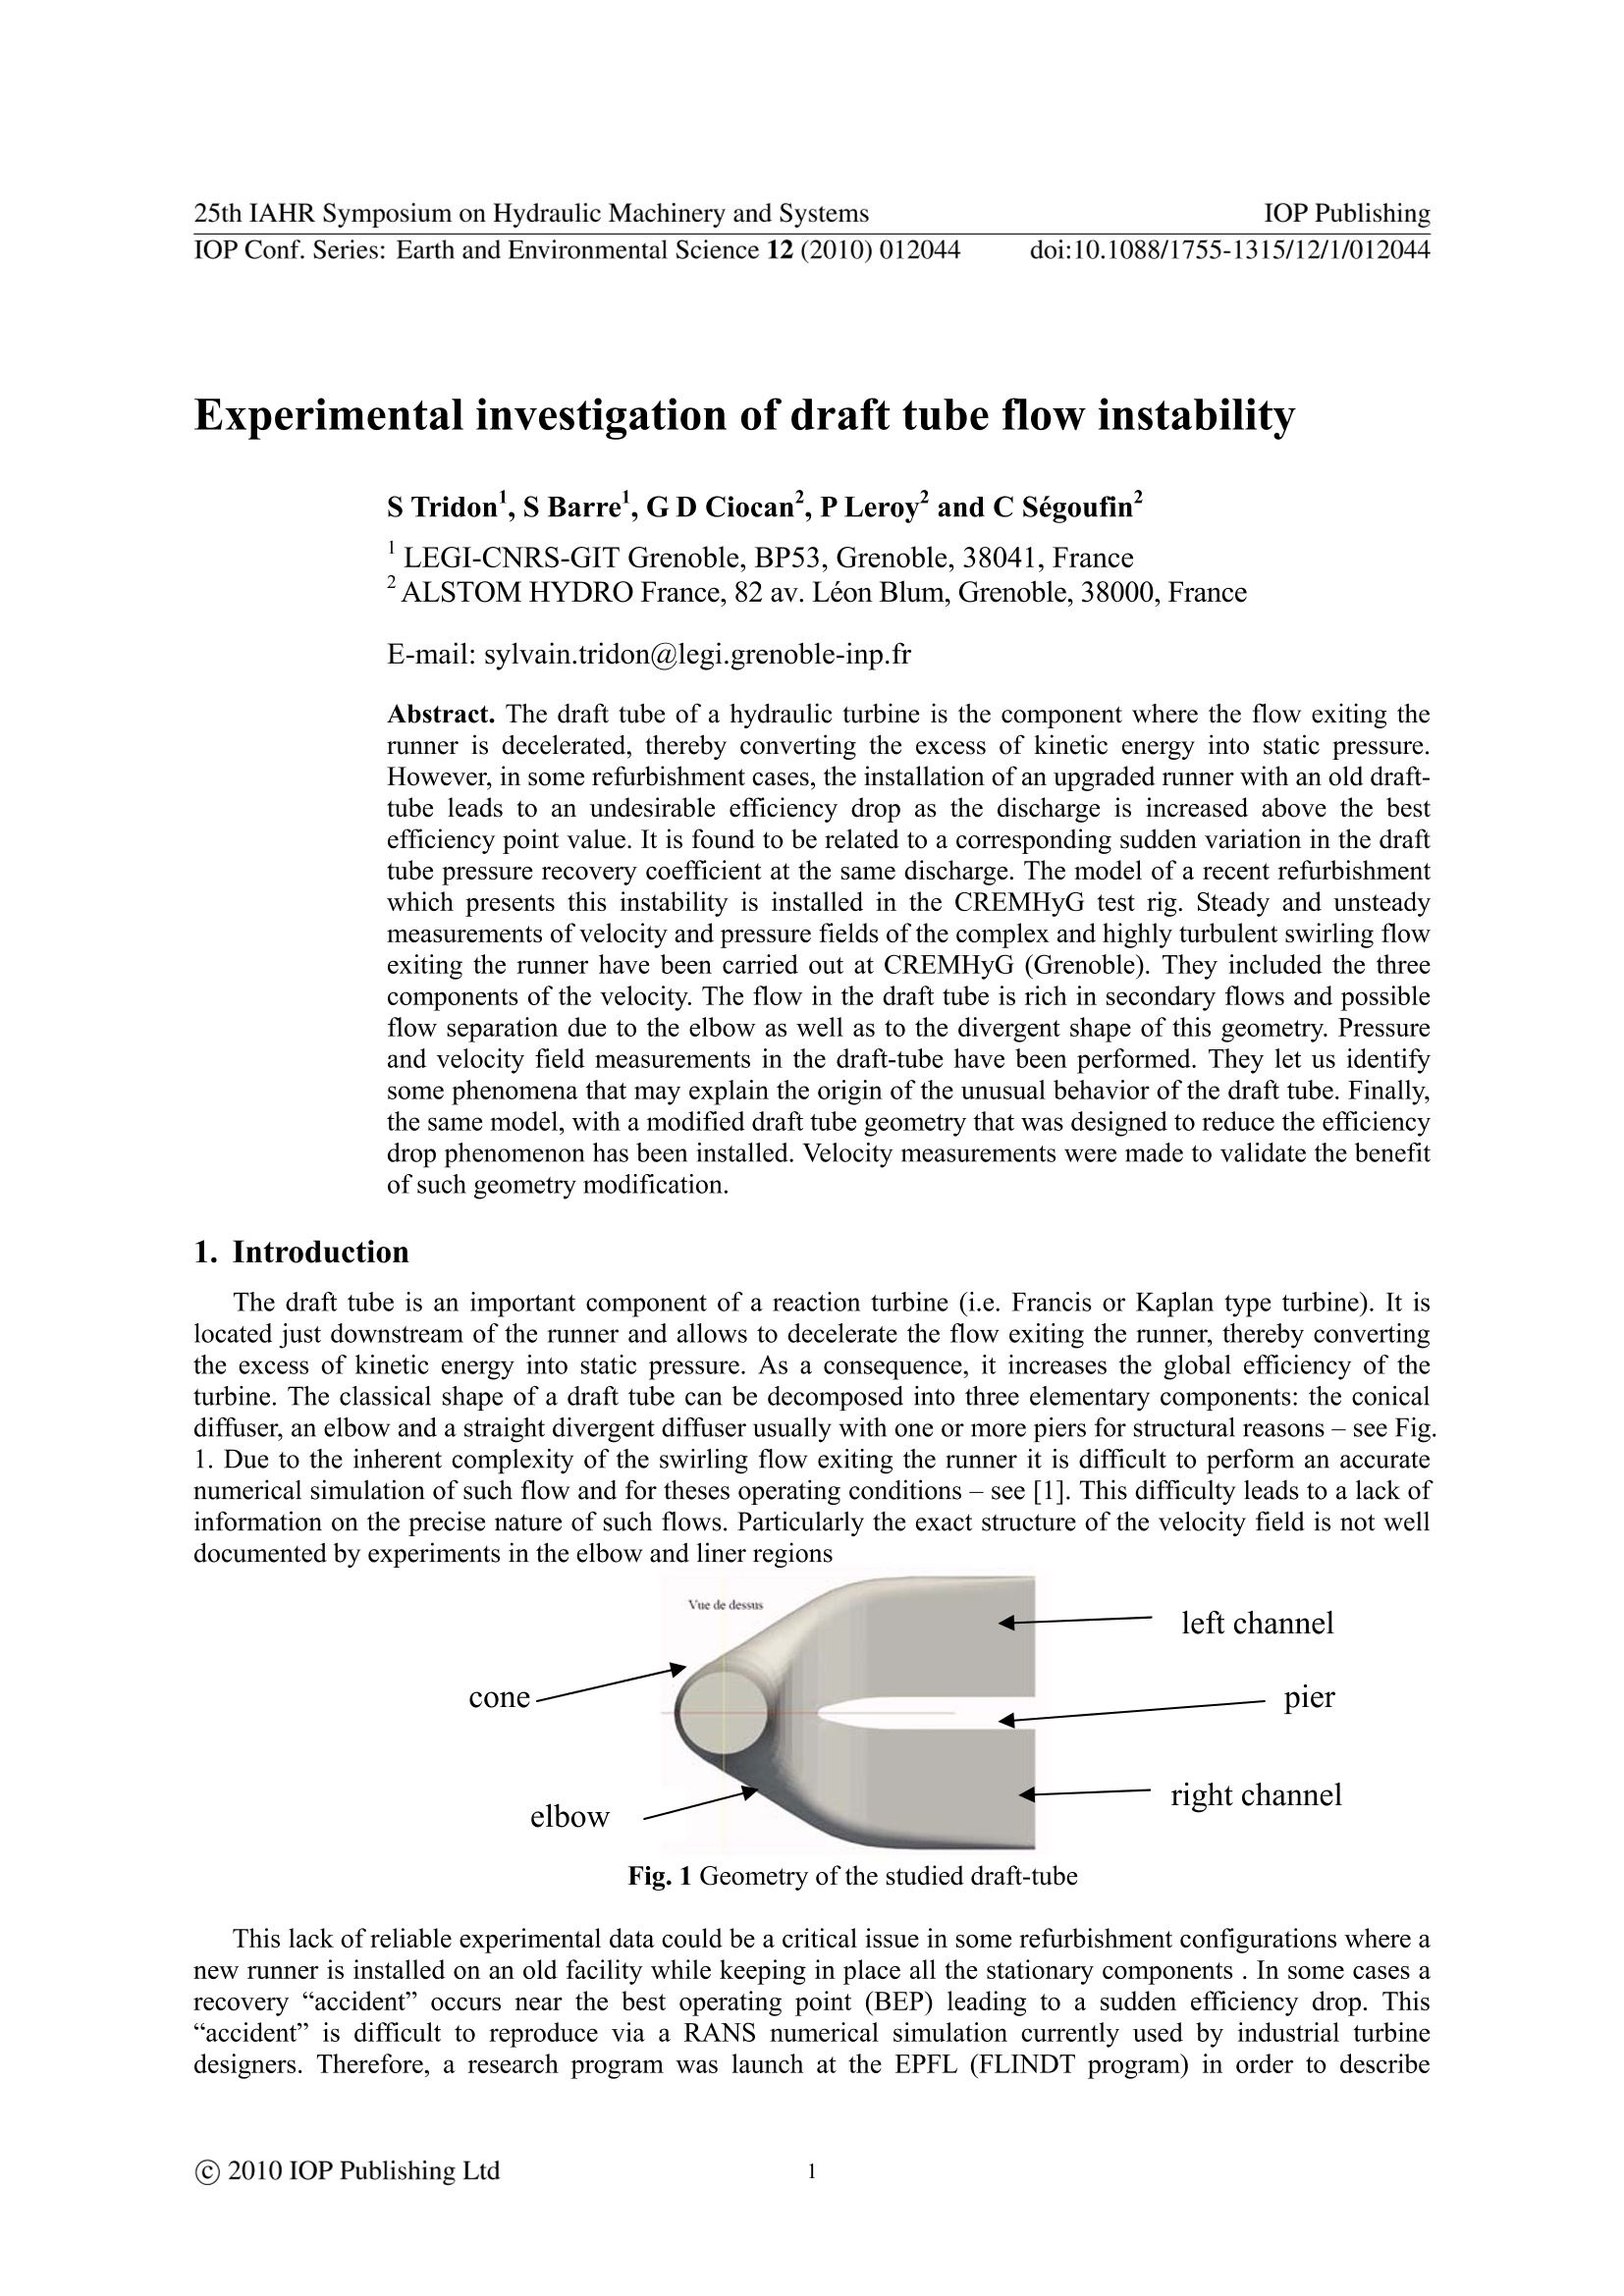
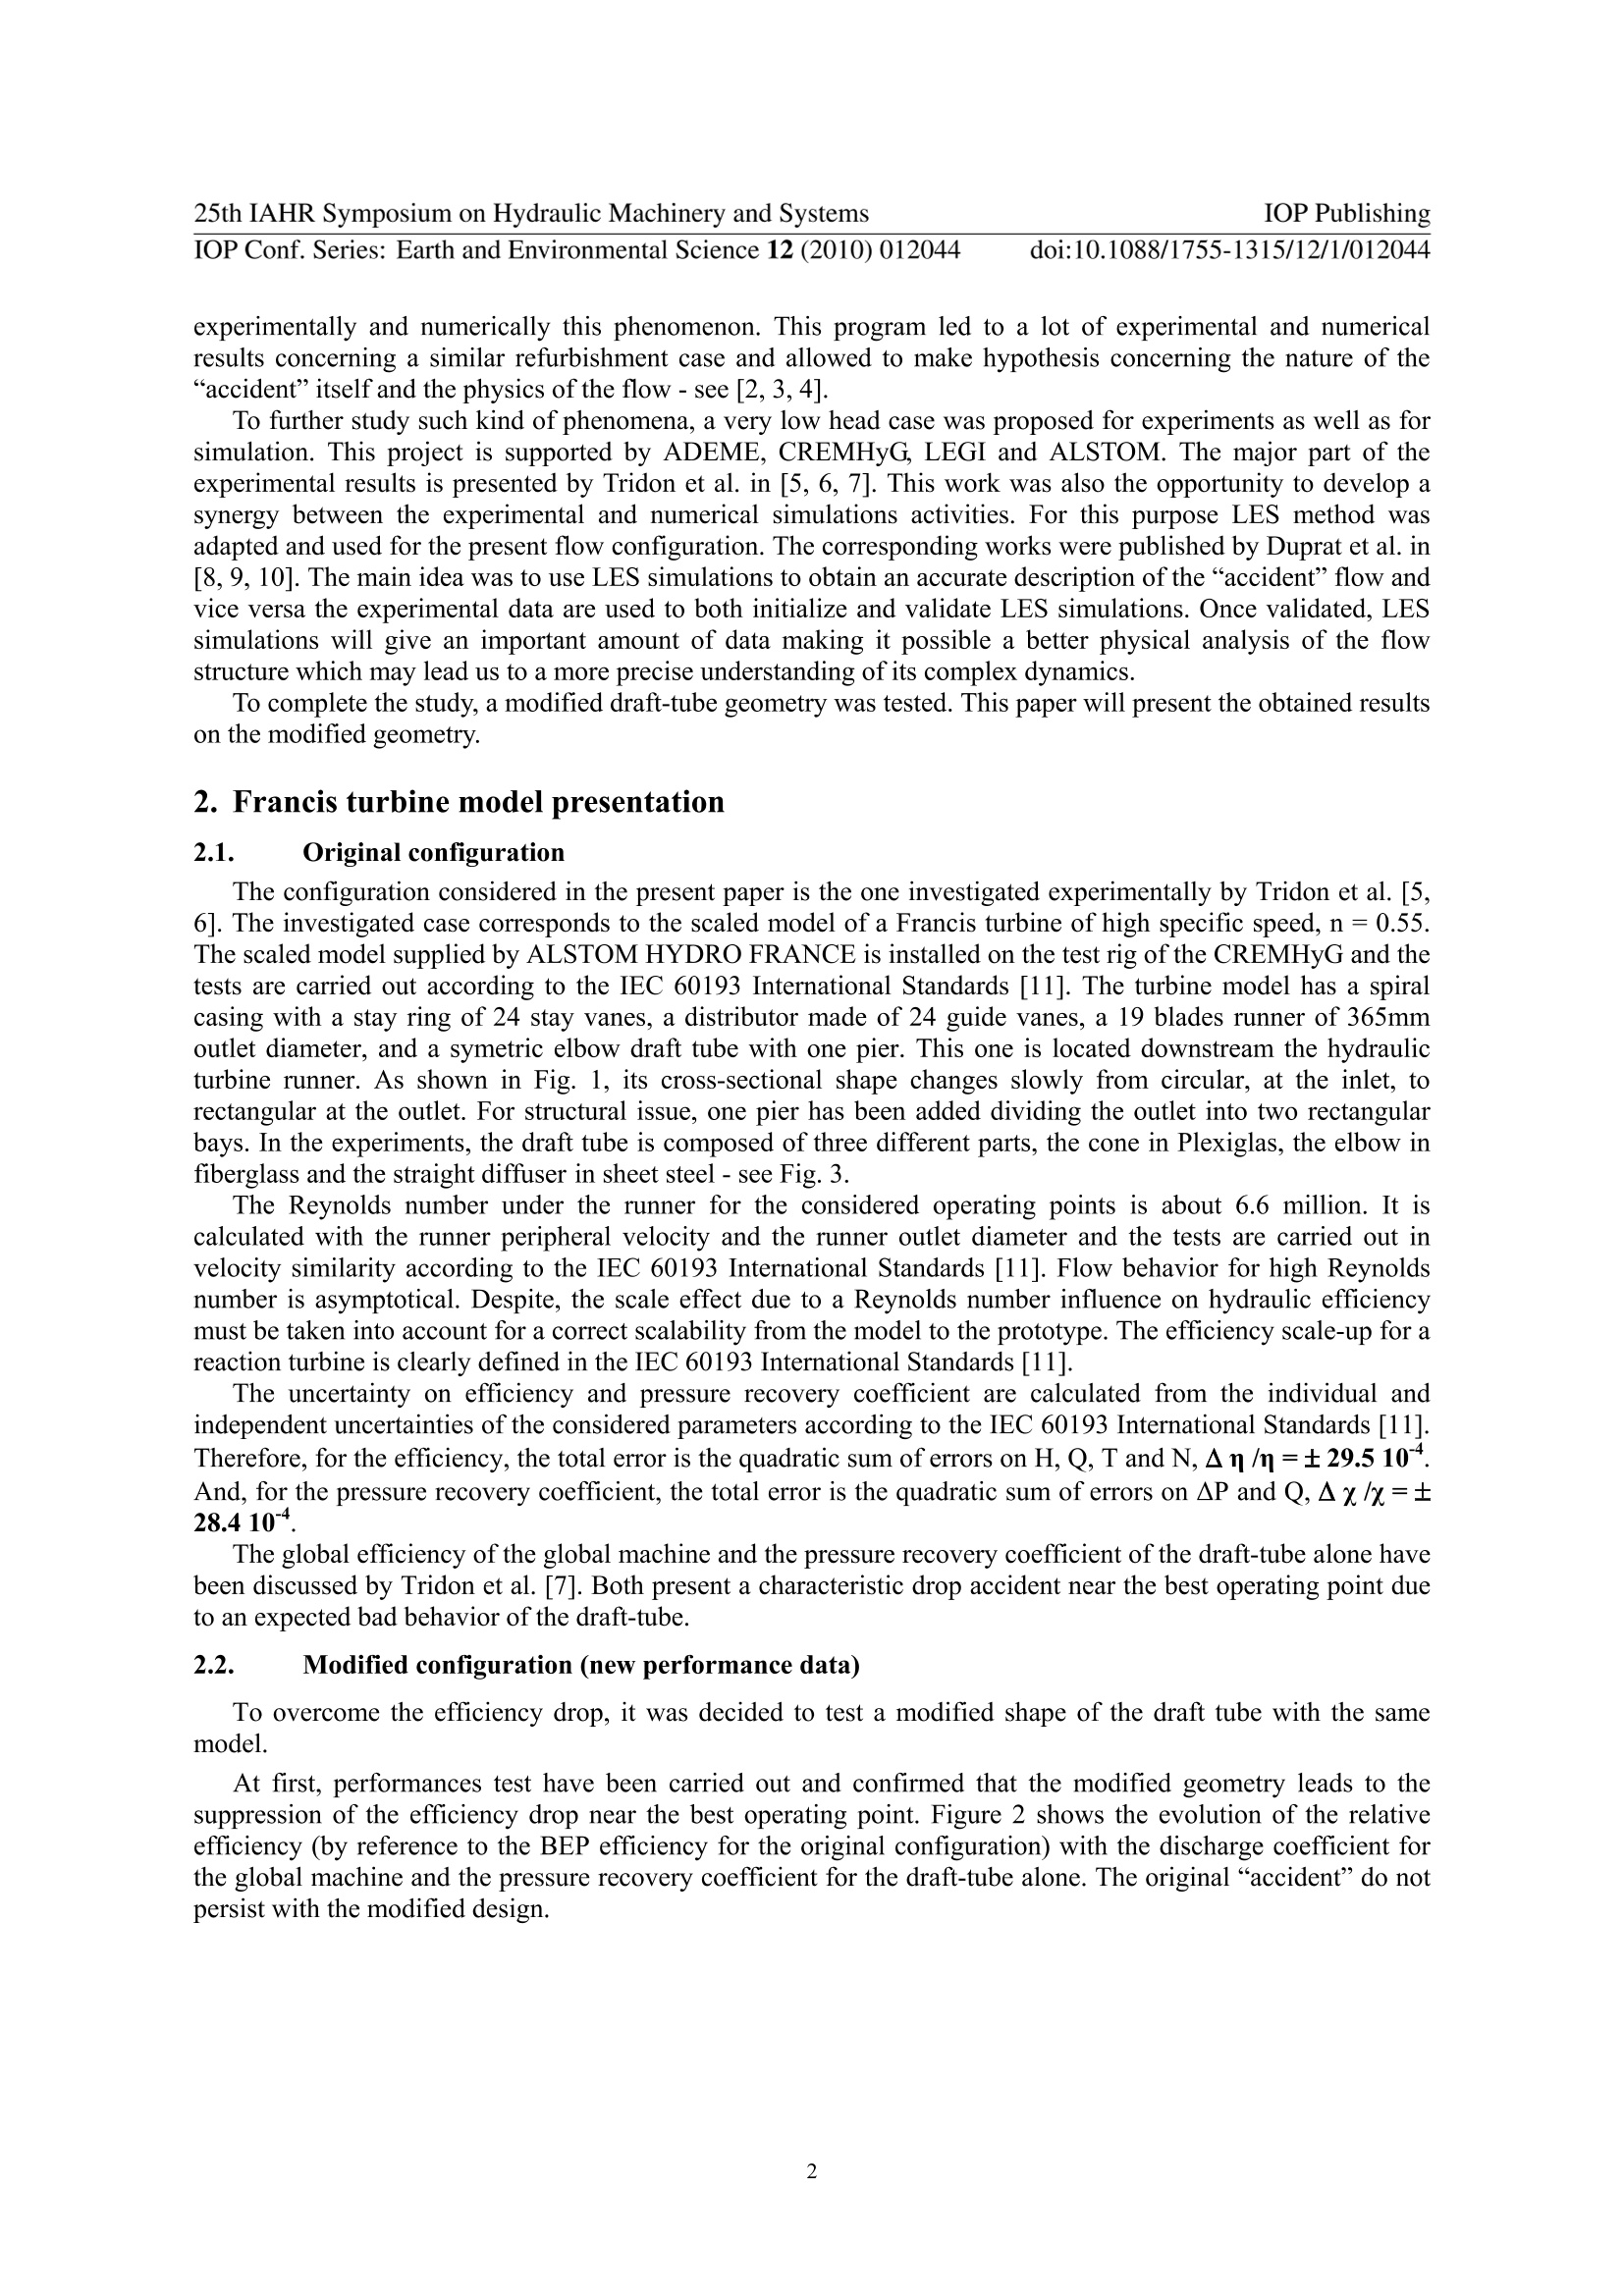
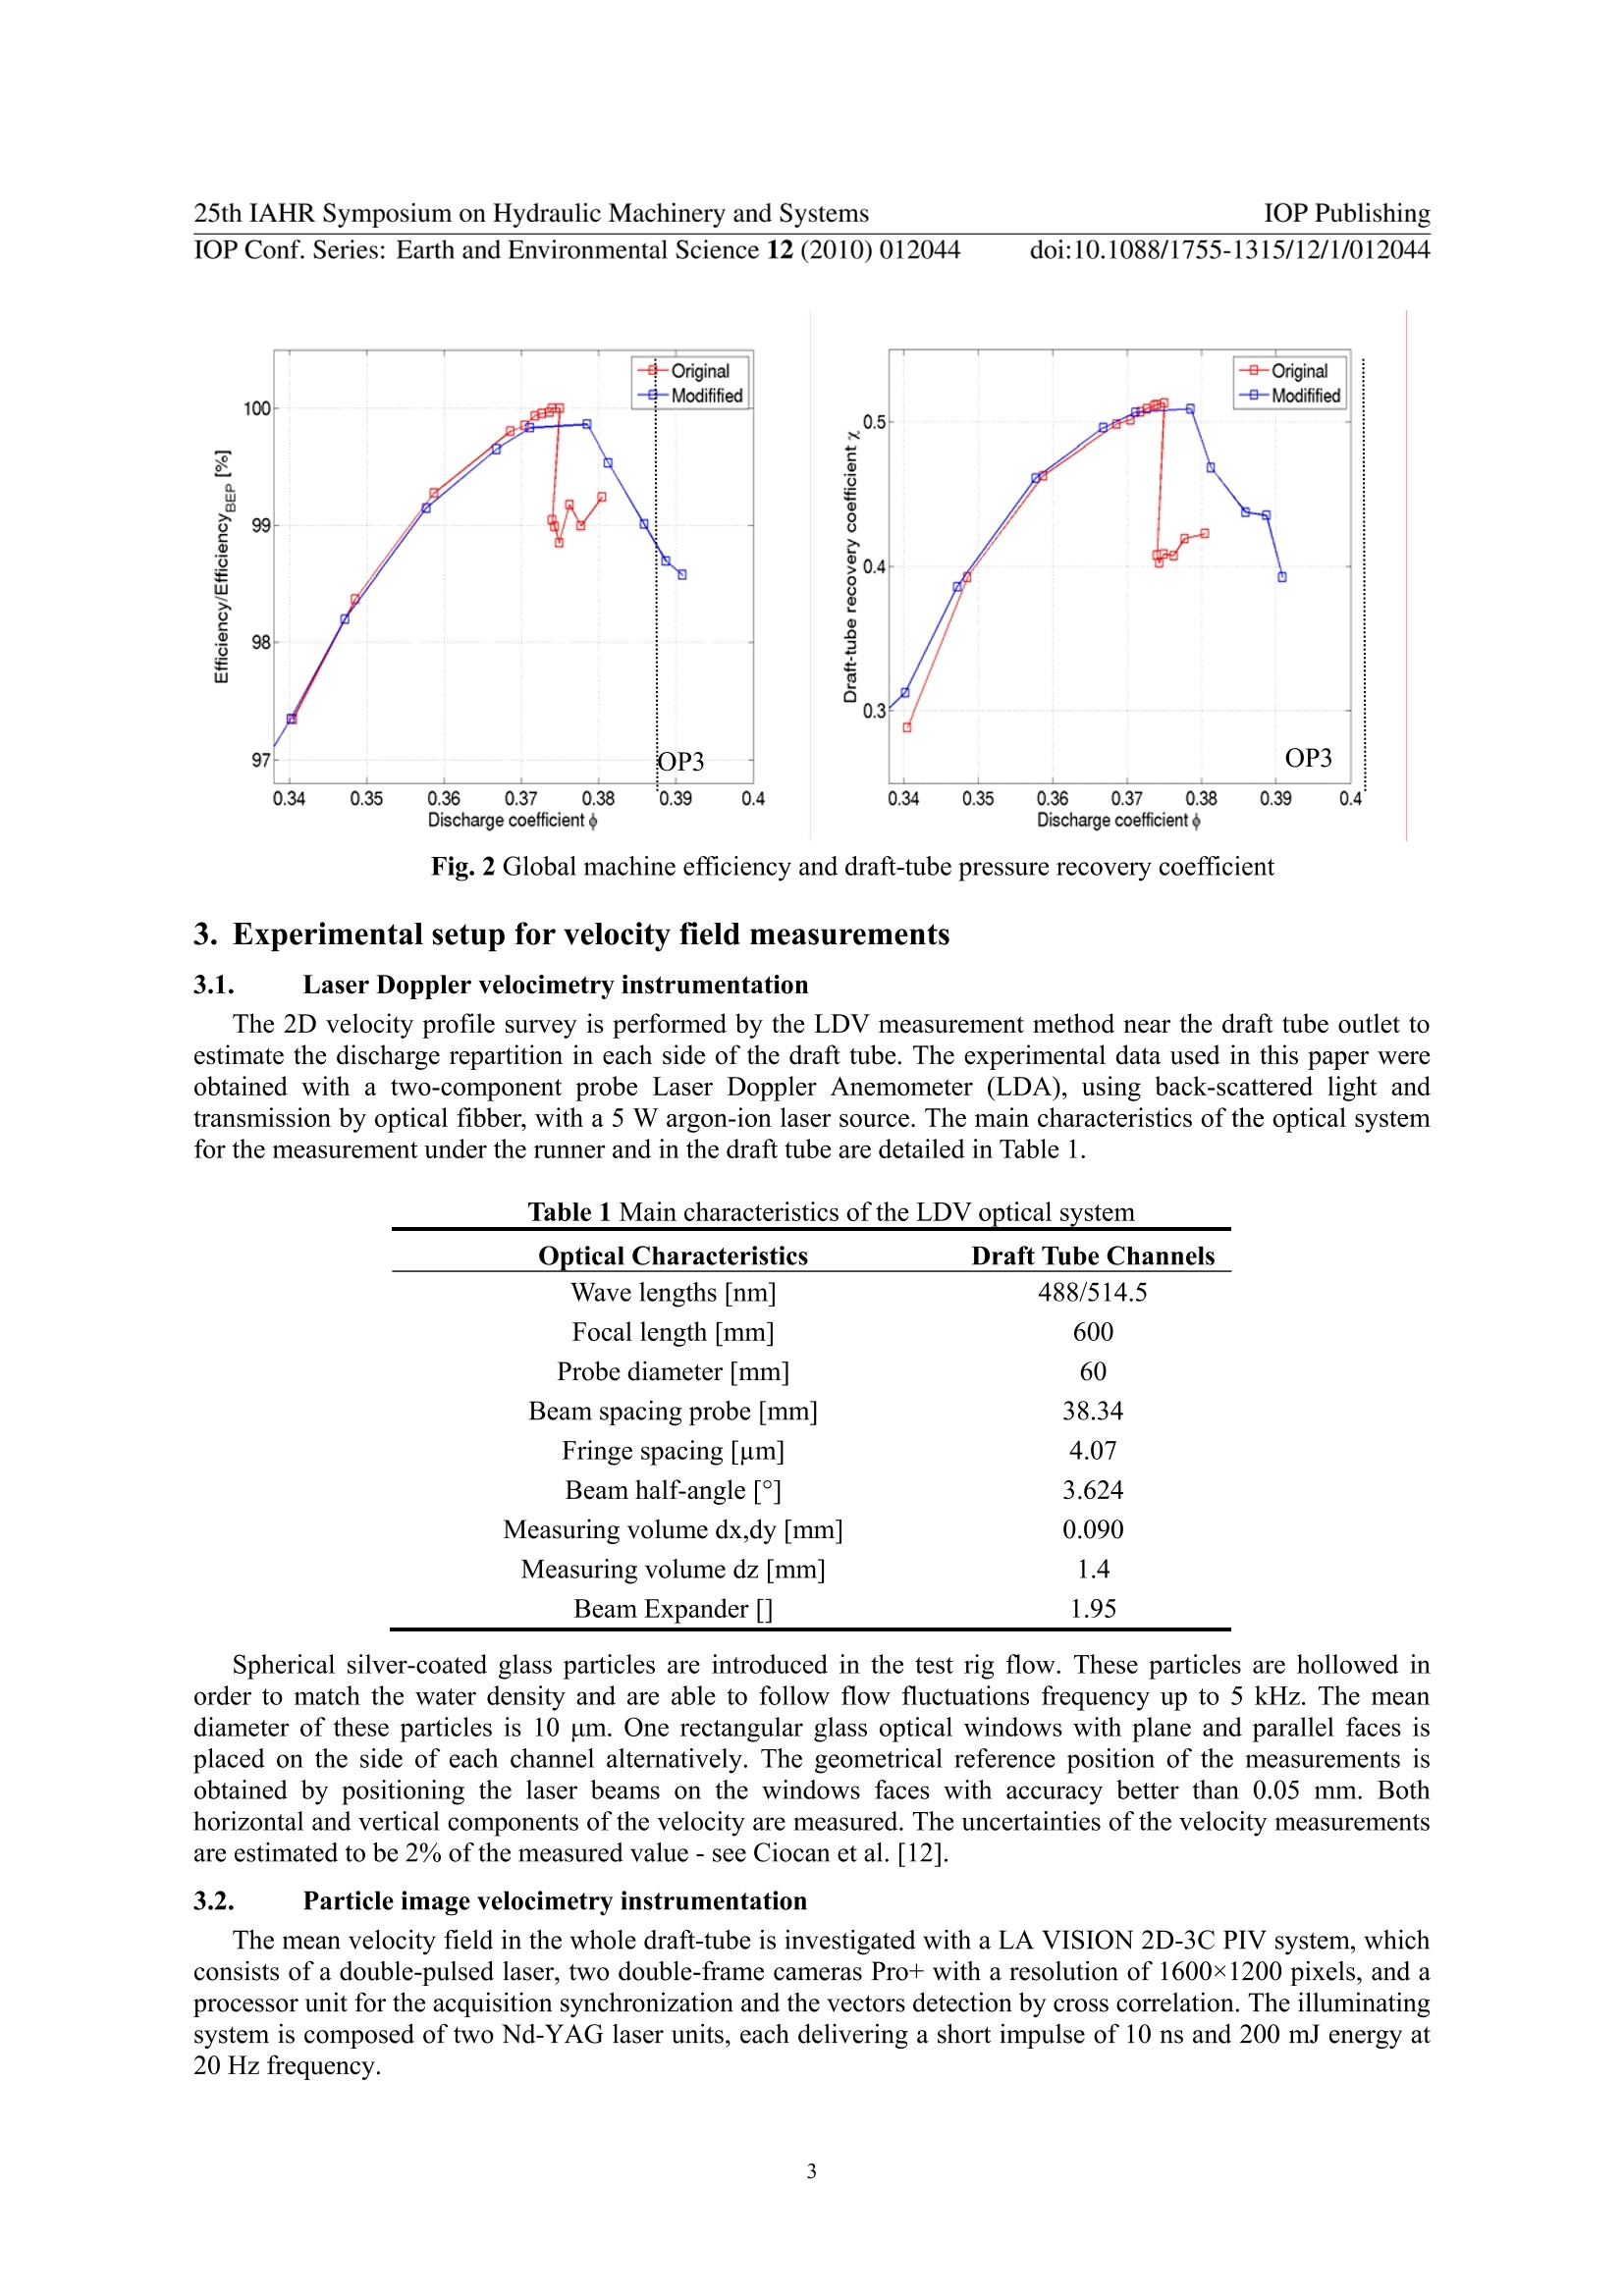
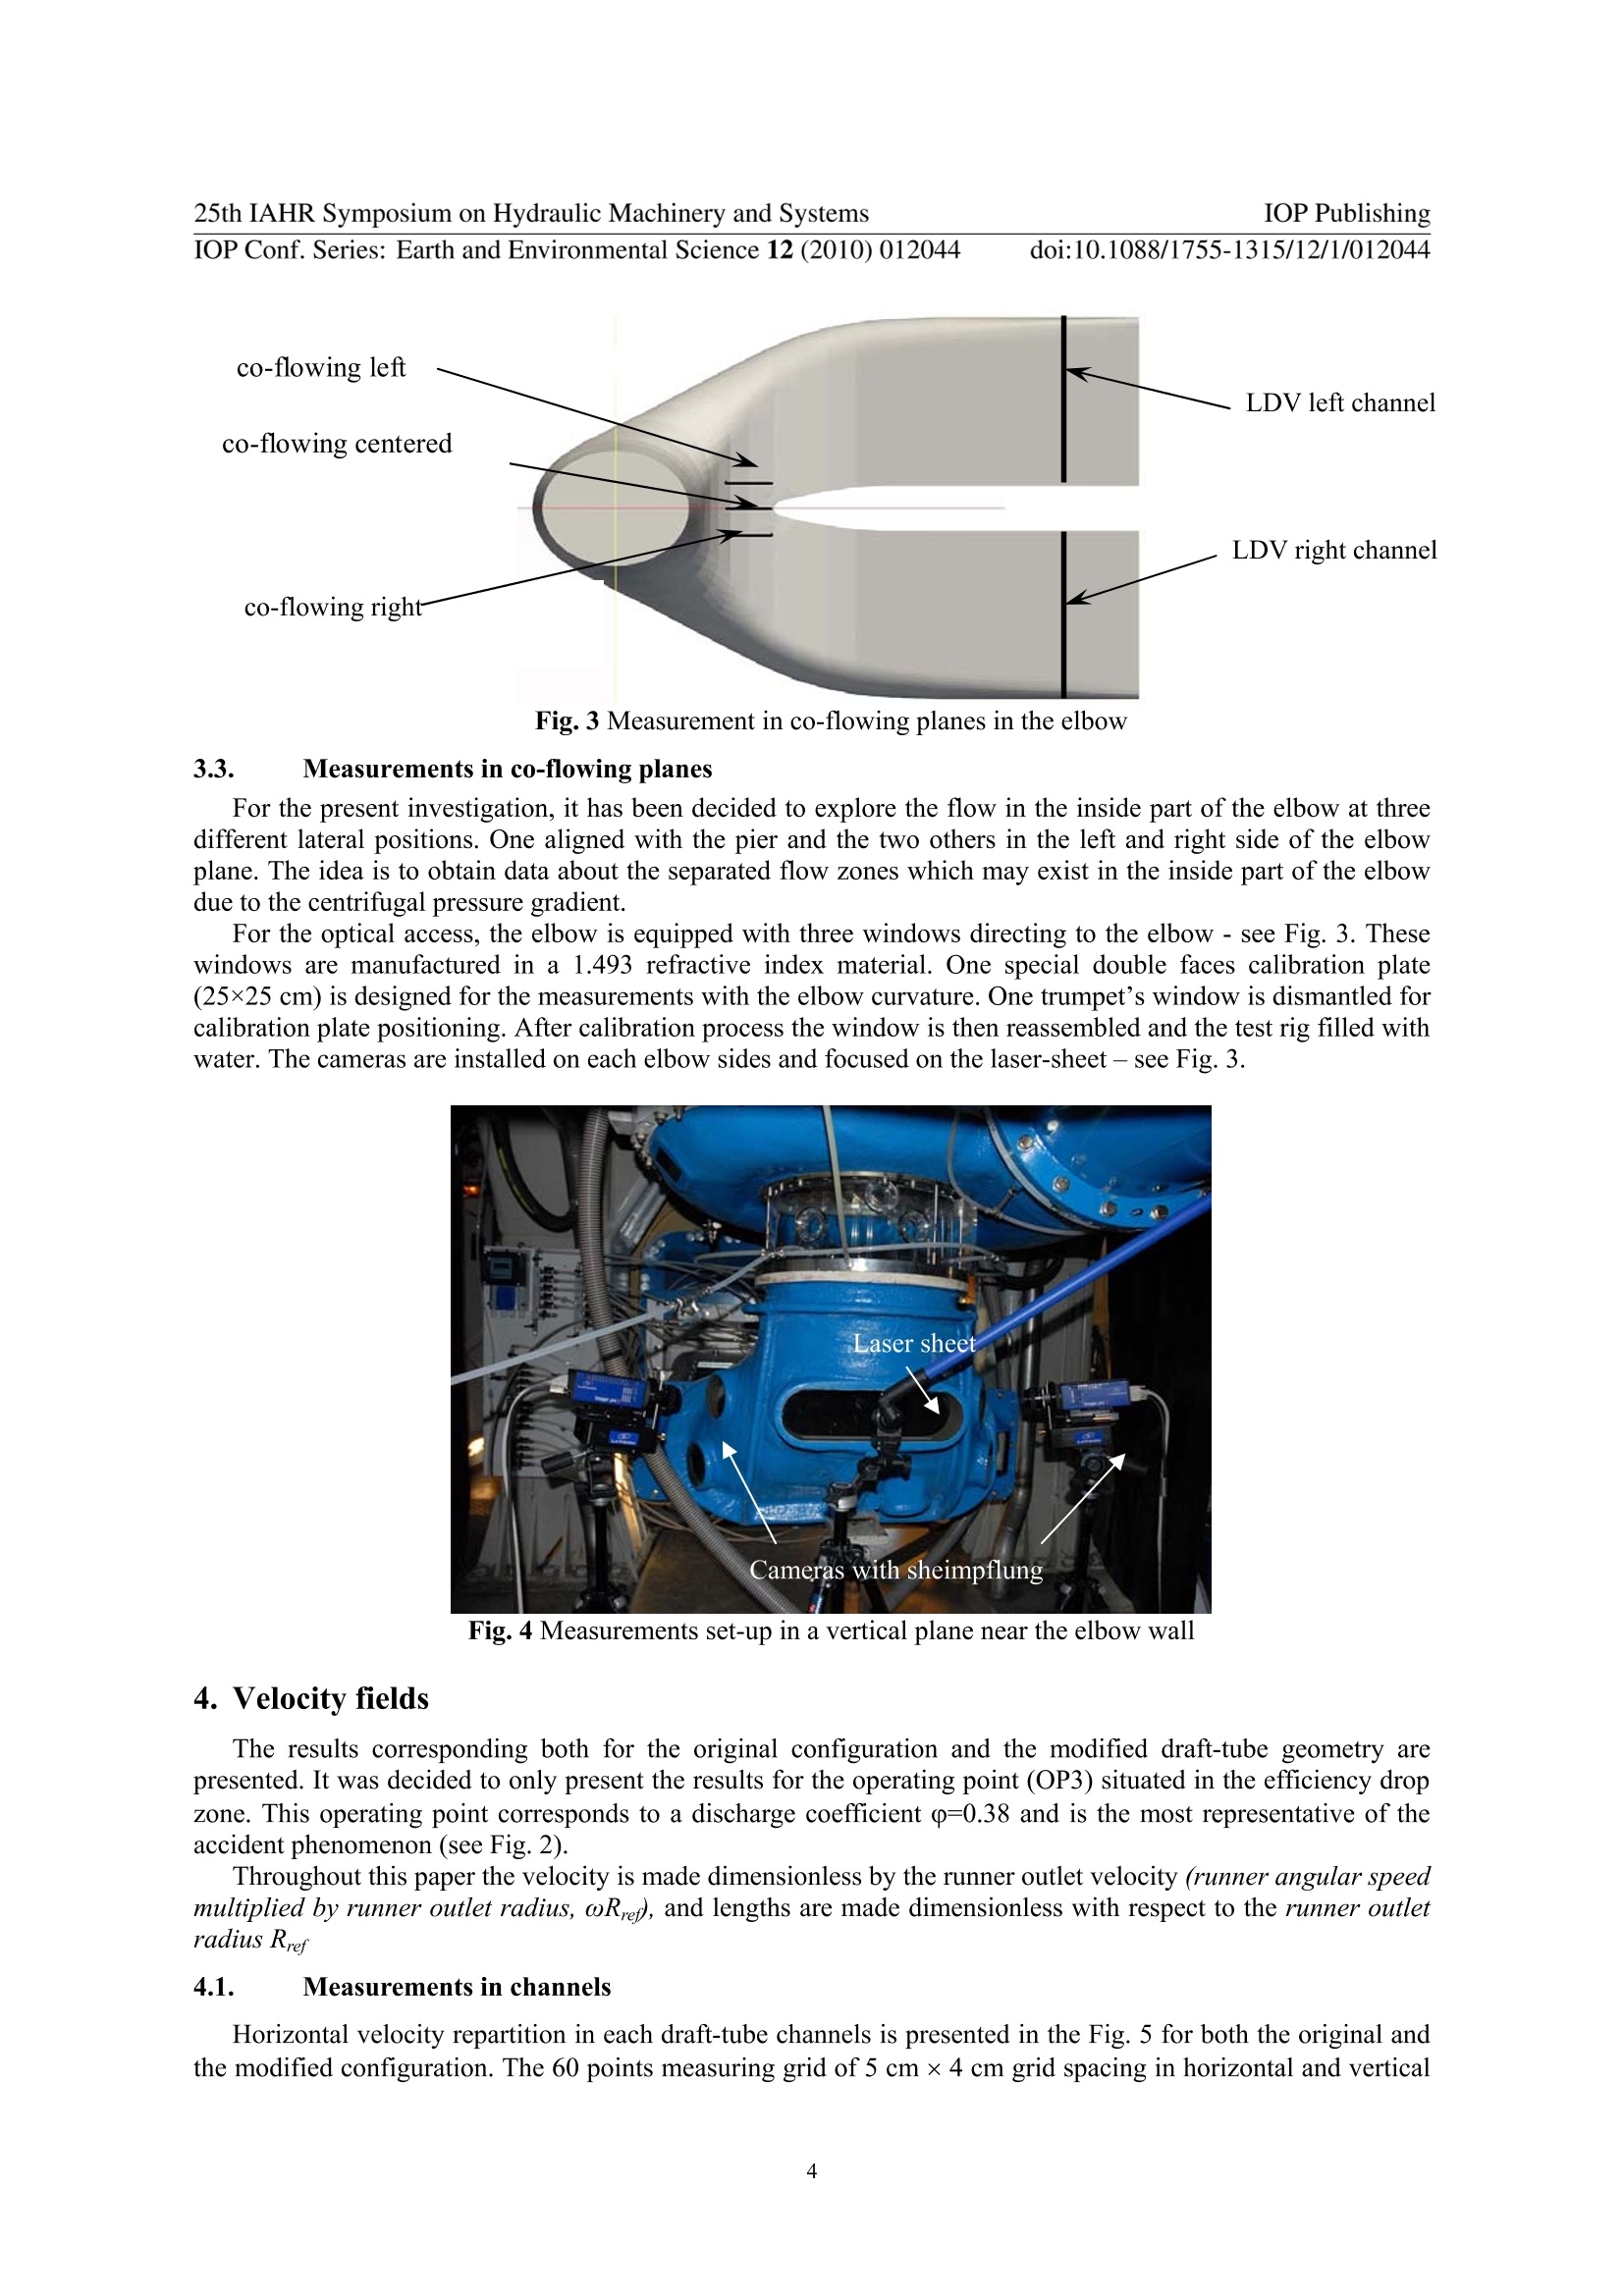
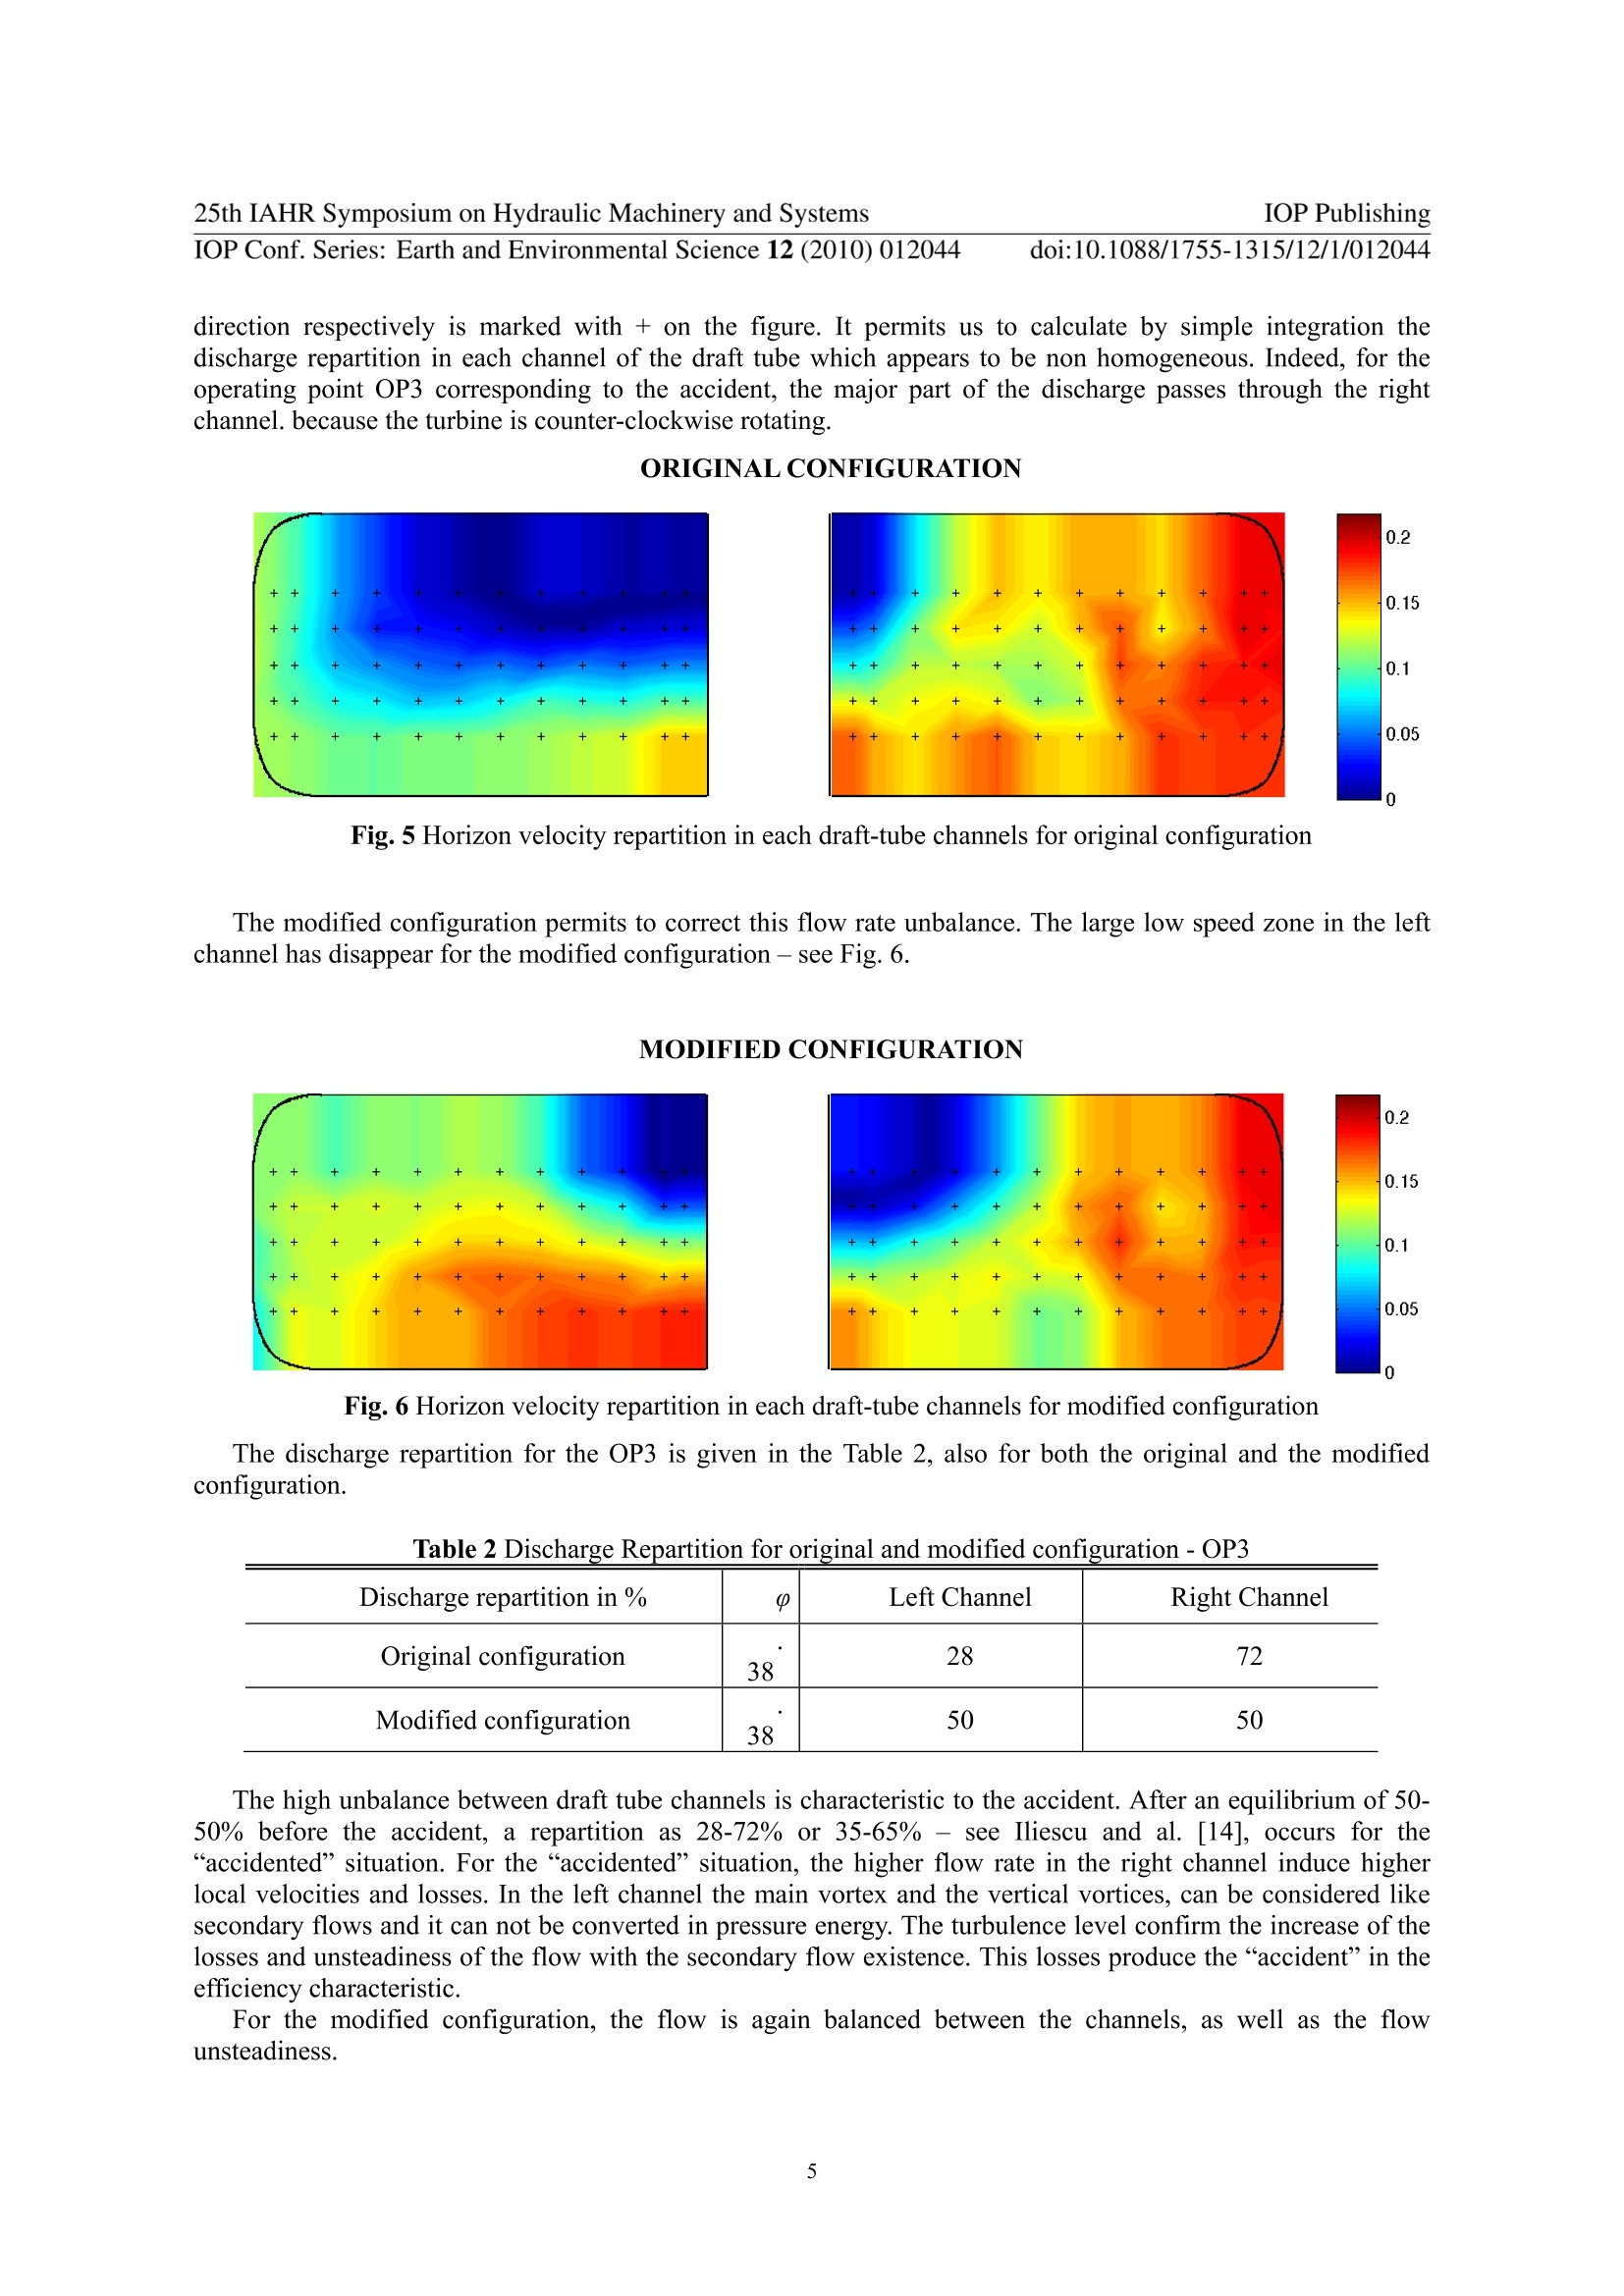
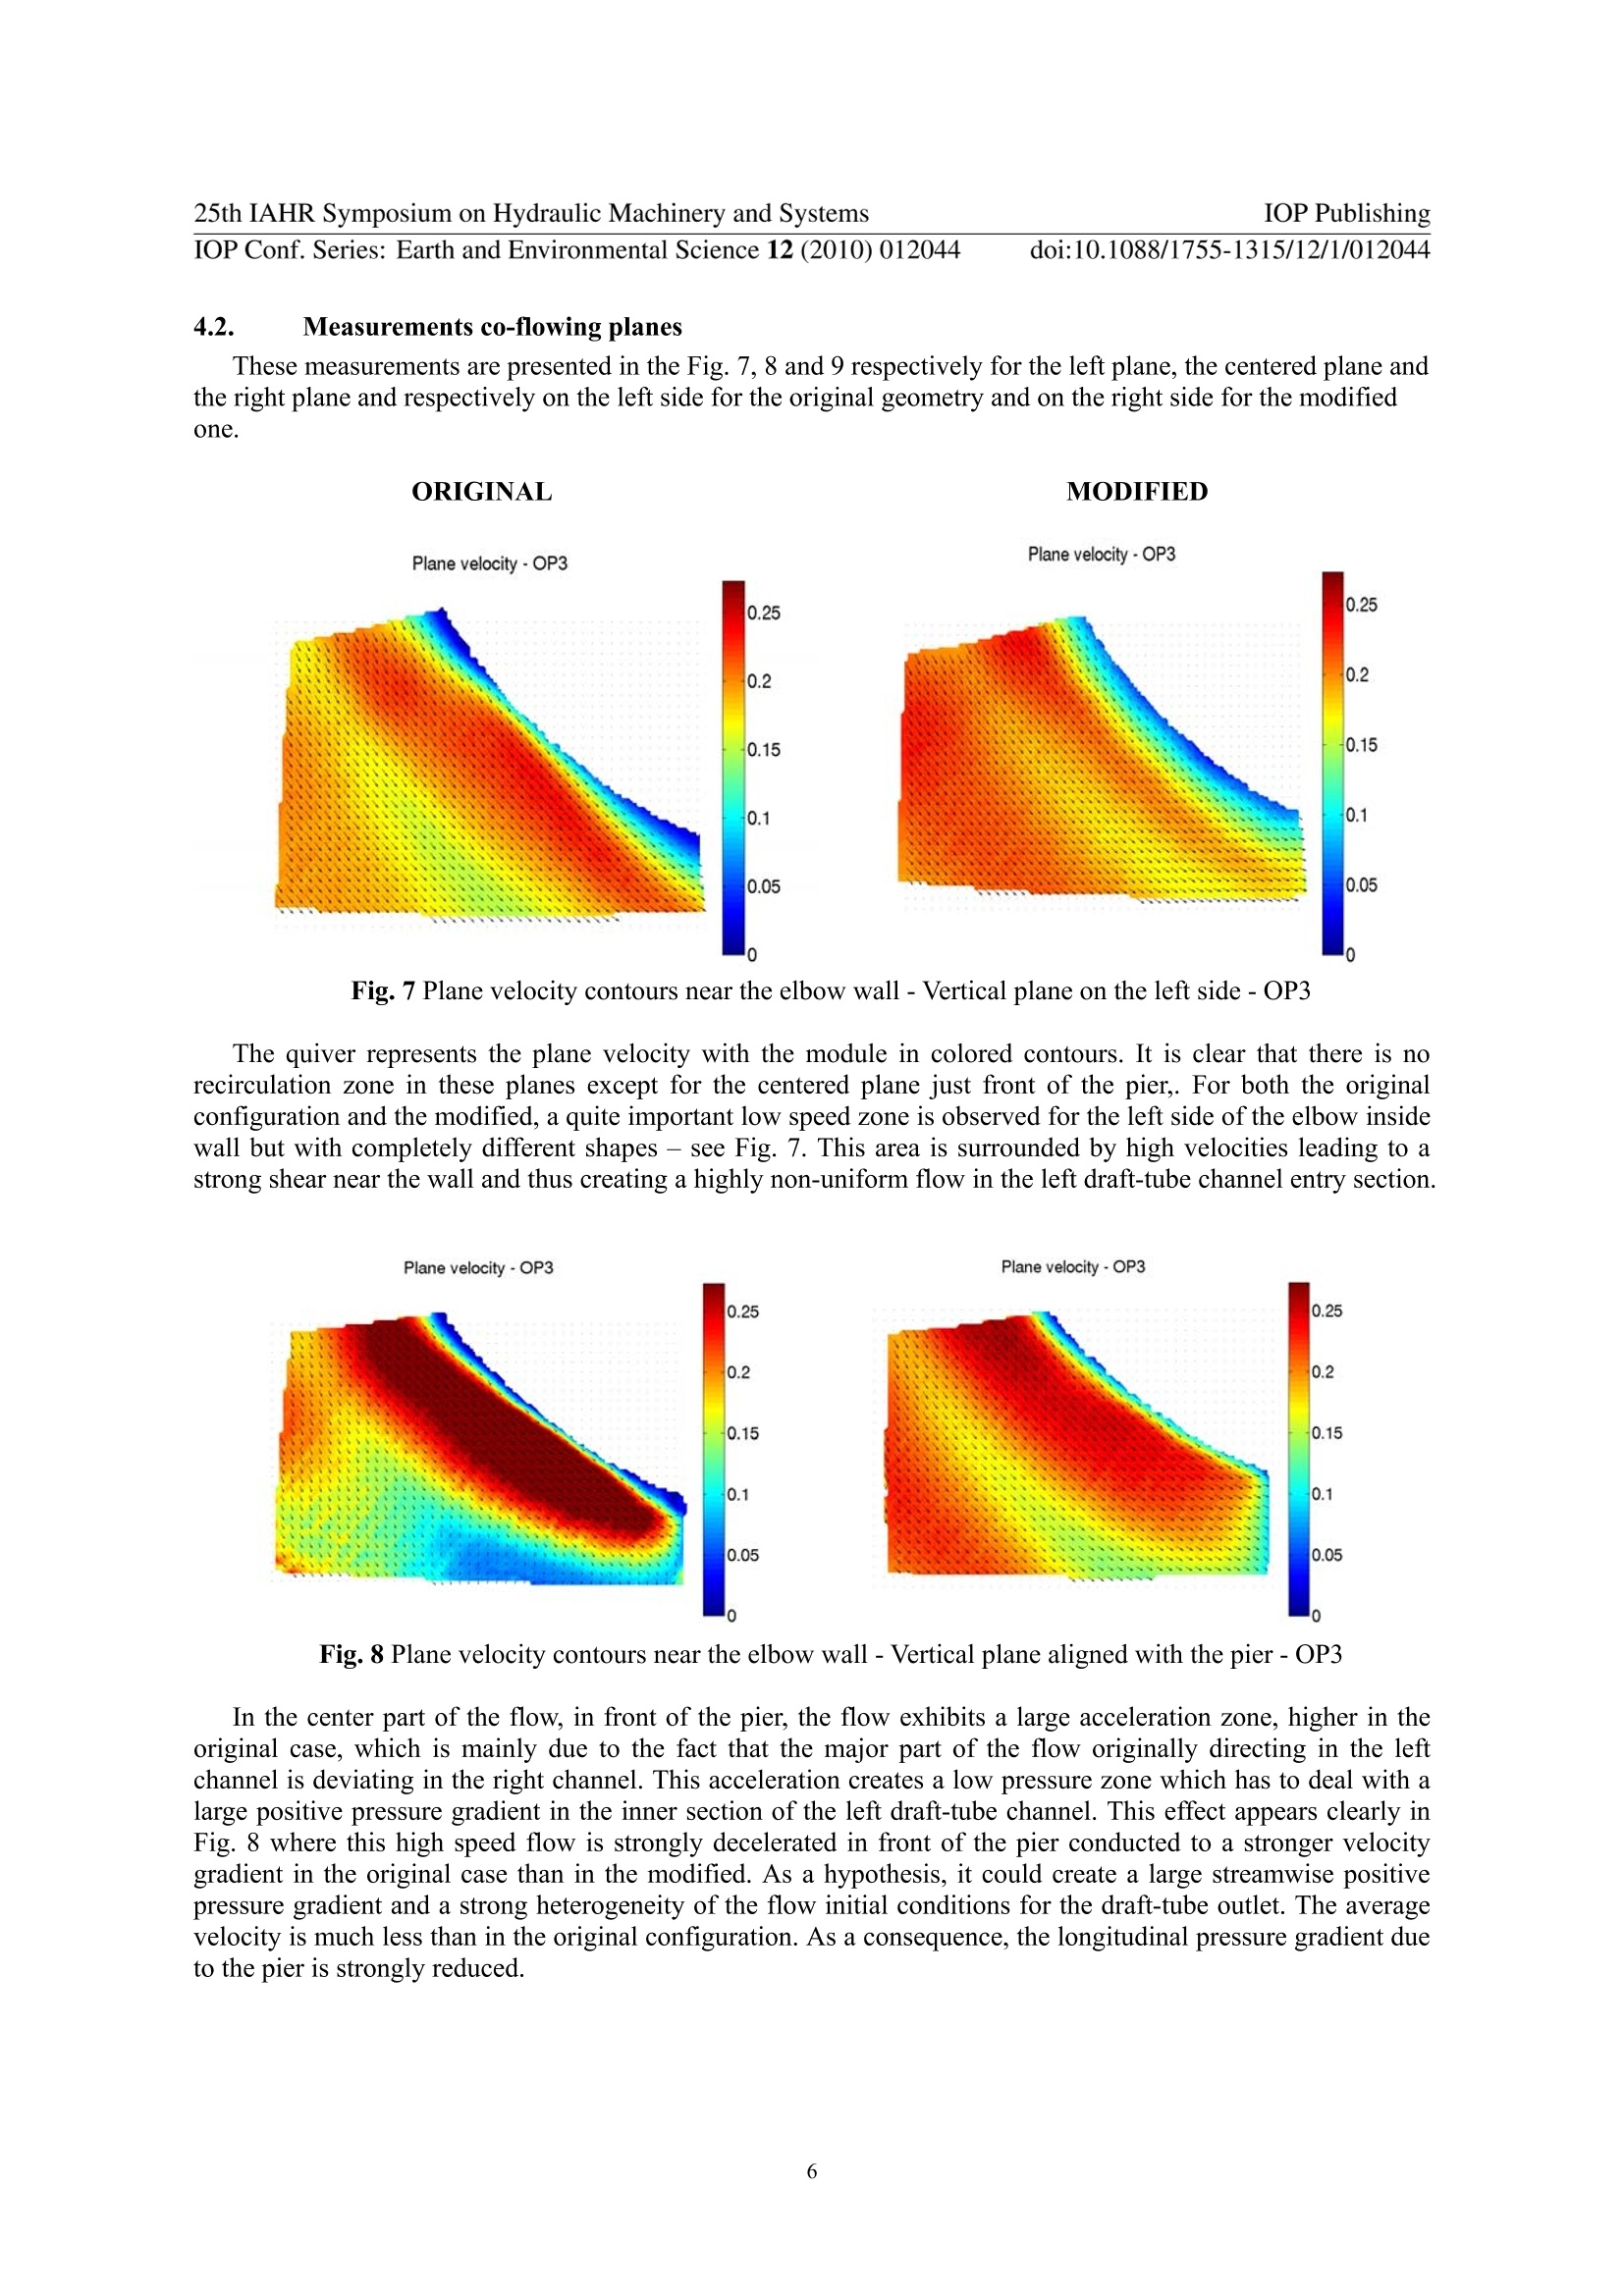
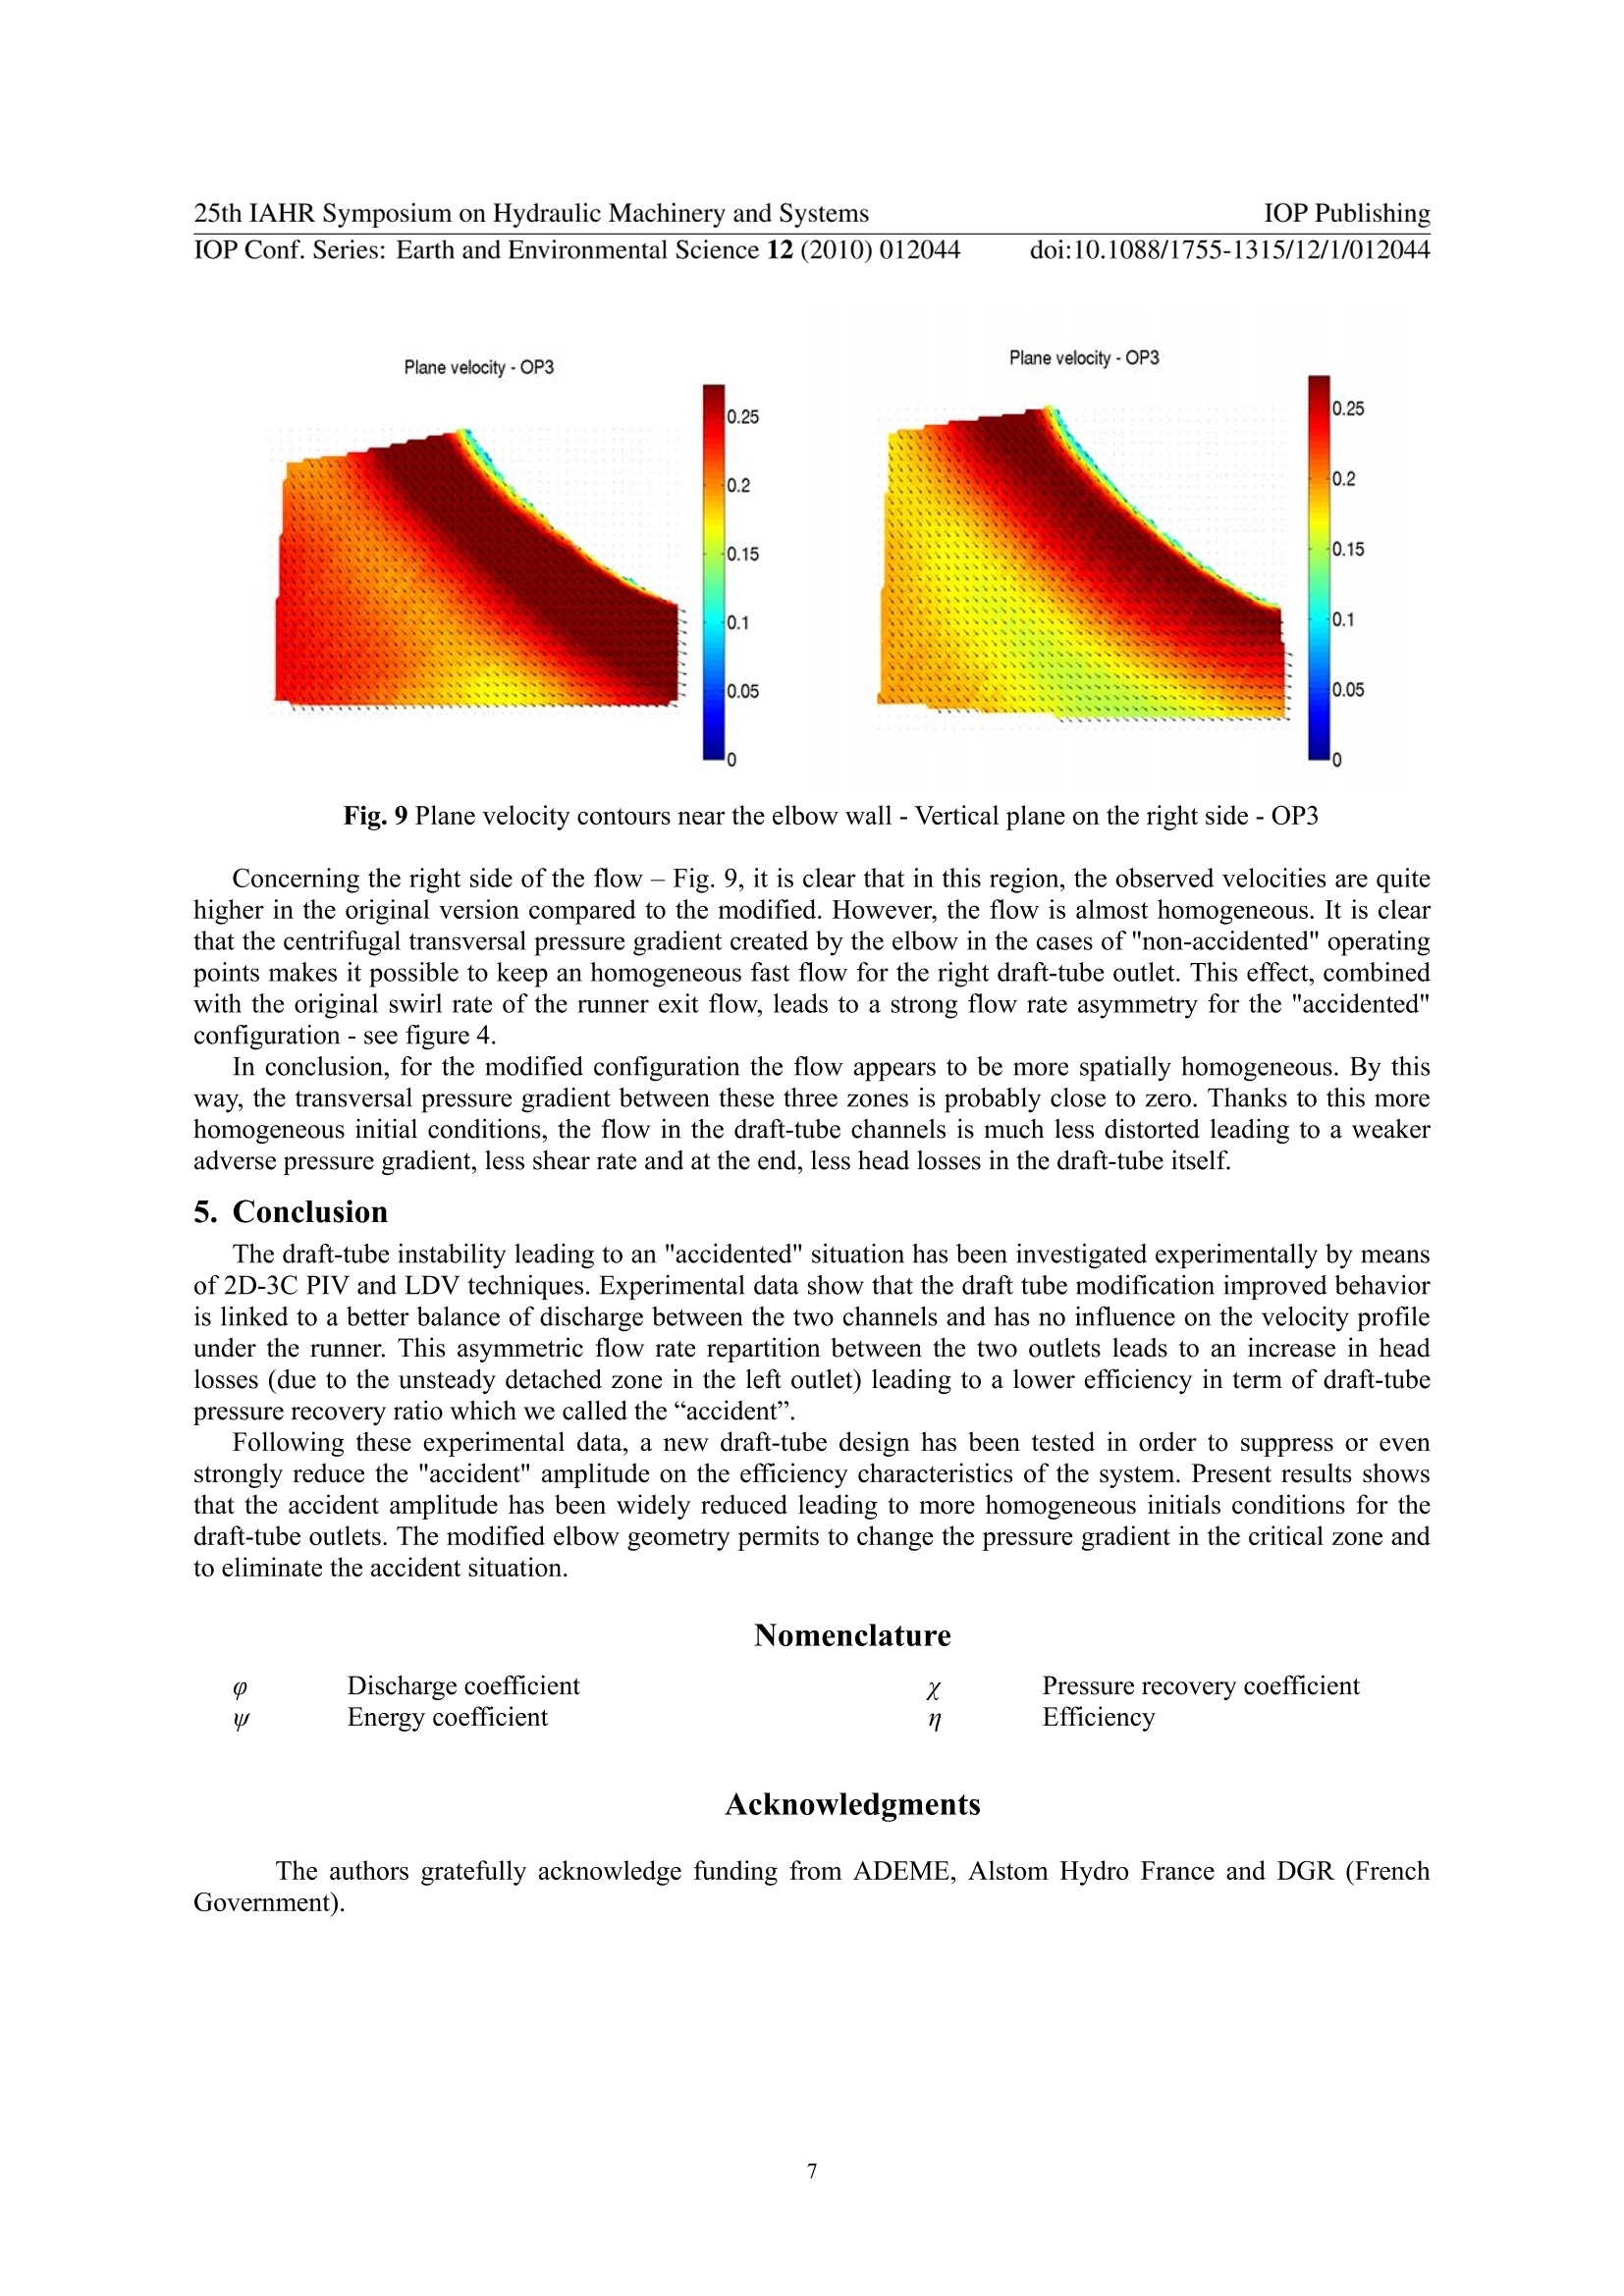
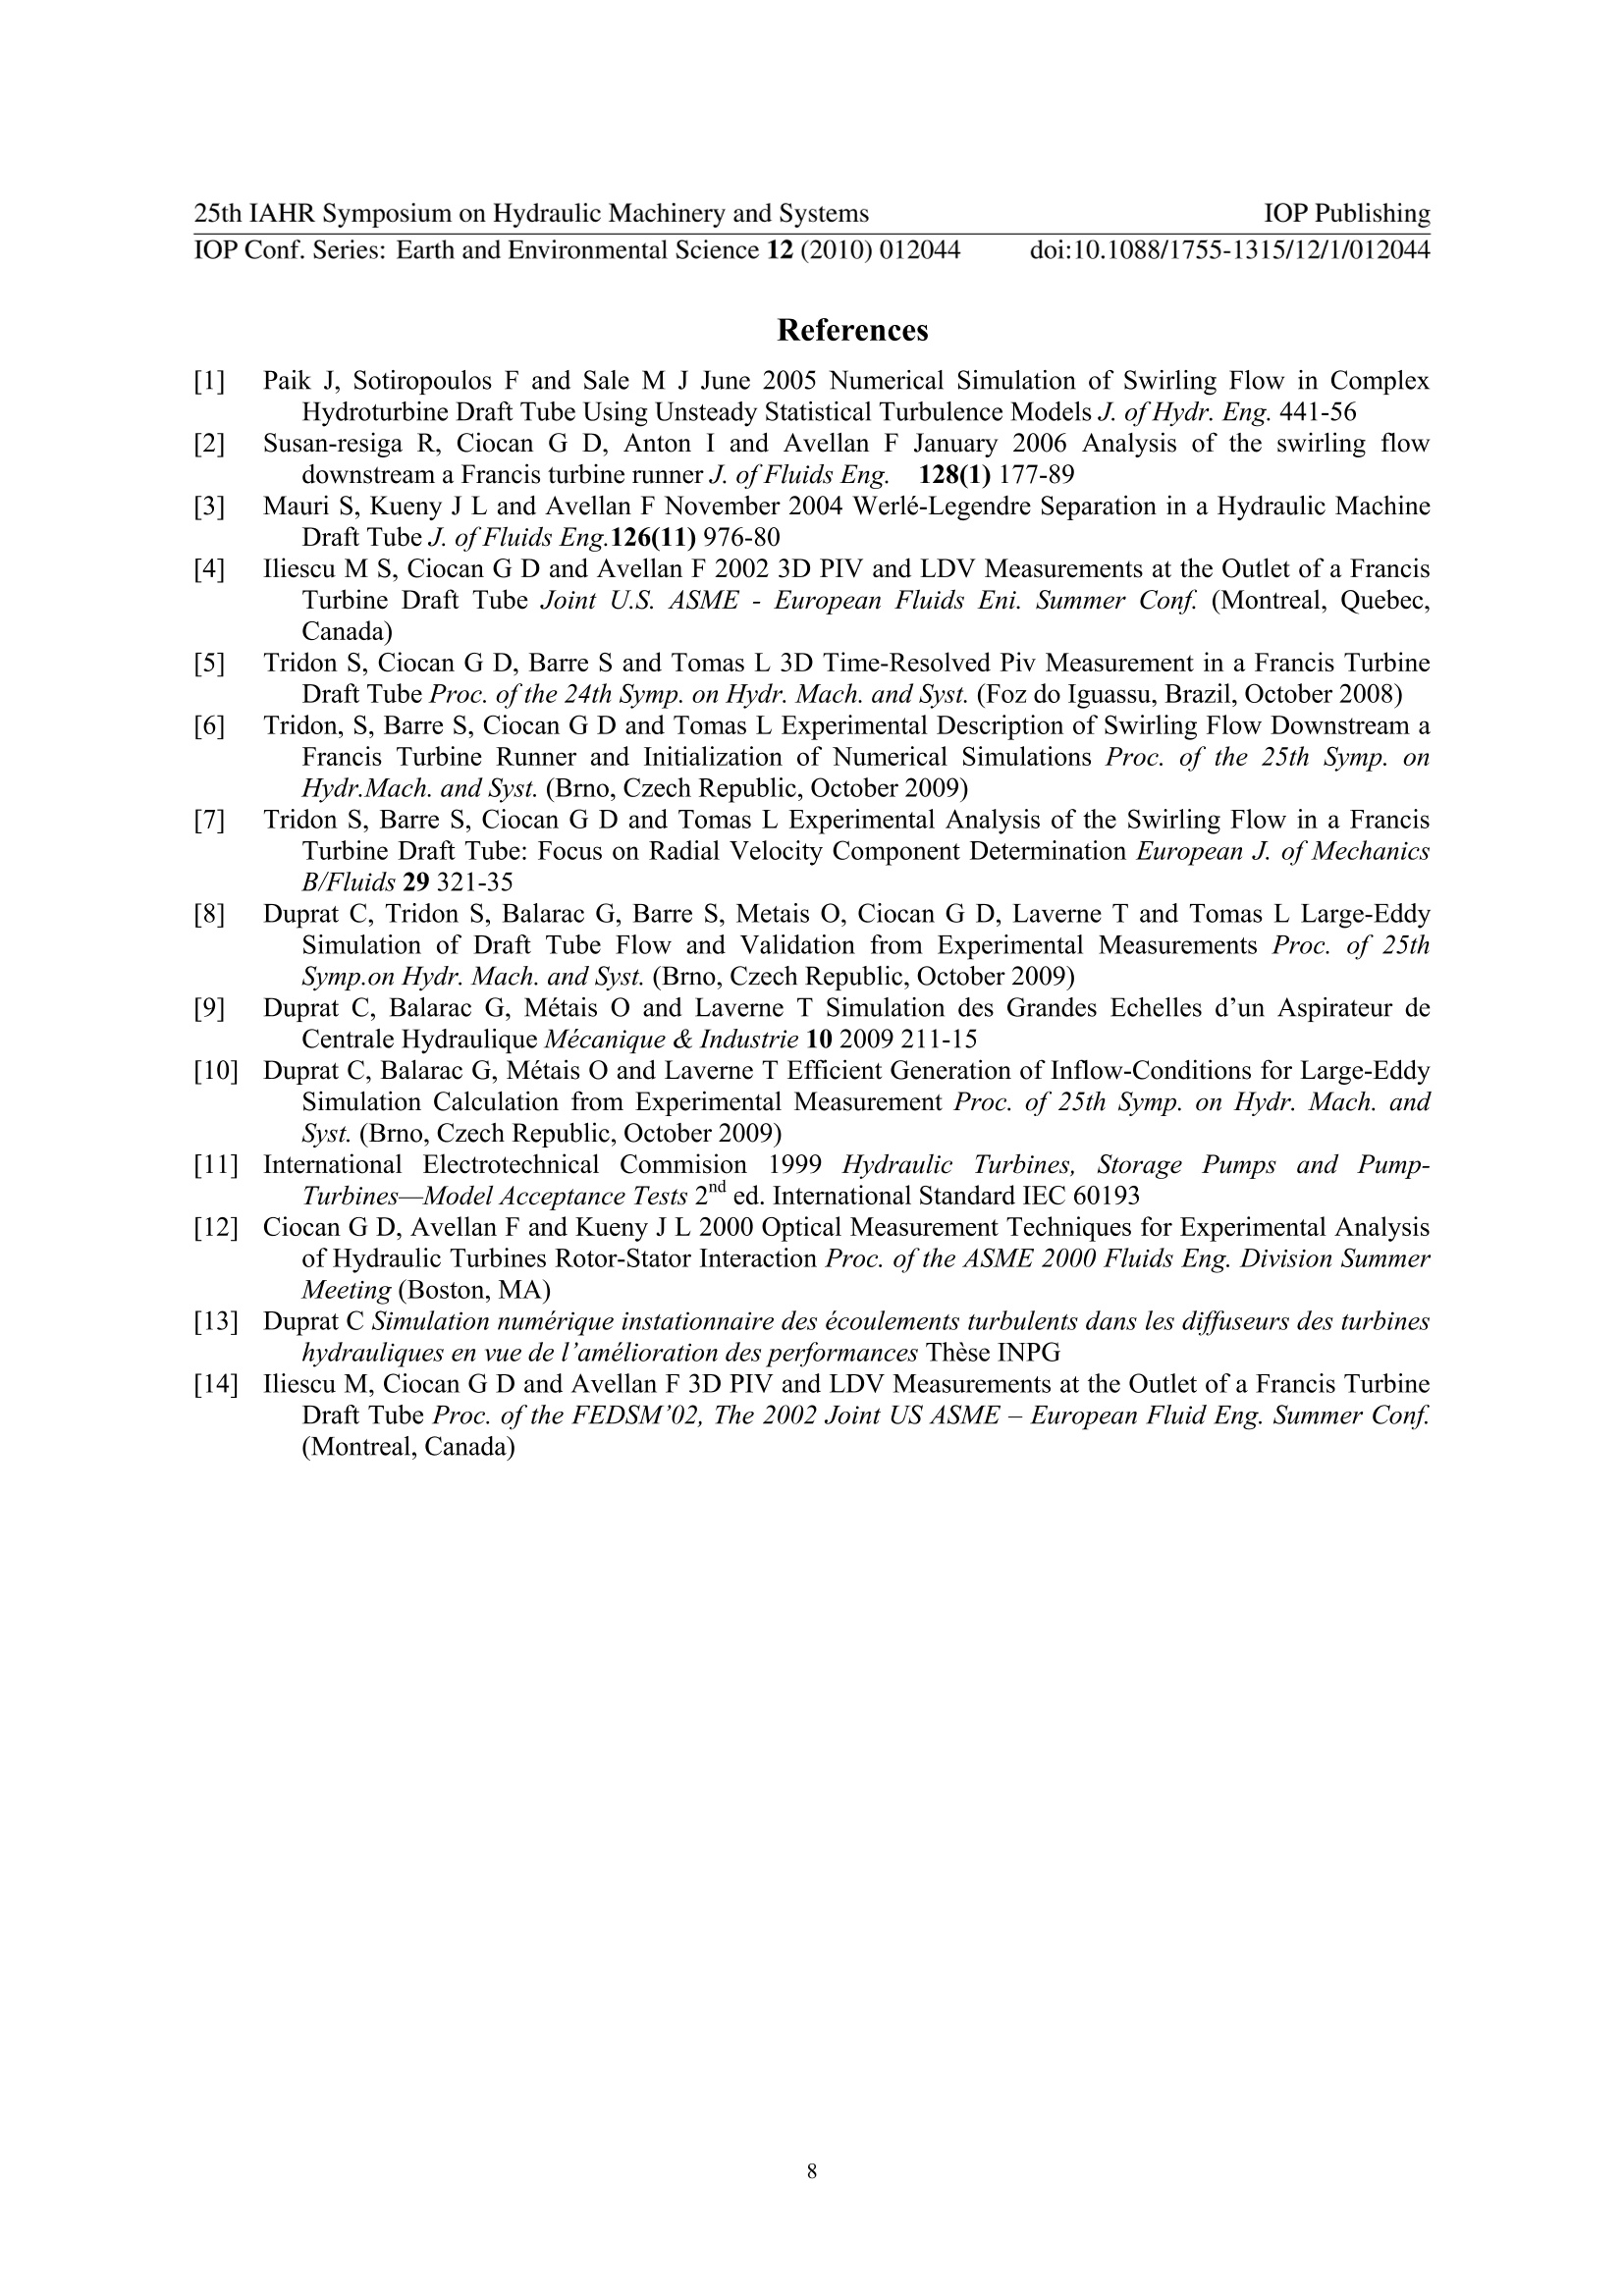
iopscience.iop.org IOP Publishing25th IAHR Symposium on Hydraulic Machinery and SystemsIOP Conf.Series: Earth and Environmental Science 12 (2010) 012044 doi:10.1088/1755-1315/12/1/012044 Home Search Collections Journals AbouttContact usMy lOPscience Experimental investigation of draft tube flow instability This article has been downloaded from IOPscience. Please scroll down to see the full text article. 2010 IOP Conf. Ser.: Earth Environ. Sci. 12 012044 (http://iopscience.iop.org/1755-1315/12/1/012044) View the table of contents for this issue, or go to the journal homepage for more Download details: IP Address: 202.108.18.194 The article was downloaded on 06/02/2011 at 04:33 Please note that terms and conditions apply. Experimental investigation of draft tube flow instability S Tridon, S Barre , GD Ciocan, PLeroy and C Segoufin LEGI-CNRS-GIT Grenoble, BP53, Grenoble,38041, France t ALSTOM HYDRO France, 82 av. Leon Blum, Grenoble,38000, France E-mail: sylvain.tridon@legi.grenoble-inp.fr Abstract. The draft tube of a hydraulic turbine is the component where the flow exiting therunner is decelerated, thereby converting the excess of kinetic energy into static pressureHowever, in some refurbishment cases, the installation of an upgraded runner with an old draft-tube leads to an undesirable efficiency drop as the discharge is increased above the bestefficiency point value. It is found to be related to a corresponding sudden variation in the drafttube pressure recovery coefficient at the same discharge. The model of a recent refurbishmenwhich presents this instability is installed in the CREMHyG test rig. Steady and unsteadymeasurements of velocity and pressure fields of the complex and highly turbulent swirling flowexiting the runner have been carried out at CREMHyG (Grenoble). They included the threecomponents of the velocity. The flow in the draft tube is rich in secondary flows and possibleflow separation due to the elbow as well as to the divergent shape of this geometry. Pressureand velocity field measurements in the draft-tube have been performed. They let us identifysome phenomena that may explain the origin of the unusual behavior of the draft tube. Finallythe same model, with a modified draft tube geometry that was designed to reduce the efficiencydrop phenomenon has been installed. Velocity measurements were made to validate the benefitof such geometry modification. 1. Introduction The draft tube is an important component ofa reaction turbine (i.e. Francis or Kaplan type turbine). It islocated just downstream of the runner and allows to decelerate the flow exiting the runner, thereby convertingthe excess of kinetic energy into static pressure. As a consequence, it increases the global efficiency of theturbine. The classical shape of a draft tube can be decomposed into three elementary components: the conicaldiffuser, an elbow and a straight divergent diffuser usually with one or more piers for structural reasons - see Fig.1. Due to the inherent complexity of the swirling flow exiting the runner it is difficult to perform an accuratenumerical simulation of such flow and for theses operating conditions - see [1]. This difficulty leads to a lack ofinformation on the precise nature of such flows. Particularly the exact structure of the velocity field is not welldocumented by experiments in the elbow and liner regions Fig.1 Geometry of the studied draft-tube This lack of reliable experimental data could be a critical issue in some refurbishment configurations where anew runner is installed on an old facility while keeping in place all the stationary components . In some cases arecovery “accident"occurs near the best operating point (BEP) leading to a sudden efficiency drop. This“accident”is difficult to reproduce via a RANS numerical simulation currently used by industrial turbinedesigners. Therefore, a research program was launch at the EPFL (FLINDT program) in order to describe doi:10.1088/1755-1315/12/1/012044 experimentally and numerically this phenomenon. This program led to a lot of experimental and numericalresults concerning a similar refurbishment case and allowed to make hypothesis concerning the nature of the“accident”itself and the physics of the flow-see [2, 3, 4]. To further study such kind of phenomena, a very low head case was proposed for experiments as well as forsimulation. This project is supported by ADEME, CREMHyG, LEGI and ALSTOM. The major part of theexperimental results is presented by Tridon et al. in [5, 6, 7]. This work was also the opportunity to develop asynergy between the experimental and numerical simulations activities. For this purpose LES method wasadapted and used for the present flow configuration. The corresponding works were published by Duprat et al. in[8,9, 10]. The main idea was to use LES simulations to obtain an accurate description of the“accident”flow andvice versa the experimental data are used to both initialize and validate LES simulations. Once validated, LESsimulations will give an important amount of data making it possible a better physical analysis of the flowstructure which may lead us to a more precise understanding of its complex dynamics. To complete the study, a modified draft-tube geometry was tested. This paper will present the obtained results.on the modified geometry. 2. Francis turbine model presentation 2.1. Original configuration The configuration considered in the present paper is the one investigated experimentally by Tridon et al. [5.6]. The investigated case corresponds to the scaled model of a Francis turbine of high specific speed, n=0.55.The scaled model supplied by ALSTOM HYDRO FRANCE is installed on the test rig of the CREMHyG and thetests are carried out according to the IEC 60193 International Standards [11]. The turbine model has a spiralcasing with a stay ring of 24 stay vanes, a distributor made of 24 guide vanes, a 19 blades runner of 365mmoutlet diameter, and a symetric elbow draft tube with one pier. This one is located downstream the hydraulicturbine runner. As shown in Fig. 1, its cross-sectional shape changes slowly from circular, at the inlet, torectangular at the outlet. For structural issue, one pier has been added dividing the outlet into two rectangularbays. In the experiments, the draft tube is composed of three different parts, the cone in Plexiglas, the elbow infiberglass and the straight diffuser in sheet steel -see Fig. 3. The Reynolds number under the runner for the considered operating points is about 6.6 million. It iscalculated with the runner peripheral velocity and the runner outlet diameter and the tests are carried out irvelocity similarity according to the IEC 60193 International Standards [11]. Flow behavior for high Reynoldsnumber is asymptotical. Despite, the scale effect due to a Reynolds number influence on hydraulic efficiencymust be taken into account for a correct scalability from the model to the prototype.The efficiency scale-up for areaction turbine is clearly defined in the IEC 60193 International Standards [11]. The uncertainty on efficiency and pressure recovery coefficient are calculated from the individual andindependent uncertainties of the considered parameters according to the IEC 60193 International Standards [11].Therefore, for the efficiency, the total error is the quadratic sum of errors on H, Q, T and N,An/n=±29.510".And, for the pressure recovery coefficient, the total error is the quadratic sum of errors on AP and Q,Ax/x=±28.4 10. The global efficiency of the global machine and the pressure recovery coefficient of the draft-tube alone havebeen discussed by Tridon et al. [7]. Both present a characteristic drop accident near the best operating point dueto an expected bad behavior of the draft-tube. 2.2. Modified configuration (new performance data) To overcome the efficiency drop, it was decided to test a modified shape of the draft tube with the samemodel. At first, performances test have been carried out and confirmed that the modified geometry leads to thesuppression of the efficiency drop near the best operating point. Figure 2 shows the evolution of the relativeefficiency (by reference to the BEP efficiency for the original configuration) with the discharge coefficient forthe global machine and the pressure recovery coefficient for the draft-tube alone. The original“accident”do notpersist with the modified design doi:10.1088/1755-1315/12/1/012044 Fig. 2 Global machine efficiency and draft-tube pressure recovery coefficient 3. Experimental setup for velocity field measurements 3.1. Laser Doppler velocimetry instrumentation The 2D velocity profile survey is performed by the LDV measurement method near the draft tube outlet toestimate the discharge repartition in each side of the draft tube. The experimental data used in this paper wereobtained with a two-component probe Laser Doppler Anemometer (LDA), using back-scattered light andtransmission by optical fibber, with a 5 W argon-ion laser source. The main characteristics of the optical systemfor the measurement under the runner and in the draft tube are detailed in Table 1. Table 1 Main characteristics of the LDV optical system Optical Characteristics Draft Tube Channels Wave lengths [nm] 488/514.5 Focal length [mm] 600 Probe diameter [mm] 60 Beam spacing probe [mm] 38.34 Fringe spacing [um] 4.07 Beam half-angle [°] 3.624 Measuring volume dx,dy [mm] 0.090 Measuring volume dz [mm] 1.4 Beam Expander [] 1.95 Spherical silver-coated glass particles are introduced in the test rig flow. These particles are hollowed inorder to match the water density and are able to follow flow fluctuations frequency up to 5 kHz. The meandiameter of these particles is 10 um. One rectangular glass optical windows with plane and parallel faces isplaced on the side of each channel alternatively. The geometrical reference position of the measurements isobtained by positioning the laser beams on the windows faces with accuracy better than 0.05 mm. Bothhorizontal and vertical components of the velocity are measured. The uncertainties of the velocity measurementsare estimated to be 2% of the measured value-see Ciocan et al.[12]. 3.2. Particle image velocimetry instrumentation The mean velocity field in the whole draft-tube is investigated with a LA VISION 2D-3C PIV system, whichconsists of a double-pulsed laser, two double-frame cameras Pro+ with a resolution of 1600×1200 pixels, and aprocessor unit for the acquisition synchronization and the vectors detection by cross correlation. The illuminatingsystem is composed of two Nd-YAG laser units, each delivering a short impulse of10 ns and 200 mJ energy at20 Hz frequency. 25th IAHR Symposium on Hydraulic Machinery and Systems IOP PublishingIOP Conf. Series: Earth and Environmental Science 12 (2010) 012044 doi:10.1088/1755-1315/12/1/012044 Fig. 3 Measurement in co-flowing planes in the elbow 3.3. Measurements in co-flowing planes For the present investigation, it has been decided to explore the flow in the inside part of the elbow at threedifferent lateral positions. One aligned with the pier and the two others in the left and right side of the elbowplane. The idea is to obtain data about the separated flow zones which may exist in the inside part of the elbowdue to the centrifugal pressure gradient. For the optical access, the elbow is equipped with three windows directing to the elbow - see Fig. 3. Thesewindows are manufactured in a 1.493 refractive index material. One special double faces calibration plate(25×25 cm) is designed for the measurements with the elbow curvature. One trumpet’s window is dismantled foicalibration plate positioning. After calibration process the window is then reassembled and the test rig filled withwater. The cameras are installed on each elbow sides and focused on the laser-sheet- see Fig. 3. Fig. 4 Measurements set-up in a vertical plane near the elbow wall 4. Velocity fields The results corresponding both for the original configuration and the modified draft-tube geometry arepresented. It was decided to only present the results for the operating point (OP3) situated in the efficiency dropzone. This operating point corresponds to a discharge coefficient p=0.38 and is the most representative of theaccident phenomenon (see Fig.2). Throughout this paper the velocity is made dimensionless by the runner outlet velocity (runner angular speedmultiplied by runner outlet radius, wRrep, and lengths are made dimensionless with respect to the runner outleiradius Rref 4.1. Measurements in channels Horizontal velocity repartition in each draft-tube channels is presented in the Fig. 5 for both the original andthe modified configuration. The 60 points measuring grid of 5 cm × 4 cm grid spacing in horizontal and vertical direction respectively is marked with + on the figure. It permits us to calculate by simple integration thedischarge repartition in each channel of the draft tube which appears to be non homogeneous. Indeed, for theoperating point OP3 corresponding to the accident, the major part ofthe discharge passes through the righchannel. because the turbine is counter-clockwise rotating. ORIGINALCONFIGURATION Fig. 5 Horizon velocity repartition in each draft-tube channels for original configuration The modified configuration permits to correct this flow rate unbalance. The large low speed zone in the leftchannel has disappear for the modified configuration - see Fig. 6. MODIFIED CONFIGURATION Fig. 6 Horizon velocity repartition in each draft-tube channels for modified configuration The discharge repartition for the OP3 is given in the Table 2, also for both the original and the modifiedconfiguration. Table 2 Discharge Repartition for original and modified configuration -OP3 Discharge repartition in % 0 Left Channel Right Channel Original configuration 38 28 72 Modified configuration 38 50 50 The high unbalance between draft tube channels is characteristic to the accident. After an equilibrium of 50-50% before the accident, a repartition as 28-72% or 35-65% - see Iliescu and al. [14], occurs for the“accidentedsituation. For the “accidented”situation, the higher flow rate in the right channel induce higherlocal velocities and losses. In the left channel the main vortex and the vertical vortices, can be considered likesecondary flows and it can not be converted in pressure energy. The turbulence level confirm the increase of thelosses and unsteadiness of the flow with the secondary flow existence. This losses produce the “accident”in theefficiency characteristic. For the modified configuration, the flow is again balanced between the channels, as well as the flowunsteadiness. IOP Conf. Series: Earth and Environmental Science 12 (2010) 012044 doi:10.1088/1755-1315/12/1/012044 4.2. Measurements co-flowing planes These measurements are presented in the Fig.7, 8 and 9 respectively for the left plane, the centered plane andthe right plane and respectively on the left side for the original geometry and on the right side for the modifiedone. ORIGINAL MODIFIED Fig. 7 Plane velocity contours near the elbow wall -Vertical plane on the left side-OP3 The quiver represents the plane velocity with the module in colored contours. It is clear that there is norecirculation zone in these planes except for the centered plane just front of the pier,. For both the originalconfiguration and the modified, a quite important low speed zone is observed for the left side of the elbow insidewall but with completely different shapes- see Fig. 7. This area is surrounded by high velocities leading to astrong shear near the wall and thus creating a highly non-uniform flow in the left draft-tube channel entry section. Fig. 8 Plane velocity contours near the elbow wall- Vertical plane aligned with the pier -OP3 In the center part of the flow, in front of the pier, the flow exhibits a large acceleration zone,higher in theoriginal case, which is mainly due to the fact that the major part of the flow originally directing in the leftchannel is deviating in the right channel.This acceleration creates a low pressure zone which has to deal with alarge positive pressure gradient in the inner section of the left draft-tube channel. This effect appears clearly inFig. 8 where this high speed flow is strongly decelerated in front of the pier conducted to a stronger velocitygradient in the original case than in the modified. As a hypothesis, it could create a large streamwise positivepressure gradient and a strong heterogeneity of the flow initial conditions for the draft-tube outlet. The averagevelocity is much less than in the original configuration. As a consequence, the longitudinal pressure gradient dueto the pier is strongly reduced. doi:10.1088/1755-1315/12/1/012044 Fig. 9 Plane velocity contours near the elbow wall -Vertical plane on the right side-OP3 Concerning the right side of the flow - Fig. 9, it is clear that in this region, the observed velocities are quitehigher in the original version compared to the modified. However, the flow is almost homogeneous. It is clearthat the centrifugal transversal pressure gradient created by the elbow in the cases of "non-accidented" operatingpoints makes it possible to keep an homogeneous fast flow for the right draft-tube outlet. This effect, combinedwith the original swirl rate of the runner exit flow, leads to a strong flow rate asymmetry for the "accidented"configuration-see figure 4. In conclusion, for the modified configuration the flow appears to be more spatially homogeneous. By thisway, the transversal pressure gradient between these three zones is probably close to zero. Thanks to this morehomogeneous initial conditions, the flow in the draft-tube channels is much less distorted leading to a weakeradverse pressure gradient, less shear rate and at the end, less head losses in the draft-tube itself. 5. Conclusion The draft-tube instability leading to an "accidented" situation has been investigated experimentally by meansof 2D-3C PIV and LDV techniques. Experimental data show that the draft tube modification improved behavioris linked to a better balance of discharge between the two channels and has no influence on the velocity profileunder the runner. This asymmetric flow rate repartition between the two outlets leads to an increase in headlosses (due to the unsteady detached zone in the left outlet) leading to a lower efficiency in term of draft-tubepressure recovery ratio which we called the“accident". Following these experimental data, a new draft-tube design has been tested in order to suppress or evenstrongly reduce the "accident" amplitude on the efficiency characteristics of the system. Present results showsthat the accident amplitude has been widely reduced leading to more homogeneous initials conditions for thedraft-tube outlets. The modified elbow geometry permits to change the pressure gradient in the critical zone andto eliminate the accident situation. Nomenclature Discharge coefficient Pressure recovery coefficient Energy coefficient Efficiency Acknowledgments The authors gratefully acknowledge funding from ADEME, Alstom Hydro France and DGR (FrenchGovernment). doi:10.1088/1755-1315/12/1/012044 References ] Paik J, Sotiropoulos F and Sale M J June 2005 Numerical Simulation of Swirling Flow in ComplexHydroturbine Draft Tube Using Unsteady Statistical Turbulence Models J. of Hydr. Eng. 441-56 [21 Susan-resiga R, Ciocan G D, Anton I and Avellan F January 2006 Analysis of the swirling flowdownstream a Francis turbine runner J. ofFluids Eng.128(1) 177-89 131 Mauri S, Kueny JL and Avellan F November 2004 Werle-Legendre Separation in a Hydraulic MachineDraft Tube J. ofFluids Eng.126(11)976-80 [4] Iliescu M S, Ciocan G D and Avellan F 2002 3D PIV and LDV Measurements at the Outlet of a FrancisTurbine Draft Tube Joint U.S. ASME - European Fluids Eni. Summer Conf. (Montreal, Quebec,Canada) [51 Tridon S, Ciocan G D, Barre S and Tomas L 3D Time-Resolved Piv Measurement in a Francis TurbineDraft Tube Proc. of the 24th Symp. on Hydr. Mach. and Syst. (Foz do Iguassu, Brazil, October 2008) [6] Tridon, S, Barre S, Ciocan G D and Tomas L Experimental Description of Swirling Flow Downstream aFrancis Turbine Runner and Initialization of Numerical Simulations Proc. of the 25th Symp. orHydr.Mach. and Syst. (Brno, Czech Republic, October 2009) [7 Tridon S, Barre S, Ciocan G D and Tomas L Experimental Analysis of the Swirling Flow in a FrancisTurbine Draft Tube: Focus on Radial Velocity Component Determination European J. of MechanicsB/Fluids 29 321-35 [8] Duprat C, Tridon S, Balarac G, Barre S, Metais O, Ciocan G D, Laverne T and Tomas L Large-EddySimulation of Draft Tube Flow and Validation from Experimental Measurements Proc. of 25thSymp.on Hydr. Mach. and Syst. (Brno, Czech Republic, October 2009) [9] Duprat C, Balarac G, Metais O and Laverne T Simulation des Grandes Echelles d'un Aspirateur deCentrale Hydraulique Mecanique & Industrie 10 2009 211-15 [10] Duprat C, Balarac G,Metais O and Laverne T Efficient Generation of Inflow-Conditions for Large-EddySimulation Calculation from Experimental Measurement Proc. of25th Symp. on Hydr. Mach. andSyst. (Brno, Czech Republic, October 2009) [11] International Electrotechnical Commision 1999 Hydraulic Turbines, Storage Pumps and Pump-Turbines-Model Acceptance Tests 2"d ed. International Standard IEC 60193 [12] Ciocan G D, Avellan F and Kueny J L 2000 Optical Measurement Techniques for Experimental Analysisof Hydraulic Turbines Rotor-Stator Interaction Proc. ofthe ASME 2000 Fluids Eng. Division SummerMeeting (Boston,MA) [13] DDuprat C Simulation numerique instationnaire des ecoulements turbulents dans les diffuseurs des turbineshydrauliques en vue de lamelioration des performances These INPG 141 Iliescu M, Ciocan G D and Avellan F 3D PIV and LDV Measurements at the Outlet of a Francis TurbineDraft Tube Proc. ofthe FEDSM'02, The 2002 Joint US ASME - European Fluid Eng. Summer Conf.(Montreal, Canada) C IOP Publishing Ltd
确定

还剩7页未读,是否继续阅读?

产品配置单

北京欧兰科技发展有限公司为您提供《流体,管道中的流体,水流中不稳定性,流场,速度场,速度矢量场检测方案(粒子图像测速)》,该方案主要用于其他中不稳定性,流场,速度场,速度矢量场检测,参考标准--,《流体,管道中的流体,水流中不稳定性,流场,速度场,速度矢量场检测方案(粒子图像测速)》用到的仪器有德国LaVision PIV/PLIF粒子成像测速场仪
推荐专场


相关方案
更多
该厂商其他方案
更多