


The three dimensional near wake flow topology behind a blunt trailing edge flat plate is
investigated for a Reynolds number range varying from 500 to 4.6x10⁴ using a combination of
flow visualization, numerical simulations and experiments. The secondary wake instabilities are
identified using vorticity maps from CFD and performing Proper Orthogonal Decomposition
(POD) on PIV data from experiments to identify the underlying dominant coherent structures.
These structures are found to appear at a spanwise spacing ranging from 2.2 to 4.8. At higher
Reynolds numbers the secondary wake instabilities appear to be unsteady in space and time.
方案详情

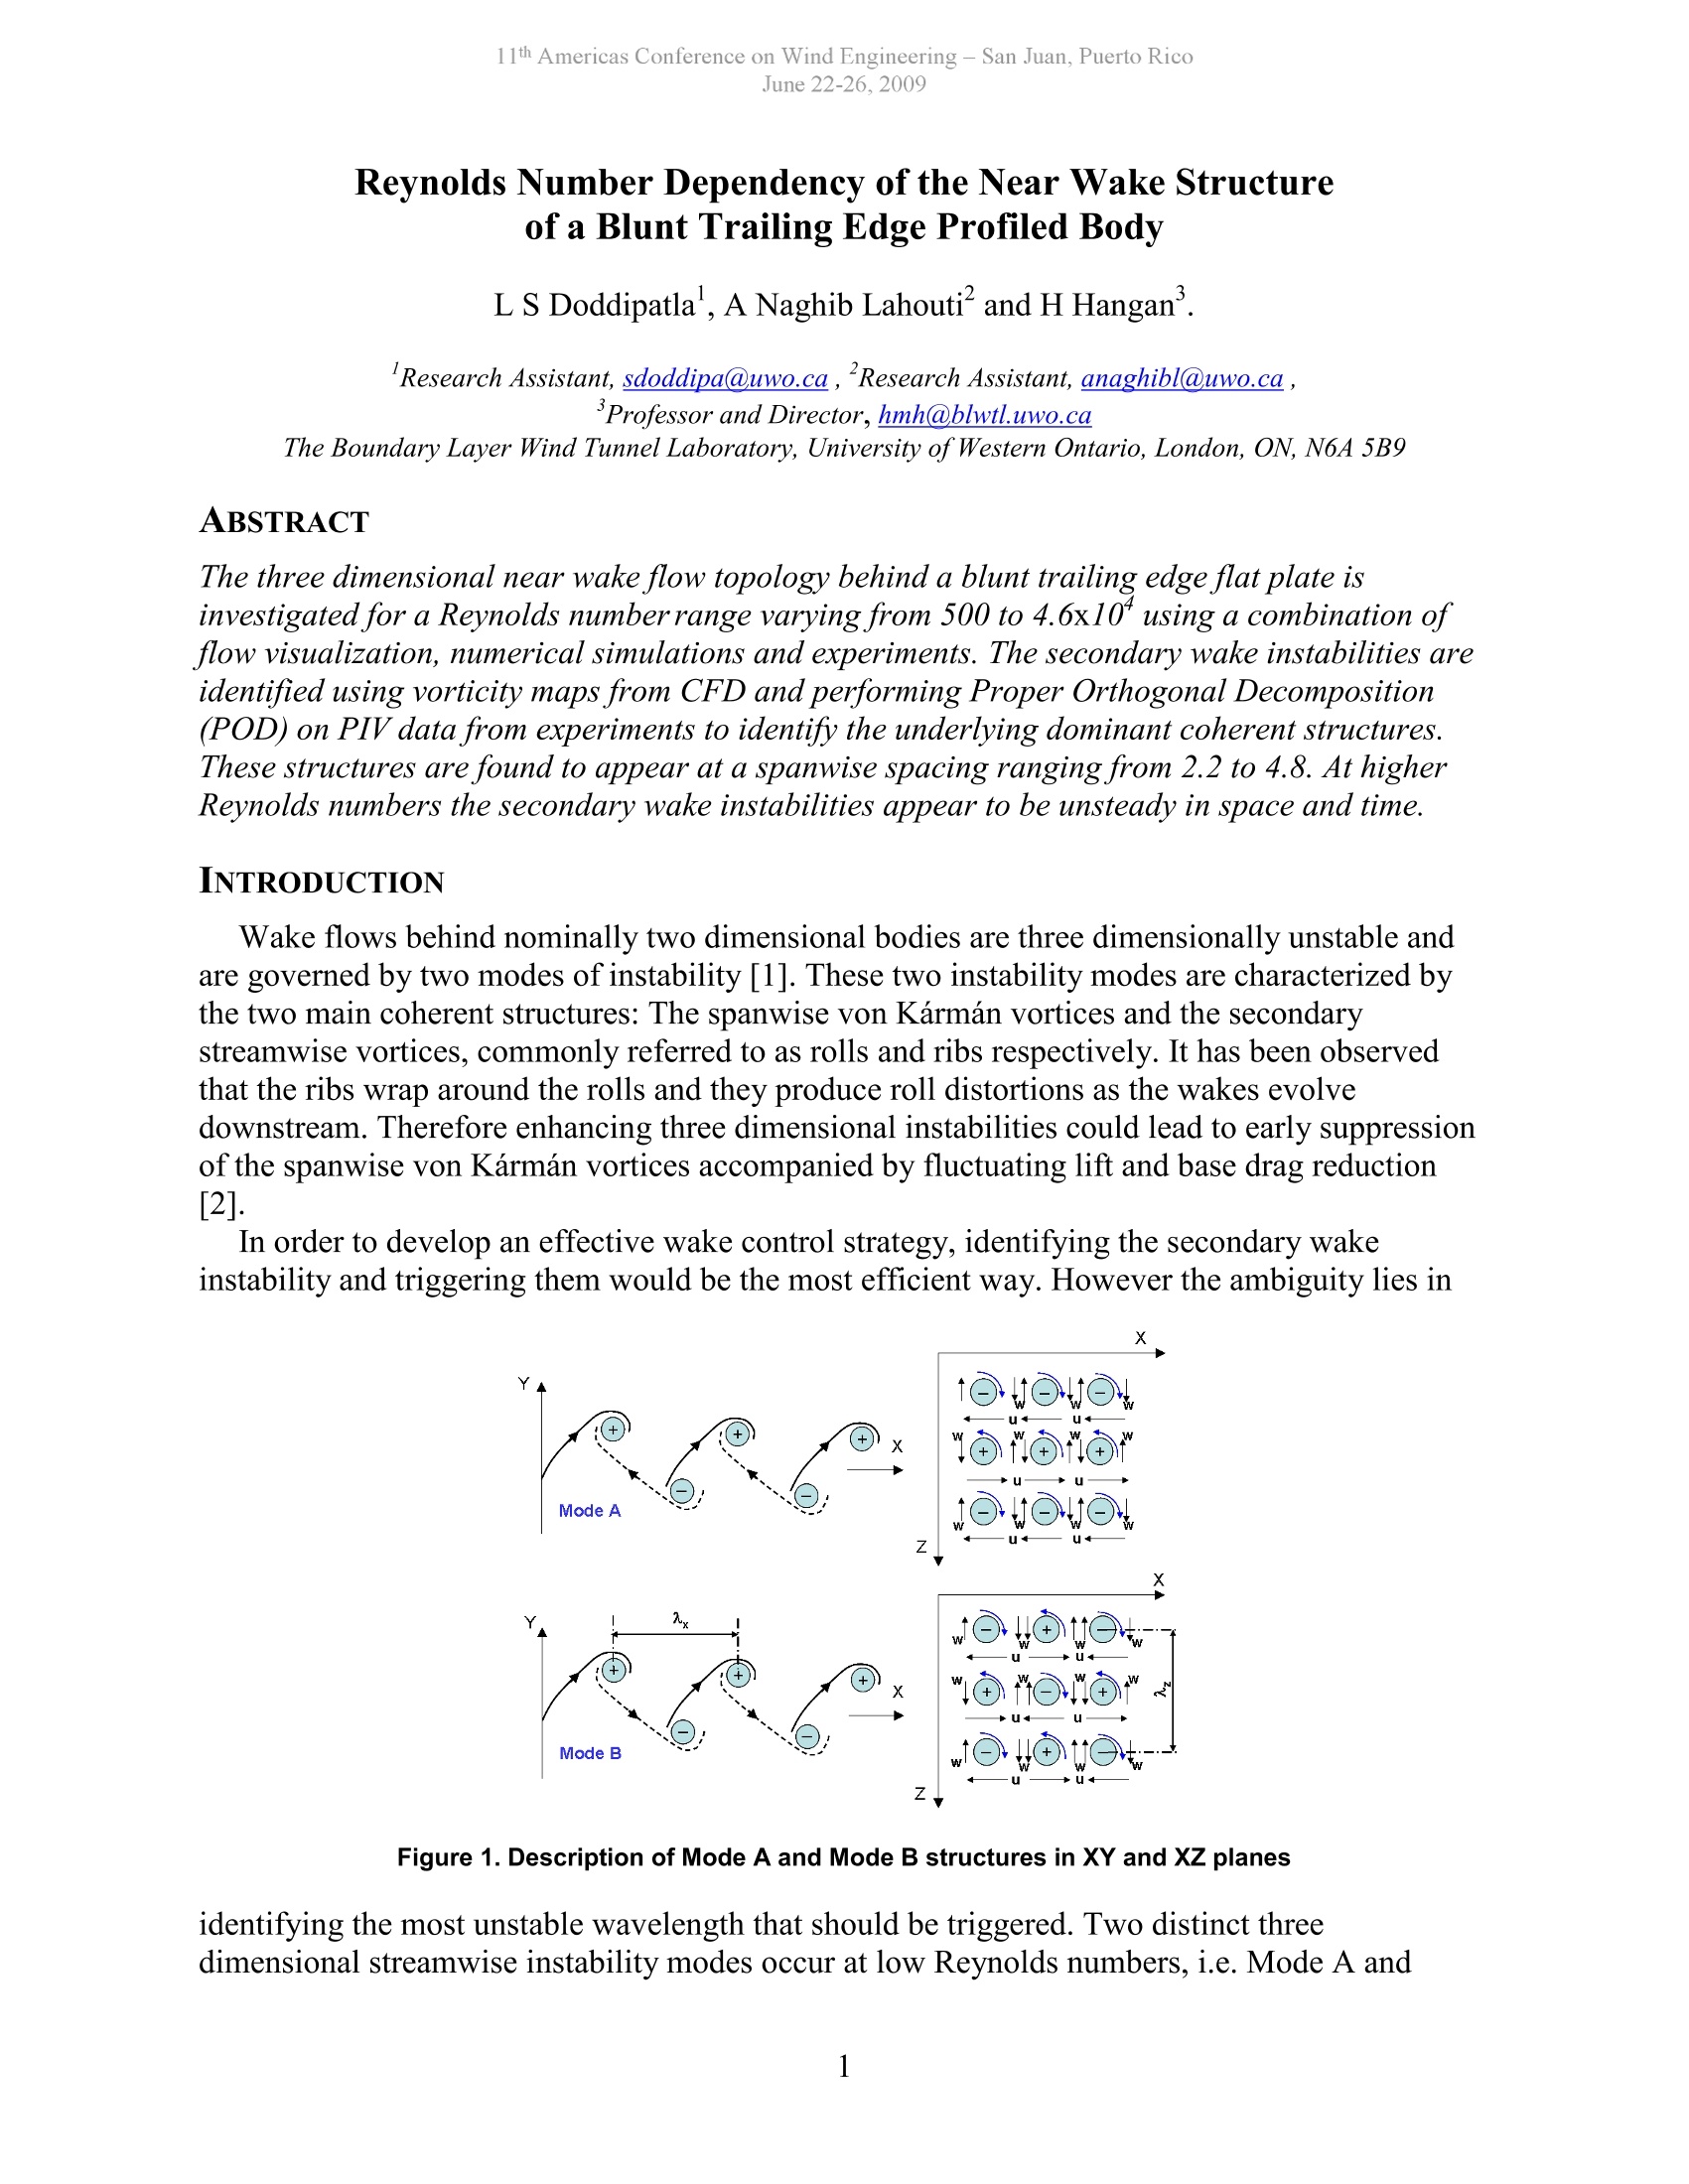
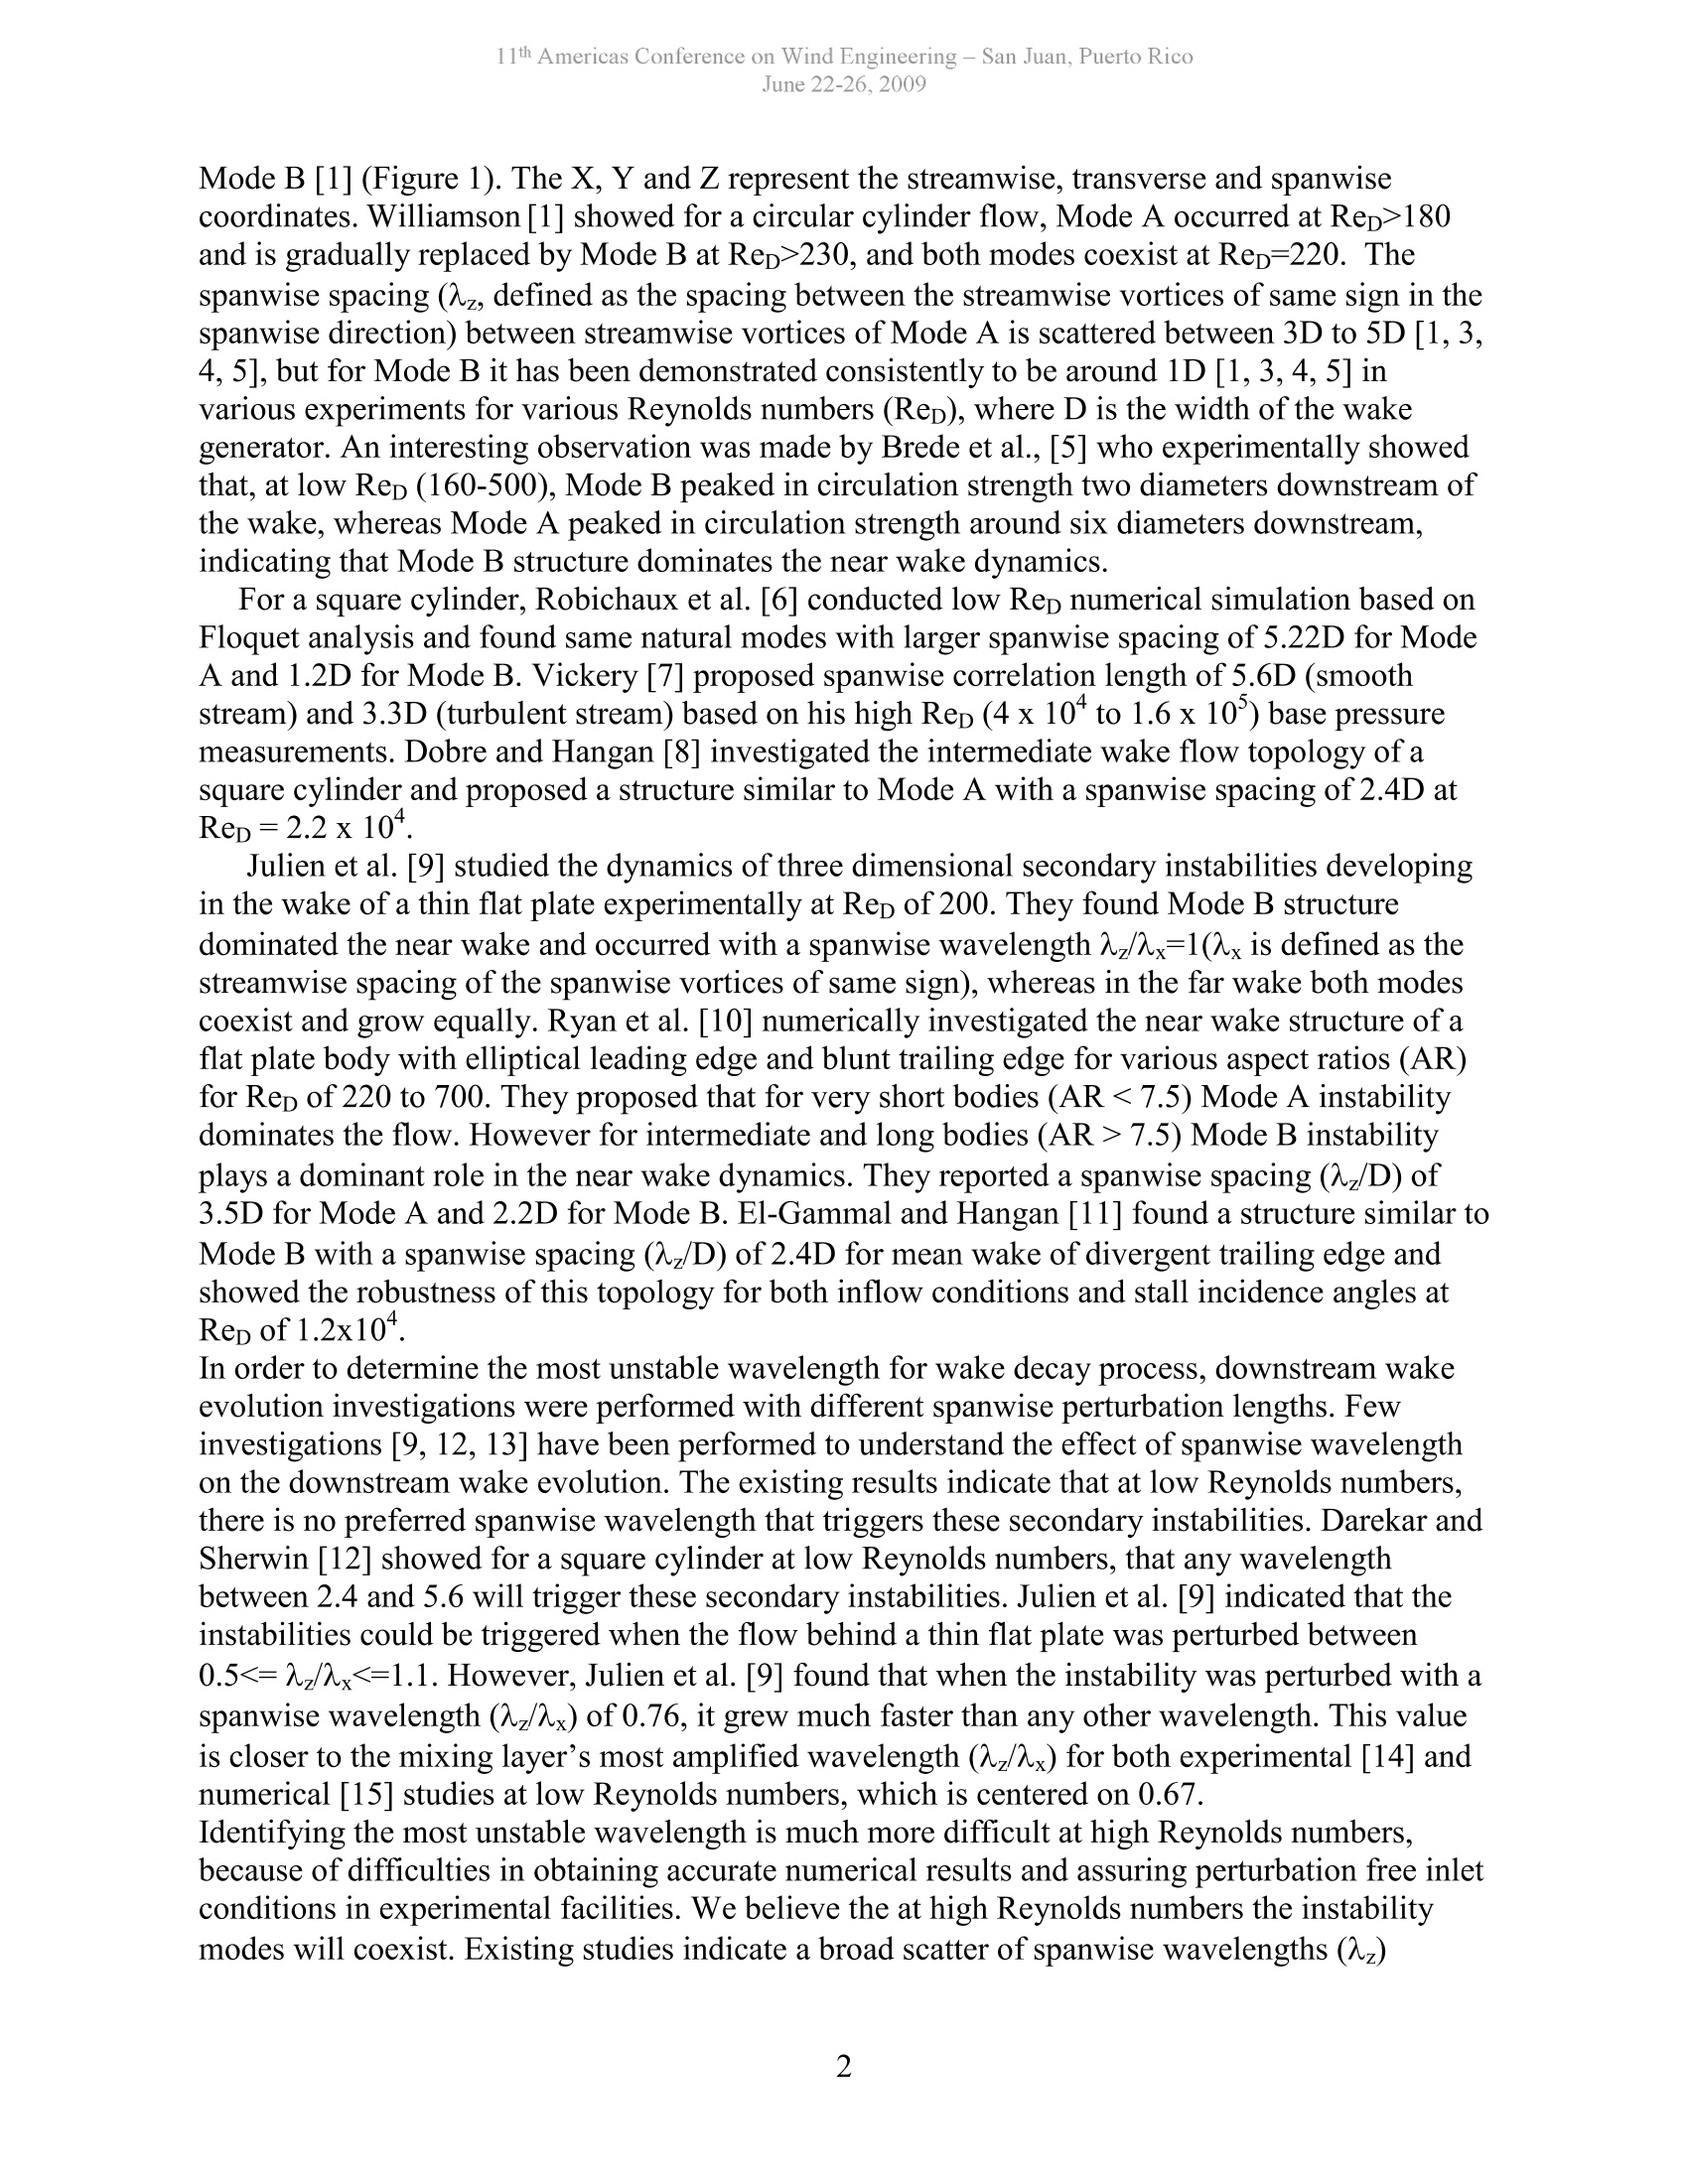
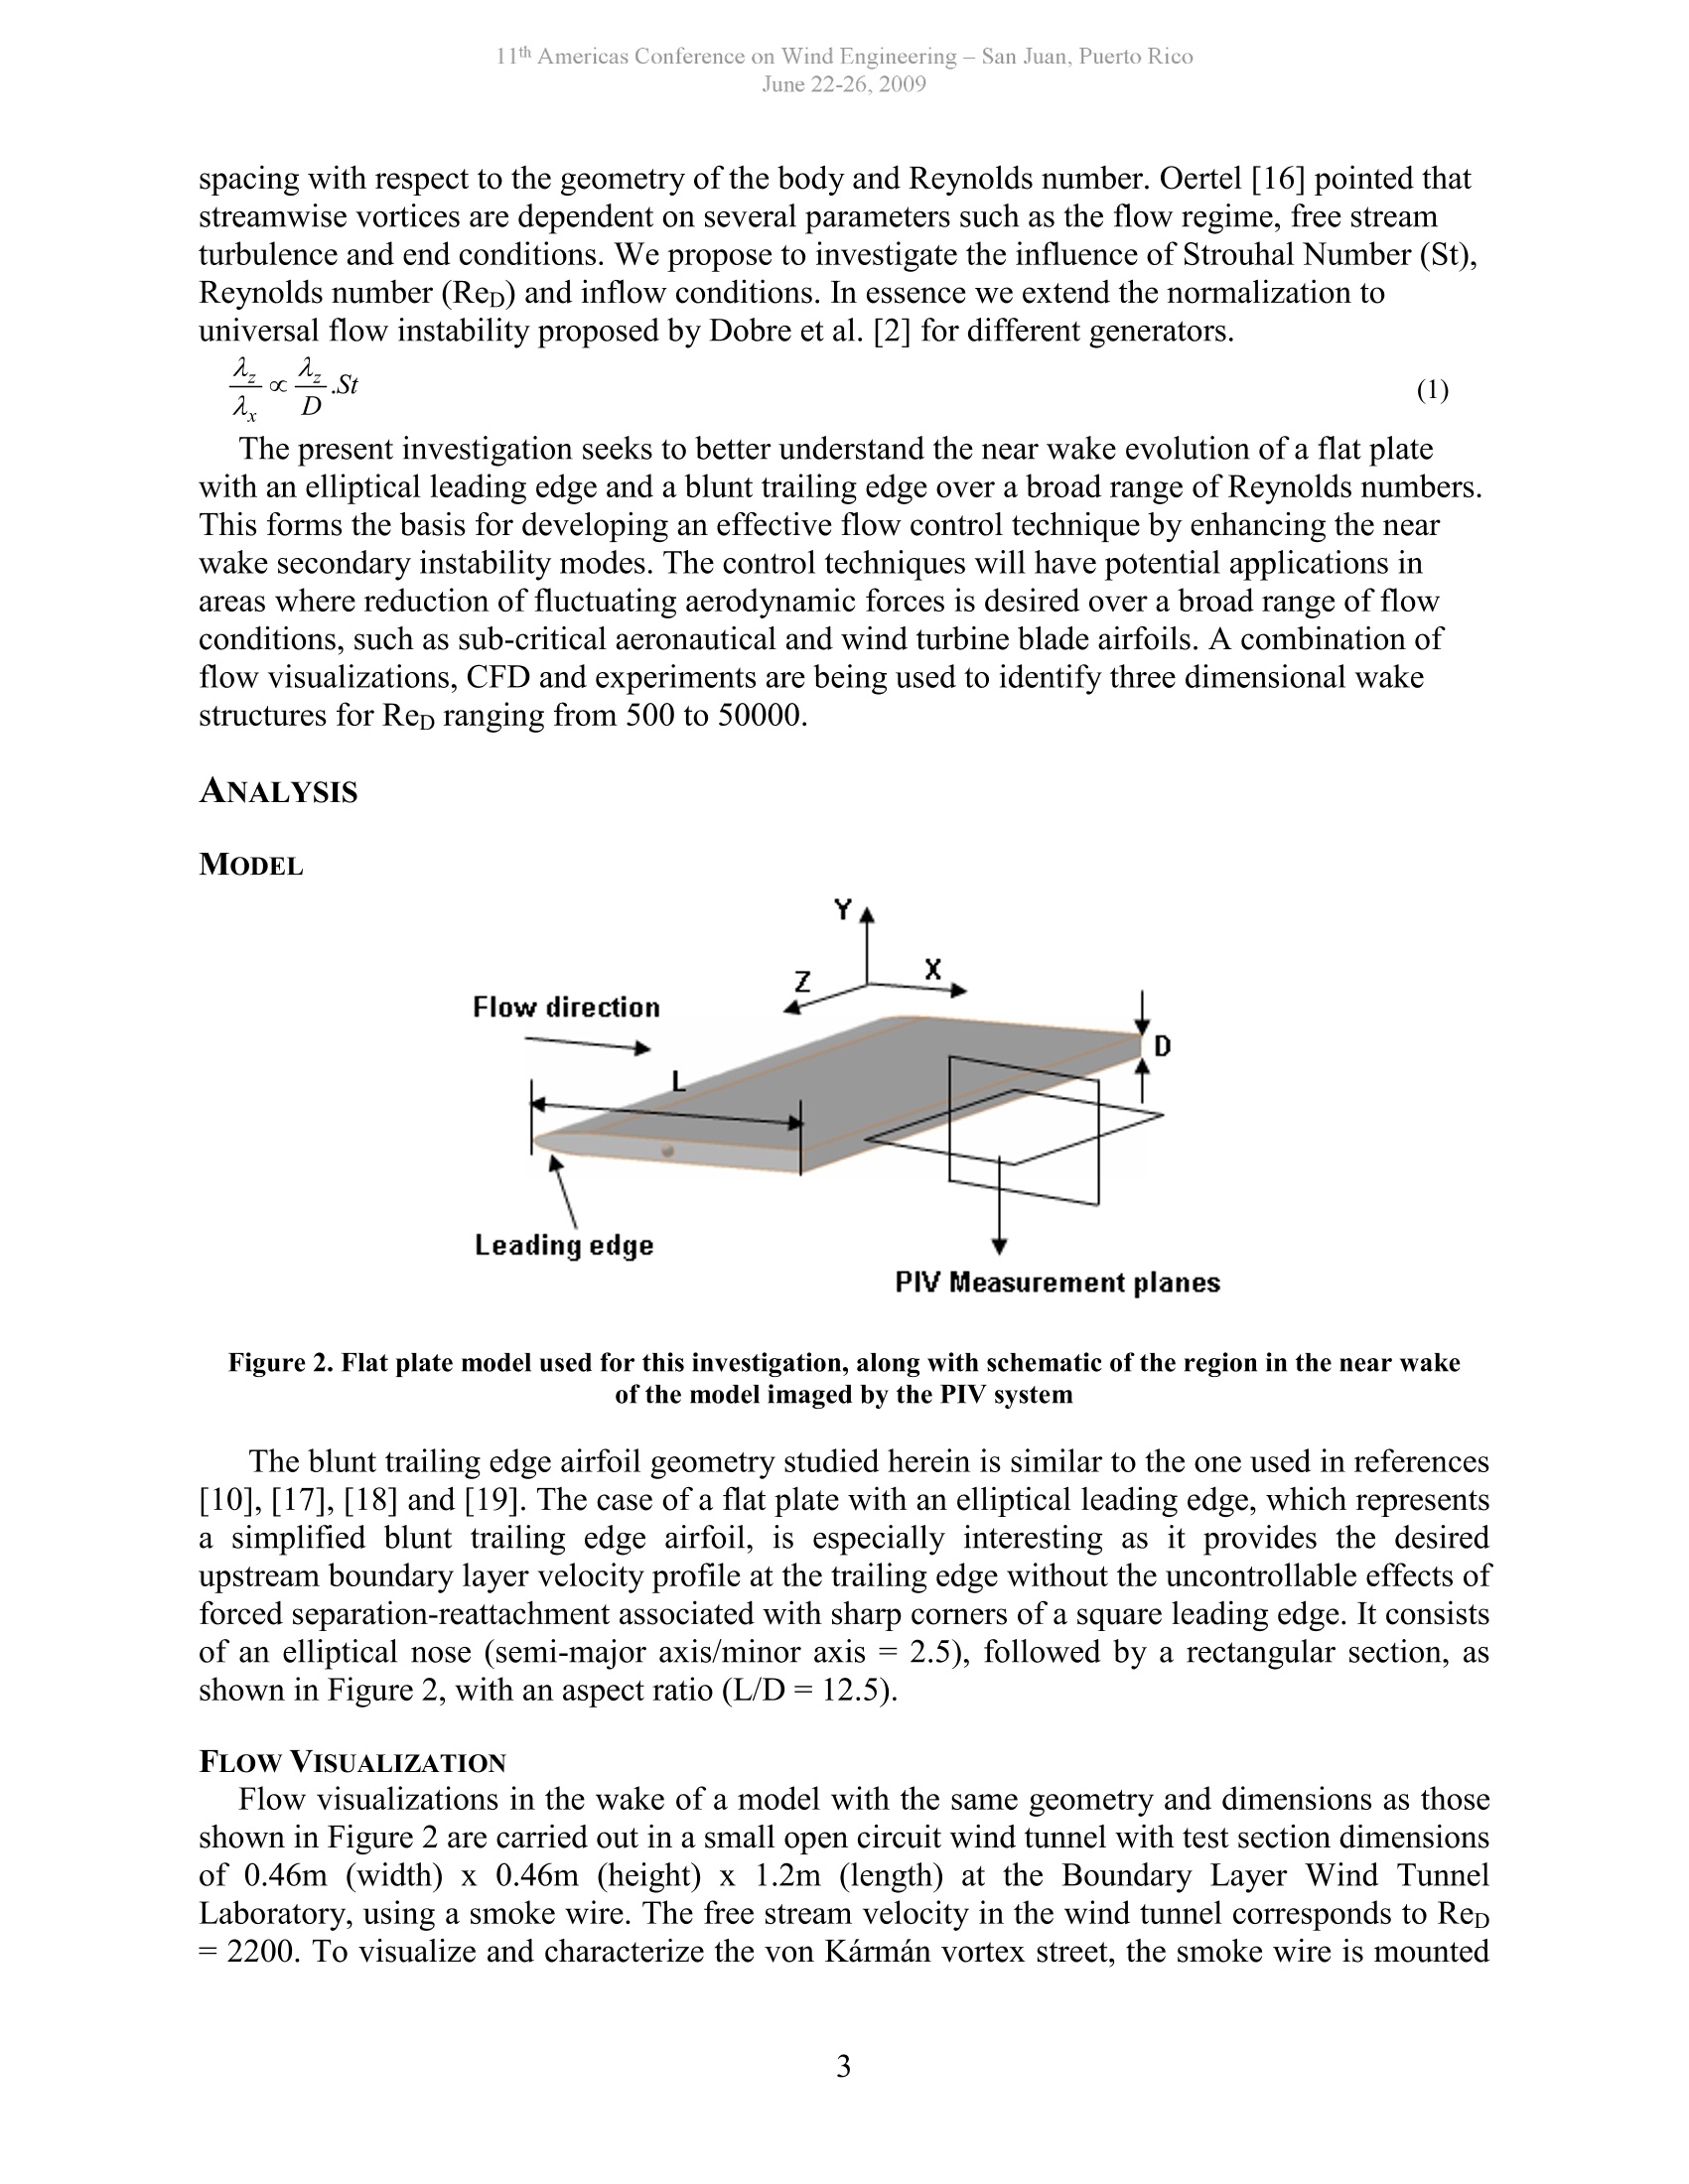
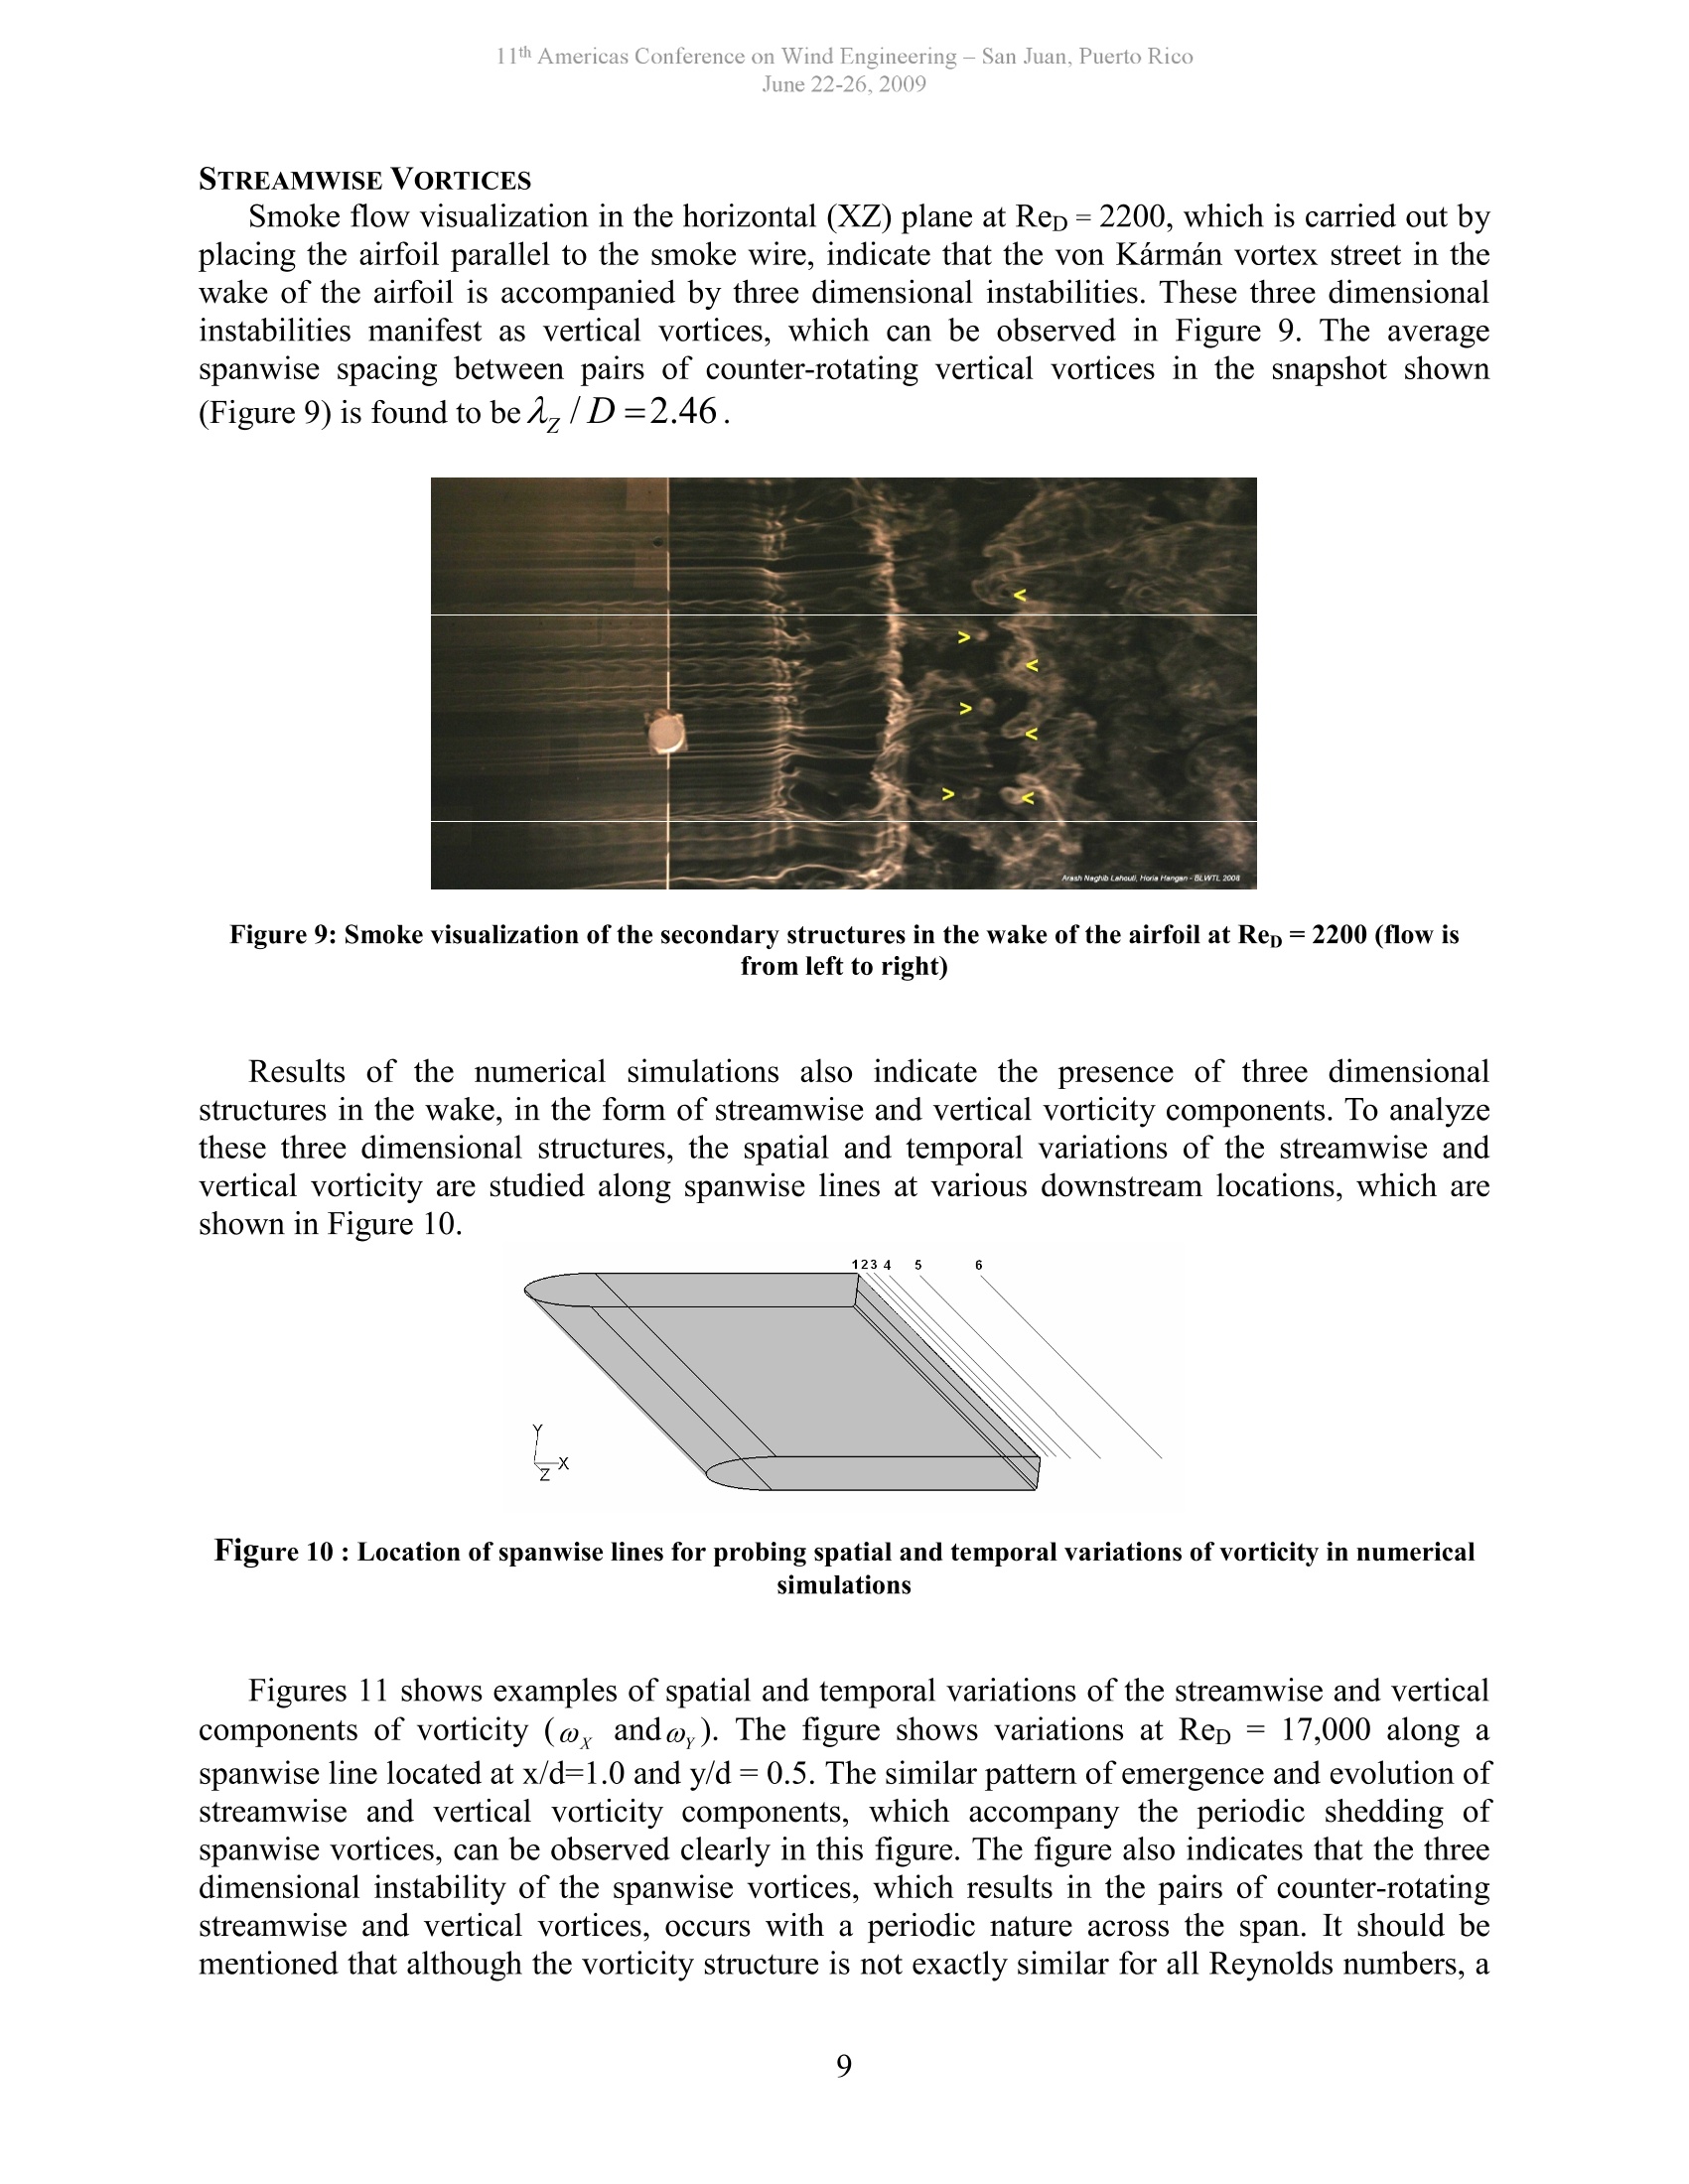
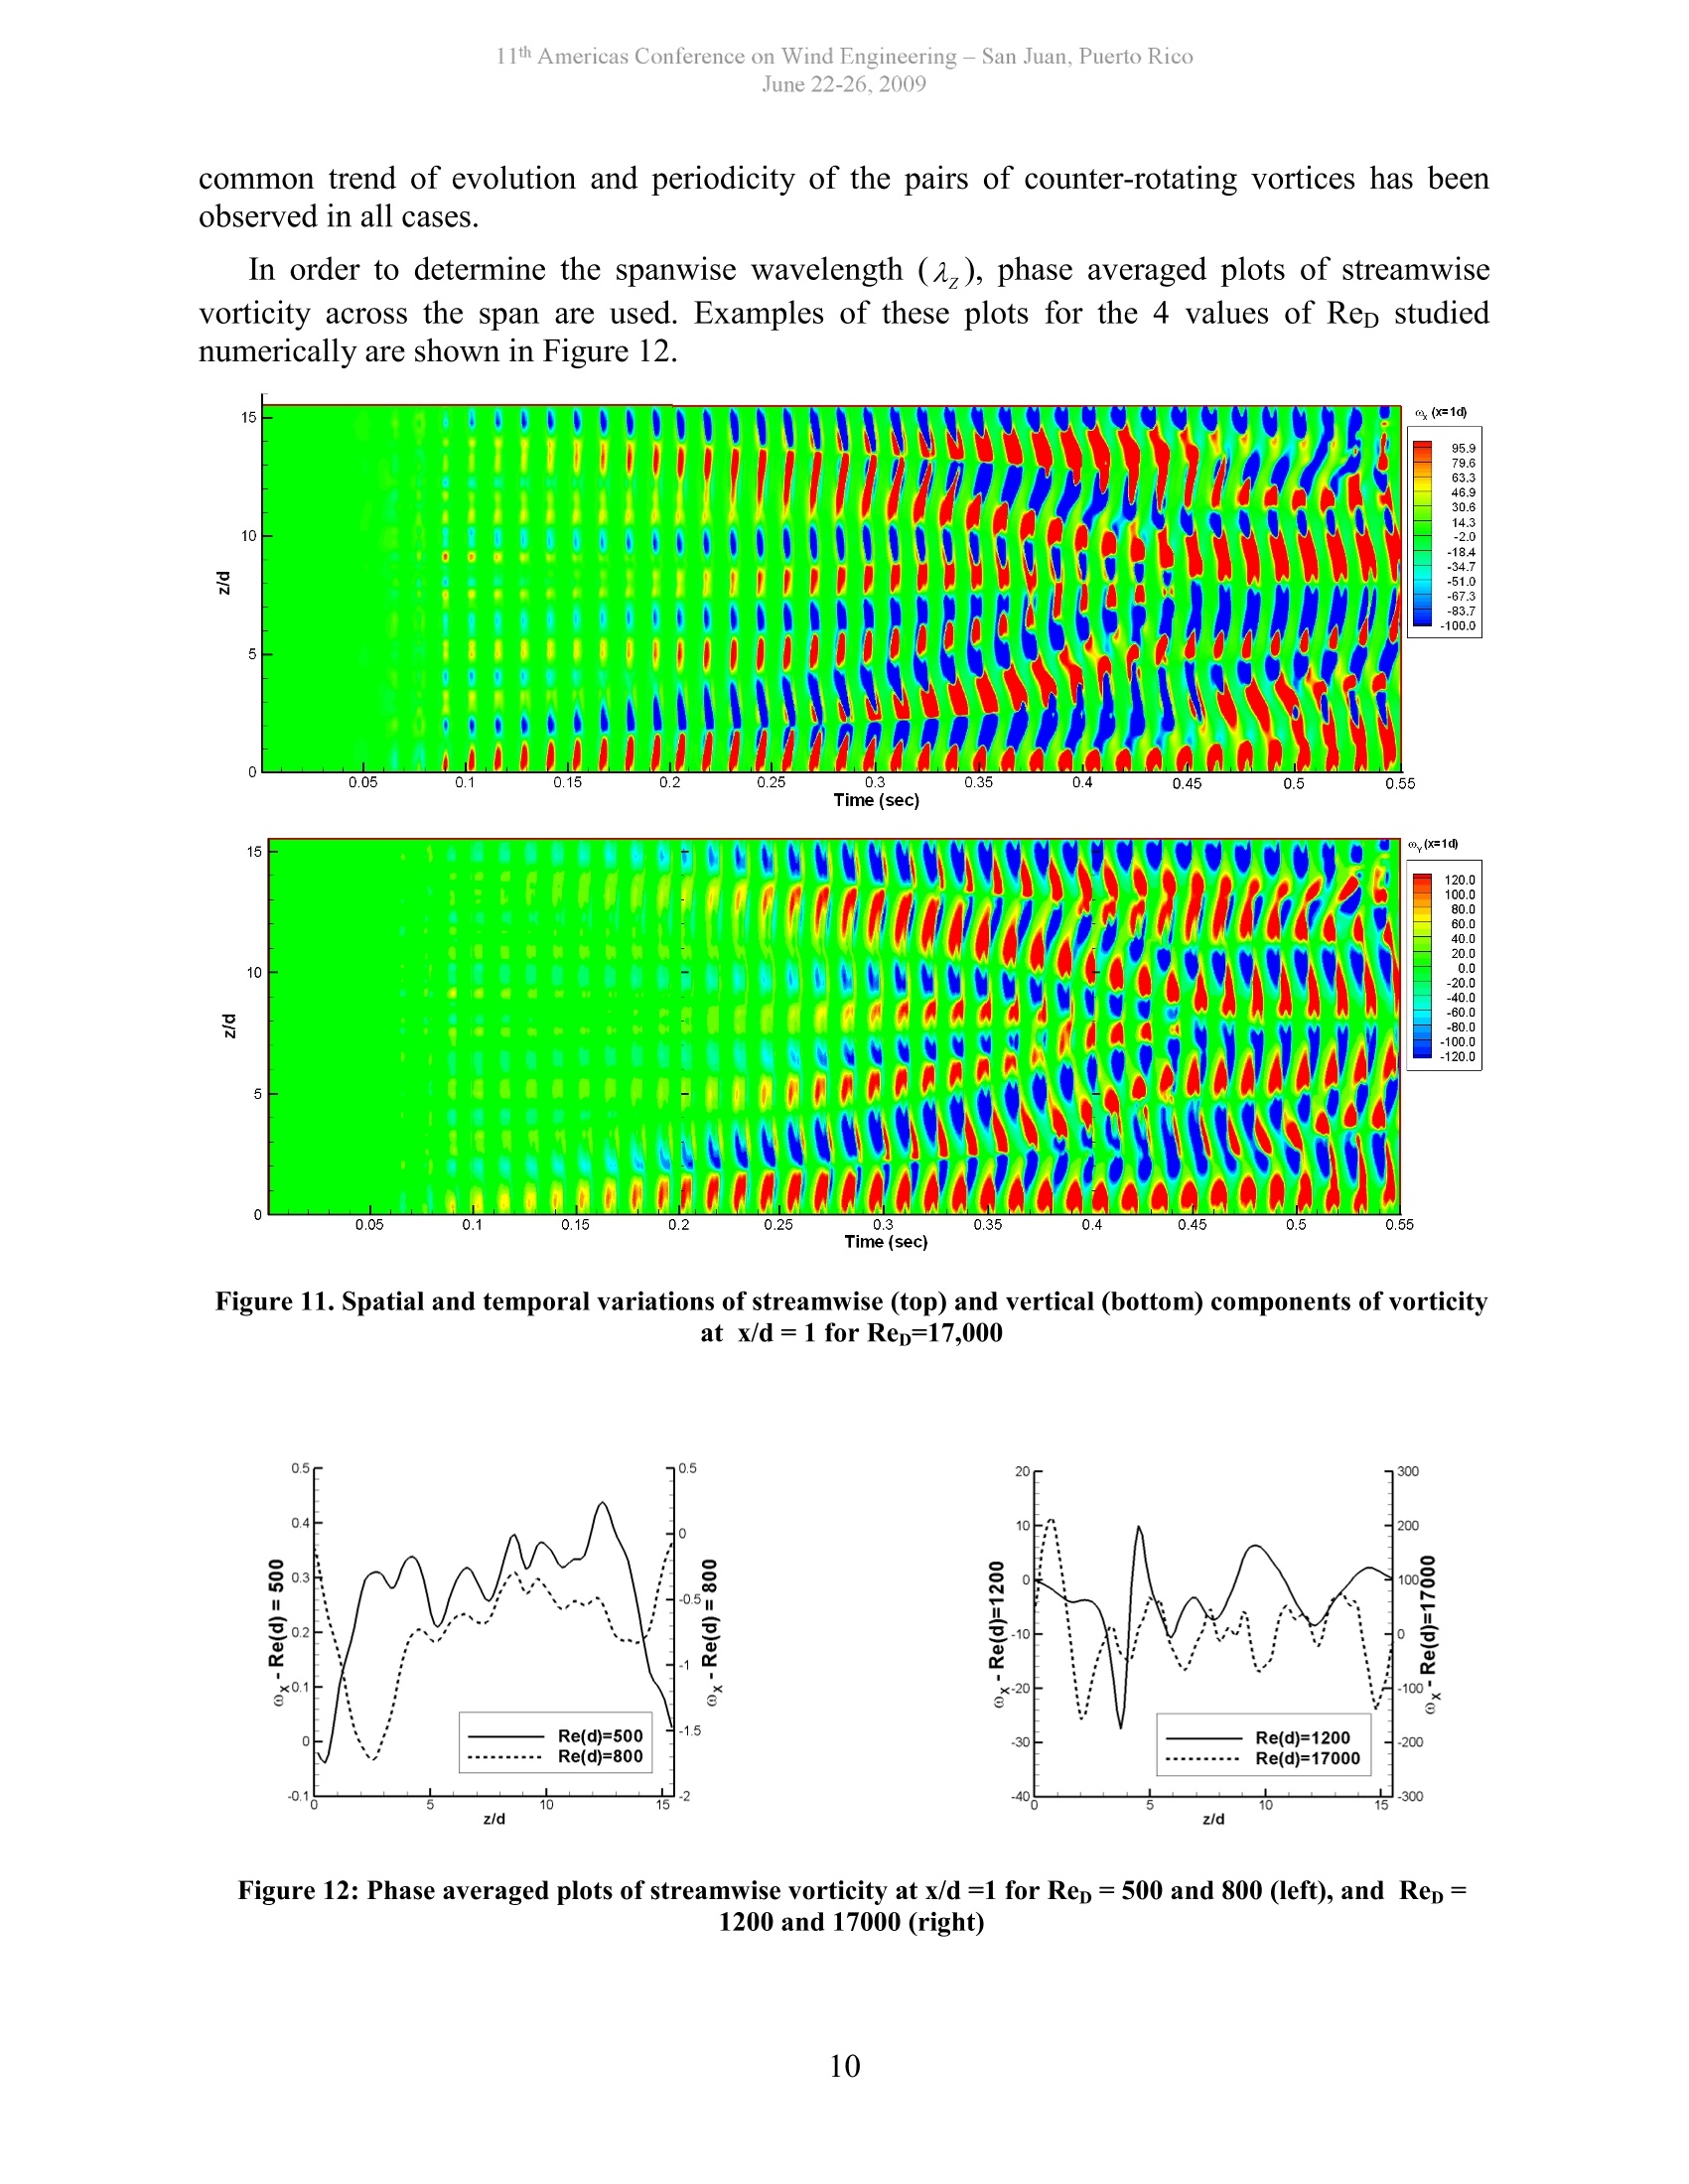
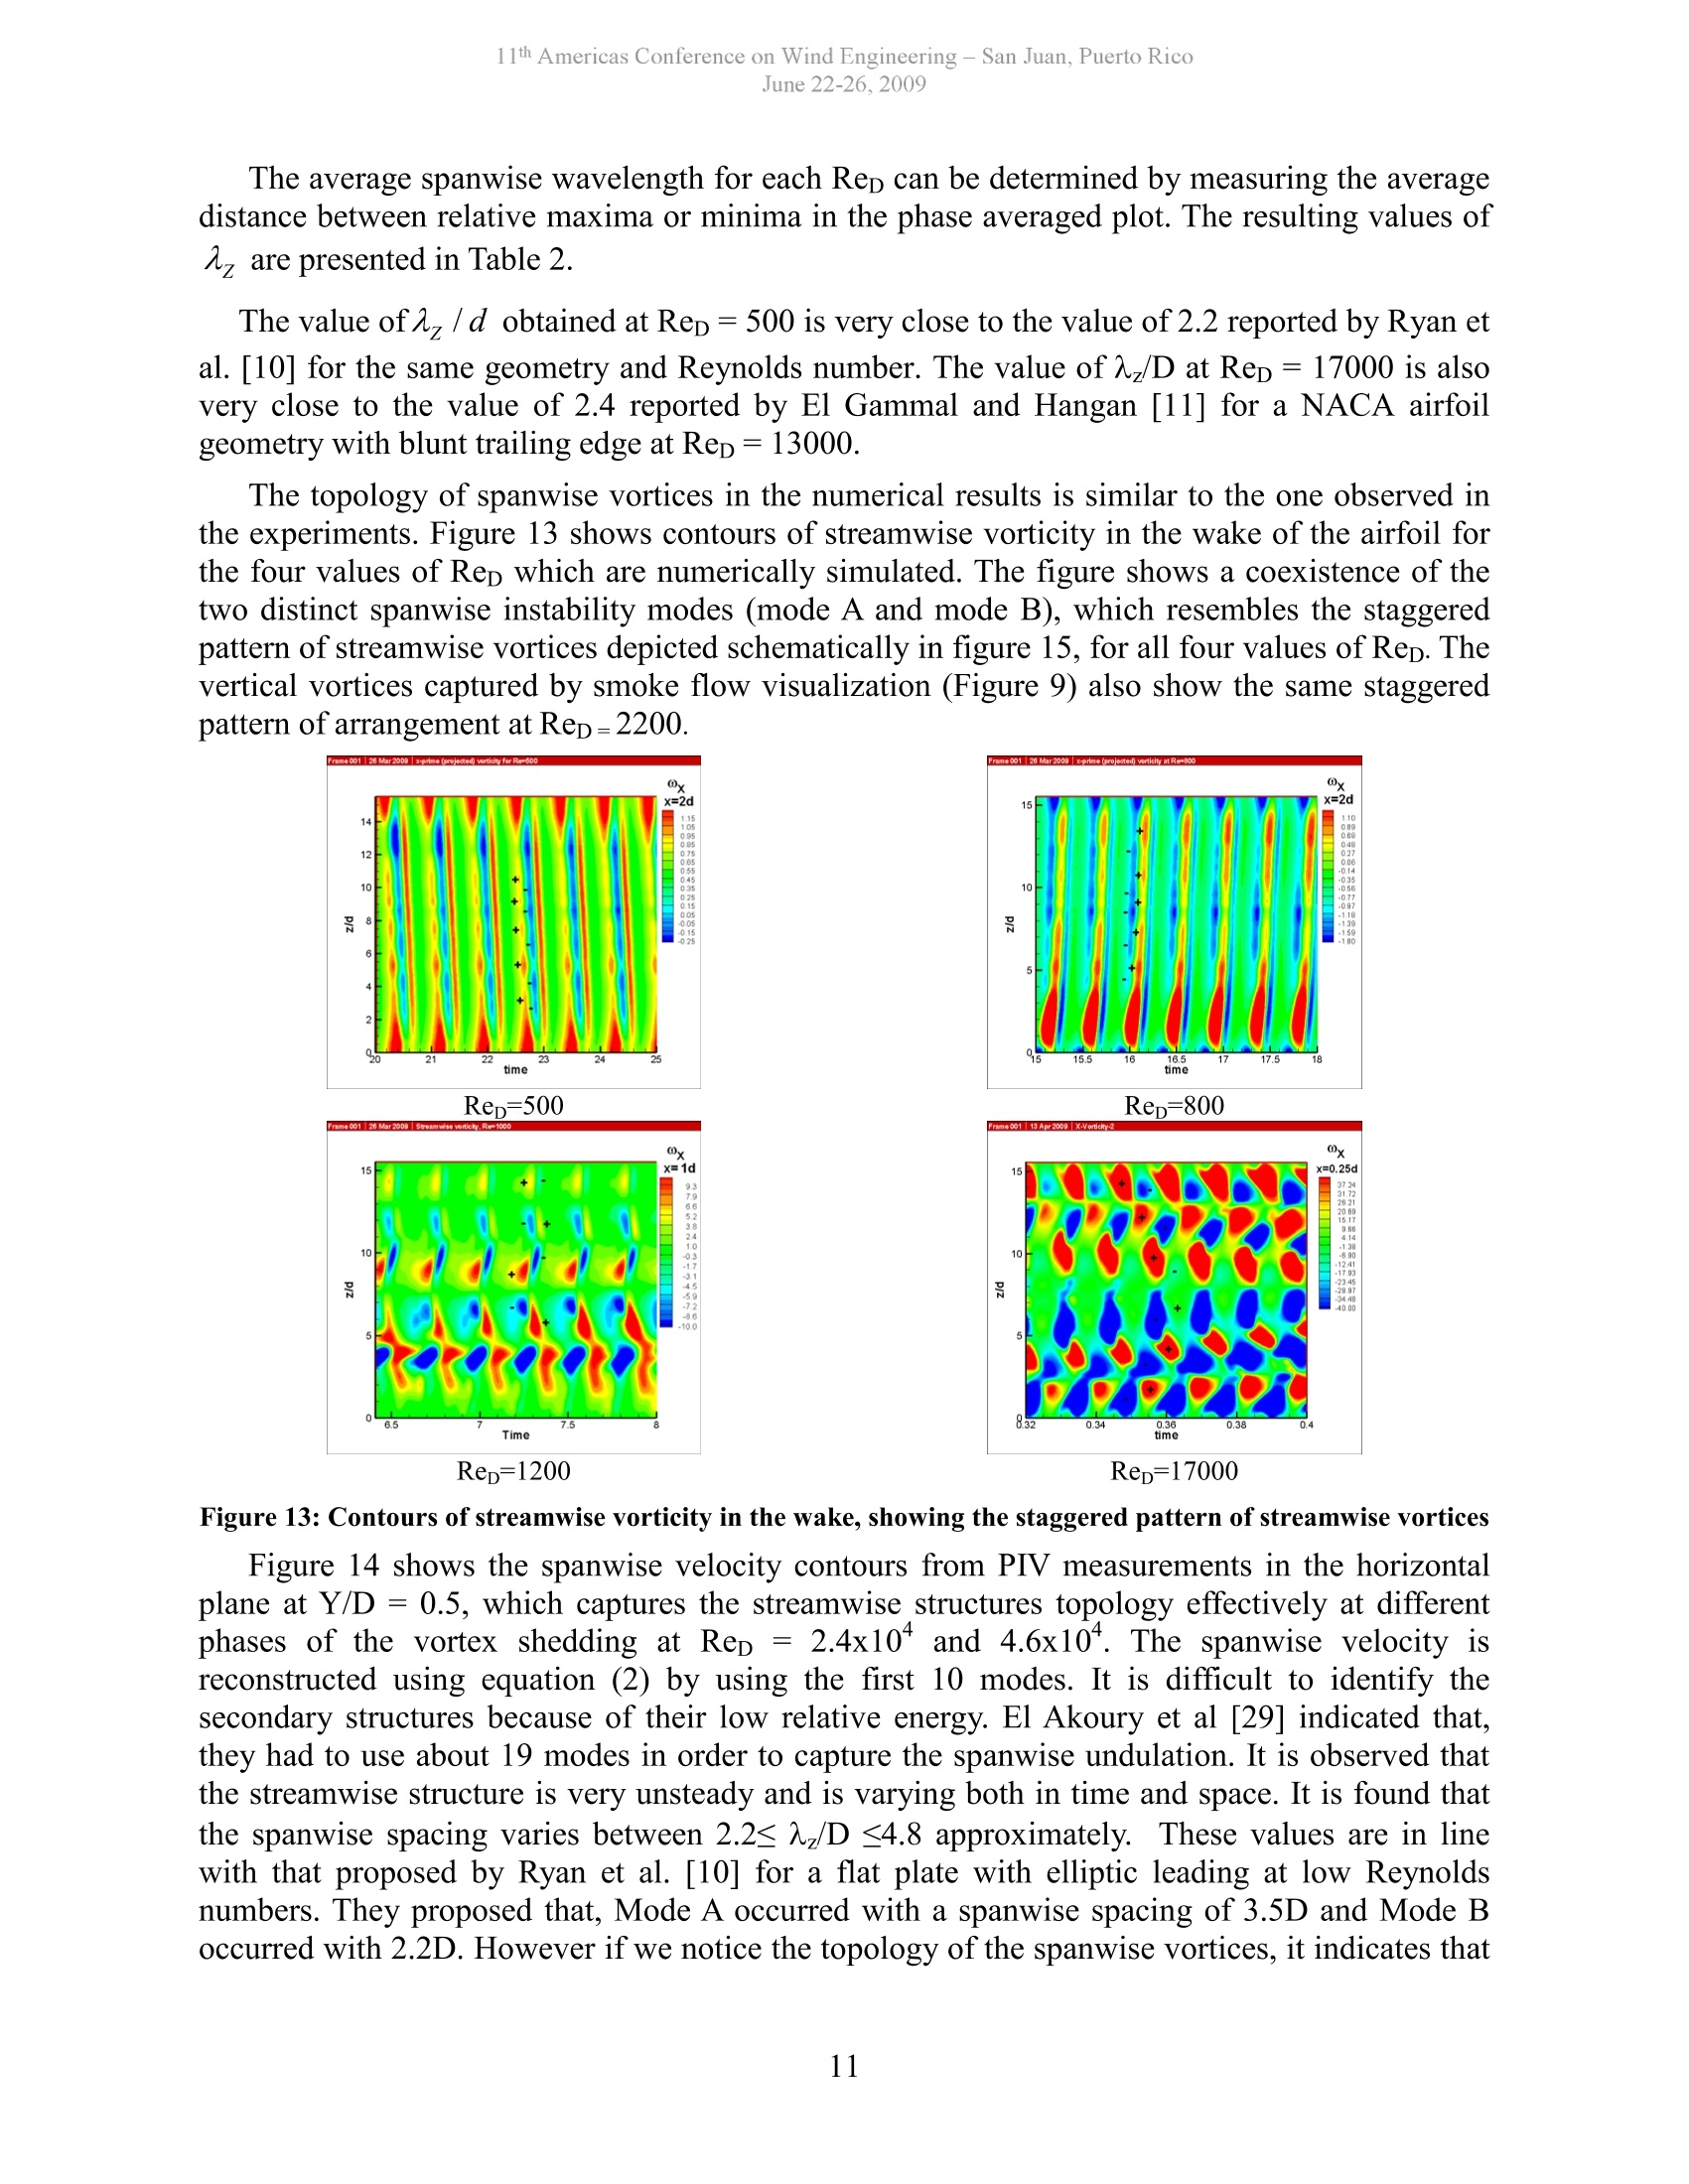
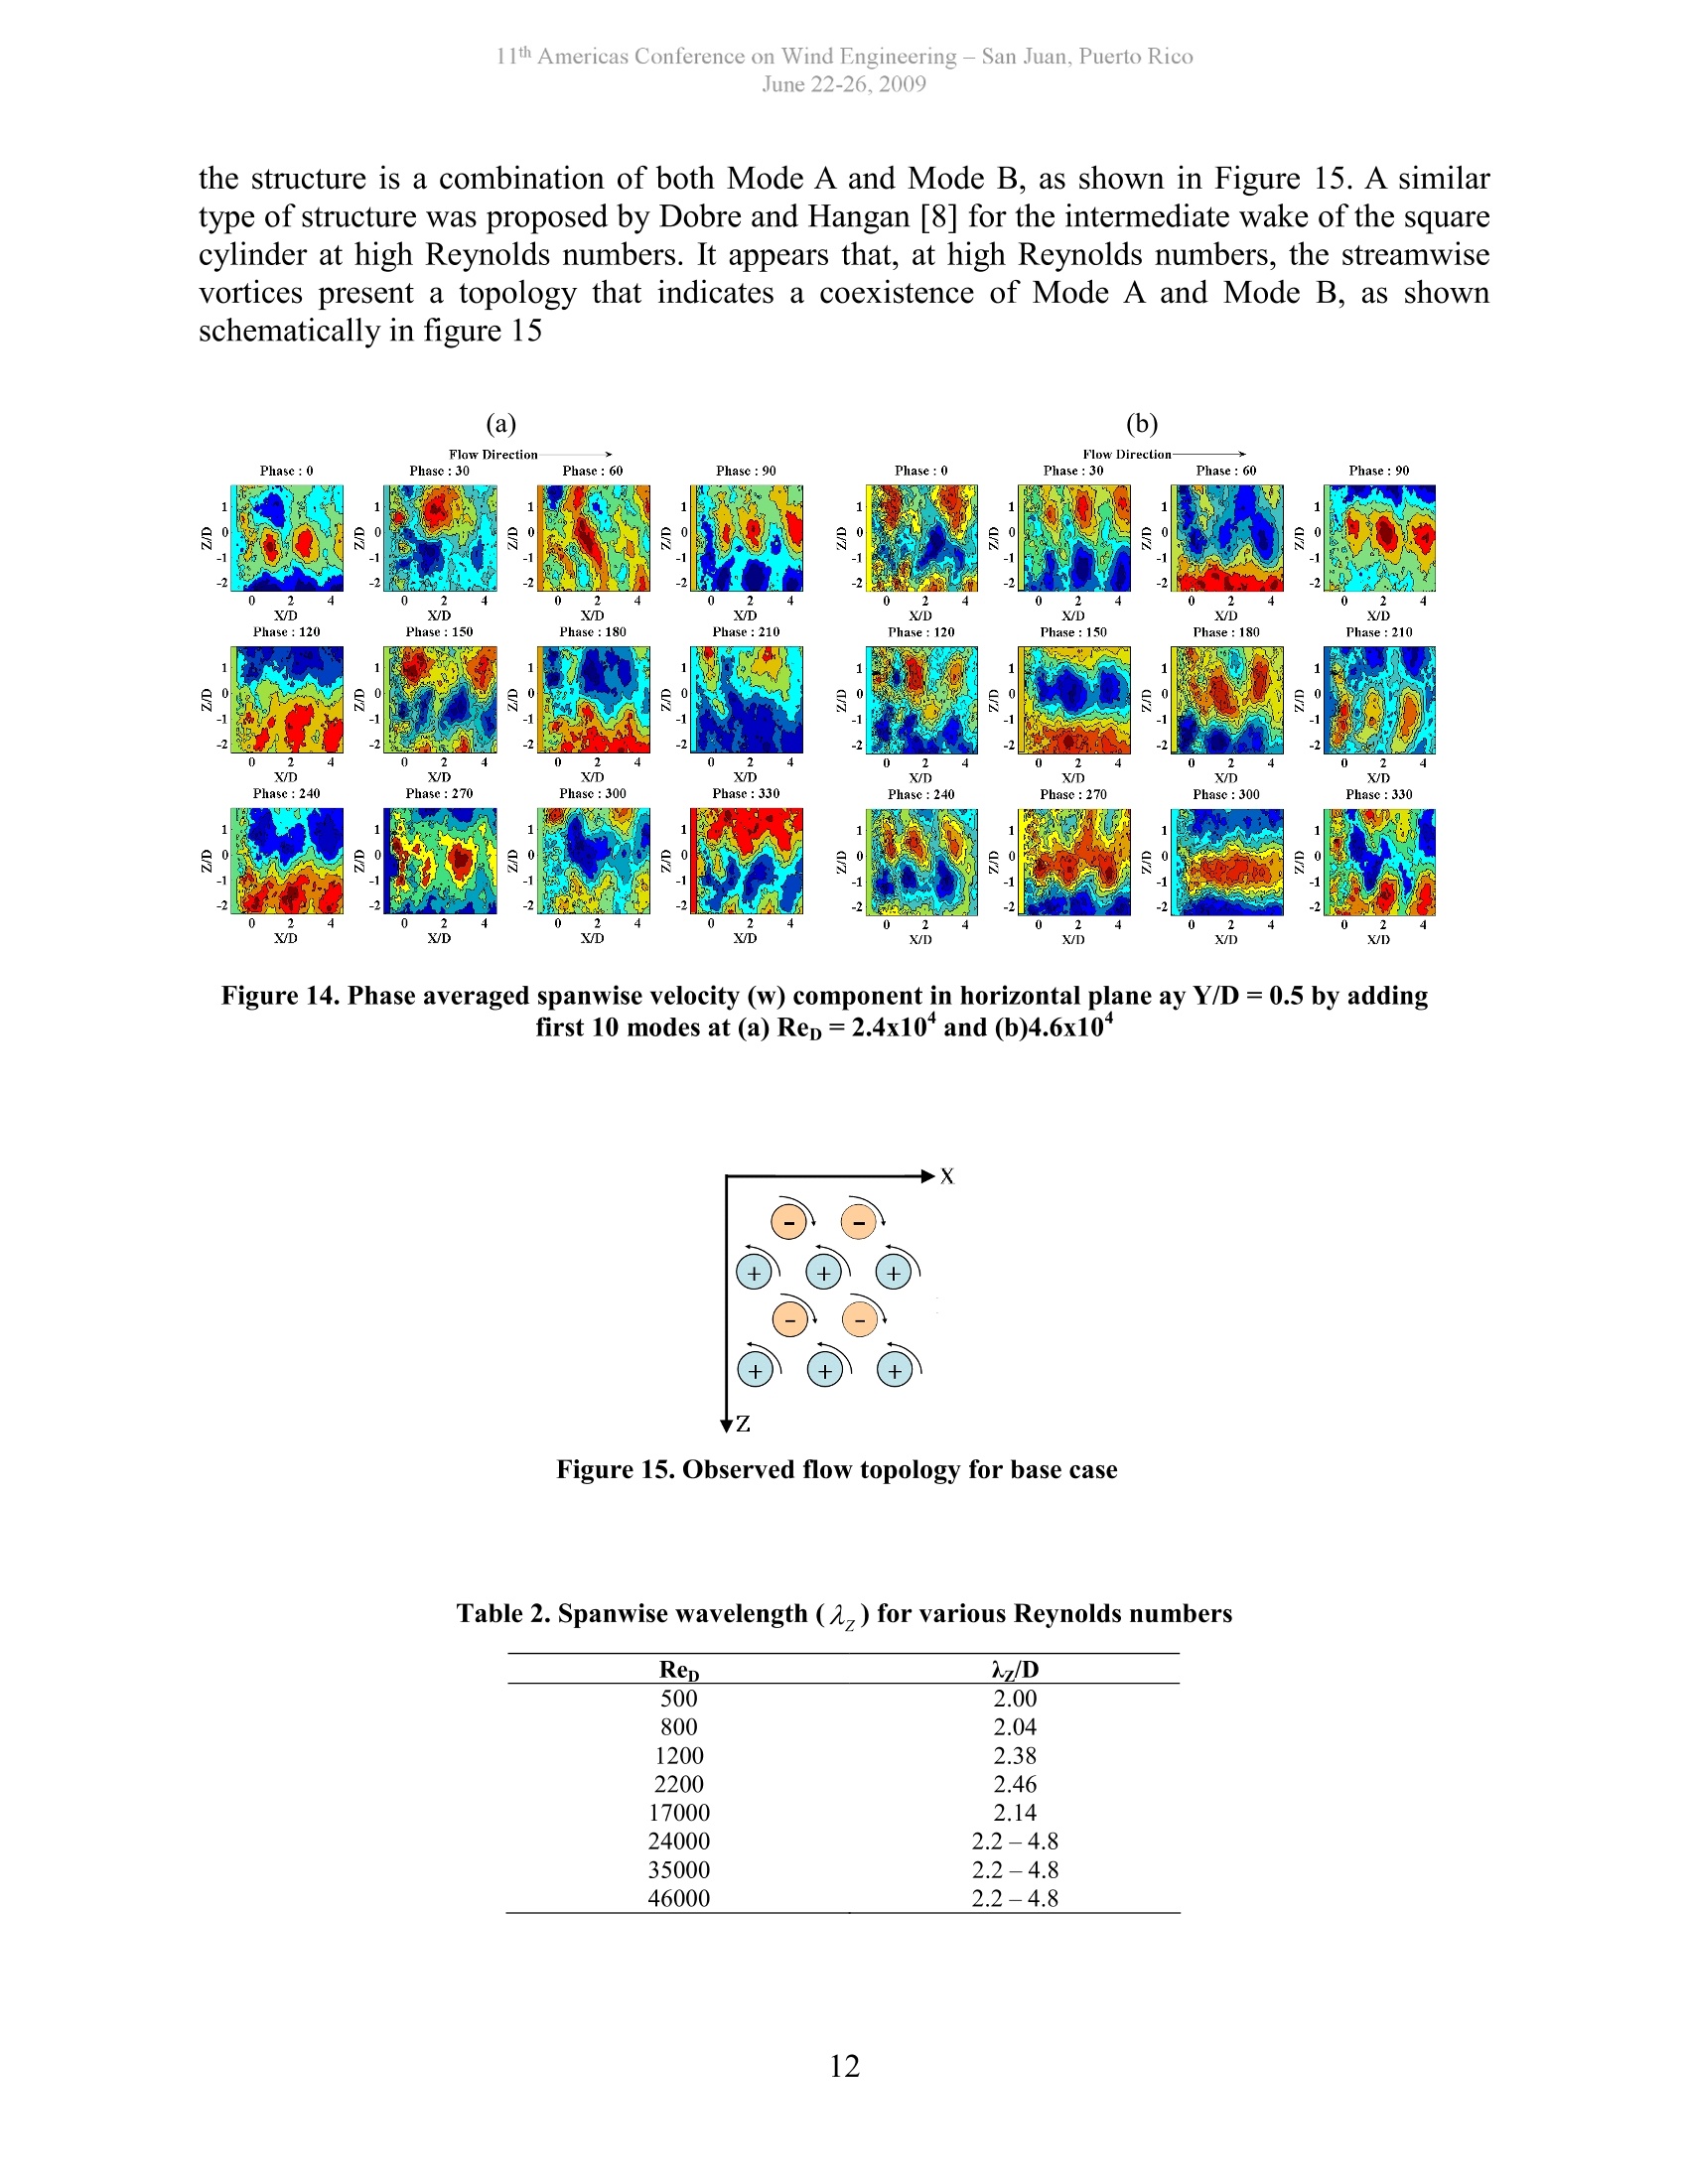
11th Americas Conference on Wind Engineering- San Juan, Puerto RicoJune 22-26.2009 Reynolds Number Dependency of the Near Wake Structureof a Blunt Trailing Edge Profiled Body L S Doddipatla , A Naghib Lahouti and H Hangan’. 'Research Assistant, sdoddipa@uwo.ca,Research Assistant, anaghibl@uwo.ca, 'Professor and Director,hmh@blwtl.uwo.ca The Boundary Layer Wind Tunnel Laboratory, University of Western Ontario, London, ON, N6A 5B9 ABSTRACT The three dimensional near wake flow topology behind a blunt trailing edge flat plate isinvestigated for a Reynolds numberrange varying from 500 to 4.6x10" using a combination offlow visualization, numerical simulations and experiments. The secondary wake instabilities areidentified using vorticity maps from CFD and performing Proper Orthogonal Decomposition(POD) on PIV data from experiments to identify the underlying dominant coherent structures.These structures are found to appear at a spanwise spacing ranging from 2.2 to 4.8. At higherReynolds numbers the secondary wake instabilities appear to be unsteady in space and time. INTRODUCTION Wake flows behind nominally two dimensional bodies are three dimensionally unstable andare governed by two modes of instability [1]. These two instability modes are characterized bythe two main coherent structures: The spanwise von Karmán vortices and the secondarystreamwise vortices, commonly referred to as rolls and ribs respectively. It has been observedthat the ribs wrap around the rolls and they produce roll distortions as the wakes evolvedownstream. Therefore enhancing three dimensional instabilities could lead to early suppressionof the spanwise von Karmán vortices accompanied by fluctuating lift and base drag reduction[2]. In order to develop an effective wake control strategy, identifying the secondary wakeinstability and triggering them would be the most efficient way. However the ambiguity lies in Figure 1. Description of Mode A and Mode B structures in XY and XZ planes identifying the most unstable wavelength that should be triggered. Two distinct threedimensional streamwise instability modes occur at low Reynolds numbers, i.e. Mode A and Mode B [1] (Figure 1). The X, Y and Z represent the streamwise, transverse and spanwisecoordinates. Williamson [1] showed for a circular cylinder flow, Mode A occurred at Rep>180and is gradually replaced by Mode B at Rep>230, and both modes coexist at Rep=220. Thespanwise spacing (z, defined as the spacing between the streamwise vortices of same sign in thespanwise direction) between streamwise vortices of Mode A is scattered between 3D to 5D [1, 3,4, 5], but for Mode B it has been demonstrated consistently to be around 1D [1, 3, 4, 5] invarious experiments for various Reynolds numbers (Rep), where D is the width of the wakegenerator. An interesting observation was made by Brede et al., [5] who experimentally showedthat, at low Rep (160-500), Mode B peaked in circulation strength two diameters downstream ofthe wake, whereas Mode A peaked in circulation strength around six diameters downstream,indicating that Mode B structure dominates the near wake dynamics. For a square cylinder, Robichaux et al. [6] conducted low Rep numerical simulation based onFloquet analysis and found same natural modes with larger spanwise spacing of 5.22D for ModeA and 1.2D for Mode B. Vickery [7] proposed spanwise correlation length of 5.6D (smoothstream) and 3.3D (turbulent stream) based on his high Rep (4 x 10* to 1.6 x 10) base pressuremeasurements. Dobre and Hangan [8] investigated the intermediate wake flow topology of asquare cylinder and proposed a structure similar to Mode A with a spanwise spacing of 2.4D atRep=2.2x 10*. Julien et al.[9] studied the dynamics of three dimensional secondary instabilities developingin the wake of a thin flat plate experimentally at Rep of 200. They found Mode B structuredominated the near wake and occurred with a spanwise wavelength2z/x=1(Ax is defined as thestreamwise spacing of the spanwise vortices of same sign), whereas in the far wake both modescoexist and grow equally. Ryan et al.[10] numerically investigated the near wake structure of aflat plate body with elliptical leading edge and blunt trailing edge for various aspect ratios (AR)for Rep of 220 to 700. They proposed that for very short bodies (AR <7.5) Mode A instabilitydominates the flow. However for intermediate and long bodies (AR> 7.5) Mode B instabilityplays a dominant role in the near wake dynamics. They reported a spanwise spacing (a/D) of3.5D for Mode A and 2.2D for Mode B. El-Gammal and Hangan [11] found a structure similar toMode B with a spanwise spacing (z/D) of 2.4D for mean wake of divergent trailing edge andshowed the robustness of this topology for both inflow conditions and stall incidence angles atRen of 1.2x10*. In order to determine the most unstable wavelength for wake decay process, downstream wakeevolution investigations were performed with different spanwise perturbation lengths. Fewinvestigations [9, 12, 13] have been performed to understand the effect of spanwise wavelengthon the downstream wake evolution. The existing results indicate that at low Reynolds numbers,there is no preferred spanwise wavelength that triggers these secondary instabilities. Darekar andSherwin [12] showed for a square cylinder at low Reynolds numbers, that any wavelengthbetween 2.4 and 5.6 will trigger these secondary instabilities. Julien et al. [9] indicated that theinstabilities could be triggered when the flow behind a thin flat plate was perturbed between0.5<=2/x<=1.1. However, Julien et al. [9] found that when the instability was perturbed with aspanwise wavelength (A/Xx) of 0.76, it grew much faster than any other wavelength. This valueis closer to the mixing layer’s most amplified wavelength(z/x) for both experimental [14] andnumerical [15] studies at low Reynolds numbers, which is centered on 0.67.Identifying the most unstable wavelength is much more difficult at high Reynolds numbers, because of difficulties in obtaining accurate numerical results and assuring perturbation free inletconditions in experimental facilities. We believe the at high Reynolds numbers the instabilitymodes will coexist. Existing studies indicate a broad scatter of spanwise wavelengths (Az) spacing with respect to the geometry of the body and Reynolds number. Oertel [16] pointed thatstreamwise vortices are dependent on several parameters such as the flow regime,free streamturbulence and end conditions. We propose to investigate the influence of Strouhal Number (St),Reynolds number (Rep) and inflow conditions. In essence we extend the normalization touniversal flow instability proposed by Dobre et al. [2] for different generators. The present investigation seeks to better understand the near wake evolution of a flat platewith an elliptical leading edge and a blunt trailing edge over a broad range of Reynolds numbers.This forms the basis for developing an effective flow control technique by enhancing the nearwake secondary instability modes. The control techniques will have potential applications inareas where reduction of fluctuating aerodynamic forces is desired over a broad range of flowconditions, such as sub-critical aeronautical and wind turbine blade airfoils. A combination offlow visualizations, CFD and experiments are being used to identify three dimensional wakestructures for Rep ranging from 500 to 50000. ANALYSIS MODEL Figure 2. Flat plate model used for this investigation, along with schematic of the region in the near wakeof the model imaged by the PIV system The blunt trailing edge airfoil geometry studied herein is similar to the one used in references[10], [17], [18] and[19]. The case of a flat plate with an elliptical leading edge, which representsa simplified blunt trailing edge airfoil, is especially interesting as it provides the desiredupstream boundary layer velocity profile at the trailing edge without the uncontrollable effects offorced separation-reattachment associated with sharp corners of a square leading edge. It consistsof an elliptical nose (semi-major axis/minor axis =2.5), followed by a rectangular section, asshown in Figure 2, with an aspect ratio (L/D=12.5). FLOW VISUALIZATION Flow visualizations in the wake of a model with the same geometry and dimensions as thoseshown in Figure 2 are carried out in a small open circuit wind tunnel with test section dimensionsof 0.46m (width) x 0.46m (height) x 1.2m (length) at the Boundary Layer WindLaboratory, using a smoke wire. The free stream velocity in the wind tunnel corresponds to Rep= 2200. To visualize and characterize the von Kárman vortex street, the smoke wire is mounted perpendicular to the airfoil at mid-span. Burst images with a capture rate of 16 frames per secondare used to determine the convective velocity. In order to capture the secondary structures in theairfoil wake, smoke wire is positioned parallel to the upper trailing edge of the airfoil, at anupstream location. NUMERICAL SIMULATION The solution domain is defined as a hexahedral volume surrounding the airfoil. The domainextends 5L behind, 2L in front, and 2L from the upper and lower surfaces of the airfoil. Thedistances between the solid surfaces of the airfoil and the domain boundaries are selected so thatthe perturbations caused by the airfoil diminish to a level that would not cause numerical error orinconsistencies when they reach the boundaries. The region surrounding the solid walls of the airfoil, as well as the region covering the nearwake (3D downstream from the base ofthe airfoil) is discretized using a structured grid ofhexahedral cells, which are refined towards the solid surfaces. The remaining part of the solutiondomain, which encompasses the inner region, is discretized using an unstructured grid oftetrahedral cells. The grid size has been previously increased in steps of +25% until gridindependence in terms of surface distribution of pressure coefficient is achieved. A close up ofthe final hybrid grid, which has a total of 1.05×10° cells, is shown in Figure 3. Figure 3: Detail of the grid in the vicinity of the base of the airfoil The segregated implicit scheme based on the SIMPLE algorithm, which is available in thecommercial CFD program Fluent, has been used for solution of the governing equations in threedimensions. Temporal discretization is carried out using a time step size ofysoTs, where Ts isthe predicted shedding period of von Karmán vortices at each Reynolds number. Details of thenumerical solution procedure can be found in [13]. EXPERIMENTAL FACILITY All Particle Image Velocimetry (PIV) measurements for this investigation are performed inthe 0.61 m x 0.61 m x 1.21 m subsonic wind tunnel facility at The University of WyomingAeronautics Laboratories. This is an open loop wind tunnel with a variable frequency drivenmotor capable of producing free-stream velocities between 10 and 50 m/s. The inlet section ofthe wind tunnel has a honeycomb insert and three sets of screens to break down large scale non-uniformities. For this investigation a flat plate model with a modified elliptical leading edge forsmooth transition of flow over the model are used. A 6.25 mm wide sand strip is applied near theleading edges of these models to ensure that the boundary layer is fully turbulent. The main flow direction aligns with the X-axis (Figure 2). For this investigation, the Rep is varied from 2.4x10"to 4.6x10⁴. INSTRUMENTATION PIV measurements were performed in the near wake to study the near wake secondaryinstabilities. To study the spanwise vortices and streamwise vortices, PIV measurements areperformed at a vertical plane and two horizontal planes (Y/D=0 and 0.5). A LaVision PIVsystem with a dual frame CCD camera is used for this investigation. To perform PIVmeasurements, the flow is seeded using atomized oil, and the wake is illuminated using twin 50mJ Nd: YAGlasers. The wake velocity field is determined from raw images using a cross-correlation, multi-pass, decreasing window size technique. A schematic of the location in thenear wake where PIV measurements are performed relative to the flat plate model is shown inFigure 2. To measure pressure fluctuations in the base region, four Entran high speed pressuretransducers (model EPE-541-2P) were used. Validyne model SG297A modules providedexcitation and signal conditioning for these pressure transducers. Using a high speedsimultaneous data acquisition system (Kinetic Systems V200), voltage signals from thesetransducers were acquired at a sampling frequency of 6250 Hz and low pass filtered at 3000 Hz.All these high-speed transducers were calibrated using a Validyne DP-15 transducer every daybefore the start of testing. In order to perform the POD analysis, randomly acquired wake velocity flow field data wasrequired. To achieve this, a soft trigger was generated randomly and was sent to both the dataacquisition system and the PIV timing unit. For all experiments, 1000 random PIV images wereacquired. PROPER ORTHOGONAL DECOMPOSITION For this investigation, Proper Orthogonal Decomposition (POD) is used to study the nearwake structure. POD analysis yields a set of Eigenvectors or POD modes (Q) that are optimalorthogonal basis functions. In this investigation, these POD modes are optimized for the kineticenergy and the combination of these POD modes provide information about the spatial structuresof the investigated flow field. The Eigenvalues(2,) associated with each of these POD modes,represent the kinetic energy captured by the corresponding POD mode. Using these POD modesthe fluctuation velocity field can be reconstructed [20] using u(x,y,t)=2a0(")xy (2)i=1 where a0 is the time varying coefficient for the ih POD mode((") at time t. These timevarying coefficients are determined by projecting the instantaneous velocity field (u(x,y,t))onto the POD modes. For detailed description of POD, refer to [21]. PHASE AVERAGING As the von Karmán instability is of the global type, the velocity and pressure have a strongquasi-periodic component at every point in the flow governed by the Strouhal frequency value. Following Reynolds and Hussain [22], the motion is then decomposed into mean component, aperiodic fluctuation and a chaotic one. The phase averaged component can be written as (Ui)=U.+U. (9) Measurements of phase-averaged quantities need a reference signal from which the phase ofthe flow is determined. Several choices are possible: Wlezien and Way [23] have used thevelocity signal measured by the hotwire technique just above the boundary layer on the cylinder,near the separation line, and used Hilbert transform technique to measure the phase of the signal.Cantwell and Coles [24] used the pressure signal on the cylinder and used a phase locked loop(PLL) component to measure the phase ofthe signal. In the current study the reference signal is a pressure signal measured at the base of the flatplate very near to the shear layer, so that the signal has a strong quasi-periodic component at theStrouhal frequency. For this signal, the phase is determined by using the Hilbert transformtechnique as used by Wlezien and Way [23]. The power spectrum of the pressure signal exhibits a peak at frequency of 161 Hz;correspond to Strouhal frequency of 0.2. To obtain phase averaged quantities, 1000 samples ofsimultaneous PIV and pressure were acquired. From the pressure signal, the phase of the flow isdetermined by calculating the Hilbert transform. The pressure signal has irregularities at some instances, where the periodic component is ofinterest. Determining phase at these instances is not possible by this technique. Therefore theseinstances were detected and removed during the analysis. We applied threshold on the envelopeand the instantaneous frequency determined by the Hilbert transforms technique. The velocityfields were then classified according to phase intervals of 2元/12. After this sort, approximately70 images were collected per each class and averaged. RESULTS AND DISCUSSION POD MODES AND COEFFICIENTS Figure 4 show the first five modes of streamwise and transverse velocity components in thevertical plane (XY) for base case. This plane captures the signature of the spanwise von Karman-Benard vortices or rolls. The modes indicate that they are acting in pairs, also reported by Deane Figure 4. Streamwise and transverse velocitycomponents for the first five POD modes in verticalplane at Rep=2.4x10* Figure 5. Phase averaged time varying coefficientsfor base case et al. [25], Noack et al. [26] for circular cylinder flows, Van Oudheusden [27] for square cylinderand Durgesh [28] for a flat plate model. The first two modes appear as phase-shifted versions ofeach other, which can be combined to produce the von Karmán vortices. Similarly modes 4 and 5contribute to the higher harmonic of von Karmán vortices. Mode 3 appears to be a standingmode with no companion mode. In order to further understand these modes we look at therelation between the time varying coefficients. Figure 5 shows the phase averaged time varyingcoefficients for base case. It indicates that phase of the time varying coefficients of first andsecond modes are 90 degrees apart and the magnitude is of the same order, indicating that theyrepresent the same coherent structure shifted in phase. Hence these two modes can be combinedto produce the von Karmán vortices at any phase in the shedding process. Similarly modes fourand five are also 90 degrees phase shifted pair. The wavelength of mode pair 4 and 5 correspondsto half wavelength of mode pair 1 and 2, and hence mode pair 4 and 5 shed at twice thefrequency of mode pair 1 and 2. Therefore mode pair 4 and 5 forms the higher harmonic of modepair 1 and 2 (which forms the von Karman vortices). SPANWISE VORTICES Smoke flow visualization in the vertical (XY) plane at Rep = 2200 indicates formation of avon Karmán vortex street in the wake of the airfoil, as shown in Figure 6. Figure 6: Smoke visualization of the von Karman vortices in the wake of the airfoil at Rep =2200 The von Karmán vortex street can also be observed in the results (Figure 7) of numericalsimulations at four free stream velocities of U。=0.25m/s, 0.40m/s, 0.60m/s and 10m/s, whichare equivalent to Rep=500,800, 1200, and 17,000 respectively. Figure 7 shows contours of vorticity magnitude w on the mid-plane of the solution domain,for the four mentioned values of Rep. A decreasing trend in the thickness of the shear layer, aswell as the length of the formation region, can be observed in Figure 7, as Rep is increased from500 to 17,000. Figure 8 shows the phase averaged streakline plots showing the spanwise vorticesat Rep =2.4x10+obtained by the adding first two POD modes, obtained from the PIVmeasurments. In Table 1, the streamwise wavelength Ax is determined directly by measuring the averagedistance of each two consecutive vortices shed from either corner of the trailing edge. Theconvective velocity Uc is determined by dividing Ax by the shedding period Ts in case of thenumerical simulations and experiments, and by measuring the displacement of vortices in asequence of burst images in case of the flow visualization. The lowest value of Strouhal number (0.152), which is associated with the lowest Rep, is veryclose to the value of 0.158, reported by Ryan et al. in [10] for the same geometry and Rep. Thehighest value of Strouhal number (0.228), which is associated with the Rep=17000, is also in close agreement with the one found by Tombazis and Bearman [17], who reported a value of0.24 for the same geometry at Rep=40000. (d) Figure 7: Contours of vorticity magnitude |ω| on the mid-plane of the solution domain at Rep=500 (a), 800(b),1200 (C), and 17,000 (d) Figure 8 : Streakline plots at different phases at Rep=2.4x10° Table 1. Principal characteristics of the von Karman vortex street Rep St Ax/d Uc/U. 500 0.152 5.5 0.84 800 0.167 4.9 0.82 1200 0.178 5.0 0.89 2200 0.238 0.86 17000 0.228 0.80 24000 0.21 0.86 35000 0.21 0.86 46000 0.21 0.86 STREAMWISE VORTICES Smoke flow visualization in the horizontal (XZ) plane at Rep=2200, which is carried out byplacing the airfoil parallel to the smoke wire, indicate that the von Karmán vortex street in thewake of the airfoil is accompanied by three dimensional instabilities. These three dimensionalinstabilities manifest as vertical vortices, which can be observed in Figure 9. The averagespanwise spacing between pairs of counter-rotating vertical vortices in the snapshot shown(Figure 9) is found to bea/D=2.46. Figure 9: Smoke visualization of the secondary structures in the wake of the airfoil at Rep =2200 (flow isfrom left to right) Results of the numerical simulations also indicate the presence of three dimensionalstructures in the wake, in the form of streamwise and vertical vorticity components. To analyzethese three dimensional structures, the spatial and temporal variations of the streamwise andvertical vorticity are studied along spanwise lines at various downstream locations, which areshown in Figure 10. Figure 10 : Location of spanwise lines for probing spatial and temporal variations of vorticity in numericalsimulations Figures 11 shows examples of spatial and temporal variations of the streamwise and verticalcomponents of vorticity (ω, andωy). The figure shows variations at Rep =17,000 along aspanwise line located at x/d=1.0 and y/d=0.5. The similar pattern of emergence and evolution ofstreamwise and vertical vorticity components, which accompany the periodic shedding ofspanwise vortices, can be observed clearly in this figure. The figure also indicates that the threedimensional instability of the spanwise vortices, which results in the pairs of counter-rotatingstreamwise and vertical vortices, occurs with a periodic nature across the span. It should bementioned that although the vorticity structure is not exactly similar for all Reynolds numbers, a common trend of evolution and periodicity of the pairs of counter-rotating vortices has beenobserved in all cases. In order to determine the spanwise wavelength (a), phase averaged plots of streamwisevorticity across the span are used. Examples of these plots for the 4 values of Rep studiednumerically are shown in Figure 12. Figure 11. Spatial and temporal variations of streamwise (top) and vertical (bottom) components of vorticityat x/d=1 for Rep=17,000 Figure 12: Phase averaged plots of streamwise vorticity at x/d=1 for Rep=500 and 800 (left), and Rep= 1200 and 17000 (right) The average spanwise wavelength for each Rep can be determined by measuring the averagedistance between relative maxima or minima in the phase averaged plot. The resulting values ofAz are presented in Table 2. The value ofa,/d obtained at Rep=500 is very close to the value of 2.2 reported by Ryan etal.[10] for the same geometry and Reynolds number. The value of /D at Rep= 17000 is alsovery close to the value of 2.4 reported by El Gammal and Hangan [11] for a NACA airfoilgeometry with blunt trailing edge at Rep=13000. The topology of spanwise vortices in the numerical results is similar to the one observed inthe experiments. Figure 13 shows contours of streamwise vorticity in the wake of the airfoil forthe four values of Rep which are numerically simulated. The figure shows a coexistence of thetwo distinct spanwise instability modes (mode A and mode B), which resembles the staggeredpattern of streamwise vortices depicted schematically in figure 15, for all four values ofRep. Thevertical vortices captured by smoke flow visualization (Figure 9) also show the same staggeredpattern of arrangement at Rep=2200. Frme 001 26 Mar 2009 xprime (projacted) vorticity far Re-50 rme00126 Mar2009 xprme (projected) vorticit atRe=000 Frme001 26 Mor2009 Straamwisa voticity, ame00113 Apr2009X-Vorticit Rep=1200 Rep=17000 Figure 13: Contours of streamwise vorticity in the wake, showing the staggered pattern of streamwise vortices Figure 14 shows the spanwise velocity contours from PIV measurements in the horizontalplane at Y/D=0.5, which captures the streamwise structures topology effectively at differentphases of the vortex shedding at Rep =2.4x10 and 4.6x10". The spanwise velocity isreconstructed using equation (2) by using the first 10 modes. It is difficult to identify thesecondary structures because of their low relative energy. El Akoury et al [29] indicated that,they had to use about 19 modes in order to capture the spanwise undulation. It is observed thatthe streamwise structure is very unsteady and is varying both in time and space. It is found thatthe spanwise spacing varies between 2.2≤ 二z/D ≤4.8 approximately. These values are in linewith that proposed by Ryan et al. [10] for a flat plate with elliptic leading at low Reynoldsnumbers. They proposed that, Mode A occurred with a spanwise spacing of 3.5D and Mode Boccurred with 2.2D. However if we notice the topology of the spanwise vortices, it indicates that the structure is a combination of both Mode A and Mode B, as shown in Figure 15. A similartype of structure was proposed by Dobre and Hangan [8] for the intermediate wake of the squarecylinder at high Reynolds numbers. It appears that, at high Reynolds numbers, the streamwisevortices present a topology that indicates a coexistence of Mode A and Mode B, as shownschematically in figure 15 Figure 14. Phase averaged spanwise velocity (w) component in horizontal plane ay Y/D=0.5 by addingfirst 10 modes at (a) Rep=2.4x10* and (b)4.6x10" Figure 15.Observed flow topology for base case Table 2. Spanwise wavelength (A) for various Reynolds numbers Rep 2z/D 500 2.00 800 2.04 1200 2.38 2200 2.46 17000 2.14 24000 2.2-4.8 35000 2.2-4.8 46000 2.2-4.8 DEVELOPMENT OF WAKE CONTROL The results of the present research, which attempts to identify and quantify the secondary vortexstructures for the blunt trailing edge over a broad range of Reynolds numbers, provide a basis fora flow control mechanisms which operates through amplification of the secondary vortexstructures. The flow control mechanism can be passive or active. Each of these two flow controlapproaches has its specific advantages and disadvantages. However, as both approaches follow acommon principle, which is amplification of the secondary structure, they have to be based onthe spanwise spacing of the secondary vortex structures as the principal design parameter. Thiswill govern the spanwise wavelength/periodicity of geometrical protrusions in case of the passivecontrol approach, as well as the spanwise spacing of the distinct injectors in case of the activecontrol approach. A passive control mechanism consists of spanwise sinusoidal perturbations (SSP) at the trailingedge of the airfoil, which affect the wake so that the secondary vortex structures are excited, andthe primary von Karmán vortex street is disorganized and weakened. The control has beensuccessfully applied to square cylinder flow by Dobre et al.[2]. The same passive flow controlmethod will be adapted to the current flow configuration such that the vortex shedding ismitigated and maximum reduction is achieved in term of fluctuating lift and base drag. An activecontrol mechanism, on the other hand, will be based on injection of a secondary flow at thetrailing edge to amplify the secondary vortex structures to achieve the same objectives asmentioned above. CONCLUSIONS AND FUTURE WORK The analysis tends to indicate that in the near wake of the profiled flat plate, both Mode A andMode B structures coexist and the near wake flow topology appears to be a combination of bothmodes, as also proposed by Dobre and Hangan [8] for square cylinder flows. The spanwisespacing between the secondary vortices (the ribs) is found to vary between 2.0≤Az/D ≤4.8, whichcorresponds to 0.36≤Az/x≤1.14 respectively. It can also be concluded that the unsteadiness inthe secondary structures increase as the Reynolds number increases. The next step will be tostudy which spanwise instability wavelength grows faster than others, to develop an efficientflow control. ( REFERENCES ) ( [l] C.H.K. Williamson, V o rtex dynamics in cylinder Wa k e, Annual Review ofFluid Mechanics, 28 (1996) 477-539. ) ( [2] A. Dobre, H . Hangan, B.J. Vickery, W a ke control based on spanwise sinusoidal perturbation, AIAA Journal,44(3)(2006)485-492. ) ( [3] H. Mansy, P.M. Y a ng, D.R. W i lliams, Quantitative Measurements of Three-Dimensional Structures in the W a keofa Circular Cylinder, Journal ofFluid Mechanics, 270 (1994) 277-296. ) ( [4] H .Q. Zhang, U . Fey,B.R. Noack, M . Konig, H. Eckelmann, On the Tra n sition of the Cylinder Wa k e, Physics ofFluids, 7(4) (1994) 779-794. ) [5]M. Brede, H. Eckelmann, D. Rockwell, On Secondary Vortices in the Cylinder Wake”, Phys. Fluids, 8(8) (1996)2117-2124. [6] J. Robichaux, S.Balachandar, S. P.Vanka, Three-dimensional floquet instability of the wake of square cylinder,Physics ofFluids, 11(3)(1999) 560-578. ( [7] B .J. V ickery, F luctuating lift and drag on a long cylinder of square cross-section in a smooth and in a turbulentStream, Journal ofFluid Mechanics, 25(3)(1966) 481-494. ) ( [8] A. D obre, H. Hangan, Investigation of the three-dimensional intermediate wake topology for a square cylinderat high Reynolds number, E xperiments in F luids, 37 (2004) 518-530. ) ( [9] S. J ulien, J . L asheras, J . Chomaz, Thr e e-dimensional instability and vorticity patterns in the wake of a flatplate, Journal ofFluid Mechanics, 479 (2003)155-189. ) ( [10] K . R yan, M . C. Th o mpson,, K. H o ur i gan, Three - dimensional transit i on in the wake of elongated bluff bodies,Journal ofFluid Mechanics, 538 ( 2005) 1 -29. ) ( [11] M . E l-Gammal, H . Hangan, Th r ee-dimensional wake dyn a mics ofa blun t and divergent trailing edge airfoil,Experiments in Fluids, 44(2008)705-717. ) ( [12] R .M. D arekar, S.J. S herwin, Flow past a square-section cylinder with w avy stagnation face, J ournal of FluidMechanics, 426 (2001)263-295. ) [13] J.C. Lasheras, H. Choi, Three-dimensional instability ofa plane free shear layer, Journal ofFluid Mechanics,189 (1988)53-86. [14] L.P. Bernal, A. Roshko, Streamwise vortex structure in plane mixing layers, Journal of Fluid Mechanics, 170(1986)499-525. [15] M.M. Rogers, R.D. Moser, Spanwise scale selection in plane mixing layer, Journal of Fluid Mechanics, 247(1993)321-337. ( [16] H . O ertel, Jr. , Wakes behind Blunt Bodies, Annual Review of Fluid Mechanics, 22 (1990) 539-564. ) ( [17] N . T ombazis, P . W. Bearman, A S t u d y of three-dimensional aspe c ts of v o rtex Shedding from a blu f f body with amild geometric disturbance, Journal of Fluid Mechanics,330 (1997) 85-112. ) ( [18] H. Park, D. Lee, W. Jeon, S. Hahn, J. Kim, J. Choi, H. Choi, Drag Reduction in Flow over a T wo-dimensional. BluffBody with a Blunt Trailing E dge Using a New Passive Device, J. Flu i d Mech., 563(2006) 389-414. ) ( [19] J . Kim, S . H ahn, J . K i m, D. Le e , J. C h oi, W. Jeon, H. Ch o i,“Ac t ive Control of Turbulent Flow over a ModelVehicle for Drag Reduction”, J. T u rbulence, 5( 1 9) (2004). ) ( [20] P. H olmes, J.L. Lumley, G . Berkooz, Turbulence, Coherent Structures, Dynamical Sys t em and Symmetry,Cambridge, Ist ed., 1996. ) ( [21] L.S. Doddipatla, H. Hangan, V . Durgesh, J .W. N aughton, Near-Wake Flow Dynamics Resulting from TrailingEdge Spanwise Perturbation, 4th Flow Control Conference, Seattle, Washington, June 23- 26 (2008) ) ( [22] W . C . Reynolds, A. K. M. F. Hussain, Th e mechanics ofan organized wave i n tur b ulent shear flow. Part 3 .Theoretical models and comparisons with experiments, J ournal ofFluid Mechanics, 5 4 (1972) 263-288. ) ( [23] R .W. W l ezien, J.L. W a y, Te c hniques for the experimental investigation of the near wake o fa circula r cylinder,AIAA Journal, 1 7(6)(1979) 563-570. ) ( [24] B . C antwell, D . Coles, A n e x perimental study of entrainment and transport in the turbulent n e ar wake of a circular cylinder, Journal ofFluid Mechanics, 1 3 6 (1983) 321-374. ) ( [25] A.E. Deane, I .G. Kevrekidis, G.E. Karniadakis , S.A . Orszaga , Low-dimensional models for complex geometry f lows:application to grooved Channels and circular cylinders, Physics ofFluids, 3(10)(1991) 2337-2354 ) ( [26] B .R. N oack, K. A fanasiev, M. Morzynski, G . T a dmor, F. Thiele, A h i erarchy of low-dimensional models for thetransient and post-transient cylinder Wake, Journal ofFluid Mechanics, 497 ( 2 003)335-363. ) ( [27] B.W. V an Oudheusden, F. S c arano, N . P. V a n Hinsberg, D . W. Wa t t, Phase-resolved characterization of vortexshedding in t he near wake ofa square-section cylinder at incidence, Experiments in Fluids, 39 (2005)86-98. ) ( [28] V . Durgesh, Experimental study ofnear wa k e dynamics associated with blu f f body bas e drag reduction, Ph.D.Dissertation,Dept.of Mechanical Engg., Un i versity of Wyoming, Lar a mie, WY, U SA, 2008. ) ( [29] R . E l-Akoury, M. B r aza, R. Perrin, G.Harran, Y. H oarau, Thre e -dimensional trans i tion in the f low aroundrotating cylinder, Journal ofFluid Mechanics, 6 0 7 (2008) 1- 1 1. )
确定
还剩12页未读,是否继续阅读?

产品配置单


北京欧兰科技发展有限公司为您提供《钝后缘刨面物体中近涡结构雷诺数相关性检测方案(粒子图像测速)》,该方案主要用于其他中近涡结构雷诺数相关性检测,参考标准--,《钝后缘刨面物体中近涡结构雷诺数相关性检测方案(粒子图像测速)》用到的仪器有德国LaVision PIV/PLIF粒子成像测速场仪、PLIF平面激光诱导荧光火焰燃烧检测系统
推荐专场


相关方案
更多
该厂商其他方案
更多