


方案详情
文
高磷摄入量和肠道相关参数 - 一项随机安慰剂对照的人体干预研究的结果High phosphorus intake and gut-related parameters – results of a randomized placebo-controlled human intervention study
方案详情

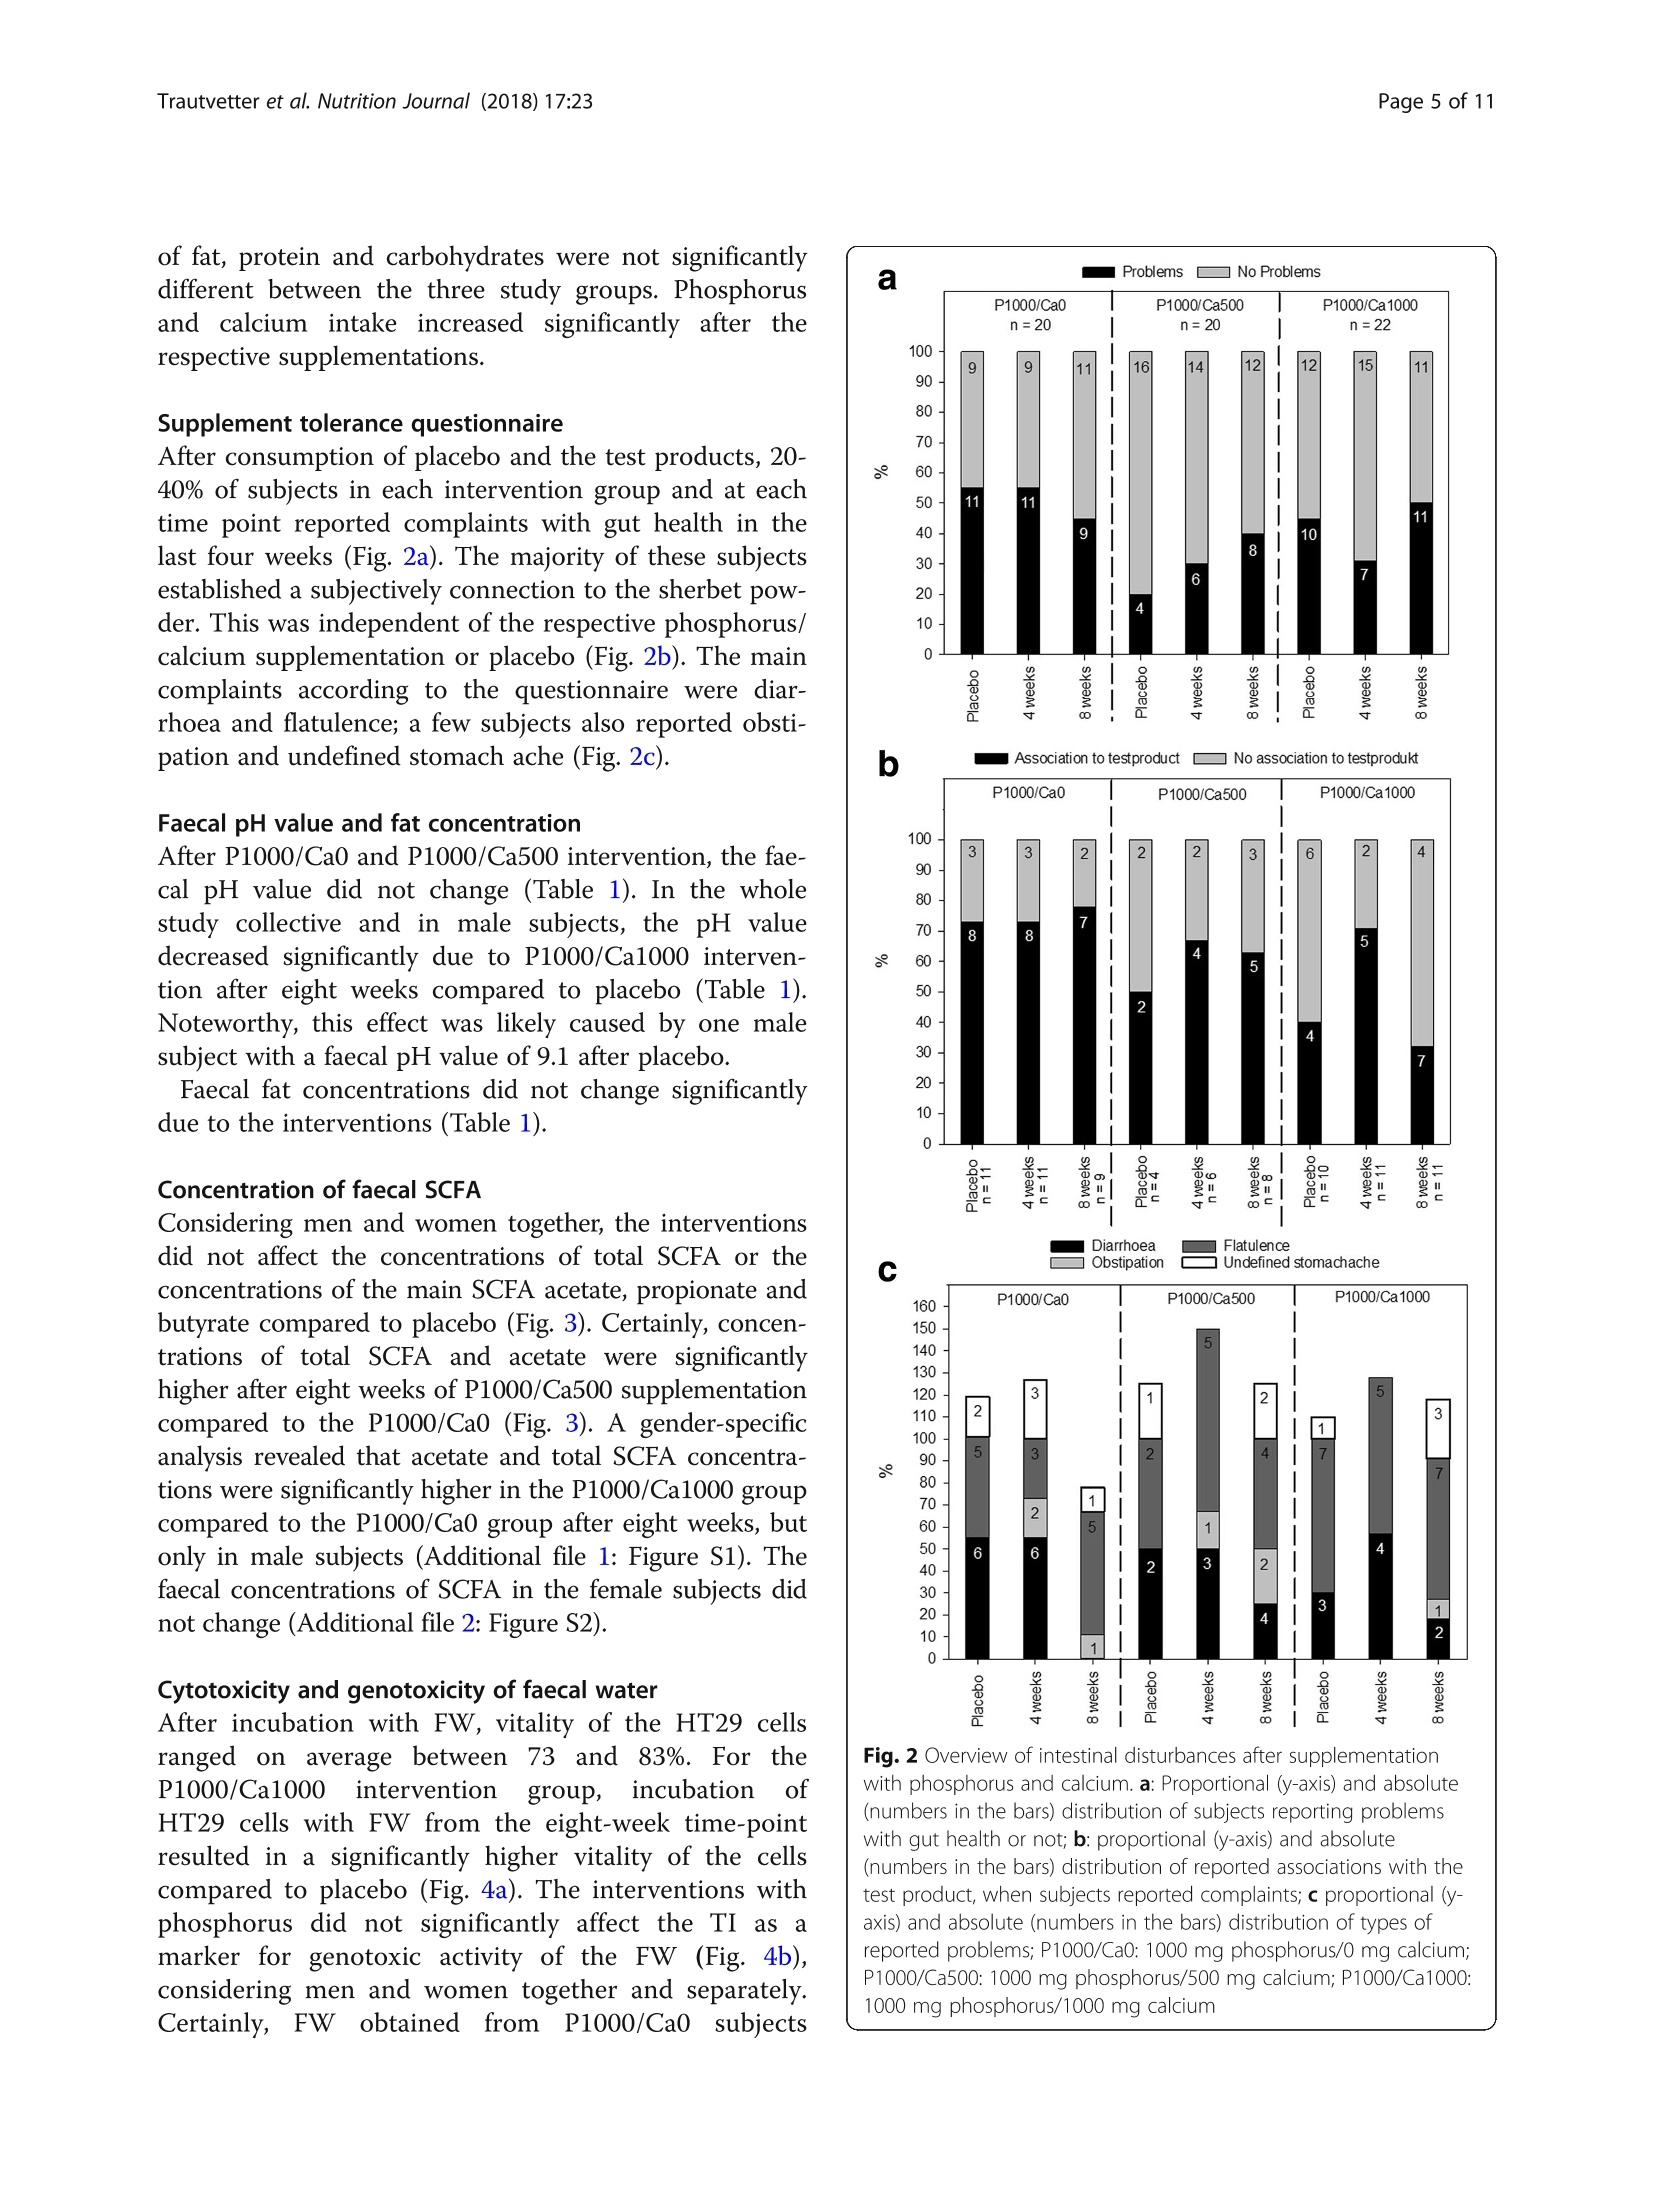
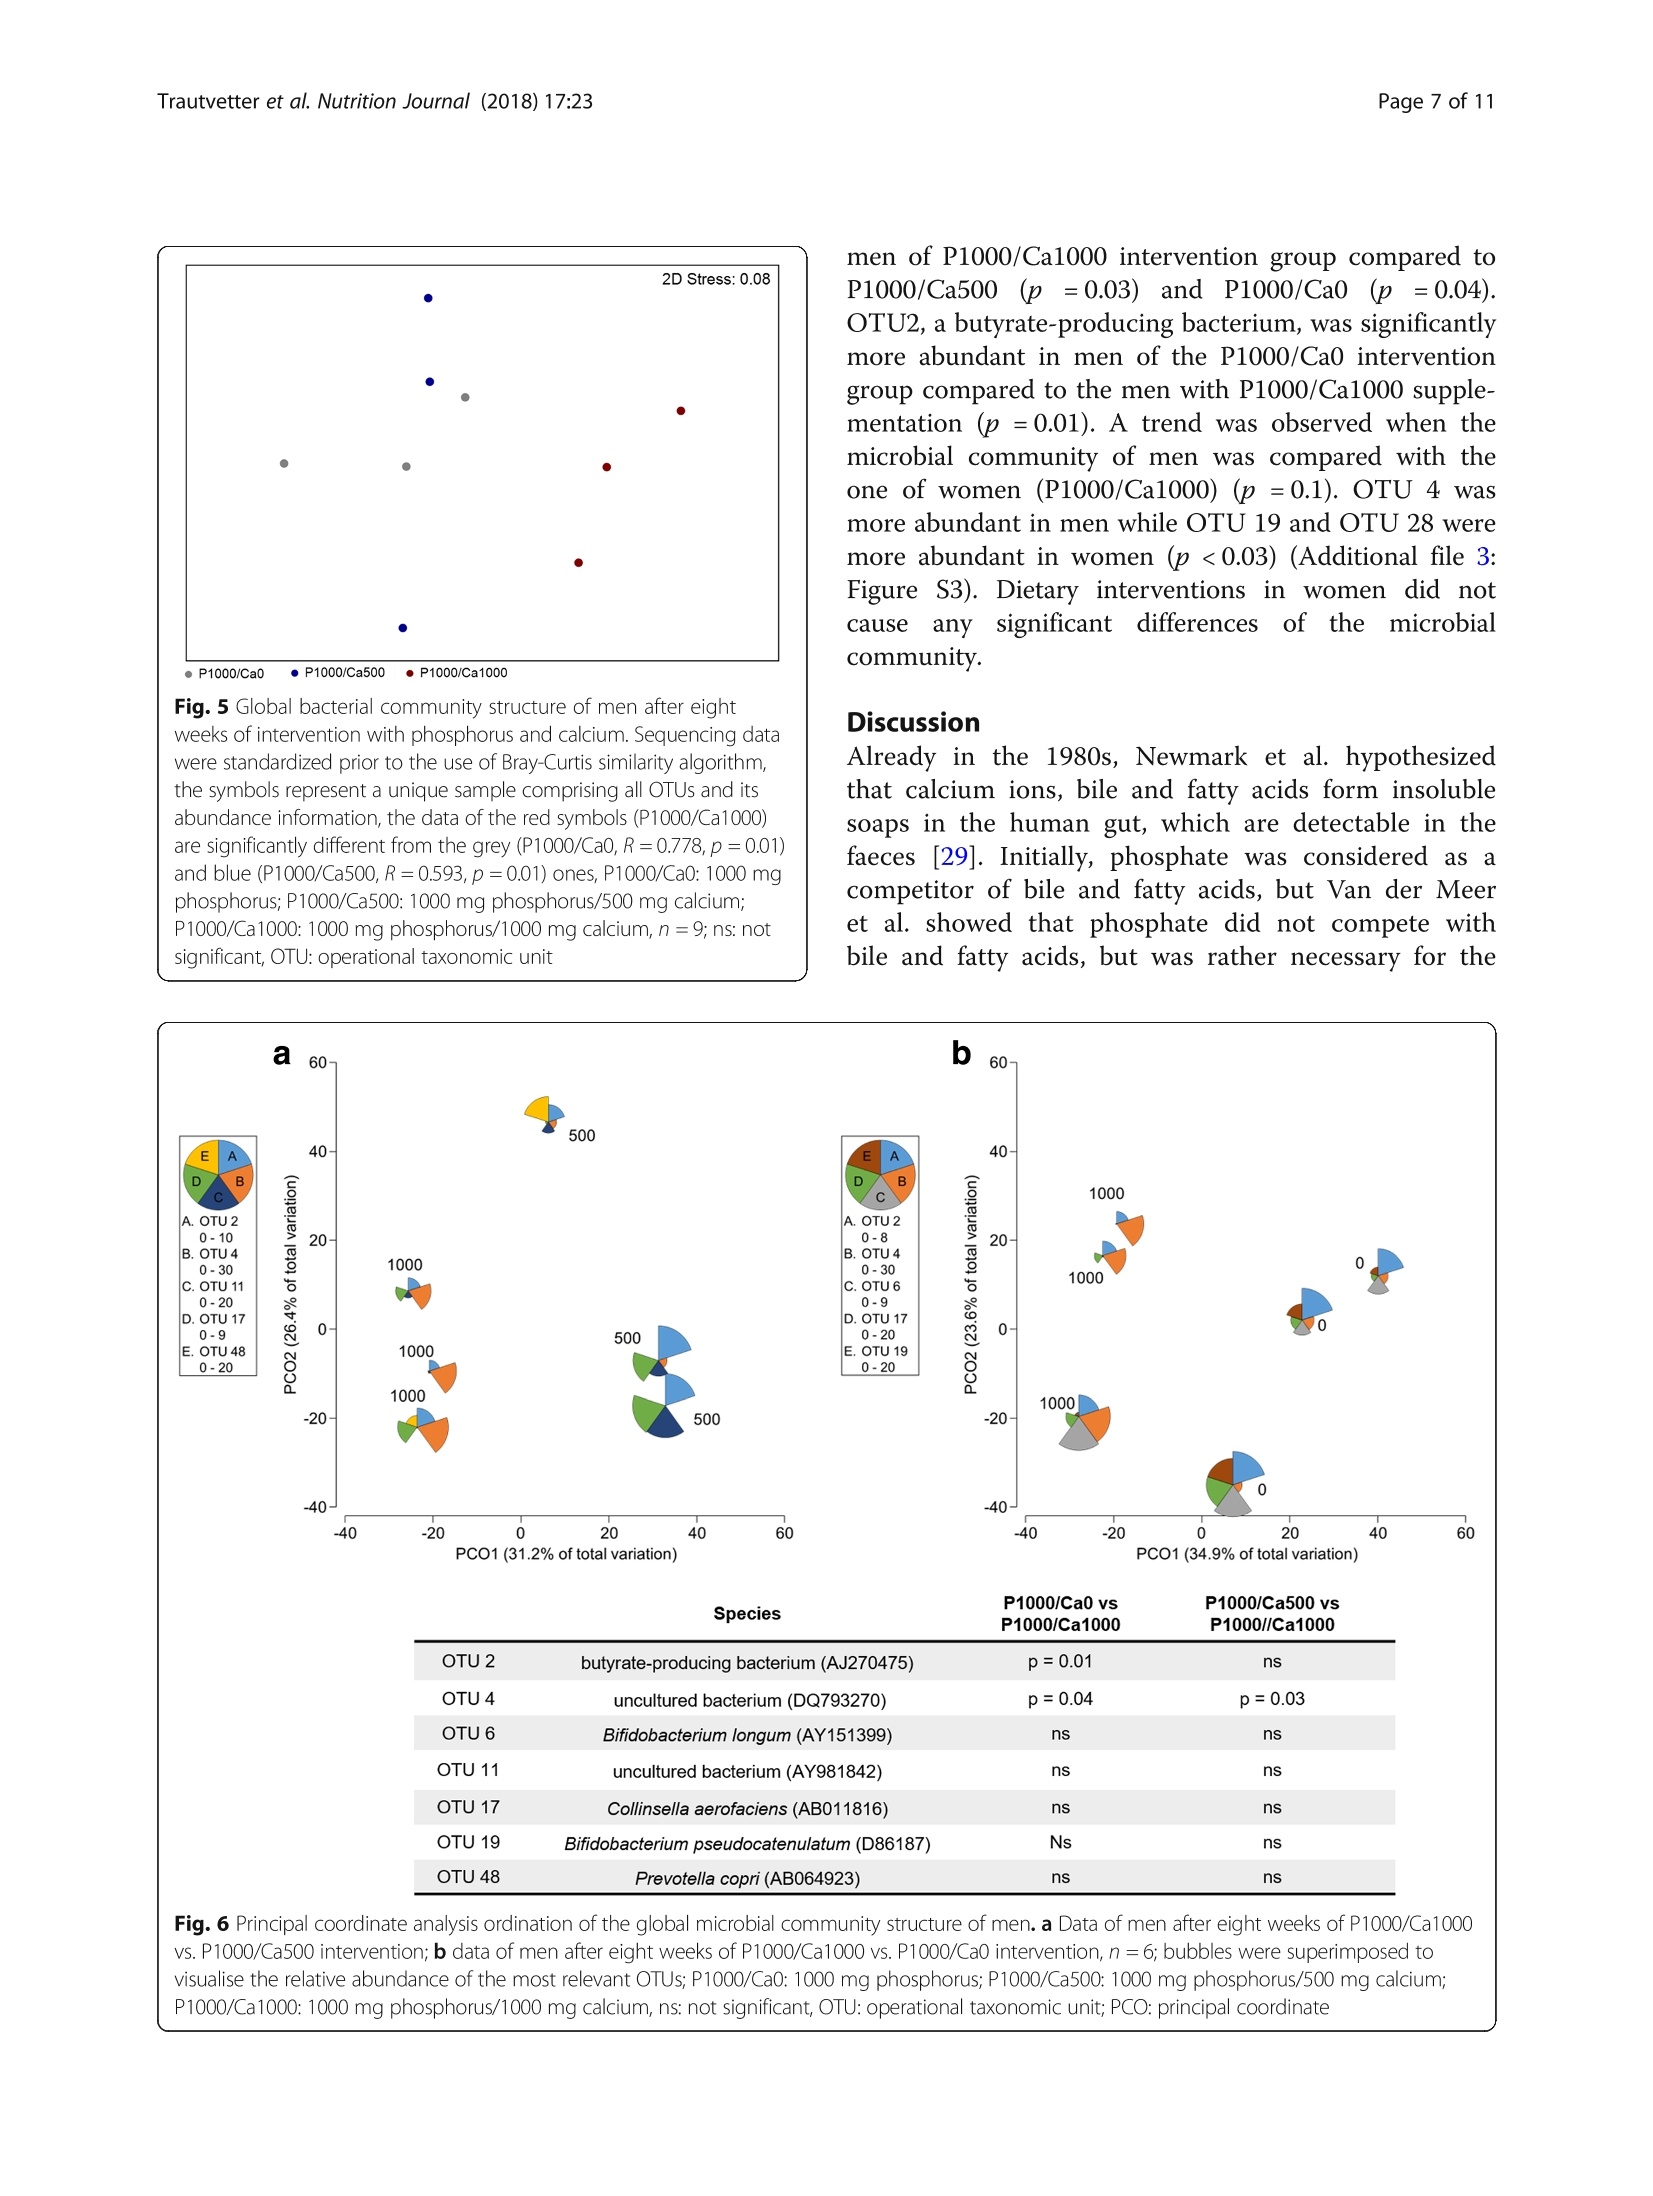
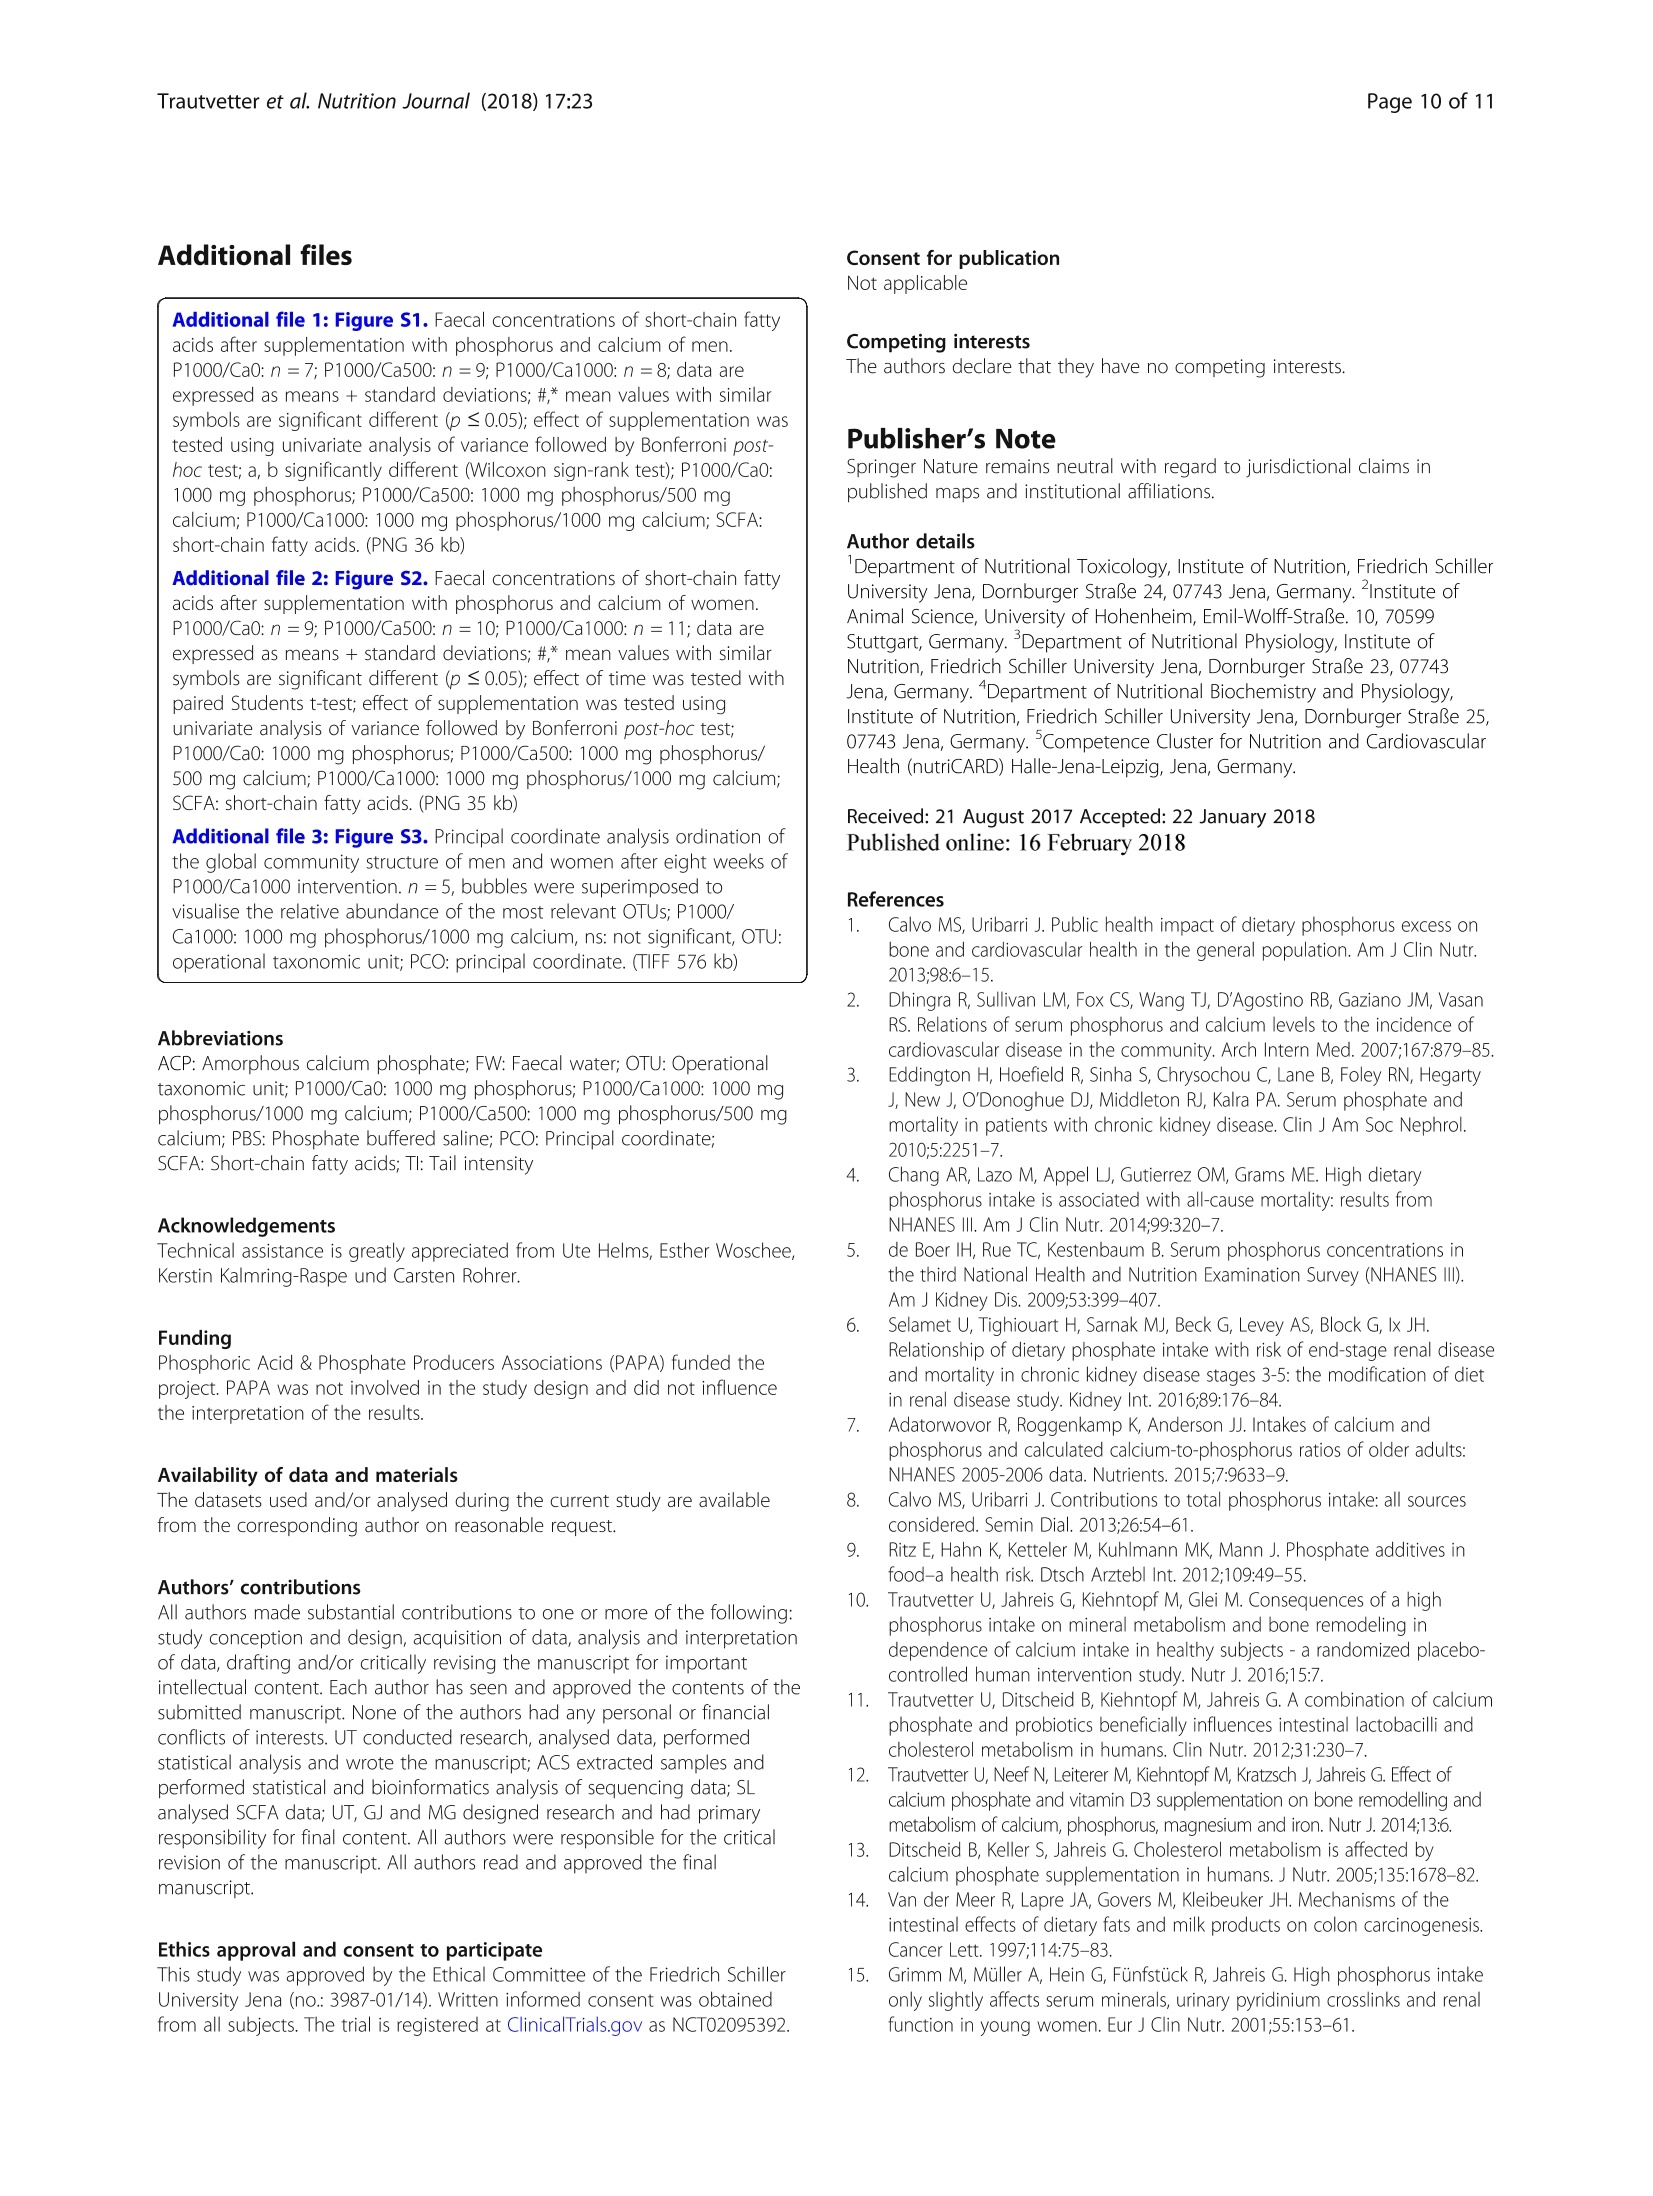
高磷摄入量和肠道相关参数 - 一项随机安慰剂对照的人体干预研究的结果High phosphorus intake and gut-related parameters – results of a randomized placebo-controlled human intervention studyTrautvetter et al. Nutrition Journal (2018) 17:23NutritionjournalDOI 10.1186/s12937-018-0331-4高磷摄入量和肠道相关参数 -一项随机安慰剂对照的人体干预研究的结果 Trautvetter et al. Nutrition Journal (2018) 17:23Page 2 of 11 Open Access High phosphorus intake and gut-related parameters – results of a randomized placebo-controlled human intervention study Ulrike Trautvetter1* , Amélia Camarinha-Silva2, Gerhard Jahreis3,5, Stefan Lorkowski4,5 and Michael Glei1,5 * Correspondence: Ulrike.Trautvetter@uni-jena.de 1Department of Nutritional Toxicology, Institute of Nutrition, Friedrich Schiller University Jena, Dornburger Straße 24, 07743 Jena, Germany Full list of author information is available at the end of the article 耶拿大学弗里德里希·席勒营养研究所营养毒理学系 Background Dietaryphosphateandserum phosphateconcentra-tions of healthy people and patients with chronic kidneydiseasehavebeendiscussedcriticallyinthe last years, regarding bone, cardiovascular health and mortality [1–4]. Whereas associationsof phosphate concentrations in serum with cardiovascular diseases and mortality have been well established [2], it is still unclear whether dietary phosphorus influences serum phosphate concentrations [5, 6]. According to theNationalHealth andNutrition Exam-ination Survey of the USA, dietary phosphorus intake of Americansexceedsthedailyrecommended intakeof 700mg phosphorus for adults and the elderly [4, 7]. This is mainly a result of the increased consumption of food preparedortreatedwithphosphateadditives,which ranged from baked goods to cola beverages [8, 9]. In 2014, our department determined the influence of a high phosphorus intake in combination with different calcium supplies on phosphorus, calcium, magnesium and iron metabolism as well as fibroblast growth factor 23 in a human interventionstudy[10].In thisandinother intervention studies, increased concentrations of phos-phorus and calcium in the faeces after high calcium and phosphorus supplementation compared to placebo were found [10–13]. However, up to now, only a few studies dealt with the question, which effects are provoked by higher intestinal concentrations of calcium and phos-phorus in the human gut. It is known that calcium and phosphateform amorphouscalcium phosphatecom-plexes (ACP) in the small intestine. Intestinal substances and food ingredients, such as bile and fatty acids, can bind to ACP [13, 14]. This leads to several physiological changes in the human gut, e.g. amodulation of the com-position of faecal bile acids, faecal short-chain fatty acids (SCFA) and gut microbiota [11, 13]. Furthermore, high phosphorus intakes can lead to disturbances in the gut, like diarrhoea [15]. In the study presented here, we analysed faecal sam-ples from the subjects of the above-mentioned study [10]regardingcytotoxicityandgenotoxicityoffaecal water (FW), faecal concentrations of SCFA and fat as well as the composition of the gutmicrobiome (in a sub-group of study subjects). In addition, we examined the tolerabilityoftheusedphosphorussupplementwith respect to gut distress, such as diarrhoea or stomach ache, by questionnaire evaluation. Methods Supplements In the current study, two supplements were used:mono-sodium phosphate (NaH2PO4; cfb, Budenheim, Germany) and calcium carbonate (CaCO3; cfb, Buden-heim, Germany). In order to achieve a supplementation of additional 1000 mg phosphorus/d as well as add-itional 500 or 1000 mg calcium/d, monosodium phos-phate and calcium carbonate were mixed with sherbet powder. Sherbet powder without additional supplements served as placebo. Participants were encouraged to drink the sherbet powder twice a day diluted in 250 ml water and to document when the sherbet powder was not consumed. Detailed information has been published elsewhere [10]. Subjects and study design The study was conducted by the Institute ofNutrition of the Friedrich Schiller University Jena between March and July 2014. Sixty-six omnivorous healthy subjects (men, n = 33; women n = 33) participated in this double-blinded, placebo-controlled and parallel designed study. Eligibility criteria for participants were an age between 18 and 60yearsaswellas mentalandphysicalwell-being. Exclusion criteria were regular intake of dietary supple-ments,renaldiseases,pregnancy,nursingaswellas post-menopausal age. Renal diseases were determined with the Chronic Kidney Disease Epidemiology Collab-oration equation for estimating the glomerular filtration rate[16].Subjectswithbaselineglomerularfiltration rates of < 80ml/min/1.73m2 were excluded. The volunteers were provided with detailed informa-tion regarding purpose, course, and possible risks of the study. This study was conducted according to the guidelines laid down in the Declaration of Helsinki and all procedures involving human subjects were approved bytheEthicalCommitteeoftheFriedrichSchiller University Jena (no.3987-01/14). Writteninformed consent was obtained from all subjects. The trial is reg-istered at ClinicalTrials.gov as NCT02095392. Four participants dropped out because of illness and personal reasons. The remaining 62 volunteers (men, n = 30; women, n = 32) aged 29 ± 7 years and had a mean BMI of 24 ± 3 kg/m2. The details of the study design have been published pre-viously [10]. In short, 62 healthy subjects completed a double-blinded, placebo-controlled and parallel designed study. During the first two weeks, all groups consumed a placebo sherbet powder and afterwards, for eight weeks, a supplemented sherbet powder according to the interven-tion group: P1000/Ca0 (1000 mg/d phosphorus), P1000/Ca500 (1000 mg/d phosphorus and 500 mg/d calcium) and P1000/Ca1000 (1000mg/d phosphorus and 1000mg/d calcium). Dietary records, fasting blood samplings and urine collections took place (after placebo, four and eight weeks of supplementation). After two weeks of placebo and eight weeks of intervention subjects collected one fae-ces sample. Figure 1 shows the flow chart with the num-ber of subjects included and excluded on each analysis. Analysed faecal pH-value (n=16)·Excluded from analysis (not enoughsample)(n=4)Analysed faecal fat (n=19) ·Excluded from analysis (not enoughsample)(n=1)Analysed faecal SCFA (n=16)·Excluded from analysis (not enoughsample)(n=4)Analysed cytotoxizity FW (n=15)·Excluded from analysis (no FWsample)(n=5)Analysed genotoxity FW (n=10)·Excluded from analysis (no FWsample)(n=5) ·Excluded from analysis (vitality afterincubation <70%)(n=5)Analysed microbiome (subgroup n=5) Analysed faecal pH-value (n=18)·Excluded from analysis (not enoughsample)(n=2)Analysed faecal fat (n=20) Analysed faecal SCFA (n=19)·Excluded from analysis (not enoughsample)(n=1)Analysed cytotoxizity FW (n=19)·Excluded from analysis (no FW sample)(n=1) Analysed genotoxity FW (n=8)·Excluded from analysis (no FW sample)(n=1) ·Excluded from analysis (vitality afterincubation <70%)(n=11) Analysed microbiome (subgroup n=5) Analysed faecal pH-value (n=16) ·Excluded from analysis (not enough sample)(n=6)Analysed faecal fat (n=21) ·Excluded from analysis (not enough sample)(n=1) Analysed faecal SCFA (n=19) ·Excluded from analysis (not enough sample)(n=3) Analysed cytotoxizity FW (n=17) ·Excluded from analysis (no FW sample)(n=5) Analysed genotoxity FW (n=15) ·Excluded from analysis (no FW sample)(n=5) ·Excluded from analysis (vitality after incubation <70%)(n=2) Analysed microbiome (subgroup n=5) Supplement tolerance questionnaire After placebo as well as after four and eight weeks of supplementation, subjects were encouraged to fill out a questionnaire about diverse health aspects for the last weeks. One question aimed to assess complaints regarding gut health. The subjects should report, whethertheyhadproblems with diarrhoea,obstipa-tion,flatulenceorundefinedstomachache.Inthe caseofsuchproblems, thesubjectswereaskedto state,whethertheseproblems couldbeduetothe consumptionofthetestproducts(supplementedor non-supplemented powder). Faecal analysis At the evening before or at the morning of the blood sampling, the subjects were encouraged to collect one whole defecation in provided boxes and to store the sample in a cool dark place. The faecal samples were transportedtothestudycentre atthedayofthe blood sampling after placebo and eight weeks of intervention. Each specimen was weighed and homo-genised. Faecal pH value was measured using a glass pH electrode (InLab 420 electrode MP 225, Mettler Toledo GmbH, Giessen, Germany). Faeces samples were aliquoted for the respective analysis (faecal fat and FW preparation) and stored at − 20 °C until use. For SCFA analysis, 1 g fresh faeces were diluted with 2 ml distilledwater, mixedandstoredat − 20°C until use. Faecal fat Faecalfatwas measuredasether extractafter acid hydrolysis by conventional Soxhlet Extraction on a SOXTHERM 2000 automatic (C. Gerhardt, Königswinter, Germany) [13]. Short-chain fatty acids in faeces SCFAanalysiswasperformedaspublishedby[17]. Briefly, faeces-water mixtures were thawed and thoroughly mixed. After centrifugation (6000 x g,15 min), 500 p l of the supernatant were added with 50 p l i -caproic acid (internal standard), mixed and cen-trifuged (6000 x g, 15 min). For gas chromatographic measurements, 1 p l of the solution was used (Shimadzu model GC 17A, Shimadzu, Kyoto, Japan). Faecal water preparation Fresh faeces samples were homogenised and diluted 1:1with phosphate buffered saline (PBS) according to Klinder et al. [18]. Afterwards the faeces-PBS mixture was centrifuged for 4 h at 51500 x g at 4 °C. The super-natant (FW) was aliquoted and stored at − 80 °C. Cell culture and cytotoxicity of faecal water In the present analysis, the human colorectal adenocar-cinoma cell line HT29 (American Type Culture Collec-tion no. HTB-38, Rockville, MD, USA) was used for in vitro experiments. The specific properties and cell cul-tureconditionshavebeendescribedpreviously[19]. Briefly, cells were grown in Dulbecco ’s modified eagle medium (DMEM, Biochrom, Berlin, Germany), which was supplemented with 10% (v /v) fetal bovine serum (FBS Superior, Biochrom, Berlin, Germany) and 1% (v/v) antibiotics (penicillin/streptomycin, Biochrom, Berlin, Germany). Within about 24 h the cells doubled their number under given laboratory conditions. In the experiments, passages 10-15 were used. To exclude con-tamination with mycoplasma, a mycoplasma test (MycoAlert Detection Kit, Lonza, Cologne, Germany) was performed [20]. To determine the cellular vitality after FW incubation, the trypan blue exclusion test, which is based on changes in membrane integrity of the treated cells, was used [21]. For this, the harvested HT29 cell suspension was incubated with trypan blue (Trypan Blue Solution, Sigma Aldrich, Steinheim, Germany) in a 1:1 dilution, followed by automatically counting of viable and dead cells using the ViCell XR (Beckman Coulter, Brea, CA, USA). Genotoxicity of faecal water Genotoxicity of FW was tested in HT29 cells as pro-posed by Oberreuther-Moschner et al. [22]. Briefly, cells were harvested and incubated with FW for 30 min at 37 °C. Single cell microgel electrophoresis (comet assay) was used to analyse genotoxic activity of FW. For this, cells were embedded intoagaroseon microscopical slides, lysed and subjected to electrophoresis [17, 23]. Each FW sample was analysed in triplicates. PBSas negative control and 75 u M H2O2 as positive control were included for each assay, in order to ensure the per-formance of the comet assay. Microscopic evaluation was performed using the Comet Assay IV image analysis system (Perceptive Instruments, Suffolk, UK). The extent of DNAmigration was determined for 60 spots per slide. The tail intensity (TI) was used as the marker for evalu-ation. The TI is defined as the proportion of tail fluores-cence intensity of total comet fluorescence intensity. DNA extraction and sequencing A total of 30 faecal samples (five of each intervention group, thereof three men and two women) were extracted with PowerSoil® DNA Isolation Kit (MO BIO, Carlsbad, CA, USA) following the manufacturer ’s proto-col. DNA was quantified using a NanoDrop 2000 spec-trophotometer (Thermo Scientific, Waltham,MA, USA) and stored at − 20 °C until further analysis. Illumina library preparation was performed according to Camarinha-Silva et al. [24] with a slightly modified se-quence of the primer 27F (AGRGTTHGATYMTGGCT-CAG). Amplicons were verified by agarose gel electrophoresis, purified and normalized using SequalPrepNormalization Kit (Invitrogen, Carlsbad, CA, USA). Samples were sequenced using 250 bp paired-end sequencing chemistry on an Illumina MiSeq platform. Raw reads were quality filtered, assembled and aligned using the Mothur pipeline [25]. A total of 36,915 ± 1233sequencing reads were obtained per sample. The UCHIME algorithm was used to find possible chimeras, and reads were clustered at 97% identity into 832 opera-tive taxonomic units (OTU). Only OTUs present on average abundance higher than 0.002% and a sequence length > 250 bp were considered for further analysis. The closest representative was manually identified with seq-match from the Ribosomal Database Project classifier [26]. Sequences were submitted to the EuropeanNucleo-tide Archive under the accession number PRJEB2203. Statistics Data analysis was performed using the SPSS Statistics 21statistical softwarepackage (IBM, Chicago,IL,USA). Powercalculationfortheprimaryoutcome (plasma phosphateconcentration)ofthehumanintervention study was published elsewhere [10]. Variance homogen-eity and normal distribution were tested using the Levene and the Kolmogorov-Smirnov test, respectively. The effect of supplementation between groups was tested using univariate analysis of variance followed by Bonferroni post-hoc test. Effects of time and gender were tested with paired and unpaired Students t-test, respectively. Differences were considered significant at p ≤ 0.05. Values in the text and tables are means with standard deviations. The amplicon sequencing data set was standardised by total, and the community similarity structure was depicted through non-metric multidimensional scaling plots and Principal Coordinate Analysis by calculating the Bray-Curtis similarity matrix using PRIMER version 7.0.9 (PRIMER-E, Plymouth Marine Laboratory, Plymouth, UK) [27]. PERMANOVA routine, based on the pair-wise tests using a permutation method under a reduced model, was used to study the significant differ-ences and interactions between factors (diet, time point and gender). Similarity percentages analysis (SIMPER) identified the species contributiontothe Bray-Curtis similarity among samples within each diet [27]. Differ-ences in the abundance of OTUs of interest between diets were evaluated using the unpaired Welch ’s t-test that can handle unequal variances, unequal sample sizes and non-parametric data [28]. OTU abundances were considered significantly different for p < 0.05. Results Baseline characteristics of subjects who completed the study and nutrient intake (three-day dietary record) have been published elsewhere [10]. Briefly, age, BMI, serum 25-hydroxyvitamin D, kidney function as well as intake of fat, protein and carbohydrates were not significantly different between the three study groups. Phosphorus and calcium intake increased significantly after the respective supplementations. Supplement tolerance questionnaire After consumption of placebo and the test products, 20-40% of subjects in each intervention group and at each time point reported complaints with gut health in the last four weeks (Fig. 2a). The majority of these subjects established a subjectively connection to the sherbet pow-der. This was independent of the respective phosphorus/calcium supplementation or placebo (Fig. 2b). The main complaints according to the questionnaire were diar-rhoea and flatulence; a few subjects also reported obsti-pation and undefined stomach ache (Fig. 2c). Faecal pH value and fat concentration After P1000/Ca0 and P1000/Ca500 intervention, the fae-cal pH value did not change (Table 1). In the whole studycollectiveandin malesubjects,thepH value decreased significantly due to P1000/Ca1000 interven-tion after eight weeks compared to placebo (Table 1). Noteworthy, this effect was likely caused by one male subject with a faecal pH value of 9.1 after placebo. Faecal fat concentrations did not change significantly due to the interventions (Table 1). Concentration of faecal SCFA Considering men and women together, the interventions did not affect the concentrations of total SCFA or the concentrations of the main SCFA acetate, propionate and butyrate compared to placebo (Fig. 3). Certainly, concen-trationsoftotalSCFAandacetateweresignificantly higher after eight weeks of P1000/Ca500 supplementation compared to the P1000/Ca0 (Fig. 3). A gender-specific analysis revealed that acetate and total SCFA concentra-tions were significantly higher in the P1000/Ca1000 group compared to the P1000/Ca0 group after eight weeks, but only in male subjects (Additional file 1: Figure S1). The faecal concentrations of SCFA in the female subjects did not change (Additional file 2: Figure S2). Cytotoxicity and genotoxicity of faecal water After incubation with FW, vitality of the HT29 cells ranged on average between 73 and 83%. For the P1000/Ca1000 intervention group, incubation of HT29 cells with FW from the eight-week time-point resulted in a significantly highervitality of the cells compared to placebo (Fig. 4a). The interventions with phosphorusdidnotsignificantlyaffectthe TIasa markerforgenotoxicactivityoftheFW (Fig.4b), considering men and women together and separately. Certainly, FW obtained from P1000/Ca0 subjects with gut health or not; b : proportional (y-axis) and absolute (numbers in the bars) distribution of reported associations with the test product, when subjects reported complaints; c proportional (y-axis) and absolute (numbers in the bars) distribution of types of reported problems; P1000/Ca0: 1000mg phosphorus/0mg calcium; P1000/Ca500: 1000mg phosphorus/500mg calcium; P1000/Ca1000:1000mg phosphorus/1000mg calcium Table 1 Faecal pH values and faecal fat concentrations after intervention with phosphorus and calcium Parameter P1000/Ca0 P1000/Ca500 P1000/Ca1000 Faecal pH value n 16 18 16 Placebo 6.7 ± 0.7 6.6 ± 0.5 7.0 ± 0.7 8 weeks 6.5 ± 0.5 6.3 ± 0.5 6.5* ± 0.6 Faecal fat [g/100 g fresh faeces] n 19 20 21 Placebo 5.9 ± 2.8 5.6 ± 3.2 4.1 ± 1.7 8 weeks 5.5 ± 3.1 5.6 ± 2.5 4.0 ± 2.3 Data are expressed asmean ± standard deviation P1000/Ca0 1000mg phosphorus/0mg calcium, P1000/Ca500 1000mg phosphorus/500mg calcium, P1000/Ca1000 1000mg phosphorus/1000mg calcium*significantly different to placebo (p ≤ 0.05); effect of time was tested with paired Students t-test showedsignificantlyhighergenotoxicactivitybefore the intervention compared to those from the P1000/Ca1000group(Fig.4b).Basedonourresultsthat PBS (negative control) caused no genotoxic damages (TI 7 ± 2%) and H2O2 caused strong genotoxic effects (TI 59 ± 15%), the FW matrix showed only moderate genotoxicity independent of the phosphorus and calcium interventions (mean TI for all subjects 25 ±13%). Fig. 3 Faecal concentrations of short-chain fatty acids after supplementation with phosphorus and calcium. P1000/Ca0: n =16; P1000/Ca500: n = 19; P1000/Ca1000: n = 19; data are expressed as means + standard deviations; #, * mean values with similar symbols are significantly different (p ≤ 0.05); effect of supplementation was tested using univariate analysis of variance followed by Bonferroni post-hoc test; P1000/Ca0: 1000 mg phosphorus; P1000/Ca500: 1000 mg phosphorus/500 mg calcium; P1000/Ca1000: 1000 mg phosphorus/1000 mg calcium; SCFA:short-chain fatty acids Fig. 4 Cell vitality (a ) and tail intensity (b ) of HT29 cells. a P1000/Ca0:n = 15; P1000/Ca500: n = 19; P1000/Ca1000: n = 17; b P1000/Ca0:n = 10; P1000/Ca500: n = 8; P1000/Ca1000: n = 15; cell vitality and tail intensity after treatment of HT29 cells with faecal water collected following supplementation with phosphorus and calcium; data are expressed asmeans + standard deviations; #, *mean values with similar symbols are significantly different (p ≤ 0.05); effect of time was tested with paired Students t-test, effect of supplementation was tested using univariate analysis of variance followed by Bonferroni post-hoc test; P1000/Ca0: 1000mg phosphorus; P1000/Ca500: 1000mg phosphorus/500mg calcium; P1000/Ca1000: 1000mg phosphorus/1000mg calcium; PBS: phosphate buffered saline Microbial composition in faeces Considering all subjects of the study subgroups (n = 5for each intervention), no differences of the microbiome were observed between placebo and eight weeks of inter-vention as well as between the different intervention groups after eight weeks. Interestingly, men of the P1000/Ca1000 intervention had a significantly different gut microbial community compared to the men of the P1000/Ca0 (R = 0.778, p = 0.01) and the P1000/Ca500groups (R = 0.593, p = 0.01) (Fig. 5). Abundance of the genus Acetivibio andofthefamily Coriobacteriaceae weresignificantlylower in men after eight weeks of P1000/Ca500interventionwhencomparedtoP1000/Ca0 intervention (p < 0.05). Clostridium XVIII was sig-nificantly more abundant in men of the P1000/Ca1000interventiongroupcomparedto men oftheP1000/Ca500 (p = 0.04) and P1000/Ca0 (p = 0.04) groups. The OTUs belonging to Bifidobacterium genus were signifi-cantly less abundant in faeces of men of the P1000/Ca1000 intervention compared to the faeces of men of the P1000/Ca500 group (p = 0.04). Figure 6 shows the relativeabundanceofthe OTUs contributingtothe group separation of the men per intervention after eight weeks. OTU4, an uncultured bacterium related to Clos-tridium XVIII, was significantly more abundant in the ·P 1000/Ca0 ·P1000/Ca500·P1000/Ca1000 Fig. 5 Global bacterial community structure ofmen after eight weeks of intervention with phosphorus and calcium. Sequencing data were standardized prior to the use of Bray-Curtis similarity algorithm, the symbols represent a unique sample comprising all OTUs and its abundance information, the data of the red symbols (P1000/Ca1000) are significantly different fromthe grey (P1000/Ca0, R = 0.778, p = 0.01) and blue (P1000/Ca500, R = 0.593, p = 0.01) ones, P1000/Ca0: 1000mg phosphorus; P1000/Ca500: 1000mg phosphorus/500mg calcium; P1000/Ca1000: 1000mg phosphorus/1000mg calcium, n = 9; ns: not significant, OTU: operational taxonomic unit men of P1000/Ca1000 intervention group compared to P1000/Ca500 (p = 0.03) and P1000/Ca0 (p = 0.04). OTU2, a butyrate-producing bacterium, was significantly more abundant in men of the P1000/Ca0 intervention group compared to the men with P1000/Ca1000 supple-mentation (p = 0.01). A trend was observed when the microbial community of men was compared with the one of women (P1000/Ca1000) (p = 0.1). OTU 4 was more abundant inmen whileOTU 19 andOTU 28 were more abundant in women (p < 0.03) (Additional file 3:FigureS3).Dietaryinterventionsinwomen didnot cause any significant differences of the microbial community. Discussion Alreadyinthe1980s, Newmark etal.hypothesized that calcium ions, bile and fatty acids form insoluble soaps in the human gut, which are detectable in the faeces [29].Initially,phosphate was consideredas a competitor of bile and fatty acids, but Van der Meer et al. showed that phosphate did notcompete with bile and fatty acids, but was rather necessary for the precipitation with calcium [30]. At a molar calcium-to-phosphate ratio of 3:2 and a pH value of 5.6, one partoftheingesteddietarycalcium andphosphate precipitates as ACP in the small intestine [31]. ACP areabletoprecipitatebothglycine-conjugatedand free bile acids by ionic absorption of their negatively charged carboxyl group to the positively charged cal-cium ions on the surface of the ACP [31]. The hydro-phobic tail of the bile acid is exposed to the aqueous phase, which in turn leads to the formation of hydro-phobic aggregates. These aggregates are able to bind otherhydrophobicligands[31].Thisandthefacts that calcium from milk and fermented milk products increasestheresistanceofratstosalmonellainfec-tions [32] and stimulates intestinal lactobacilli colon-isation [33], leads to the assumption that dietary calcium and phosphorus can beneficially modify the intestinal environment. Our human intervention study showed that the faecal concentrations of phosphorus and calcium increased sig-nificantly after eight weeks of phosphorus and calcium supplementation [10]. This increase could be due to the formation of ACP. However, even in the group supple-mented only with phosphorus indications for ACP formation were observed. We found increasing concen-trations of faecal phosphorus without increasing calcium concentrations, but decreasing renal calcium excretion [10]. These results led to the assumption that dietary calcium partly precipitates with phosphate to ACP and cannot be absorbed in the gut. In order to maintain calcium homeostasis of the body, fewer calcium was excreted via urine. Formation of ACP is a well-knownprocessin the human gut [12, 13, 28], and could be a prerequisite for a beneficial modulation of gut health. A decrease of the available intestinal bile acids by precipitation with ACP canleadtoa modified microbiotacompositionand accordingly to a change in SCFA production and com-position [34, 35]. The faecal SCFA concentrations of our subjects showed no effect over time (placebo vs. eight weeks of each intervention). But, after eight weeks, the P1000/Ca0 group showed the lowest concentrations of total SCFA (55 ± 18 u mol/g faeces) compared to P1000/Ca500(76 ± 22u mol/gfaeces,p ≤ 0.05)andP1000/Ca1000 (73 ± 31 u mol/g faeces, p = 0.081). This higher concentrationoftotalSCFAinthecalcium supple-mented groups is likely due to a higher acetate concen-tration. Furthermore, men showed significantly higher total SCFA and acetate concentrations after eight weeks of P1000/Ca1000 intervention compared to the P1000/Ca0 one. These effects are independent of the water content of the faeces, since faecal dry matter did not change due to the interventions (data not shown). In a study of Ditscheid, total SCFA (p = 0.065) and acetate concentrations (p = 0.019) increased after supplementa-tion with calcium phosphate (β -tricalciumphosphate) compared to placebo [36]. The author assumed that ei-ther an increased production or a decreased absorption of acetate could be the reason for the higher faecal con-centrationsaftercalcium phosphatesupplementation . Trinidad et al. showed that bioavailable calcium supports intestinal acetate absorption [37]. Therefore, Ditscheid hypothesizedthat bioavailabilityofcalcium decreased due to ACP formation and thus acetate absorption is di-minished [36]. But, calcium phosphate supplementation has been shown to modulate the intestinal gut commu-nity by changing the intestinal environment [11, 33]. This shift of the gut microbiota could lead to an in-creased production of SCFA, such as acetate [34]. In the present study, we determined in a subgroup of five subjects per intervention the microbial community in faeces by DNA extraction and amplicon sequencing. Interestingly, men of the P1000/Ca1000 group showed a shift of the microbial community compared to men of the two other intervention groups. Clostridium XVIII was significantly more abundant in men of the highest calcium group. Furthermore, men of the P1000/Ca1000intervention group had significantly higher acetate con-centrations compared to men of the P1000/Ca0 one. In general, Clostridium spp . are known to produce acetate by microbial fermentation of carbohydrates in the human gut[34].Although,thedetected Clostridium XVIII is an uncultured bacterium and not characterised so far, it could exhibit similar acetate producing proper-ties. Moreover, OTU2, a butyrate-producing bacterium, was significantly more abundant in men of the P1000/Ca0 intervention group and tended to bemore abundant in the P1000/Ca500 group compared to the men of the P1000/Ca1000 (p = 0.01) one. But whether these associa-tions depend on the calcium and phosphorus supple-mentation remains unclear, since we were only able to study the microbial community of a subgroup of five subjects perintervention.Thepartly gender-specific effects might be a result of sex-specific diet effects on the human microbiome as proposed by Bolnick et al.[38]. Animal and human studies showed, that gender influences microbialcompositioninthegut[38–41] and, thus, the formation of SCFA [42], too. A modulation of the cyto- and genotoxicity of the FW after calcium and phosphorus supplementation is dis-cussed since ACP are known to precipitate secondary bileacidsinthegut[29,43].Secondarybileacids showed cyto- and genotoxic effects on human normal and tumour colon cells [44–46]. Our results indicate that the phosphorus supplementation with and without calcium did not affect the genotoxicity of FW and did not markedly effect the vitality of HT29 cells. Similar results were provided by Ditscheid et al., which could not show changes in the genotoxicity of FW after cal-cium phosphate supplementation [47]. Glinghammer et al. reported that cytotoxicity of FW increased after sub-jects switched from a dairy product-rich (high calcium) to a dairy product-free diet (lower calcium), but geno-toxicity did not alter [48]. The authors suggested that the mechanism by which dairy products may act colon cancer protective are at the level of tumour promotion and indicated that dairy products, especially calcium and phosphate, exert protective effects by precipitating bile and fatty acids [48]. Gomes et al. summarised in a re-view that high calcium diets reduce FW cytotoxicity by precipitating cytotoxic surfactants, which results in a lower colonic epithelium damage and higher resistance against infections [49]. All studies cited in this context used a calcium phosphate supplement, but almost all are based on animal models. Furthermore, the cell model systems and methods used were different to the ones used here,e.g. cytotoxicity was testedwitherythro-cytes [43] instead of intestinal cells. Besides, maybe a more realistic picture of the FW genotoxicity would bedisplayedby a quantitative stoolsamplingover one or more days. Unfortunately, parameters in faeces were not the main outcome of our human interven-tion study and so only one stool sample was collected. Like the precipitation of bile acids, ACP are in principle able to precipitate fatty acids as well [49]. The resulting increased faecal excretion of fat could favour weight control [50]. Our study did not show changes in faecal fat concentrations in response to the phosphorus and calcium supplementation. Ditscheid et al. also reported no significant changes in faecal fat excretion after supplementation with β -tricalciumphosphate com-paredtoanormal calcium intake(approx.2200vs.1200 mg calcium/d and 2000 vs. 1600 mg phosphorus/d) [13]. In contrast, Boon et al. showed a non-significant 57% increase in faecal fat after high compared to low calcium intakes(2500vs400 mg calcium/d,low-fat dairy) [51]. Furthermore, in a study by Bendsen et al. faecal fat increased from 5.4 to 11.5 g/d after intake of 1600 mg calcium/d (bydairysupplementation)[52]. Another study comparing low (approx. 500 mg calcium/d) with high calcium diets (approx. 1800 mg calcium/d, low-fat dairy products) showed a 2.5-fold increase in fae-cal fat after the high calcium intake [53].One reason for the discrepancies could be the standardising of the diet and stool collection time. In the study presented here a dietary record for three days was done and one faecal sample was collected.However, the study of Ditscheid et al. included a standardised diet and a five-day faecal col-lection. But, nevertheless they also found no effect on faecal fat concentration. Possibly, this could be caused by the normal calcium intake that was used as placebo here (approx. 900 mg calcium/d) [10] and by Ditscheid et al. (approx. 1200 mg calcium/d) [13], whereas in the studies by Boon et al. (400 mg calcium/d) [51] and Jacobsen et al. (500 mg calcium/d) [53] low calcium diets were used as controls. It is therefore possible that the observed changes in faecal fat concentrations were caused by decreasing the intake of calcium in the con-trols to levels below the norm. In a phosphate supplementation study of Grimm et al., a phosphate-rich diet (additional 1436 mg phosphorus/d) was associated with intestinal distress, soft stool or mild diarrhoea. The authors concluded that the symp-toms are a consequence of an osmotic effect of the added polyphosphates in the intestinal lumen [15]. In our study 20-40% of the subjects in each intervention group and at each time point reported intestinal distur-bances. The majority of the subjects mentioned a connection to the test product. Analysis of the question-naires showed that the reported disturbances were independent of the phosphorus and calcium supplemen-tationandtime-pointofintervention.Therefore,we consider the gut problems as a result of the sherbet powder consumption in general and not as a result of the phosphorus and calcium supplementation. Another reason could be the focus of the subjects on the new diet component (sherbet powder) and a resulting overestimation of intestinal distress in case of gut prob-lems. Furthermore, the interpretation of the question-naires is limited, since the subjects reported only whether they had problems but not the frequency and intensity of disturbances. Themost important limitations of our study are (i) the restricted one portion faecal collection and (ii) the deter-mination of gut community in a limited subgroup with only a few subjects. To the best of our knowledge, this is the first human intervention study in the field of high phosphorus and calcium intakes, which also paid attention on gut health. Asthe mainpartoftheadditionalphosphorusand calcium passes the whole gut via ACP and seems to modulategutphysiology,furtherhuman intervention studies in this context are needed. Conclusions In conclusion, the high phosphorus supplementation did not influence cyto- and genotoxicity of FW as well as the concentrations of faecal fat independent of calcium intake. Our study provides first hints for a potential phosphorus-induced modulation of the gut community andthefaecaltotalSCFAcontent.Sinceadditional dietary phosphorusand calcium passesthe gut as ACP, further studies are needed to evaluate the effect of high phosphorus and calcium diets on gut-related parameters. Additional files Additional file 1: Figure S1. Faecal concentrations of short-chain fatty acids after supplementation with phosphorus and calcium ofmen. P1000/Ca0: n = 7; P1000/Ca500: n = 9; P1000/Ca1000: n = 8; data are expressed asmeans + standard deviations; #,*mean values with similar symbols are significant different (p ≤ 0.05); effect of supplementation was tested using univariate analysis of variance followed by Bonferroni post-hoc test; a, b significantly different (Wilcoxon sign-rank test); P1000/Ca0:1000mg phosphorus; P1000/Ca500: 1000mg phosphorus/500mg calcium; P1000/Ca1000: 1000mg phosphorus/1000mg calcium; SCFA:short-chain fatty acids. (PNG 36 kb) Additional file 2: Figure S2. Faecal concentrations of short-chain fatty acids after supplementation with phosphorus and calcium of women. P1000/Ca0: n = 9; P1000/Ca500: n = 10; P1000/Ca1000: n = 11; data are expressed asmeans + standard deviations; #,*mean values with similar symbols are significant different (p ≤ 0.05); effect of time was tested with paired Students t-test; effect of supplementation was tested using univariate analysis of variance followed by Bonferroni post-hoc test; P1000/Ca0: 1000mg phosphorus; P1000/Ca500: 1000mg phosphorus/500mg calcium; P1000/Ca1000: 1000mg phosphorus/1000mg calcium; SCFA: short-chain fatty acids. (PNG 35 kb) Additional file 3: Figure S3. Principal coordinate analysis ordination of the global community structure ofmen and women after eight weeks of P1000/Ca1000 intervention. n = 5, bubbles were superimposed to visualise the relative abundance of themost relevant OTUs; P1000/Ca1000: 1000mg phosphorus/1000mg calcium, ns: not significant, OTU:operational taxonomic unit; PCO: principal coordinate. (TIFF 576 kb) Abbreviations ACP: Amorphous calcium phosphate; FW: Faecal water; OTU: Operational taxonomic unit; P1000/Ca0: 1000mg phosphorus; P1000/Ca1000: 1000mg phosphorus/1000mg calcium; P1000/Ca500: 1000mg phosphorus/500mg calcium; PBS: Phosphate buffered saline; PCO: Principal coordinate; SCFA: Short-chain fatty acids; TI: Tail intensity Acknowledgements Technical assistance is greatly appreciated from Ute Helms, EstherWoschee, Kerstin Kalmring-Raspe und Carsten Rohrer. Funding Phosphoric Acid & Phosphate Producers Associations (PAPA) funded the project. PAPA was not involved in the study design and did not influence the interpretation of the results. Availability of data andmaterials The datasets used and/or analysed during the current study are available from the corresponding author on reasonable request. Authors ’ contributions All authorsmade substantial contributions to one ormore of the following:study conception and design, acquisition of data, analysis and interpretation of data, drafting and/or critically revising themanuscript for important intellectual content. Each author has seen and approved the contents of the submittedmanuscript. None of the authors had any personal or financial conflicts of interests. UT conducted research, analysed data, performed statistical analysis and wrote themanuscript; ACS extracted samples and performed statistical and bioinformatics analysis of sequencing data; SL analysed SCFA data; UT, GJ andMG designed research and had primary responsibility for final content. All authors were responsible for the critical revision of themanuscript. All authors read and approved the final manuscript. Ethics approval and consent to participate This study was approved by the Ethical Committee of the Friedrich Schiller University Jena (no.: 3987-01/14).Written informed consent was obtained from all subjects. The trial is registered at ClinicalTrials.gov as NCT02095392. Consent for publication Not applicable Competing interests The authors declare that they have no competing interests. Publisher ’s Note Springer Nature remains neutral with regard to jurisdictional claims in publishedmaps and institutional affiliations. Author details 1Department of Nutritional Toxicology, Institute of Nutrition, Friedrich Schiller University Jena, Dornburger Straße 24, 07743 Jena, Germany. 2Institute of Animal Science, University of Hohenheim, Emil-Wolff-Straße. 10, 70599Stuttgart, Germany. 3Department of Nutritional Physiology, Institute of Nutrition, Friedrich Schiller University Jena, Dornburger Straße 23, 07743Jena, Germany. 4Department of Nutritional Biochemistry and Physiology, Institute of Nutrition, Friedrich Schiller University Jena, Dornburger Straße 25,07743 Jena, Germany. 5Competence Cluster for Nutrition and Cardiovascular Health (nutriCARD) Halle-Jena-Leipzig, Jena, Germany. Received: 21 August 2017 Accepted: 22 January 2018Published onl i ne : 16 February 2018 References 1. Calvo MS, Uribarri J. Public health impact of dietary phosphorus excess on bone and cardiovascular health in the general population. Am J Clin Nutr.2013;98:6–15. 2. Dhingra R, Sullivan LM, Fox CS,Wang TJ, D ’Agostino RB, Gaziano JM, Vasan RS. Relations of serum phosphorus and calcium levels to the incidence of cardiovascular disease in the community. Arch Intern Med. 2007;167:879–85. 3. Eddington H, Hoefield R, Sinha S, Chrysochou C, Lane B, Foley RN, Hegarty J, New J, O ’Donoghue DJ, Middleton RJ, Kalra PA. Serum phosphate and mortality in patients with chronic kidney disease. Clin J Am Soc Nephrol.2010;5:2251–7. 4. Chang AR, Lazo M, Appel LJ, Gutierrez OM, Grams ME. High dietary phosphorus intake is associated with all-causemortality: results from NHANES III. Am J Clin Nutr. 2014;99:320–7. 5. de Boer IH, Rue TC, Kestenbaum B. Serum phosphorus concentrations in the third National Health and Nutrition Examination Survey (NHANES III). Am J Kidney Dis. 2009;53:399–407. 6. Selamet U, Tighiouart H, Sarnak MJ, Beck G, Levey AS, Block G, Ix JH. Relationship of dietary phosphate intake with risk of end-stage renal disease andmortality in chronic kidney disease stages 3-5: themodification of diet in renal disease study. Kidney Int. 2016;89:176–84. 7. Adatorwovor R, Roggenkamp K, Anderson JJ. Intakes of calcium and phosphorus and calculated calcium-to-phosphorus ratios of older adults:NHANES 2005-2006 data. Nutrients. 2015;7:9633–9. 8. Calvo MS, Uribarri J. Contributions to total phosphorus intake: all sources considered. Semin Dial. 2013;26:54–61. 9. Ritz E, Hahn K, Ketteler M, Kuhlmann MK, Mann J. Phosphate additives in food –a health risk. Dtsch Arztebl Int. 2012;109:49–55. 10. Trautvetter U, Jahreis G, Kiehntopf M, Glei M. Consequences of a high phosphorus intake onmineralmetabolism and bone remodeling in dependence of calcium intake in healthy subjects - a randomized placebo-controlled human intervention study. Nutr J. 2016;15:7. 11. Trautvetter U, Ditscheid B, Kiehntopf M, Jahreis G. A combination of calcium phosphate and probiotics beneficially influences intestinal lactobacilli and cholesterolmetabolism in humans. Clin Nutr. 2012;31:230–7. 12. Trautvetter U, Neef N, Leiterer M, Kiehntopf M, Kratzsch J, Jahreis G. Effect of calciumphosphate and vitamin D3 supplementation on bone remodelling and metabolismof calcium, phosphorus,magnesiumand iron. Nutr J. 2014;13:6. 13. Ditscheid B, Keller S, Jahreis G. Cholesterolmetabolism is affected by calcium phosphate supplementation in humans. J Nutr. 2005;135:1678–82. 14. Van der Meer R, Lapre JA, Govers M, Kleibeuker JH. Mechanisms of the intestinal effects of dietary fats andmilk products on colon carcinogenesis. Cancer Lett. 1997;114:75–83. 15. GrimmM, Müller A, Hein G, Fünfstück R, Jahreis G. High phosphorus intake only slightly affects serumminerals, urinary pyridinium crosslinks and renal function in young women. Eur J Clin Nutr. 2001;55:153–61. 16. Matsushita K, Tonelli M, Lloyd A, Levey AS, Coresh J, Hemmelgarn BR. Clinical risk implications of the CKD Epidemiology Collaboration (CKD-EPI) equation compared with the Modification of Diet in Renal Disease (MDRD) study equation for estimated GFR. Am J Kidney Dis. 2012;60:241–9. 17. Roessler A, Forssten SD, Glei M, Ouwehand AC, Jahreis G. The effect of probiotics on faecalmicrobiota and genotoxic activity of faecal water in patients with atopic dermatitis: a randomized, placebo-controlled study. Clin Nutr. 2012;31:22–9. 18. Klinder A, Karlsson PC, Clune Y, Hughes R, Glei M, Rafter JJ, Rowland I, Collins JK, Pool-Zobel BL. Fecal water as a non-invasive biomarker in nutritional intervention: comparison of preparationmethods and refinement of different endpoints. Nutr Cancer. 2007;57:158–67. 19. Glei M, Kirmse A, Habermann N, Persin C, Pool-Zobel BL. Bread enriched with green coffee extract has chemoprotective and antigenotoxic activities in human cells. Nutr Cancer. 2006;56:182–92. 20. Munjal U, Scharlau D, Glei M. Gut fermentation products of inulin-type fructansmodulate the expression of xenobiotic-metabolising enzymes in human colonic tumour cells. Anticancer Res. 2012;32:5379–86. 21. Knoll N,Weise A, Claussen U, SendtW, Marian B, Glei M, Pool-Zobel BL. 2-Dodecylcyclobutanone, a radiolytic product of palmitic acid, is genotoxic in primary human colon cells and in cells from preneoplastic lesions. Mutat Res. 2006;594:10–9. 22. Oberreuther-Moschner DL, Jahreis G, Rechkemmer G, Pool-Zobel BL. Dietary intervention with the probiotics lactobacillus acidophilus 145 and Bifidobacterium longum 913modulates the potential of human faecal water to induce damage in HT29clone19A cells. Br J Nutr. 2004;91:925–32. 23. Glei M, Matuschek M, Steiner C, Böhm V, Persin C, Pool-Zobel BL. Initial in vitro toxicity testing of functional foods rich in catechins and anthocyanins in human cells. Toxicol in Vitro. 2003;17:723–9. 24. Camarinha-Silva A, Jauregui R, Chaves-Moreno D, Oxley AP, Schaumburg F, Becker K,Wos-Oxley ML, Pieper DH. Comparing the anterior nare bacterial community of two discrete human populations using Illumina amplicon sequencing. Environ Microbiol. 2014;16:2939–52. 25. Kozich JJ,Westcott SL, Baxter NT, Highlander SK, Schloss PD. Development of a dual-index sequencing strategy and curation pipeline for analyzing amplicon sequence data on the MiSeq Illumina sequencing platform. Appl Environ Microbiol. 2013;79:5112–20. 26. Wang Q, Garrity GM, Tiedje JM, Cole JR. Naive Bayesian classifier for rapid assignment of rRNA sequences into the new bacterial taxonomy. Appl Environ Microbiol. 2007;73:5261–7. 27. Clarke KR,Warwick RM: Change in Marine Communities: an approach to statistical analysis and Interpretation. Plymouthmarine laboratory, Natural environment research council; 1994. 28. Welch BL. The generalization of ‘Student ’s ’ problem when several different population variances are involved. Biometrika. 1947;34:28–35. 29. Newmark HL,Wargovich MJ, BruceWR. Colon cancer and dietary fat, phosphate, and calcium: a hypothesis. J Natl Cancer Inst. 1984;72:1323–5.30. Van der Meer R, Termont DS, De Vries HT. Differential effects of calciumions and calciumphosphate on cytotoxicity of bile acids. AmJ Phys. 1991;260:G142–7. 31. Govers MJAP, Termont DSML, Van der Meer R. Mechanism of the antiproliferative effect ofmilkmineral and other calcium supplements on colonic epithelium. Cancer Res. 1994;54:95–100. 32. Bovee-Oudenhoven I, Termont D, Dekker R, Van der Meer R. Calcium inmilk and fermentation by yoghurt bacteria increase the resistance of rats to salmonella infection. Gut. 1996;38:59–65. 33. Bovee-Oudenhoven IM,Wissink ML,Wouters JT, Van der Meer R. Dietary calcium phosphate stimulates intestinal lactobacilli and decreases the severity of a salmonella infection in rats. J Nutr. 1999;129:607–12. 34. Koh A, De Vadder F, Kovatcheva-Datchary P, Bäckhed F. From dietary fiber to host physiology: short-chain fatty acids as key bacterialmetabolites. Cell.2016;165:1332–45. 35. Bovee-Oudenhoven IM, Termont DS,Weerkamp AH, Faassen-Peters MA, Van der Meer R. Dietary calcium inhibits the intestinal colonization and translocation of salmonella in rats. Gastroenterology. 1997;113:550–7. 36. Ditscheid B: In vivo investigation into the physiologic effects of pentacalcium hydroxy-triphosphate supplementation in humans and in vitromodel for the adsorption of bile acids and neutral sterols to different calcium phosphates. Dissertation; 2006. 37. Trinidad TP,Wolever TM, Thompson LU. Effects of calcium concentration, acetate, and propionate on calcium absorption in the human distal colon. Nutrition. 1999;15:529–33. 38. Bolnick DI, Snowberg LK, Hirsch PE, Lauber CL, Org E, Parks B, Lusis AJ, Knight R, Caporaso JG, Svanbäck R. Individual diet has sex-dependent effects on vertebrate gutmicrobiota. Nat Commun. 2014;5:4500. 39. Org E, Mehrabian M, Parks BW, Shipkova P, Liu X, Drake TA, Lusis AJ. Sex differences and hormonal effects on gutmicrobiota composition inmice. Gut Microbes. 2016;7:313–22. 40. Neuman H, Debelius JW, Knight R, Koren O. Microbial endocrinology: the interplay between themicrobiota and the endocrine system. FEMS Microbiol Rev. 2015;39:509–21. 41. Most J, Goossens GH, Reijnders D, Canfora EE, Penders J, Blaak EE. Gut microbiota composition strongly correlates to peripheral insulin sensitivity in obesemen but not in women. Benefic Microbes. 2017;8:557–62. 42. Wong JMWRD, de Souza RRD, Kendall CWCP, Emam AM, Jenkins DJAMD. Colonic health: fermentation and short chain fatty acids. J Clin Gastroenterol. 2006;40:235–43. 43. Govers MJ, Termont DS, Lapre JA, Kleibeuker JH, Vonk RJ, Van der Meer R. Calcium inmilk products precipitates intestinal fatty acids and secondary bile acids and thus inhibits colonic cytotoxicity in humans. Cancer Res.1996;56:3270–5. 44. Rosignoli P, Fabiani R, De Bartolomeo A, Fuccelli R, Pelli MA, Morozzi G. Genotoxic effect of bile acids on human normal and tumour colon cells and protection by dietary antioxidants and butyrate. Eur J Nutr. 2008;47:301–9. 45. Tong JL, Ran ZH, Shen J, Fan GQ, Xiao SD. Association between fecal bile acids and colorectal cancer: ameta-analysis of observational studies. Yonsei Med J. 2008;49:792–803. 46. Powolny A, Xu J, Loo G. Deoxycholate induces DNA damage and apoptosis in human colon epithelial cells expressing eithermutant or wild-type p53. Int J Biochem Cell Biol. 2001;33:193–203. 47. Ditscheid B, Keller S, Jahreis G. Faecal steroid excretion in humans is affected by calcium supplementation and shows gender-specific differences. Eur J Nutr. 2009;48:22–30. 48. Glinghammar B, Venturi M, Rowland IR, Rafter JJ. Shift from a dairy product-rich to a dairy product-free diet: influence on cytotoxicity and genotoxicity of fecal water –potential risk factors for colon cancer. Am J Clin Nutr. 1997;66:1277–82. 49. Gomes JM, Costa JA, Alfenas RC. Could the beneficial effects of dietary calcium on obesity and diabetes control bemediated by changes in intestinalmicrobiota and integrity? Br J Nutr. 2015;114:1756–65. 50. Christensen R, Lorenzen JK, Svith CR, Bartels EM, Melanson EL, SarisWH, Tremblay A, Astrup A. Effect of calcium from dairy and dietary supplements on faecal fat excretion: ameta-analysis of randomized controlled trials. Obes Rev. 2009;10:475–86. 51. Boon N, Hul GBJ, Stegen JHCH, SluijsmansWEM, Valle C, Langin D, Viguerie N, SarisWHM. An intervention study of the effects of calcium intake on faecal fat excretion, energymetabolism and adipose tissuemRNA expression of lipid-metabolism related proteins. Int J Obes. 2007;31:1704–12. 52. Bendsen NT, Hother AL, Jensen SK, Lorenzen JK, Astrup A. Effect of dairy calcium on fecal fat excretion: a randomized crossover trial. Int J Obes. 2008;32:1816–24. 53. Jacobsen R, Lorenzen JK, Toubro S, Krog-Mikkelsen I, Astrup A. Effect of short-term high dietary calcium intake on 24-h energy expenditure, fat oxidation, and fecal fat excretion. Int J Obes. 2005;29:292–301. Submit your next manuscript to BioMed Central and we will help you at every step: • We accept pre-submission inquiries · Our selector tool helps you to find the most relevant journal · We provide round the clock customer support · Convenient online submission · Thorough peer review · Inclusion in PubMed and all major indexing services · Maximum visibility for your research Submit your manuscript at www.biomedcentral.com/submit
确定


还剩9页未读,是否继续阅读?

产品配置单


中国格哈特为您提供《62名健康受试者粪便中脂肪含量的检测》,该方案主要用于粪便中脂肪检测,参考标准--,《62名健康受试者粪便中脂肪含量的检测》用到的仪器有格哈特全自动超级总脂肪测定系统HT6+SOX416、格哈特快速干燥仪STL56、德国移液器MM


相关方案
更多