


方案详情
文
LED照明-通过光谱质量和强度改变小麦的生长、代谢、产量和面粉组成LED Lighting - Modification of Growth, Metabolism, Yield and Flour Composition in Wheat by Spectral Quality and Intensity
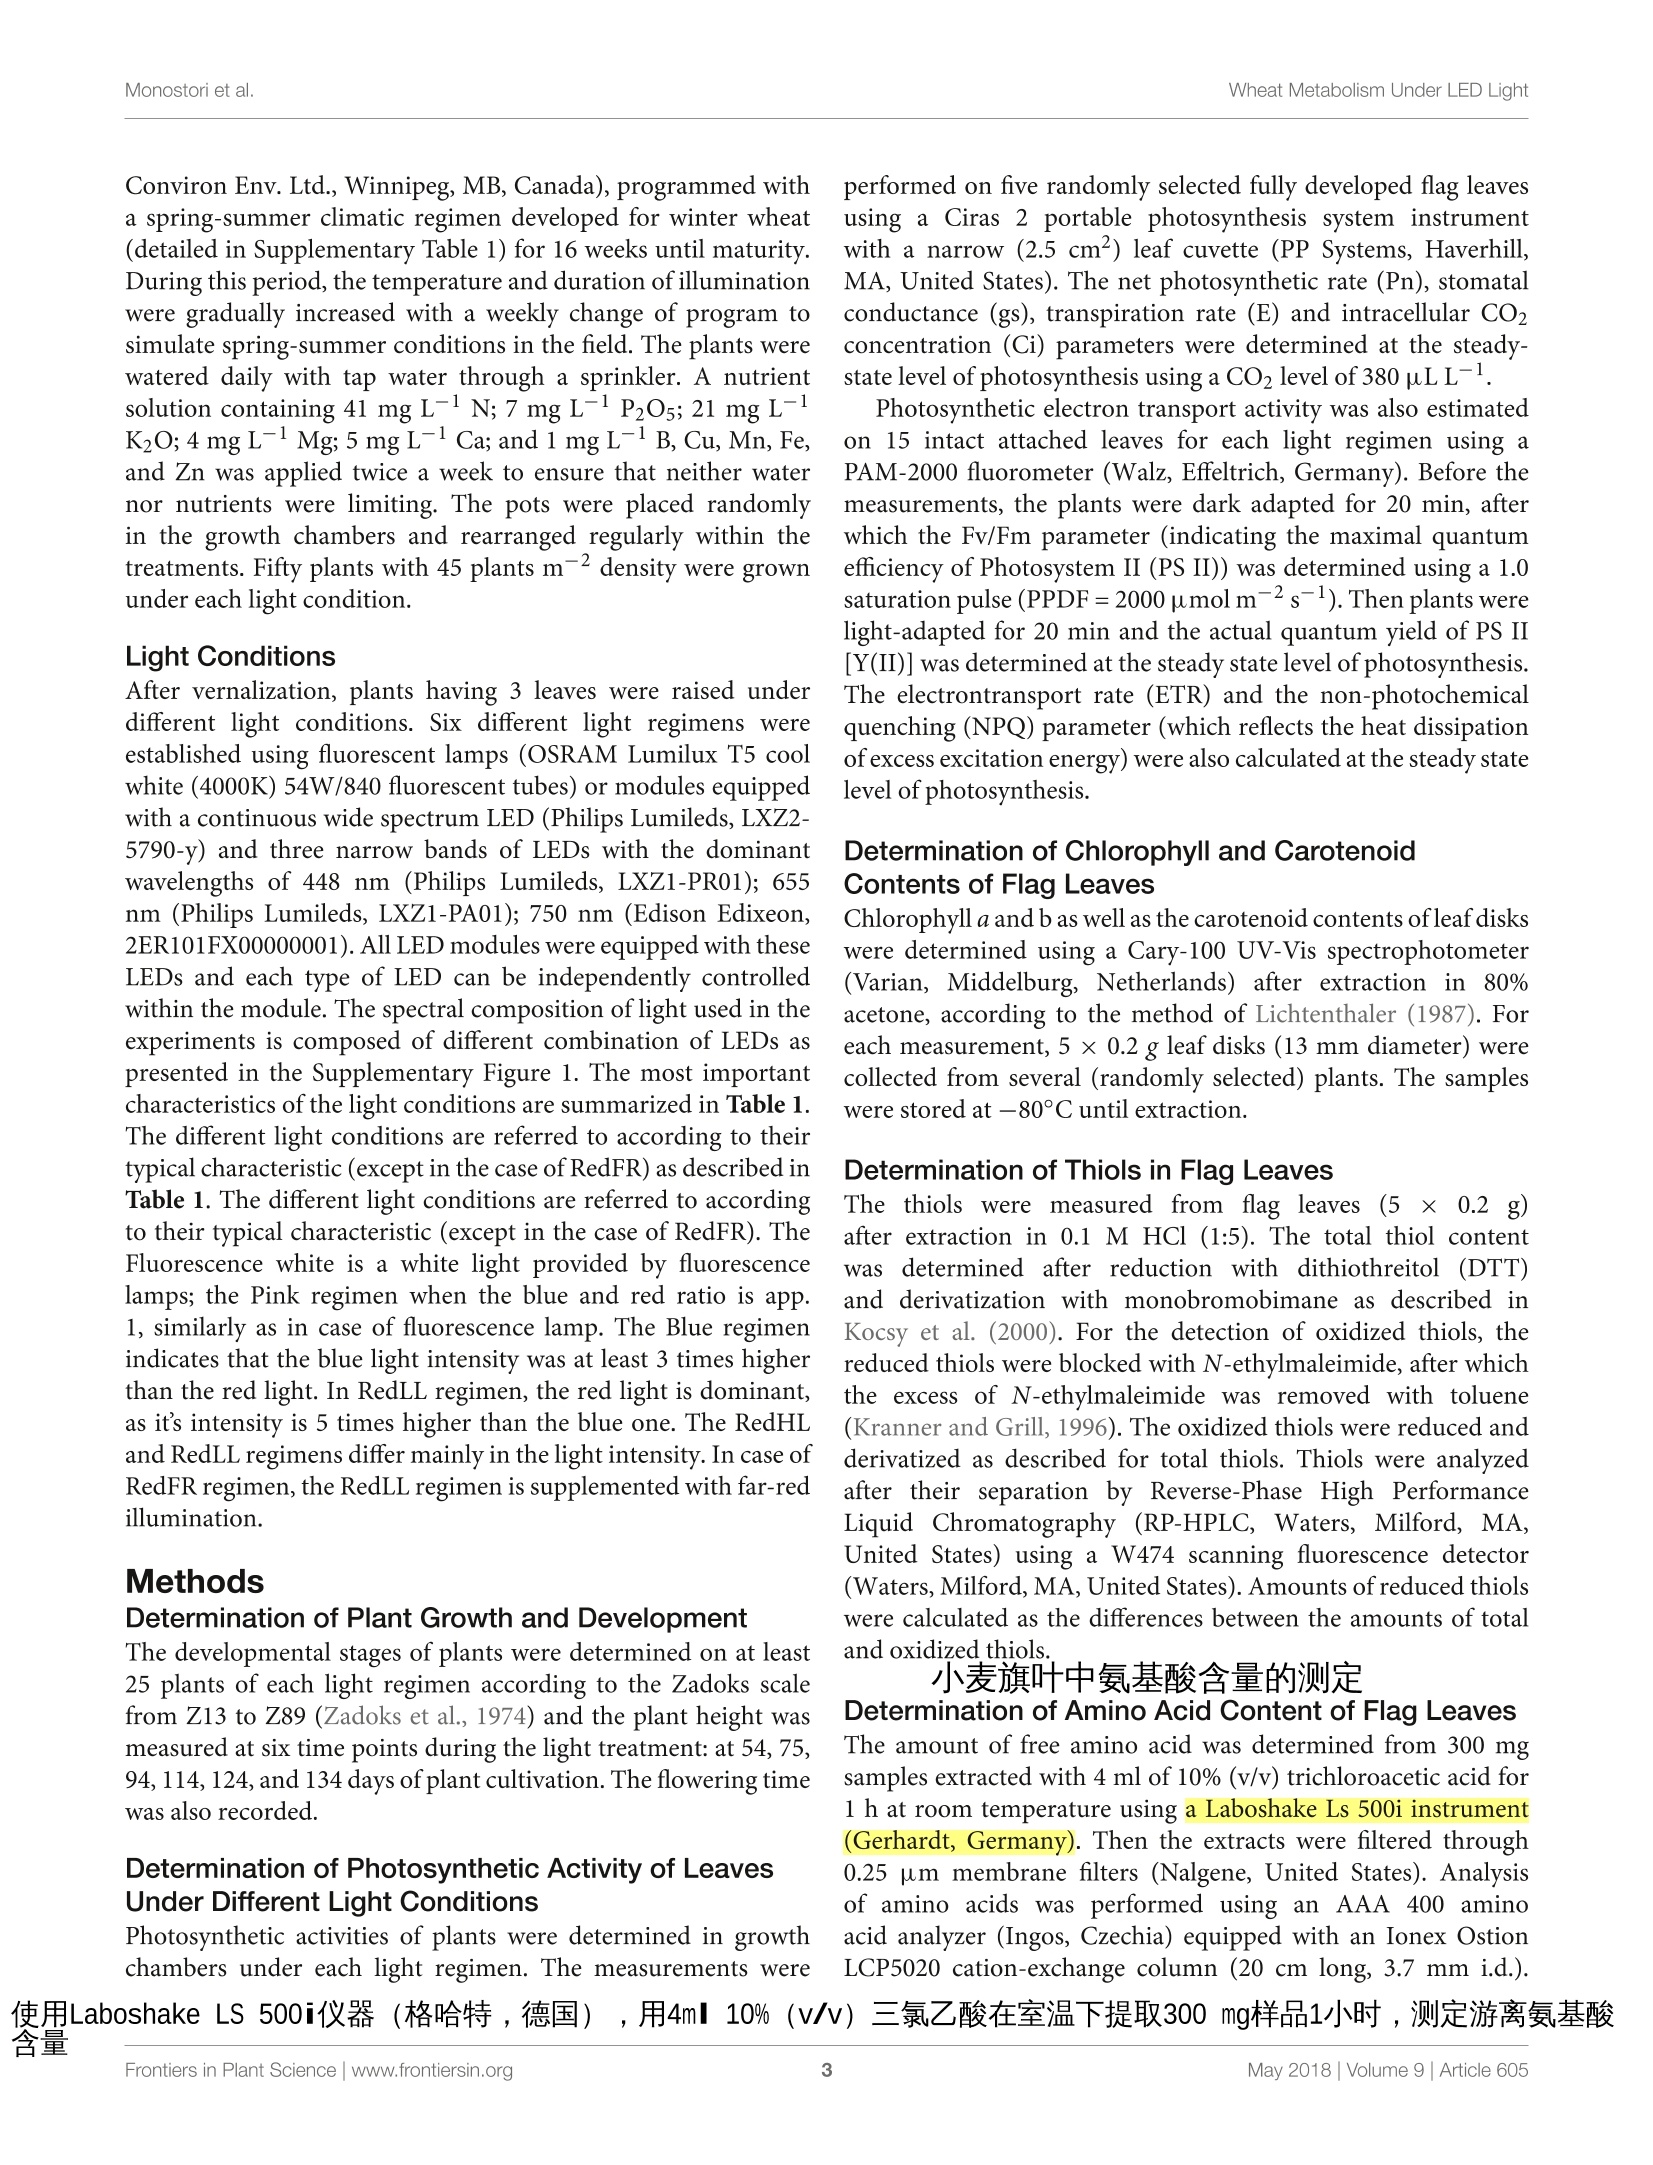
小麦旗叶中氨基酸含量的测定
Determination of Amino Acid Content of Flag Leaves:
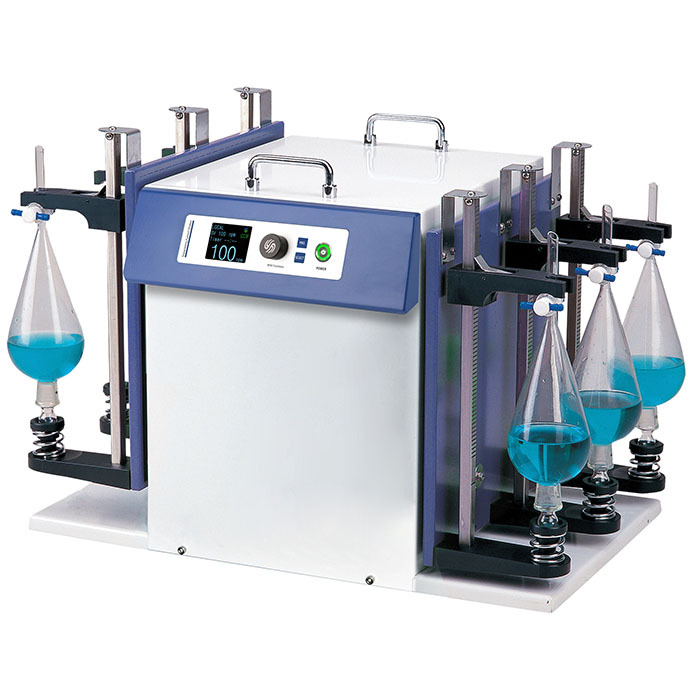
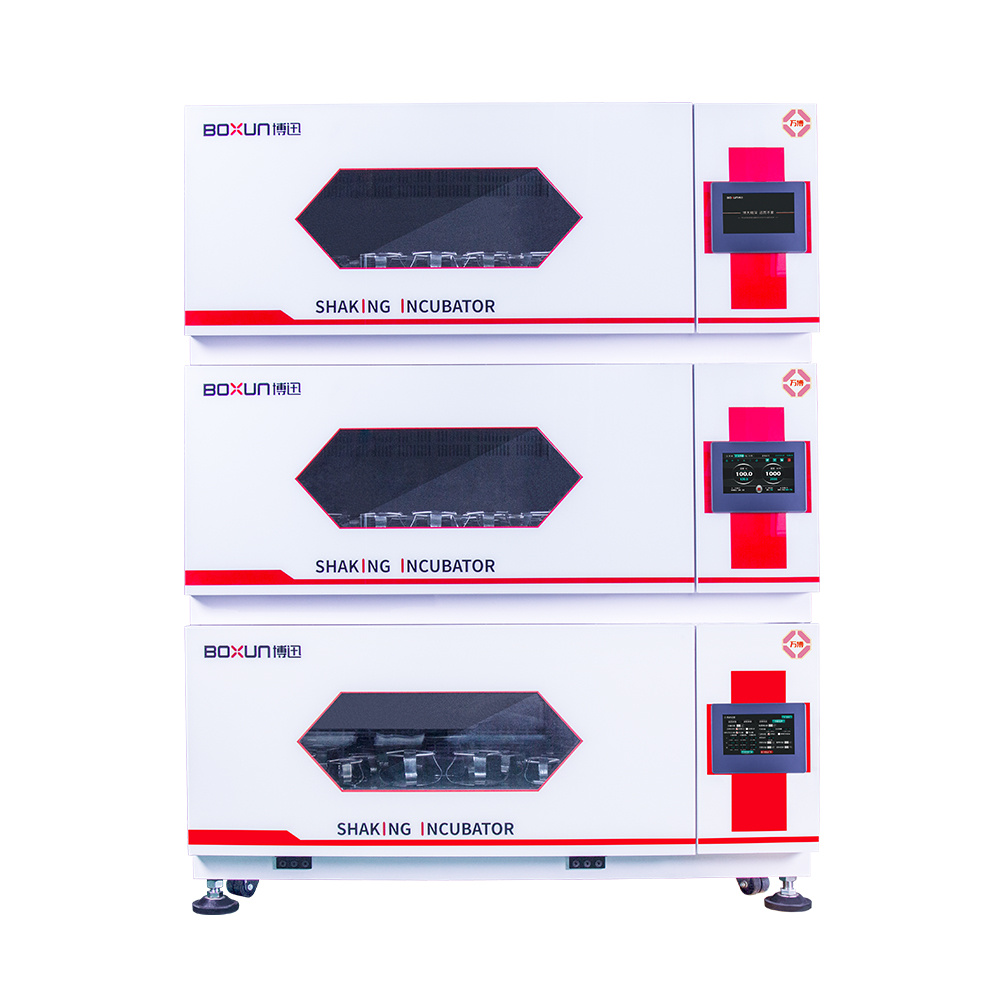
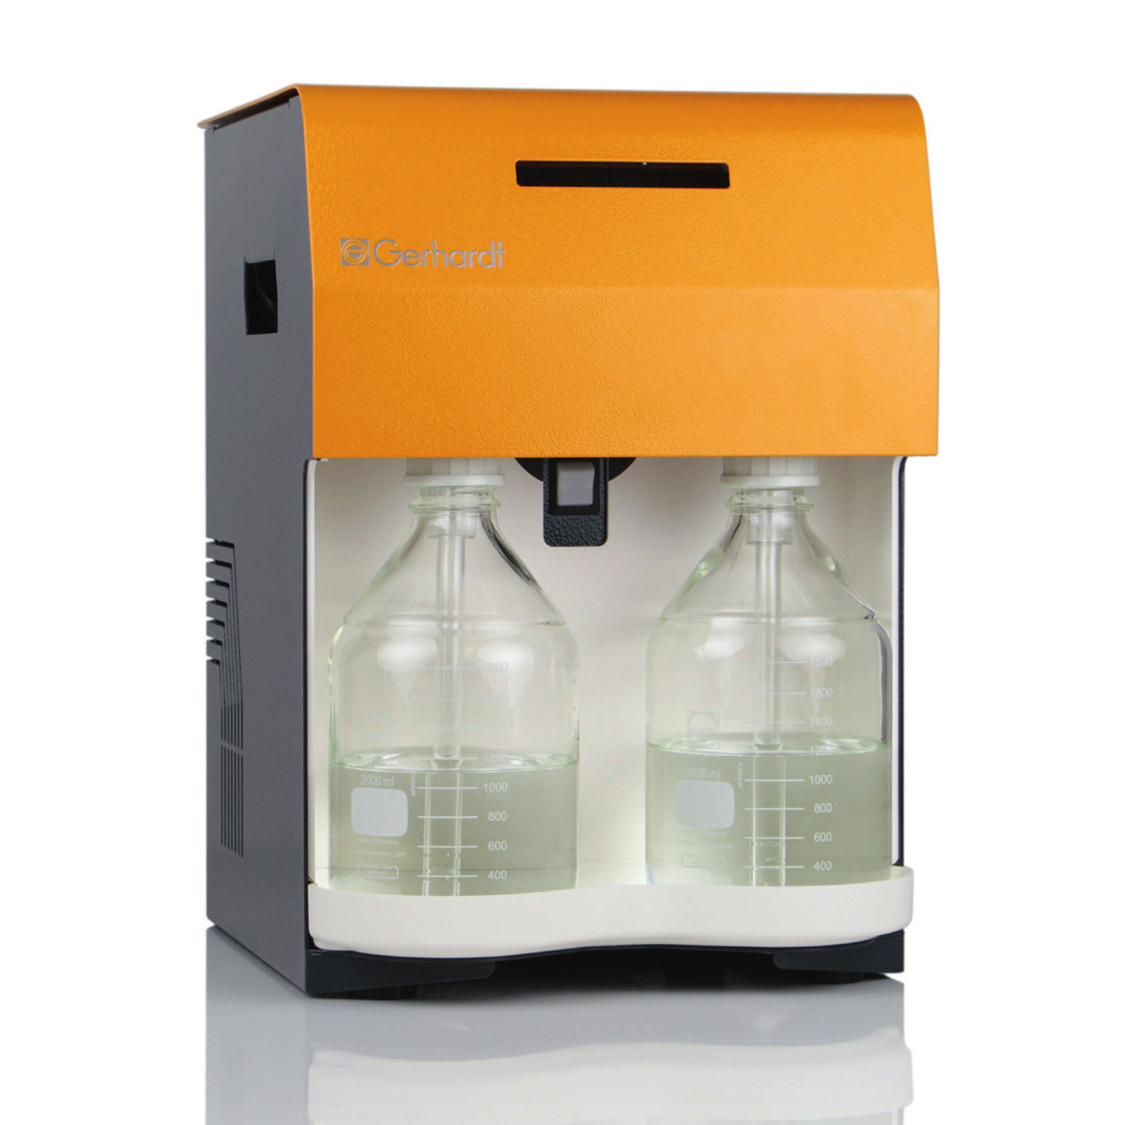
使用格哈特公司Laboshake LS 500i振荡器,用4ml 10%(v/v)三氯乙酸在室温下提取300 mg样品1小时,测定游离氨基酸含量
The amount of free amino acid was determined from 300 mg samples extracted with 4 ml of 10% (v/v) trichloroacetic acid for 1 h at room temperature using a Laboshake LS 500i instrument (Gerhardt, Germany).
方案详情

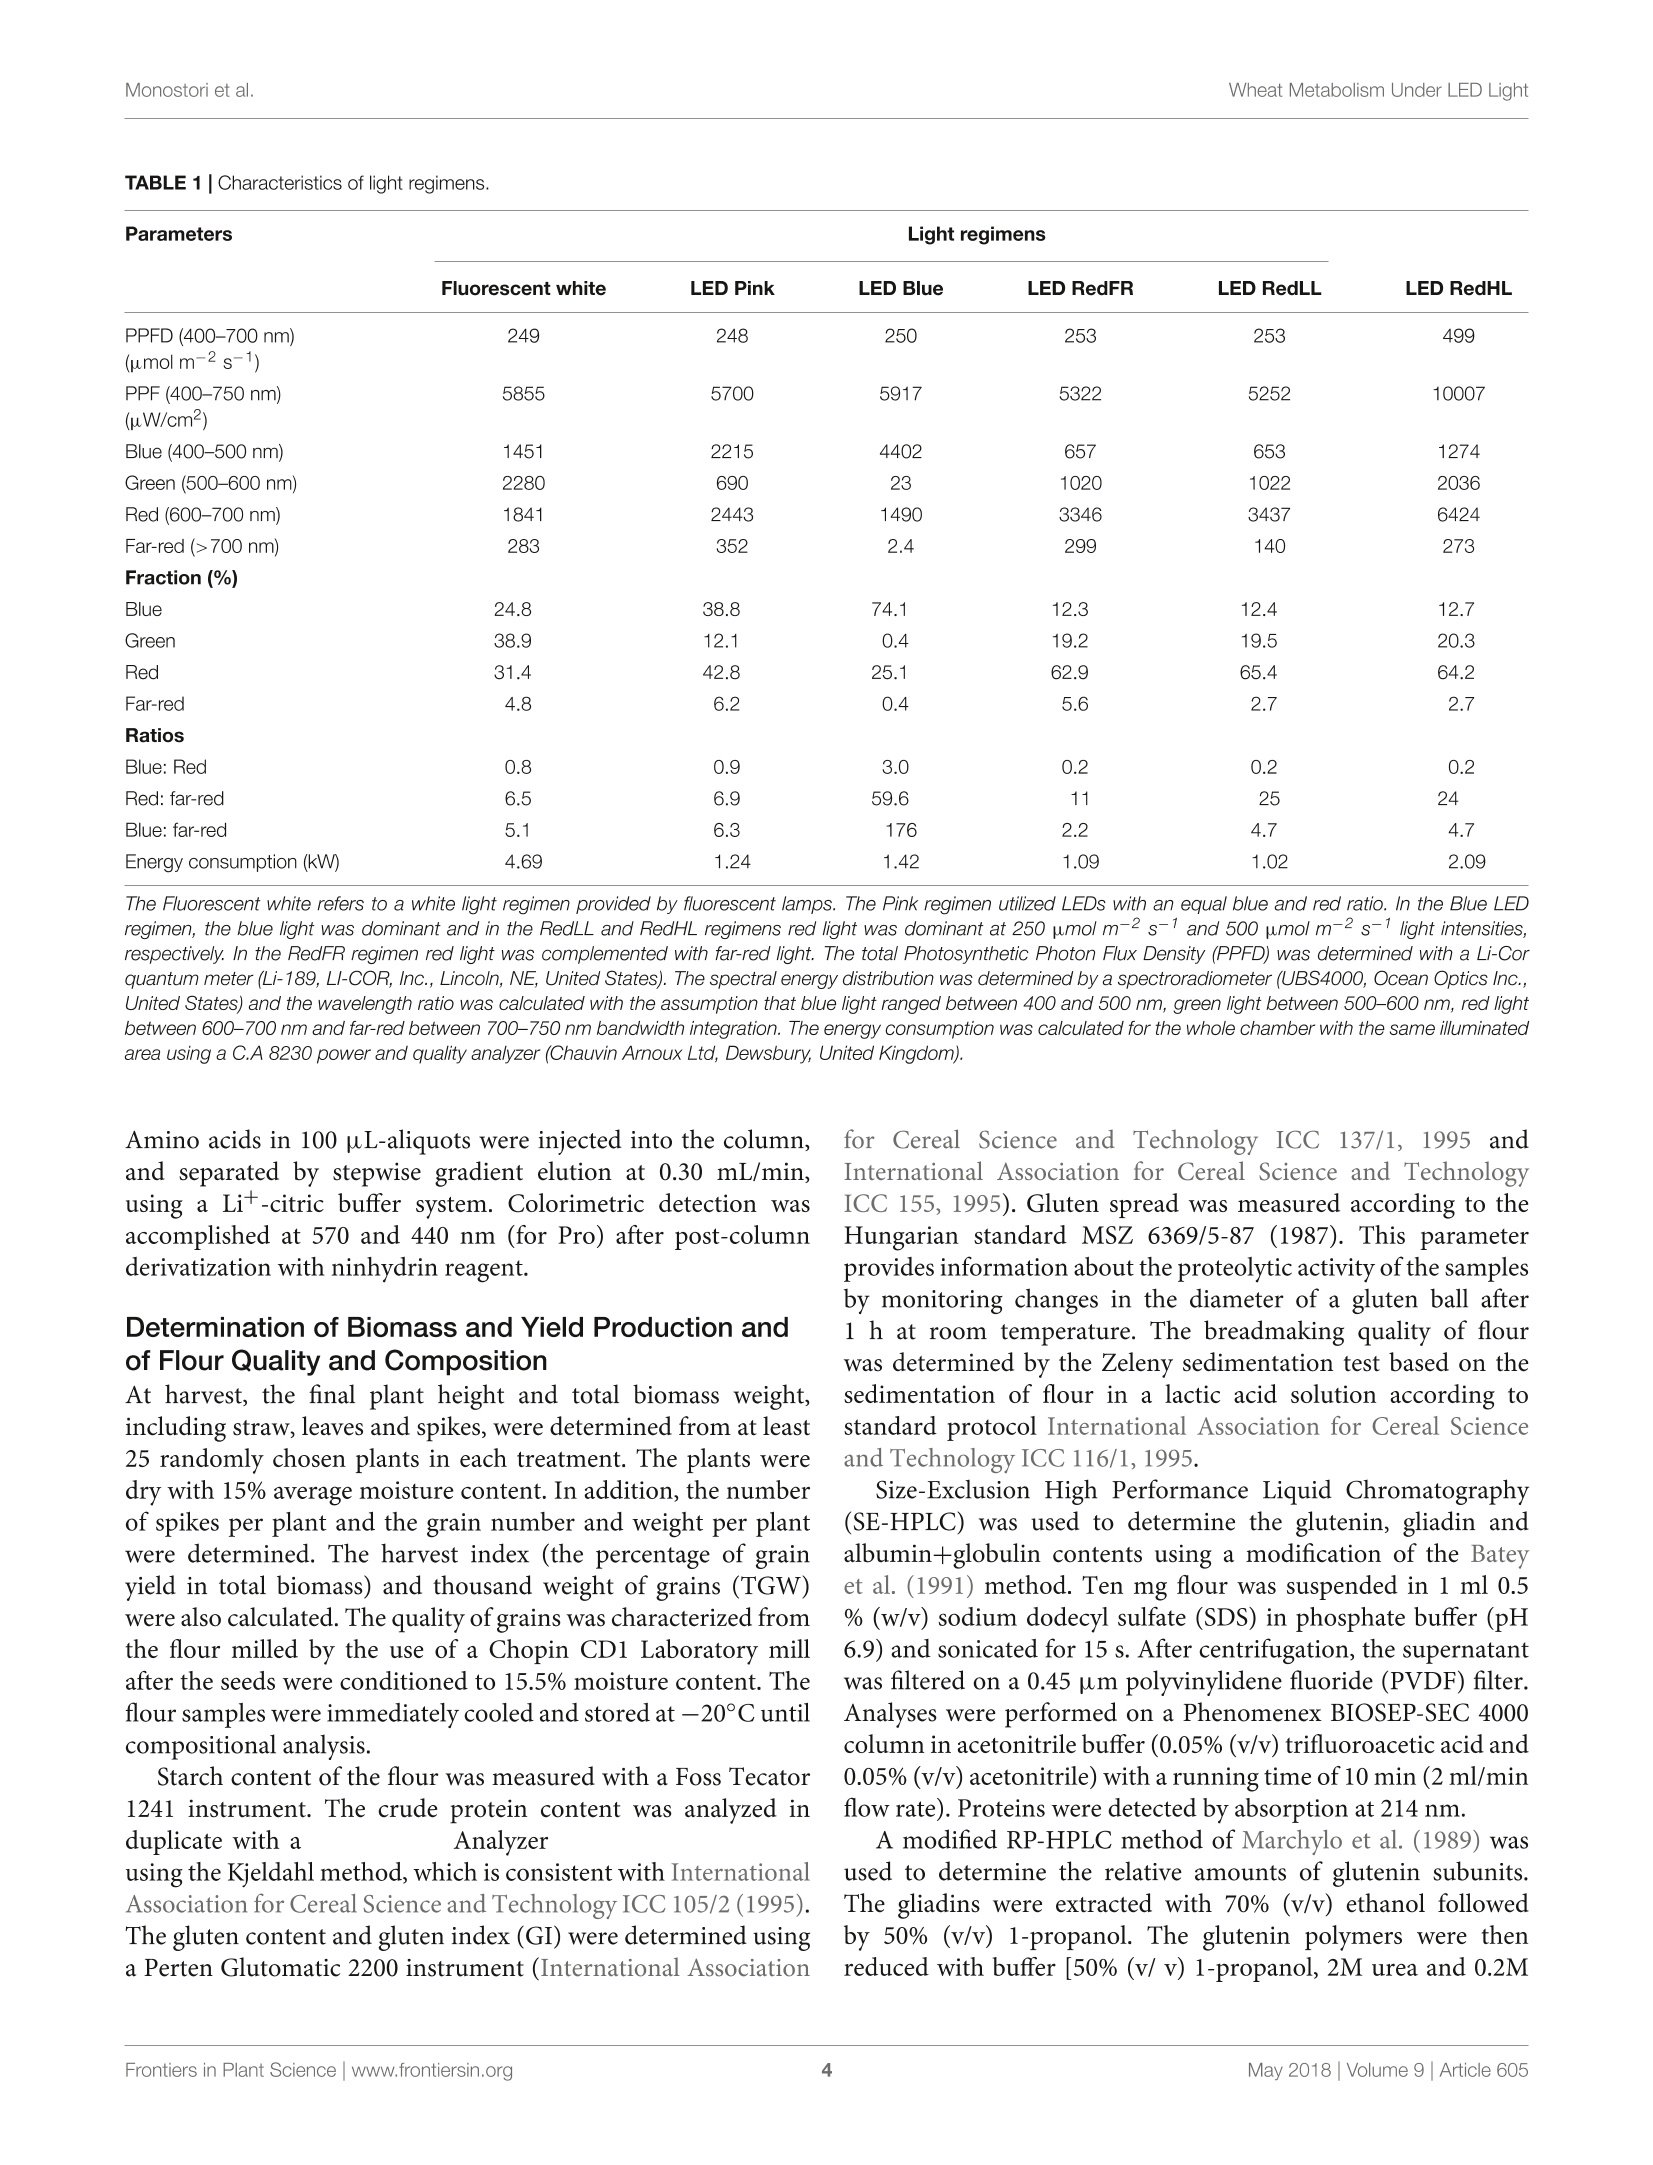
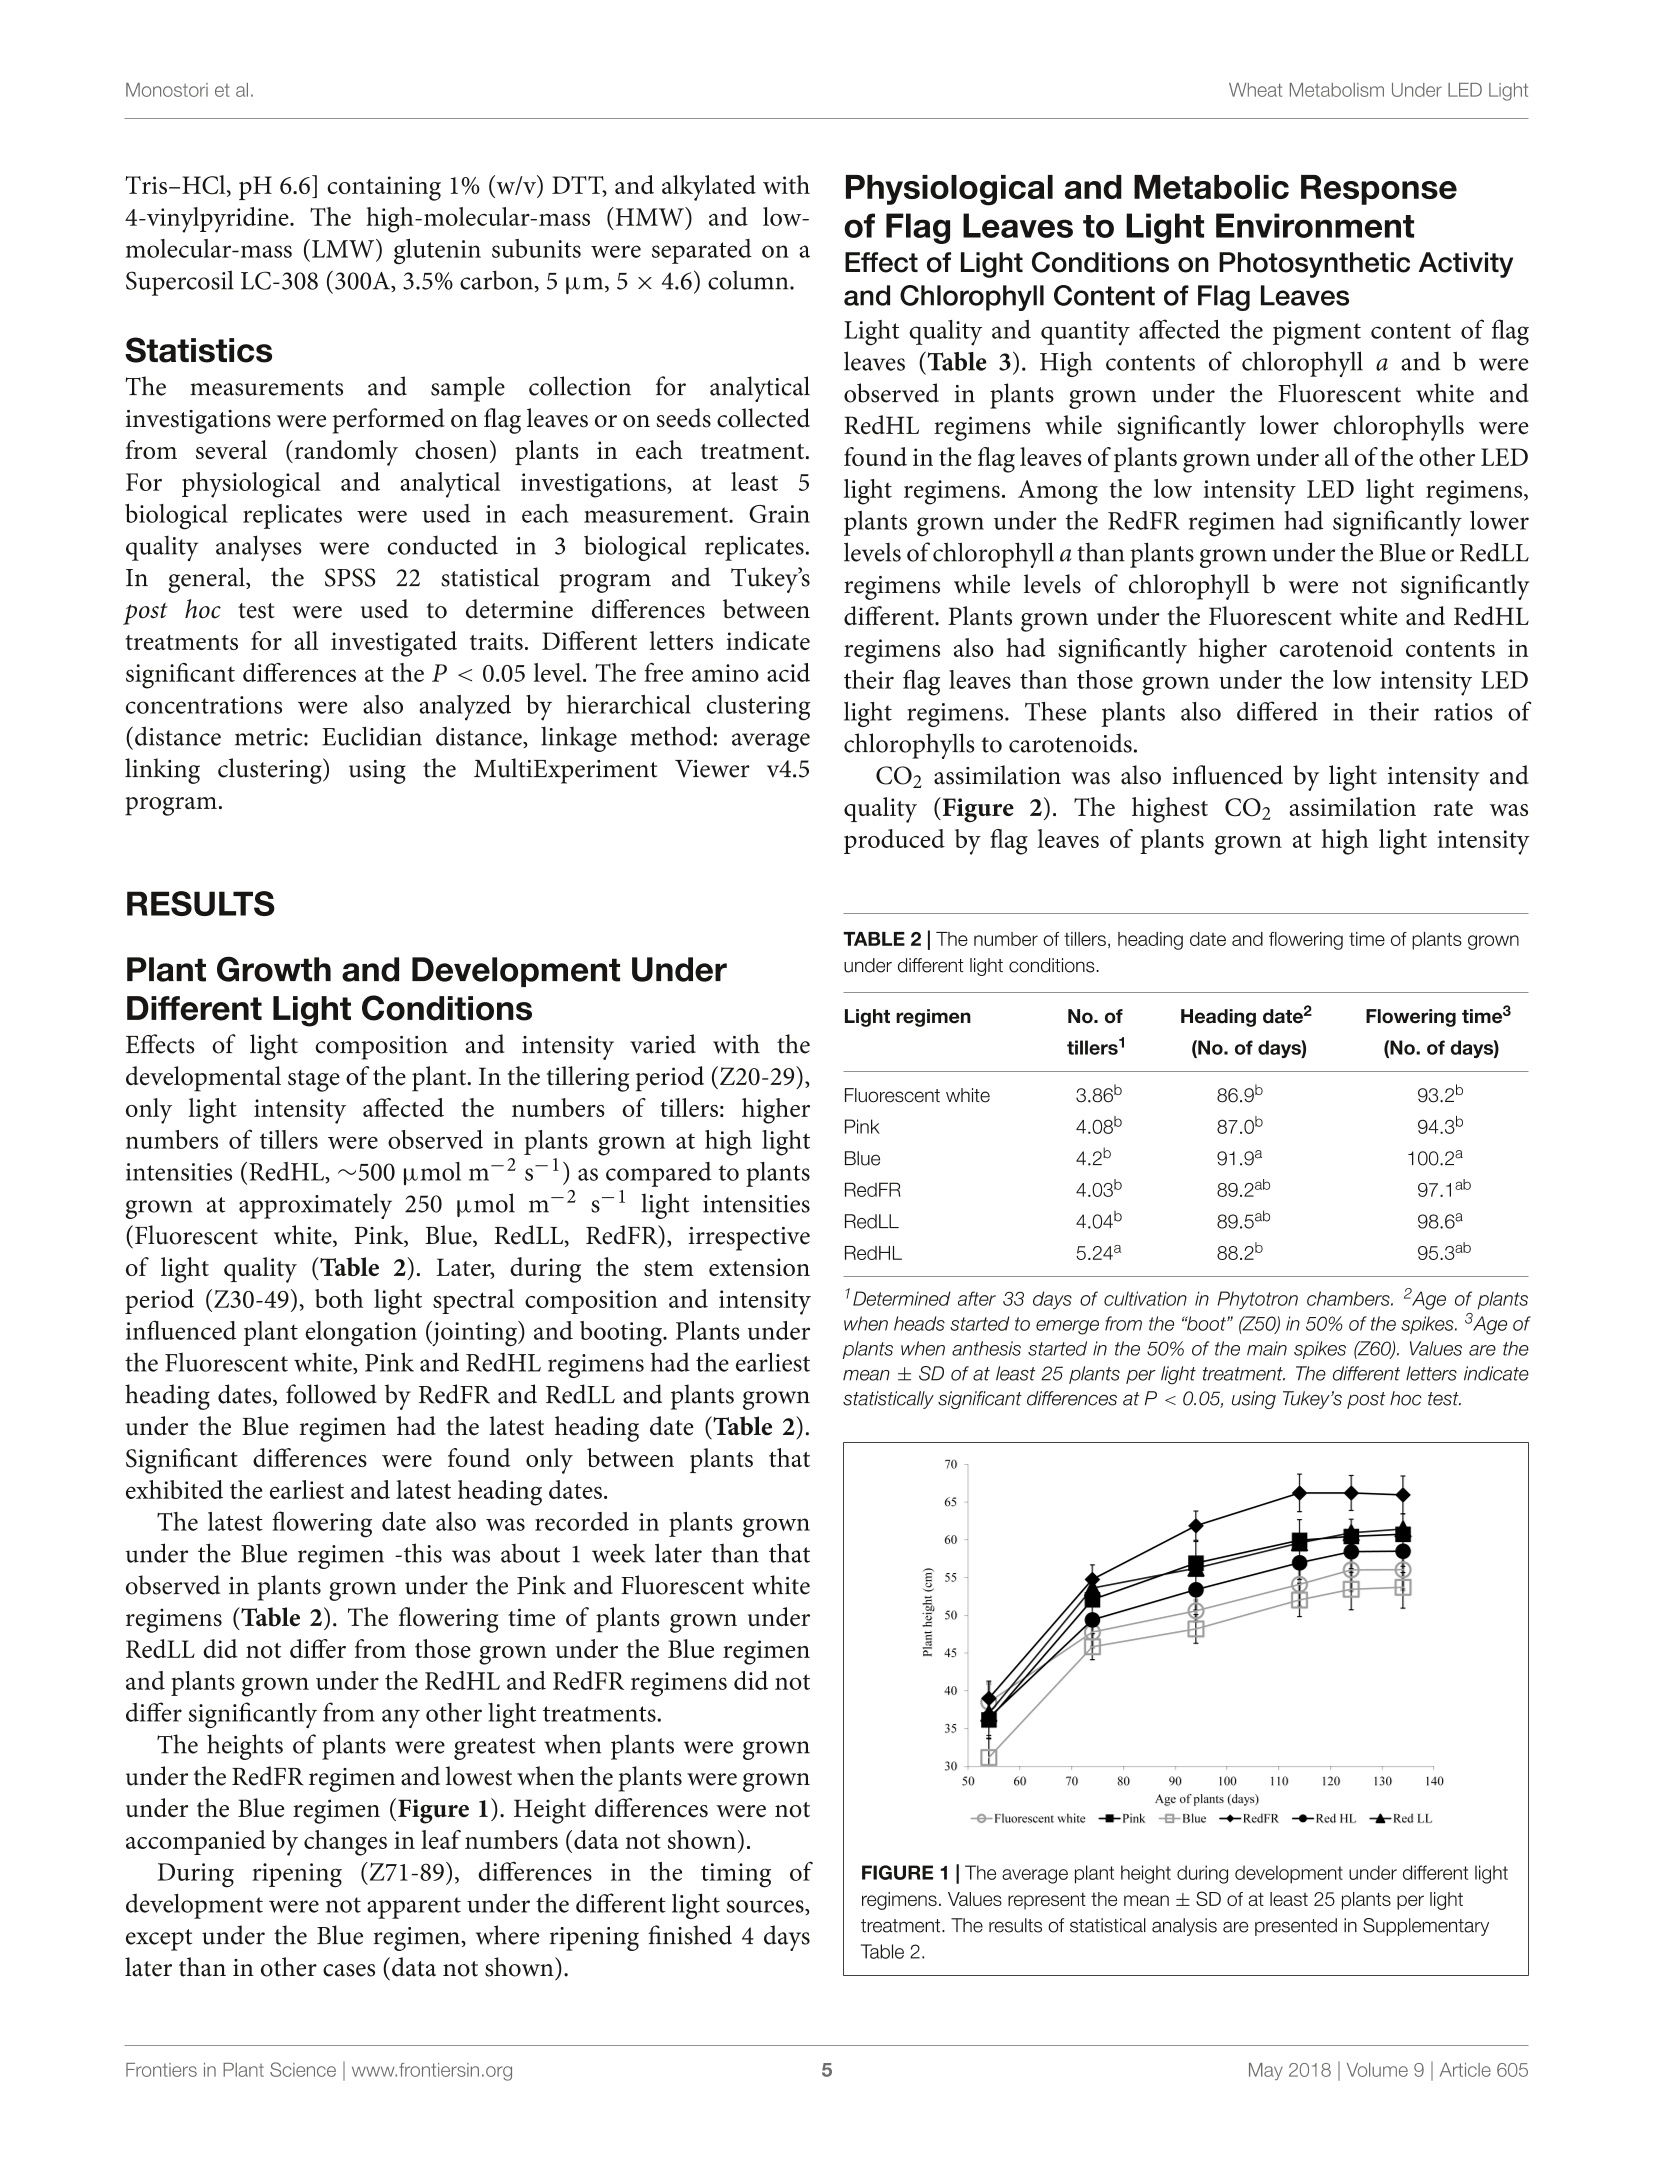
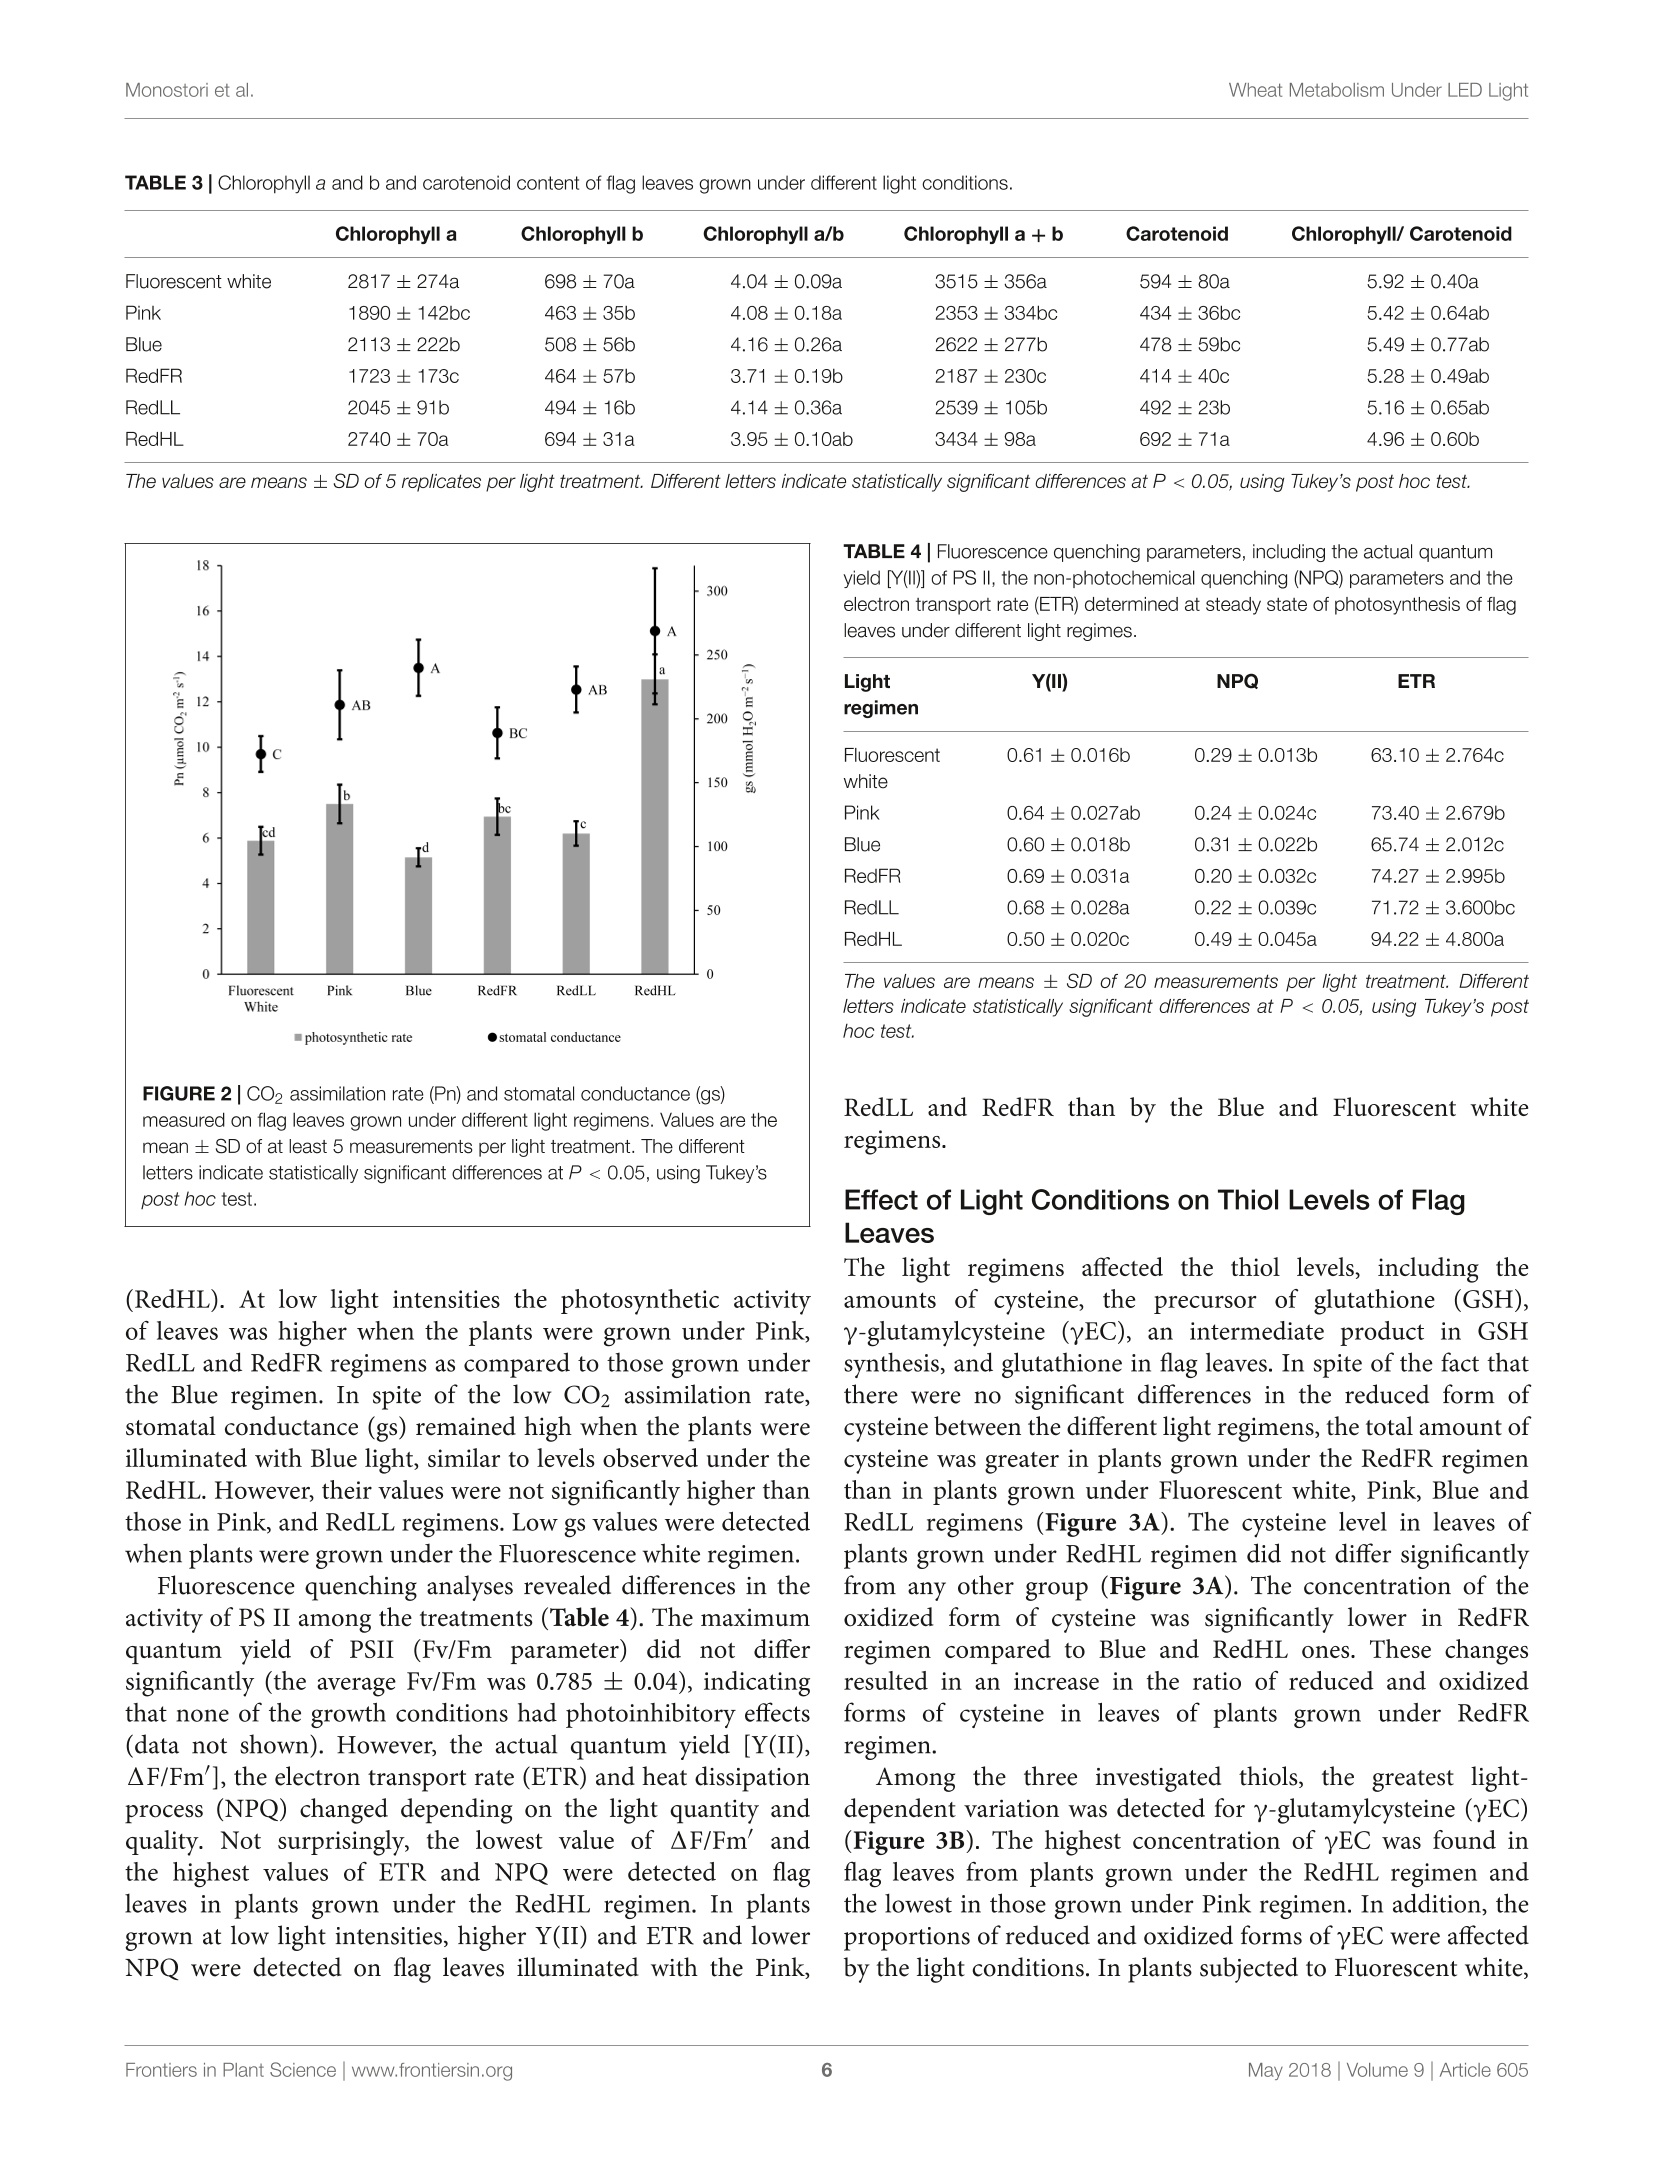
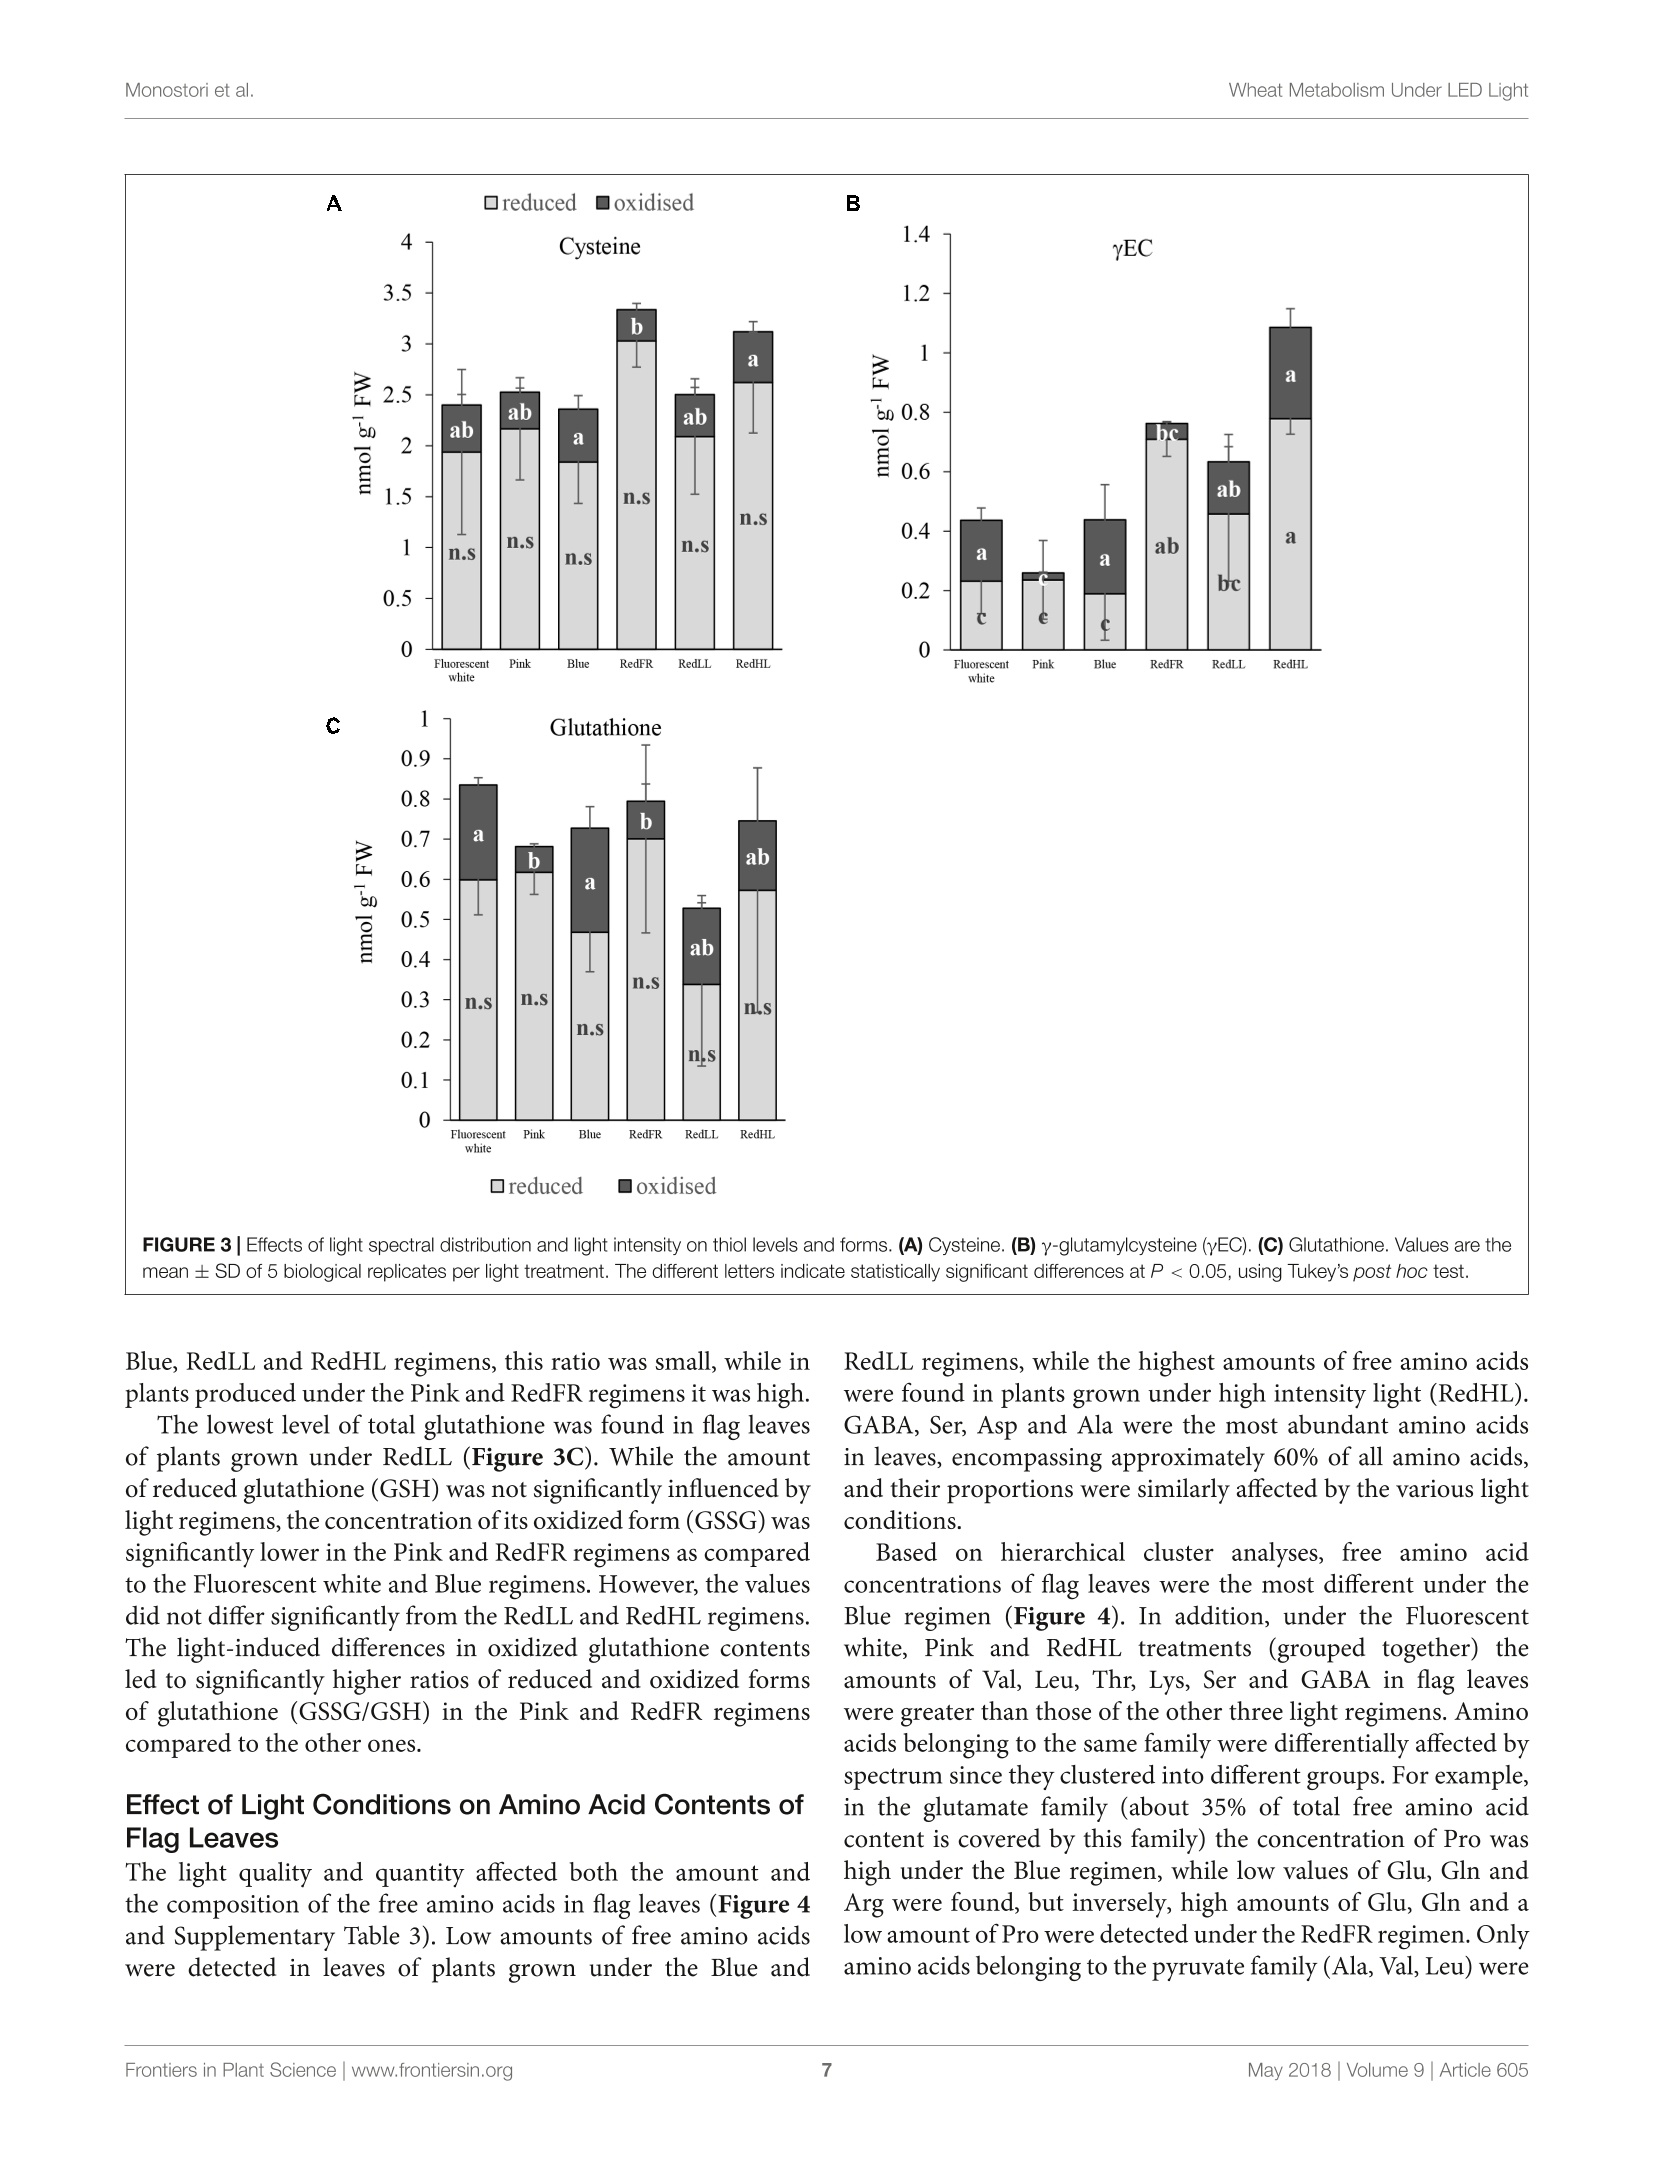
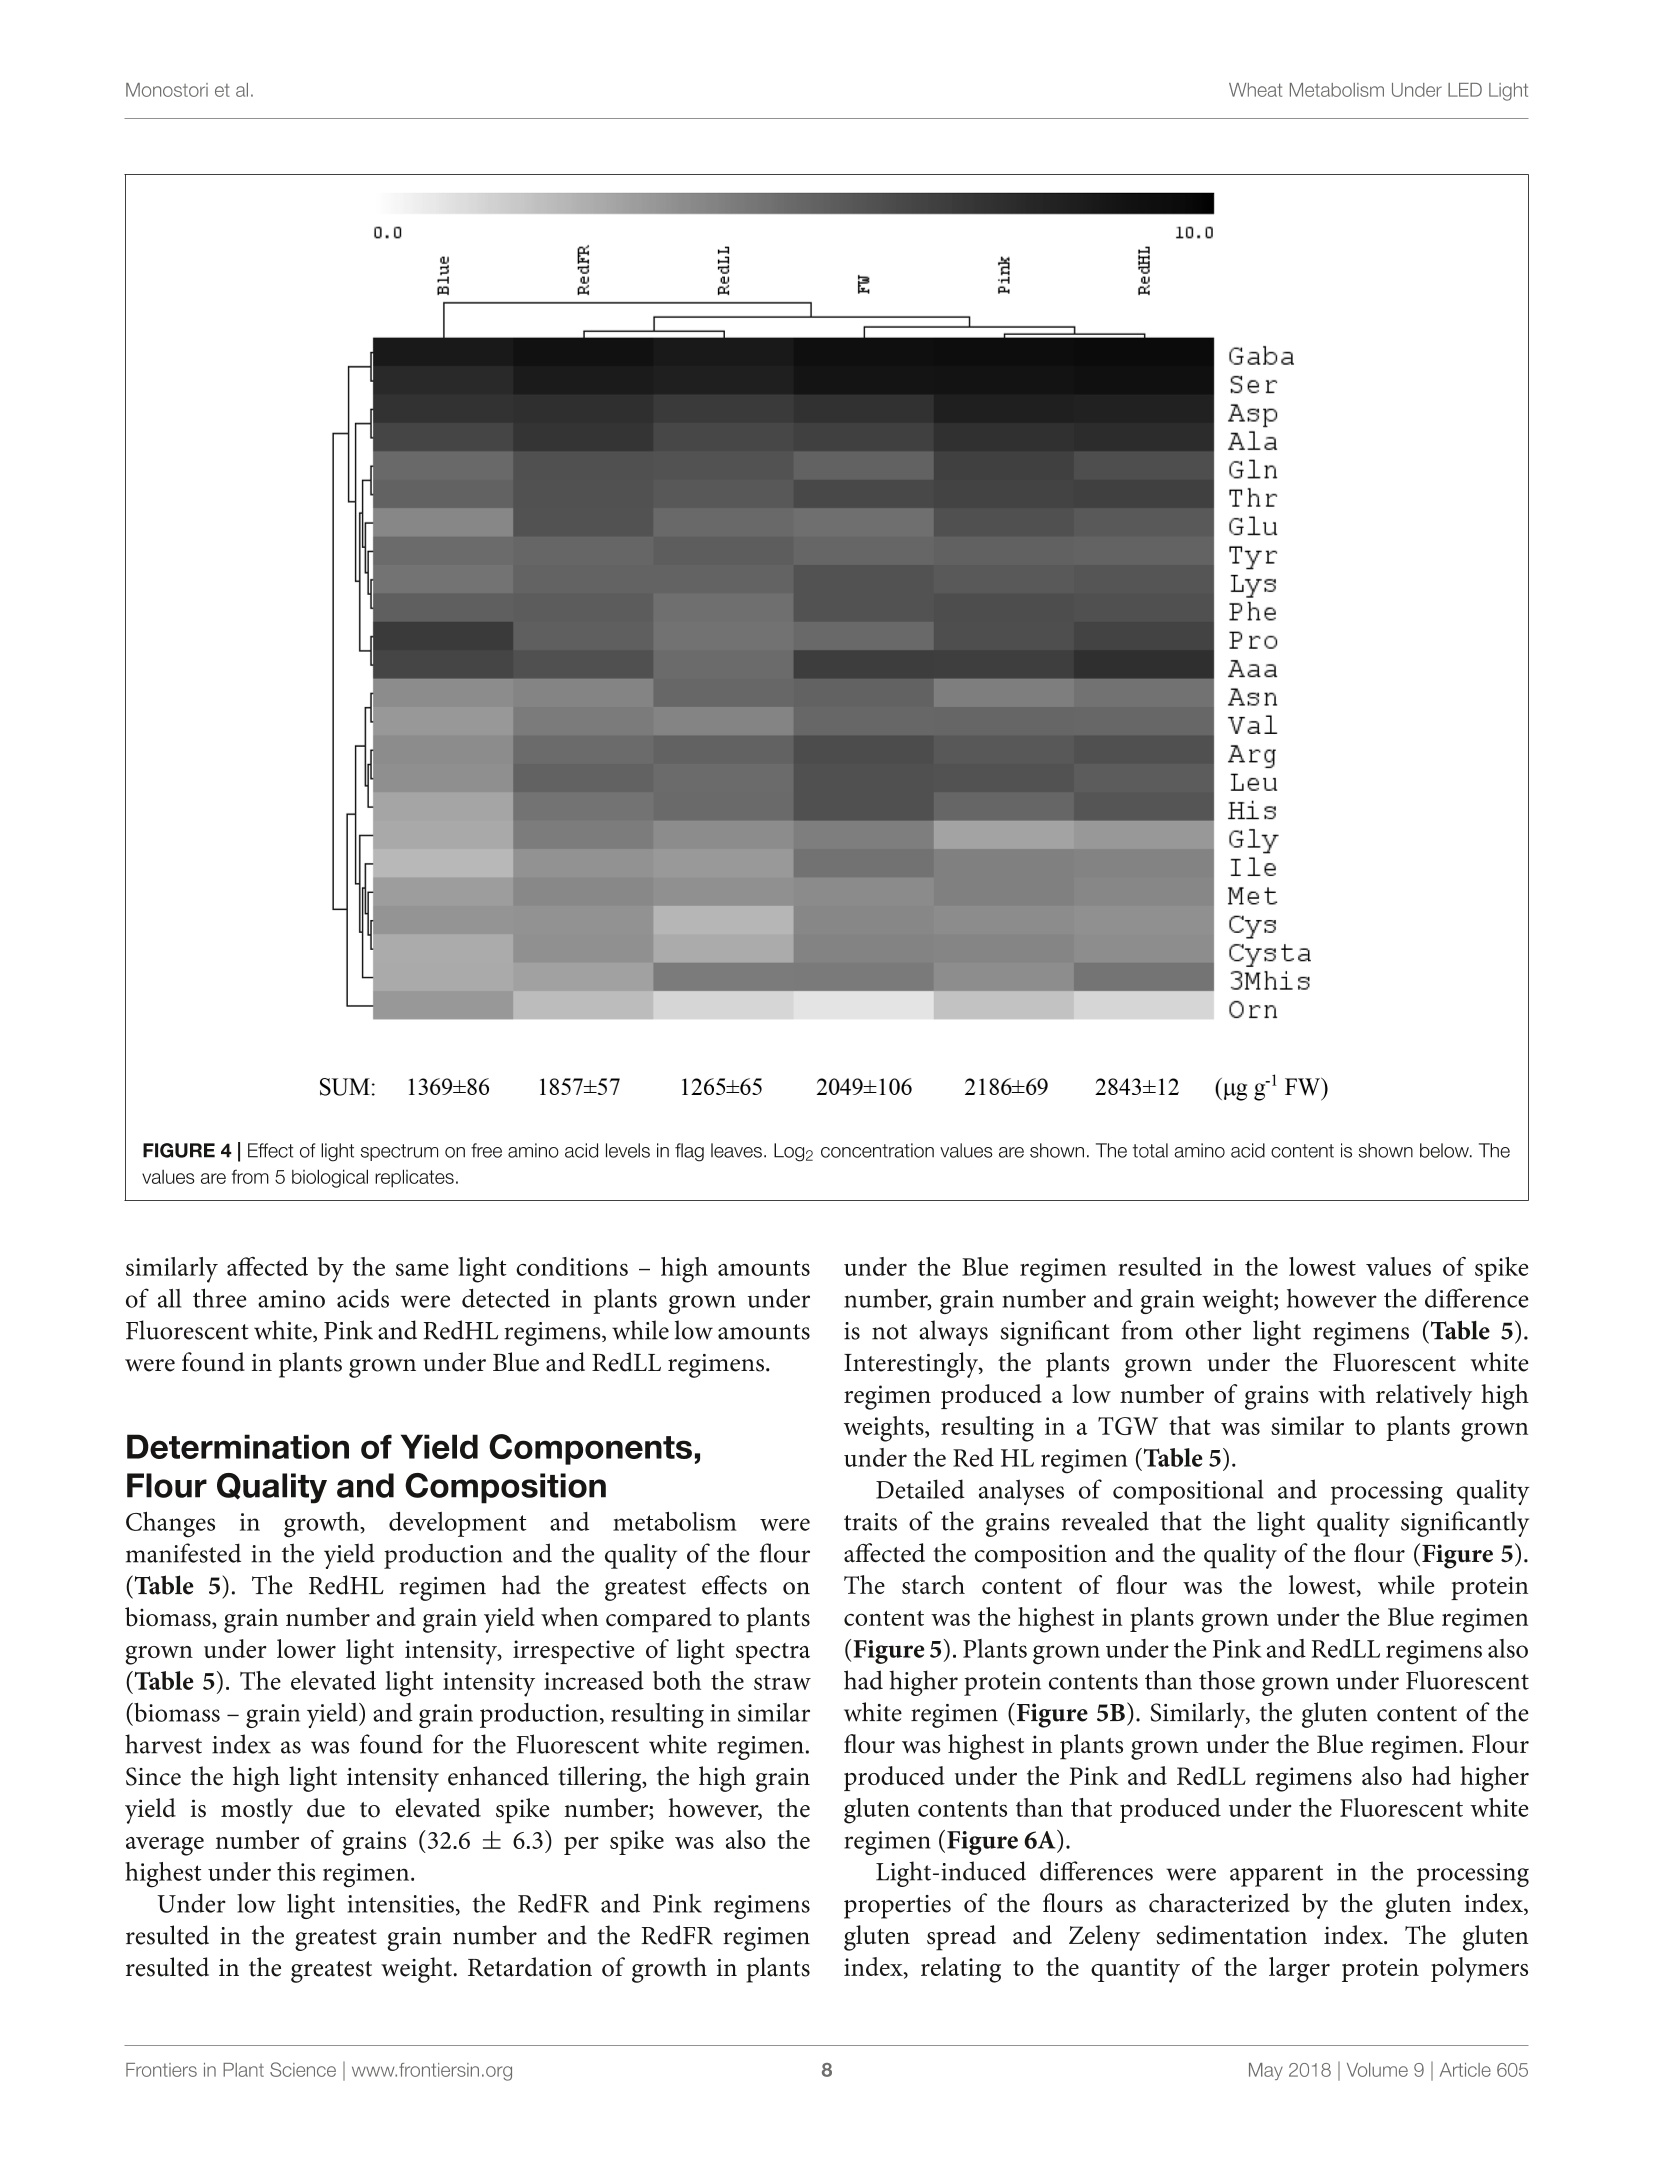
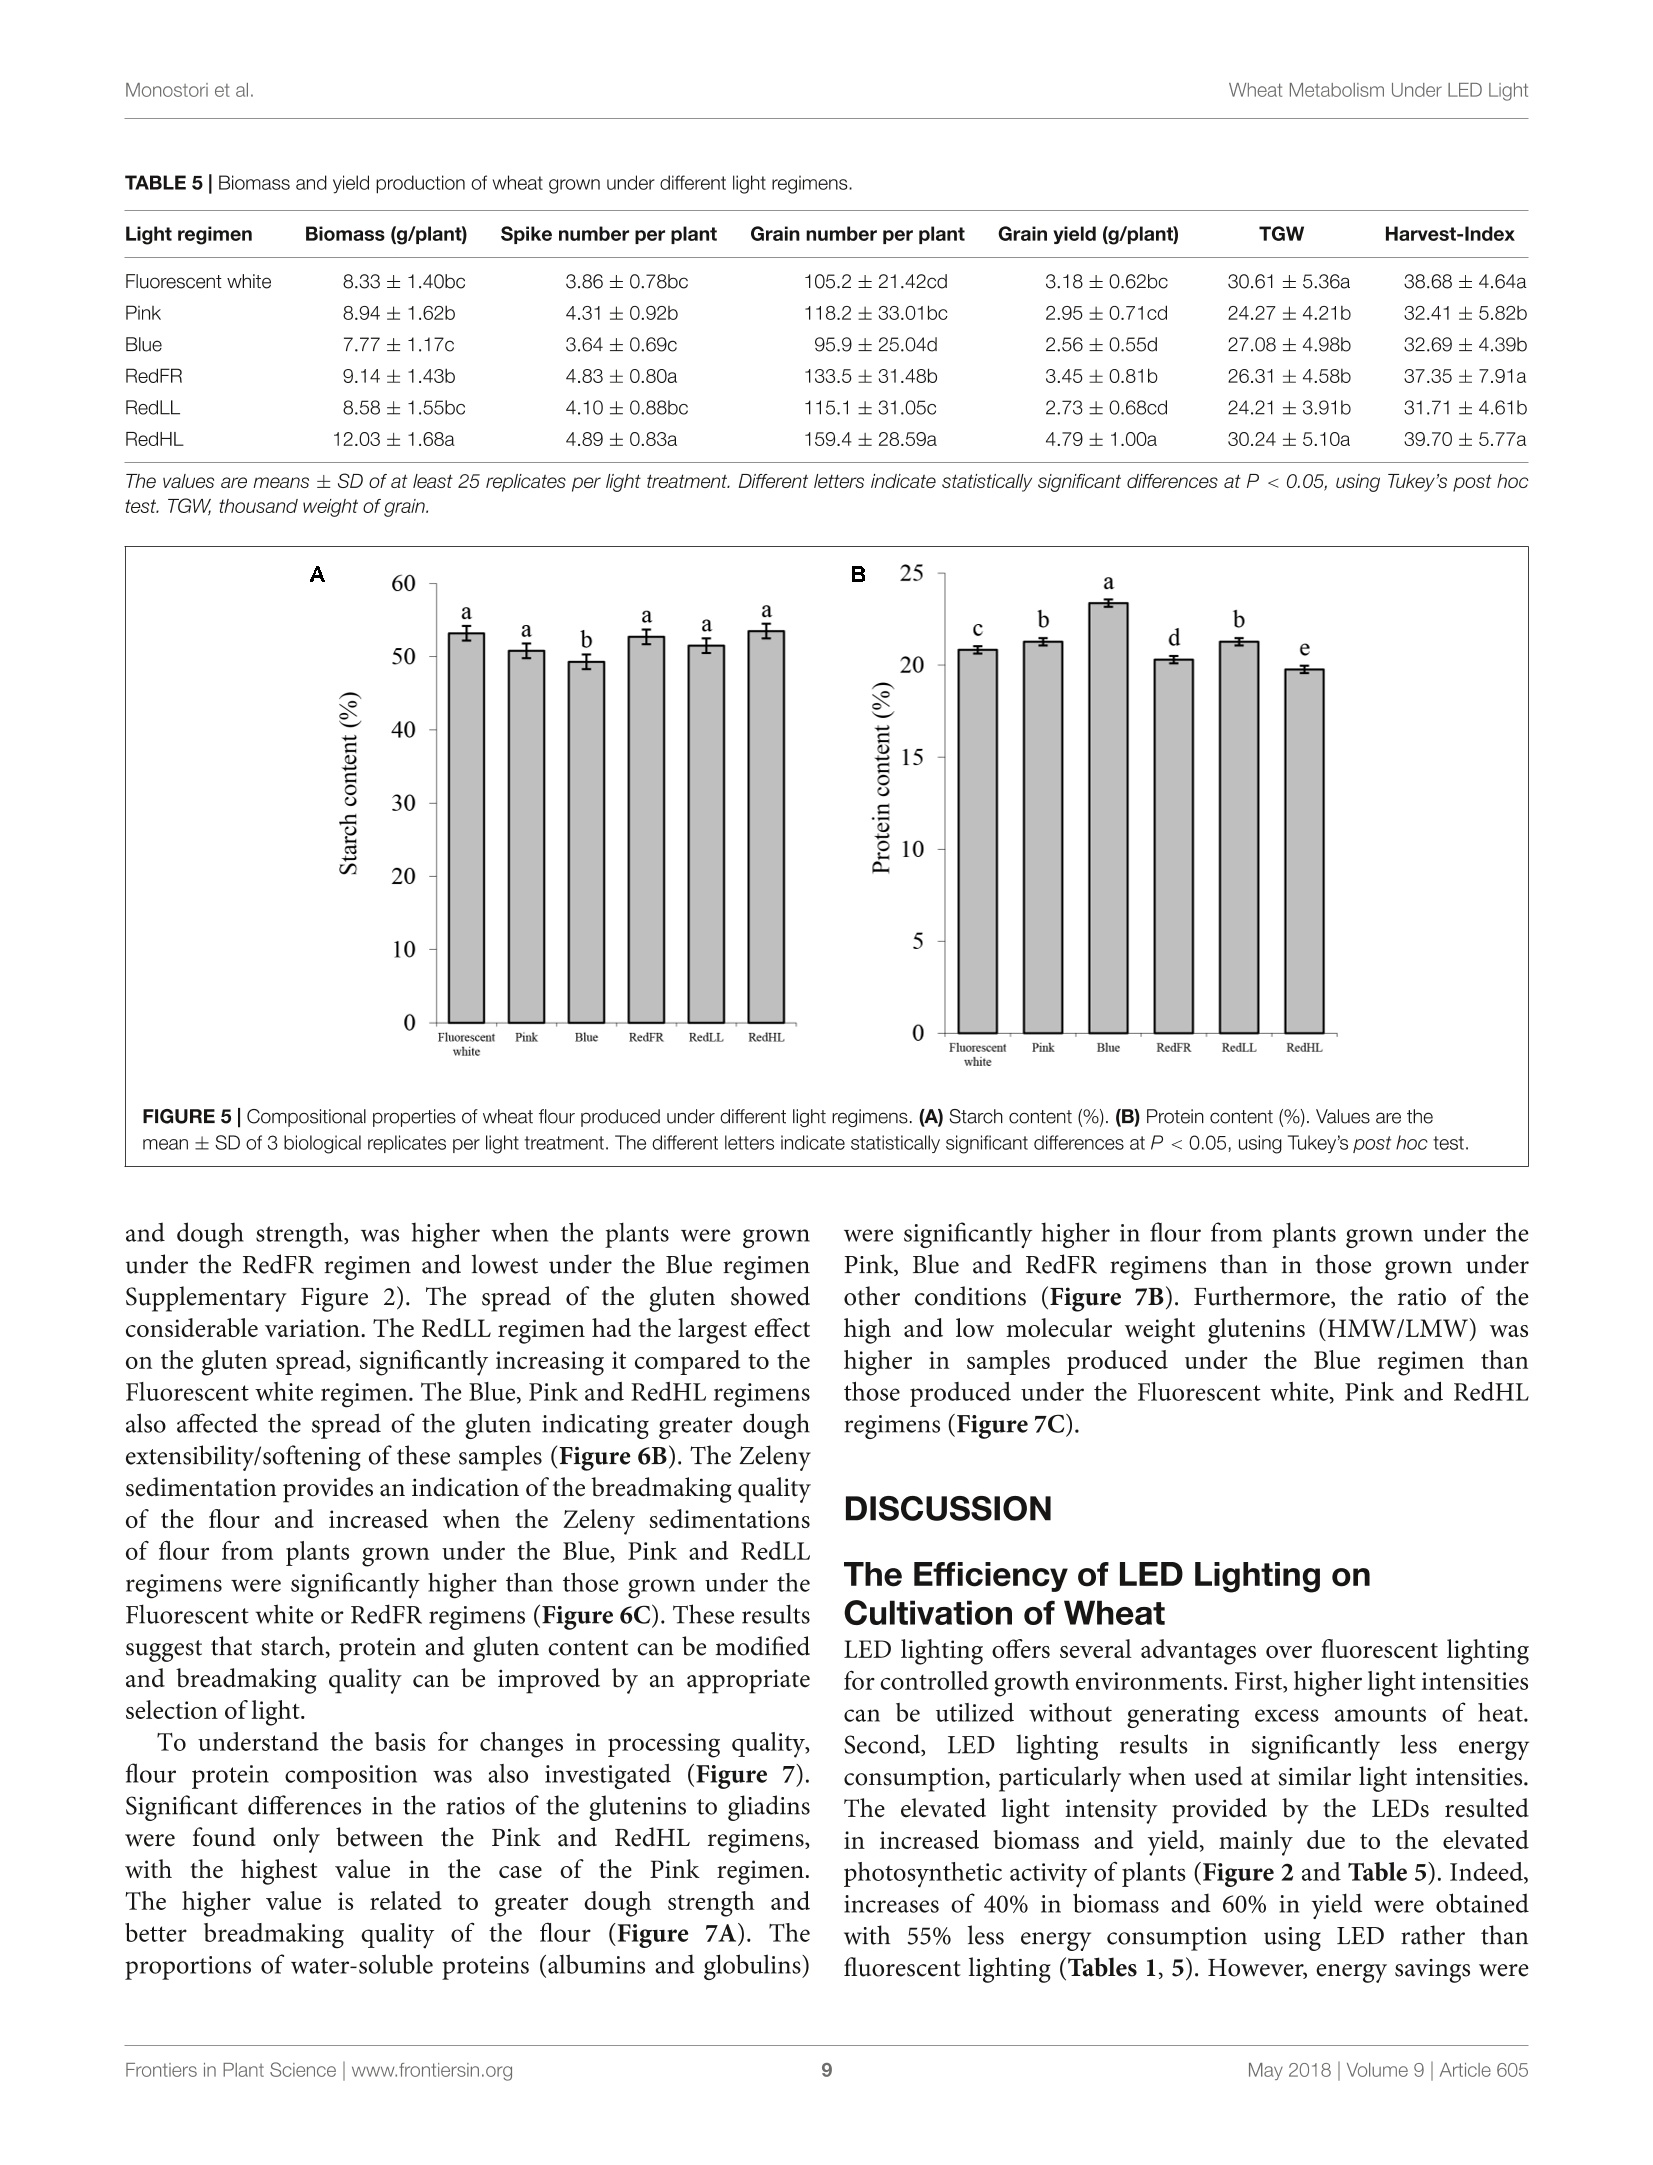
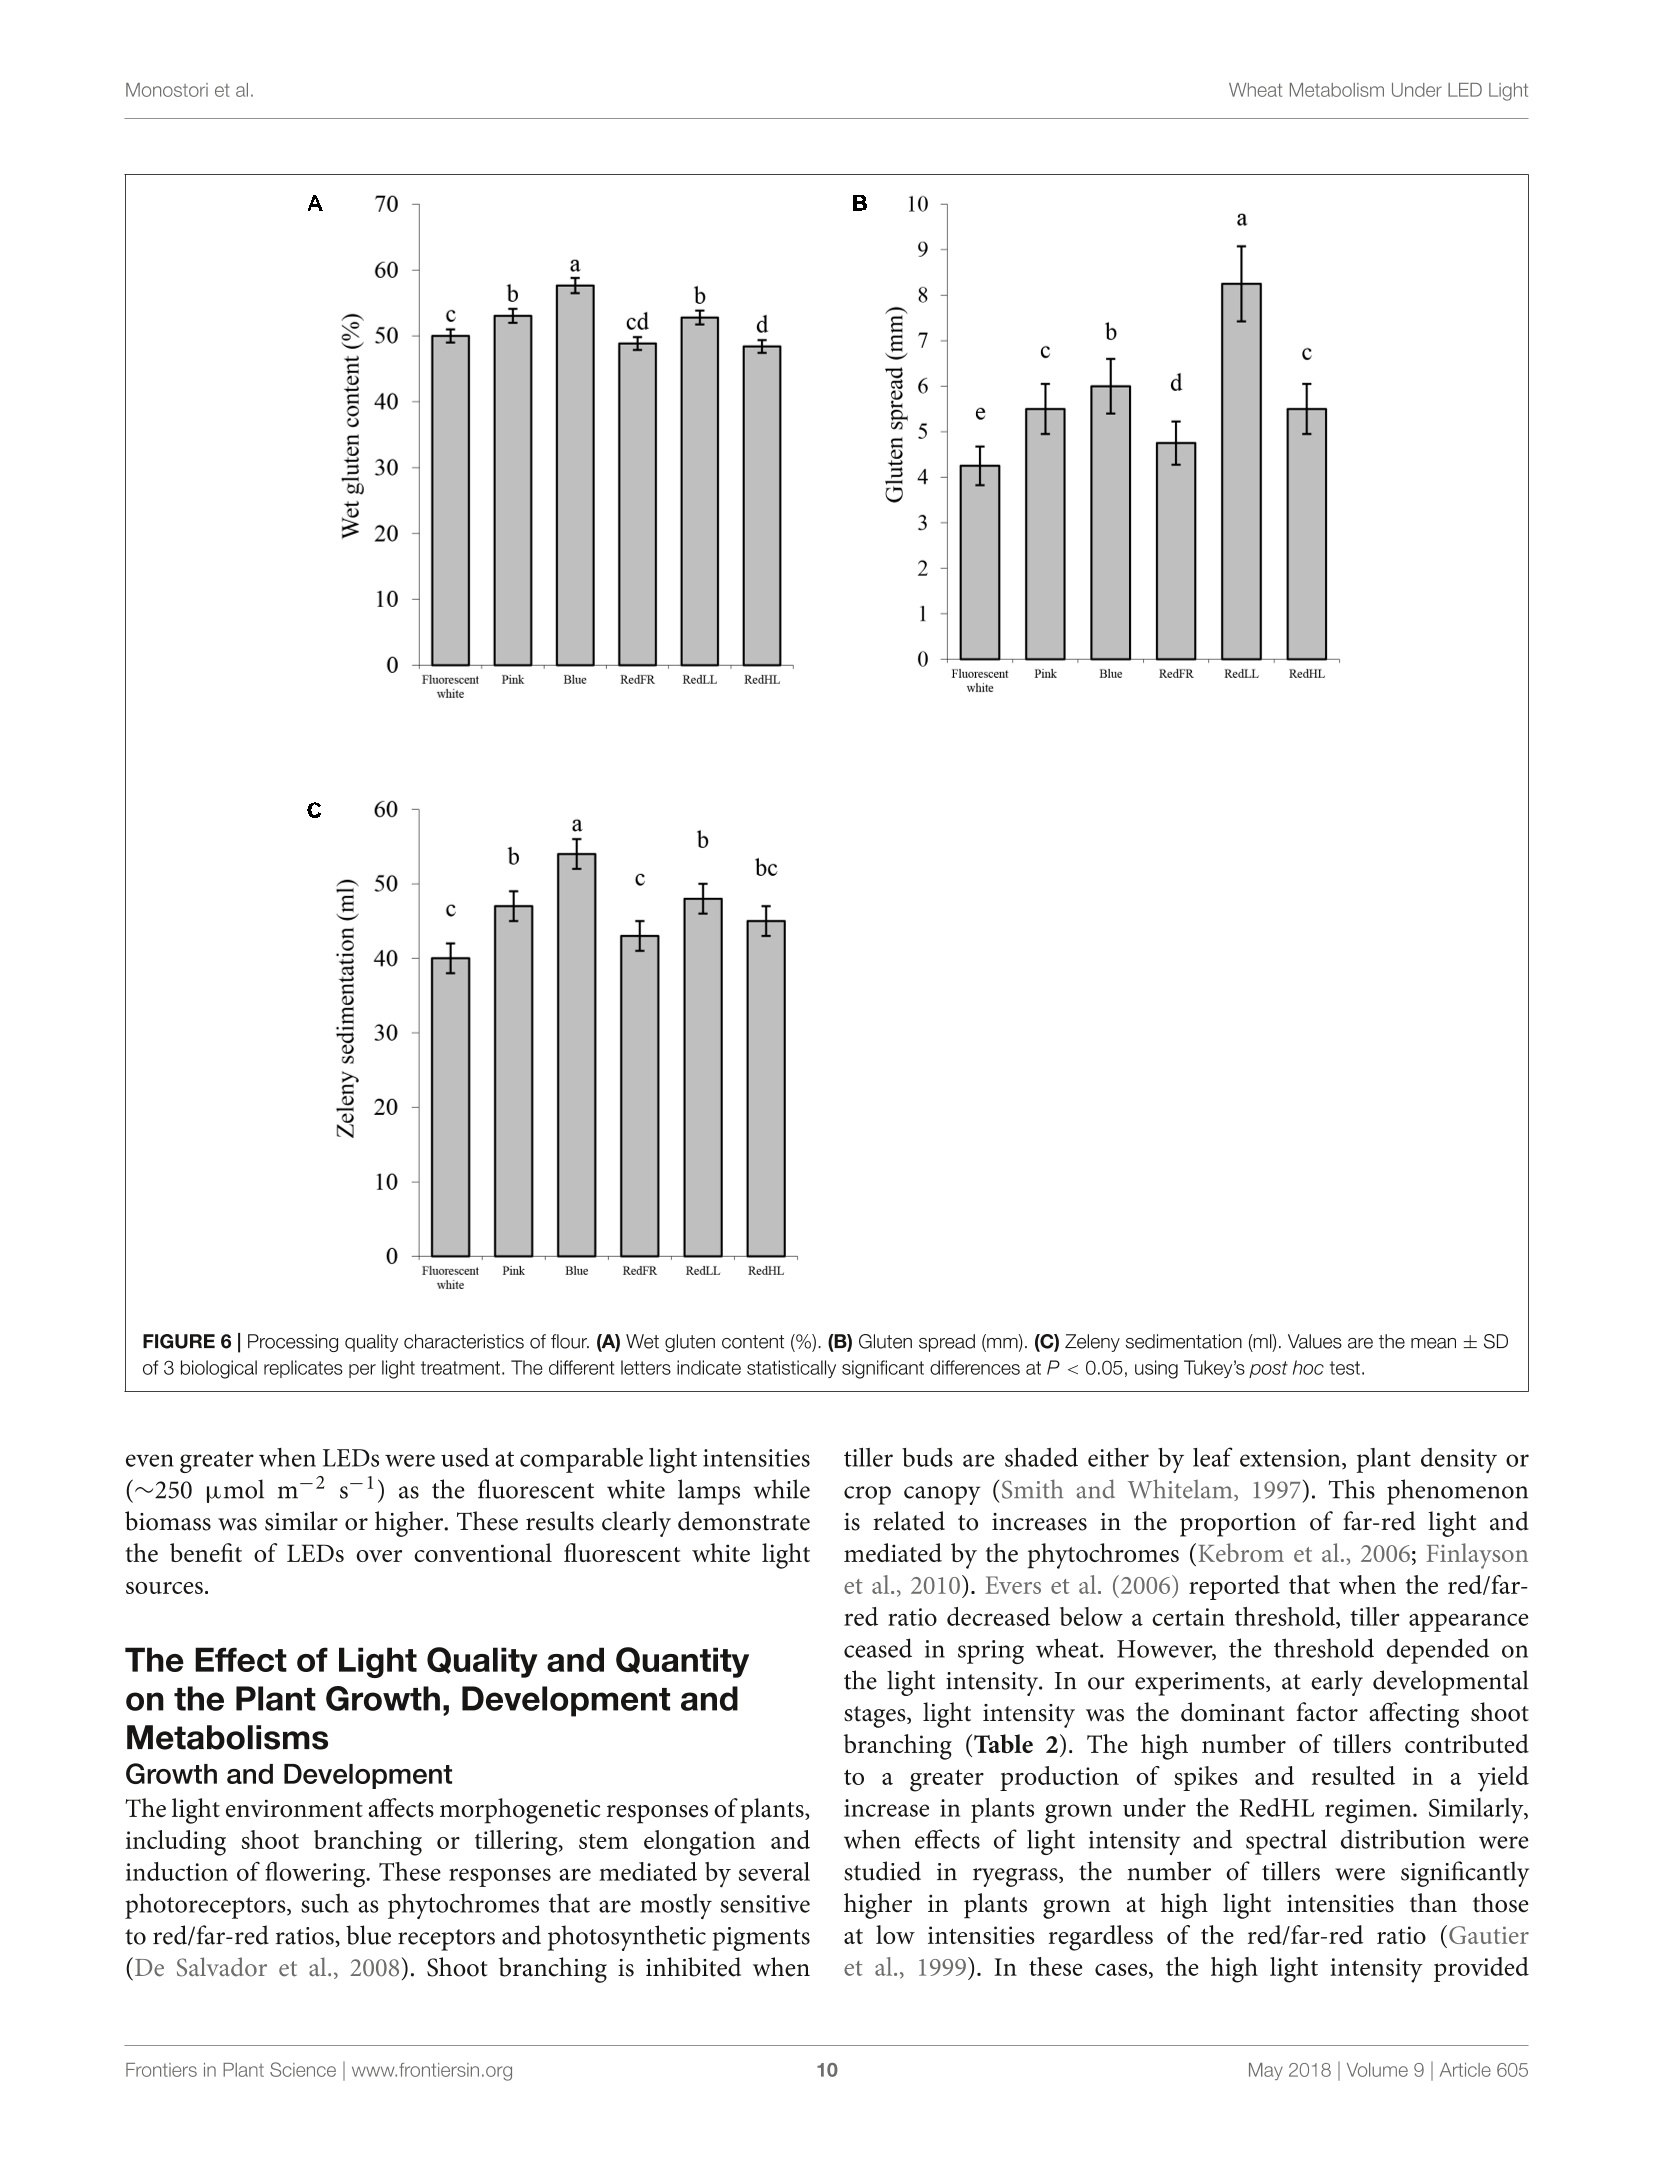
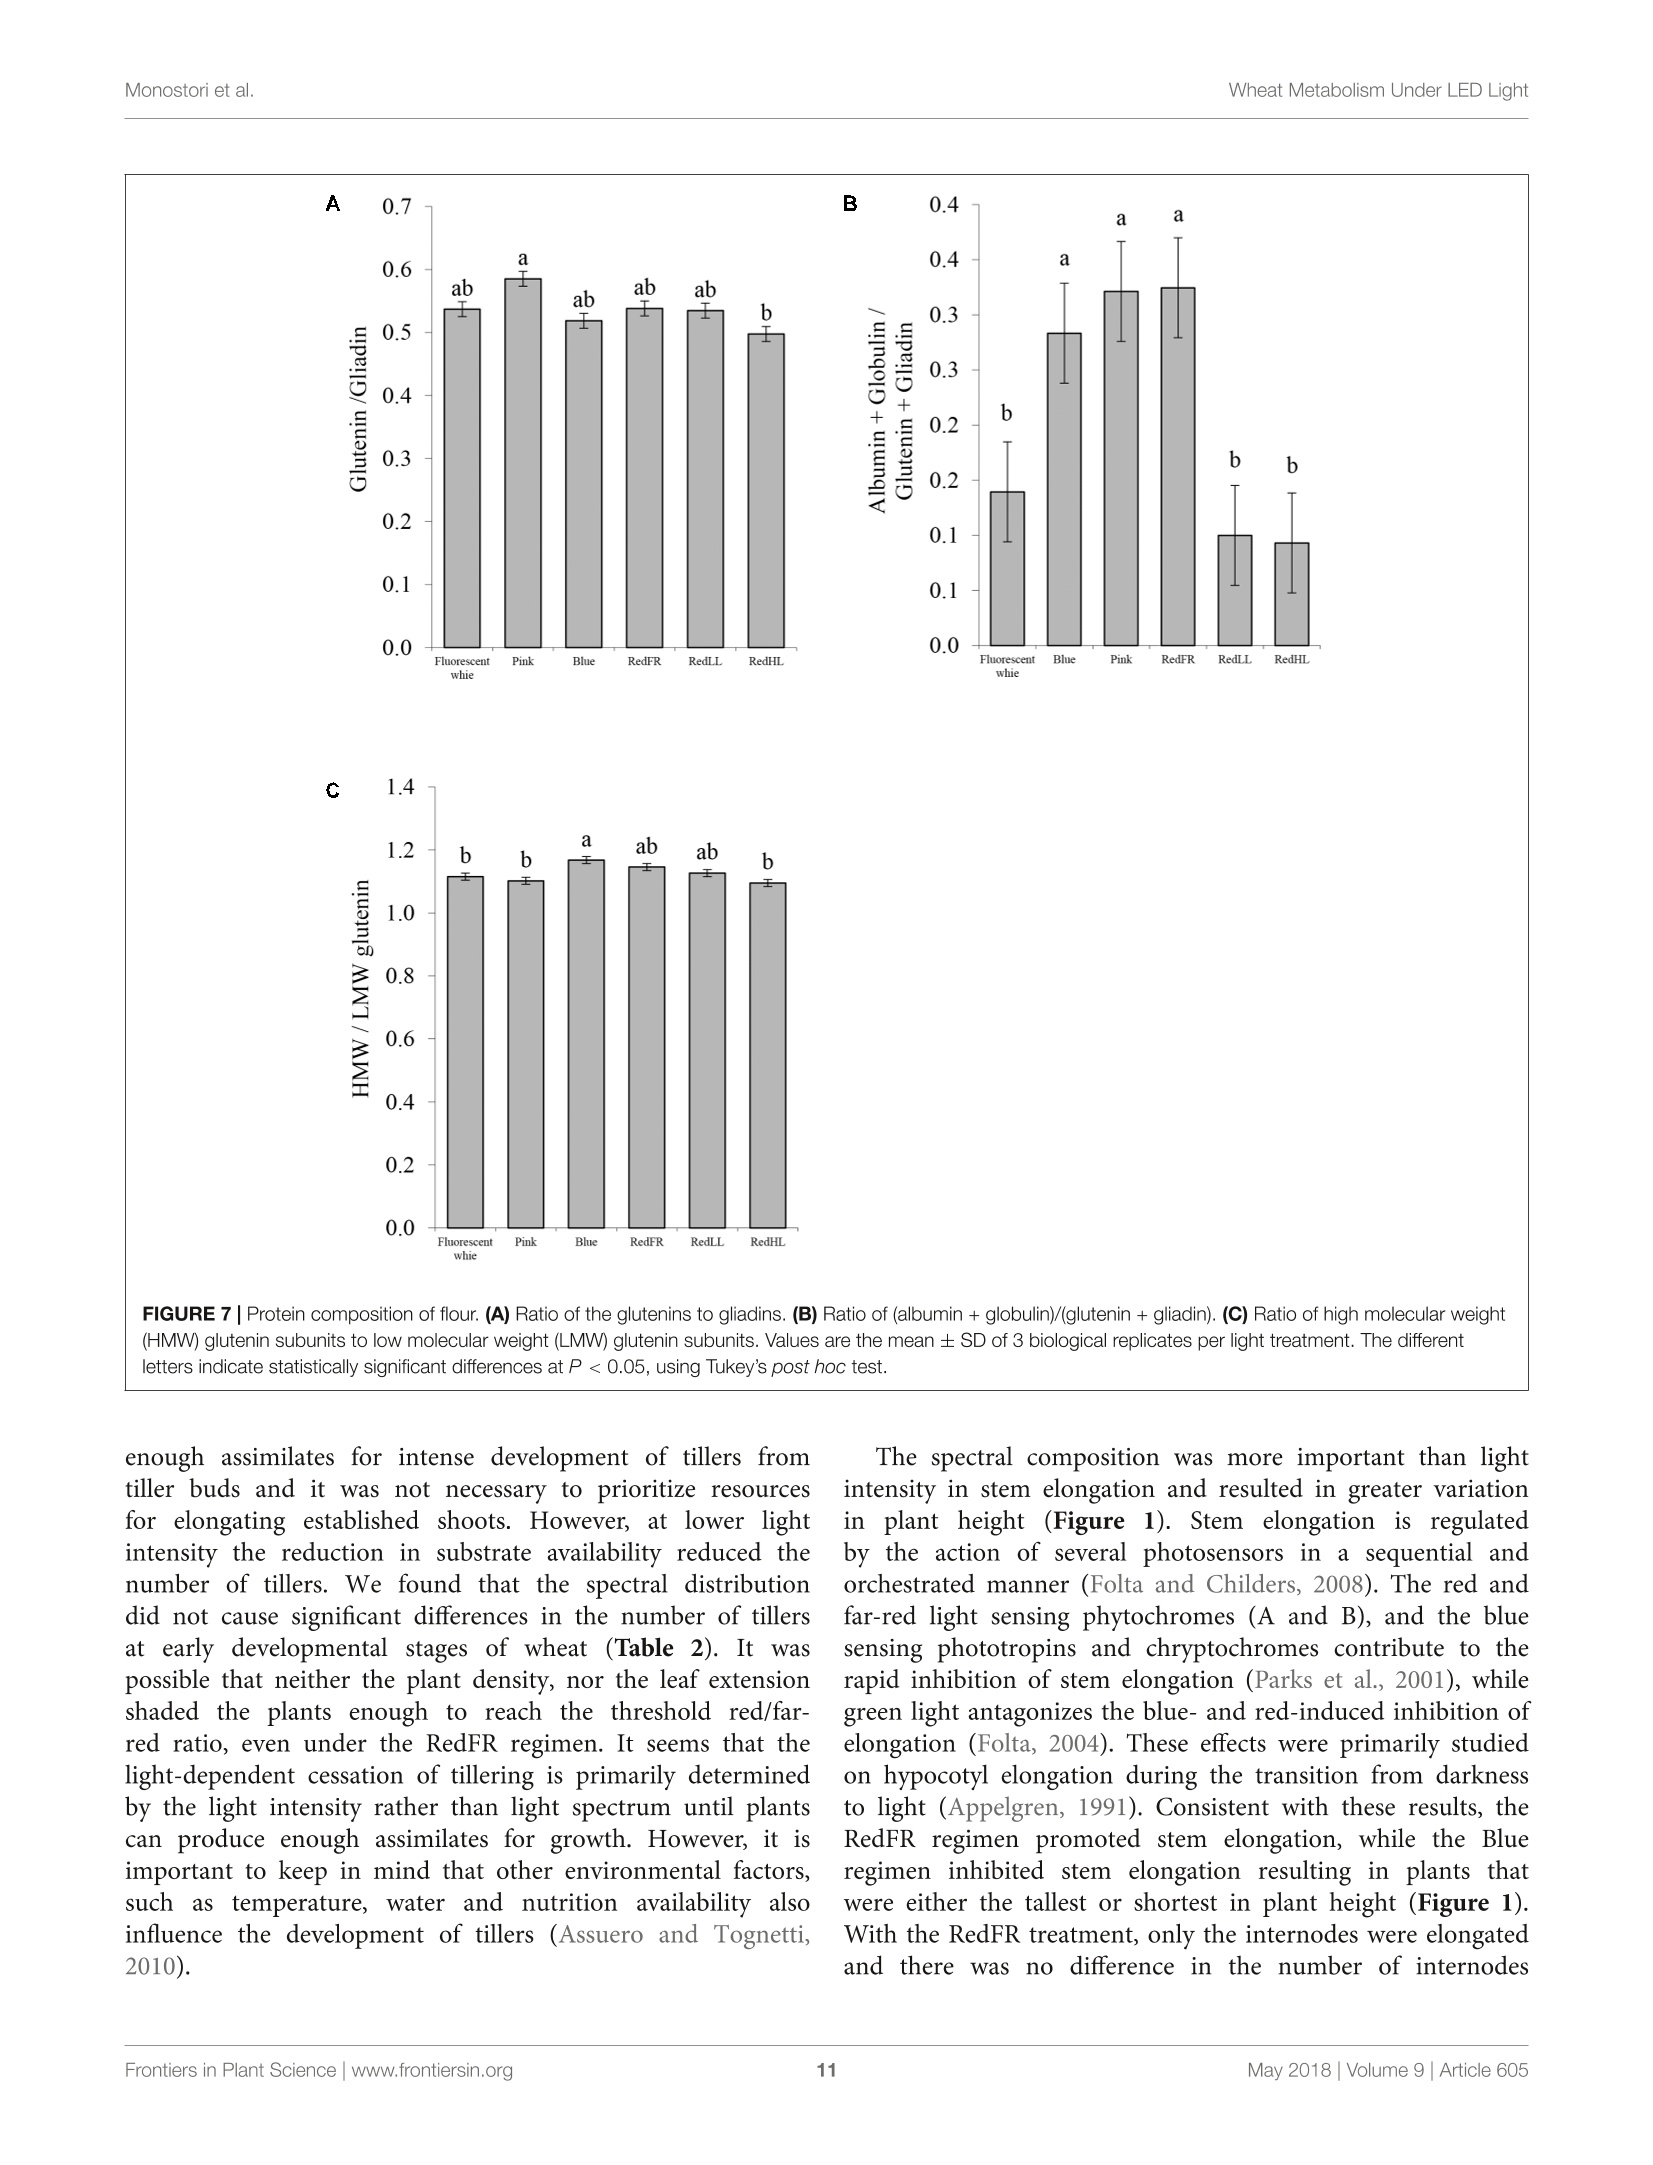
LED照明-通过光谱质量和强度改变小麦的生长、代谢、产量和面粉组成LED Lighting - Modification of Growth, Metabolism, Yield and Flour Composition in Wheat by Spectral Quality and Intensity小麦旗叶中氨基酸含量的测定Determination of Amino Acid Content of Flag Leaves:使用格哈特公司Laboshake LS 500i振荡器,用4ml 10%(v/v)三氯乙酸在室温下提取300 mg样品1小时,测定游离氨基酸含量The amount of free amino acid was determined from 300 mg samples extracted with 4 ml of 10% (v/v) trichloroacetic acid for 1 h at room temperature using a Laboshake LS 500i instrument (Gerhardt, Germany).frontiers in Plant ScienceORIGINALRESEARCH published: 04 May 2018doi: 10.3389/fpls.2018.00605 Monostori et al.Wheat Metabolism Under LED Light 匈牙利科学院农业研究中心农业研究所 OPEN ACCESS Edited by: Francesco Orsini. Universita degli Studi di Bologna, Italy Reviewed by: Francesco Di Gioia. University o f Florida, United Stat e s Evelia Schettini, Universit a degli St u di d i Bari Aldo Moro, Italy *Correspondence: Gabor Galiba galiba.gabor@agrar.mta.hu Specialty section:This a rticle was s u bmit t ed t o Crop and Product Physiology, a sect i on of the journal Frontiers in Plant Science Received: 02 January 2018Accepted: 17 April 2018Published: 04 May 2018 Citation: Monostori l , Heilmann M, Kocsy G, Raks z egi M, Ahres M, Altenbach SB, Szalai G, Pal M, Toldi D, Simon-S a rkadi L , Harnos N, Galiba G and Darko E (2018) LED Lighting -Mo d i f ication of Growth, Metabolism, Yield and Flour Composition i n Wheat by Spectr a l Quality and I ntensity. Front . Plant Sci. 9:605. doi: 10.3389/fpls.2018.00605 LED Lighting- Modification of Growth, Metabolism, Yield and Flour Composition in Wheat by Spectral Quality and Intensity Istvan Monostori1, Mark Heilmann1, Gabor Kocsy1, Marianna Rakszegi1, Mohamed Ahres12, Susan B. Altenbach3, Gabriella Szalai1, Magda Pal1, David Toldi4, Livia Simon-Sarkadi4, Noemi Harnos1, Gabor Galiba1.2* and Eva Darko1 Agricultural Institut e , Ce n tr e for Agricultural R e se a rch , Hungarian Academy of Sciences, Martonv a s a r, Hungary,”F e steti c s Doctoral School, Georgikon Faculty, University of Pannonia, Keszthely, Hungary , Western Regional Research Center, Unit e d St a tes Depar t m e nt of Agricult u r e-Agricultur a l Res e arch Servic e , Alb a ny, CA, Unit e d St a tes, Department o f Food Chemistry and Nutrition, Szent Istvan University, Budapest , Hungary 匈牙利森特伊斯特万大学食品化学与营养系 The use of light-emitting diode (LED) technology for plant cultivation under controlled environmental conditions can result in significant reductions in energy consumption. However, there is still a lack of detailed i nformation on the lighting conditions required for optimal growth of different plant species and t he effec t s of light intensity and spectral composition on plant metabolism and nutritional quality. In the present study, wheat plants were grown under six regimens designed to compare the effects of LED and conventional f luorescent l ights on growth and development , leaf photosynthesis, thiol and amino acid metabolism as well as grain yield and flour quality of wheat. Benefits of LED light sources over fluorescent lighting were manifested in both yield and quality of wheat . Elevated light intensities made possible with LEDs increased photosynthetic activity, the number of tillers, biomass and yield. At lower light i ntensities, blue, green and far-red light operated antagonistically during the stem elongation period. High photosynthetic activity was achieved when at least 50% of red light was applied during cultivation. A high proportion of blue light prolonged t he j uvenile phase, while the shortest f lowering time was achieved when t he blue to red ratio was around one. Blue and far-red l ight affected the glutathione- and proline-dependent redox environment i n leaves. LEDs , especially in Blue, Pink and Red Low Light (RedLL) regimens improved flour quality by modifying starch and protein content, dough strength and extensibility as demonstrated by the ratios of high to l ow molecular weight glutenins, ratios of glutenins to gliadins and gluten spread values. These results clearly show that LEDs are efficient for experimental wheat cultivation, and make it possible to optimize the growth conditions and to manipul a te metabolism, yield and quality through modification of light quality and quantity. Keywords: amino acid, indoor cultivation, glutathione, gluten, LED lighting, photosynthesis, wheat, yield quality INTRODUCTION Plant breeders frequently use indoor cultivation methods to accelerate their breeding projects independently of seasonal outdoor climatic conditions. However, growth chambers or greenhouses ut i lizing art if icial l ight sources, such as f luorescent lamps or metal-halide l amps are often inef f icient due to high operation temperatures, low ef f iciencies of light fluence and inadequate spectral distributions for optimal growth (Schett i ni,2005; Morrow, 2008; Darko et al., 2014). High operation temperatures make it difficult to use fluorescent and metal -halide lamps close to the plants, thus the light intensity cannot be increased to optimal values . In addit i on, the energy consumption of t hese lamps i s relat i vely high. The ut i lization of Light-Emitt i ng Diode (LED) technology can improve the efficiency of indoor plant cultivation (Singh et al.,2015). Combinations of different types of LEDs can provide high fluence and customized wavelengths for plant cultivation. At the same time, LEDs have low energy consumptions, l ong life ti mes and stable spectral dis t ributions (Yeh and Chung, 2009). In spite of t hese advantages, the ut i lization of LEDs in phytotrons for plant cultivation is not prevalent yet. LED l ight systems are mainly used commercially for leafy plants, vegetables, fruits and horticultural plants to optimize plant productivity and quality year round. The importance of light i ntensity and spectral distribution on plant growth and development is evident when plant cultivation is compared under different light environments. Through photosynthesis,l ight, especially blue and red wavelengths provides energy required for plant growth and development, but through photoreceptors, l ight regulates several morphogenetic processes including plant elongation, leaf expansion, stomatal opening, circadian clock and flowering (Chen et al., 2004). At the biochemical level, the light spectra influence both primary and secondary metabolism, affecting nutritional quality, carbohydrate and nitrogen metabolism, the production of f lavor, color, volatile and aromatic compounds, as well as plant defense mechanisms (Colquhoun et al., 2013; Olle and Virsi l e, 2013; Darko et al.,2014). For instance, red l ight decreased nitrate content, while sugar content and the amounts of tocopherols and phenolic compounds were increased in lettuce (Samuoliene et al., 2011,2012). Blue l ight induced accumulation of anthocyanins and increased antioxidant capacity i n lettuce (Li and Kubota, 2009). Moreover, it increased antioxidant activity and ascorbic acid content in cabbage and tobacco, contributing to protection against cucumber mosaic virus infection in tobacco (L i et al.,2012; Chen et al ., 2015). In tomato, blue l ight enhanced antioxidant status and proline accumulation, suppressing the symptoms of gray mold i nfect i on (Kim et al, 2013). Franklin and Whitelam (2007) reported that the modified light quality was also able to attenuate injury caused by abiotic stressors, such as freezing temperatures. For example, the applica t ion of light with a decreased red/far-red ratio increased frost tolerance in Arabidopsis plants via increased CBFgene expression. A short far-red treatment increased the expression level of the CBF-regulon and increased frost tolerance in wheat and barley plants (Gierczik et al, 2017; Novak et al ., 2017). These examples demons t rate that changes of light environment can affect several plant responses and metabolic processes. LEDs thus provide opportunities to manipulate the growth period, plant metabolisms, defense and the amount and quality of plant products (De Salvador et al., 2008; Schet t ini et al., 2011). Wheat is one of the most important crops worldwide and huge research efforts are focused on studying physiological and molecular processes and stress responses. In many experiments, plants are grown under controlled environmental conditions, mainly in p phytotrons that produce different, but mainly suboptimal l ight conditionIsSi i n n either intensity or spectral distribution for cereals . Only a few i nves t igations have examined the growth and development of cereals under LED lighting. In one of the early investigat i ons, (Goins et al., 1997) repor t ed that red LED alone is inadequate for wheat cultivation. Besides blue and red LEDs, the addition of far-red light resulted i n taller plants and higher yield production i n oat and barley (Lethin and Bankestad , 2016). Koga et al. (2013) demonstrated that blue and red LEDs affected the growth, N-metabolism and vitamin C and E contents of young barley plants when compared to natural li ght. Dong et al. (2014) studied suga r , protein and starch contents of wheat grain from plants produced under red, blue and white LEDs . However, they did not examine the breadmaking quality of the resulting flour. In the present work, wheat plants were grown in plant growth chambers using different spec t ral distributions provided by LED light sources a t intensities similar to those produced by fluorescence lamps . The effec t of elevated light i ntensity was also tested, since the LED technology can produce high l ight intensity without heat damage to plants. The objective e s s (of this study were to compare the eff i ciency of LED light sources with fluorescent white light in experimental wheat cultivation and to reveal how the li ght quality and quantity affect wheat growth and development, metabolic processes of flag leaves, grain yield and flour qual i ty. MATERIALS AND METHODS Plant Materials and Growth Conditions A facultative genotype of hexaploid wheat (T. aestivum ssp. aestivum cv. Mv Kikelet) was obtained from the Martonvasár Cereal Gene Bank (Agricultural Institute, Centre f or Agricultural Research, Hungarian Academy of Sciences, Martonvasar, Hungary). Seeds were germinated i n petri dishes between sterile filter papers soaked in MilliQ water for 3 days at 26°C. After germination plantlets with similar root lengths were placed in 4 × 4 cm Jif fy pellets (Ji f fy Group, Oslo, Norway) and stored at room temperature for 2 days. The 5-day old plantlets were subjected to vernalization for 2 weeks at 4°C with a 10/14 h l i ght/dark photoperiod and a Photosynthetic Photon Flux Density (PPFD) of 12 umol m-s -1. Then the plants were grown in pots (diameter 10 cm; height 30 cm; volume 2.81) filled with 2:1:1 (v/v/v) mixture of garden soil, humus and sand . The pots were transferred to growt h chambers (PGV-36; Conviron Env. Ltd., Winnipeg, MB, Canada), programmed wi t h a spring-summer climat i c regimen developed for winter wheat (detai l ed in Supplementary Table 1) for 16 weeks until maturity. During this period, the temperature and duration of illumination were gradually increased with a weekly change of program to simulate spring-summer conditions in the f i eld. The plants were watered daily with tap water through a sprinkler. A nutrient solution containing 41 mg L - N; 7 mg L-1 P205; 21 mg L-1K2O; 4 mg L -Mg; 5 mg L - Ca; and 1 mg L - B, Cu, Mn, Fe, and Zn was applied twice a week to ensure that neither water nor nutrients were limiting. The pots were placed randomly in the growth chambers and rearranged regularly within the treatments. Fifty plants with 45 plants m-2 density we r e grown under each l ight condition. Light Conditions After vernalization, plants having 3 leaves were raised under different light conditions. Six di f ferent light regimens were established using f luorescent lamps (OSRAM Lumilux T5 cool white (4000K) 54W/840 f luorescent tubes) or modu l es equipped with a continuous wide spectrum LED (Philips Lumileds, LXZ2-5790-y) and three narrow bands of LEDs with the dominant wavelengths of 448 nm (Philips Lumileds, LXZ1-PR01); 655nm (Phil i ps Lumi l eds, LXZ1-PA01); 750 nm (Edison Edixeon,2ER101FX00000001). All LED modules were equipped with these LEDs and each type of LED can be independently controlled within the module. The spectral composition of l ight used in the experiments is composed of different combination of LEDs as presented i n t he Supplementary F i gure 1. The most i mportant characteristics o f the light conditions are summarized in Table 1. The different light conditions are referred to according to their typical charac t eristic (except i n the case of RedFR) as described in Table 1. The different l ight conditions are referred to according to thei r typical characteristic (except i n the case of RedFR). The Fluorescence white is a white light provided by fluorescence lamps; the Pink regimen when the blue and red ratio is app.1, similarly as in case of fluorescence lamp. The Bl u e regimen indicates that the blue light i ntensity was at least 3 times higher than the red l ight. In RedLL regimen, the red light is dominant, as it's i ntensity is 5 times higher than the blue one. The RedHL and RedLL regimens differ mainly in the l ight intensity. In case of RedFR regimen, the RedLL regimen i s supplemented with far-red illumination. Methods Determination of Plant Growth and Development The developmental stages of plants were determined on at least 25 plants of each light regimen according to the Zadoks scale from Z13 to Z89 (Zadoks et al., 1974) and the plant height was measured at six t ime points during the light treatment: at 54, 75,94,114, 124, and 134 days of plant cultivation. The flowering time was also recorded. Determination of Photosynthetic Activity of Leaves Under Different Light Condi t ions Photosynthetic activities of plants were determined in growth chambers under each l ight regimen. The measurements were performed on f ive randomly selected f ully developed flag l eaves using a Ciras 2 portable photosynthesis system instrument with a narrow (2.5 cm²) leaf cuvette (PP Systems, Haverhill, MA, United States). The net photosynthetic rate (Pn), stomatal conductance (gs), transpiration rate (E) and intracellular CO2concentration (Ci) parameters were determined at the steady-state l evel of photosynthesis using a CO l evel of 380uLL-1. Photosynthetic electron transport activ i ty was also estimated on 15 intact attached leaves for each light regimen using a PAM-2000 fluorometer (Walz, Effeltrich, Germany). Before the measurements, the plants were dark adapted for 20 min, after which the Fv/Fm parameter (indicat i ng the max i mal quantum efficiency of Photosystem II (PS II)) was determined using a 1.0saturation pulse (PPDF=2000 umol m-2s-). Then plants were l ight-adapted for 20 min and the actual quantum yield of PS II [Y(II)] was determined at the steady state level of photosynthesis. The electrontransport rate (ETR) and the non-photochemical quenching (NPQ) parameter (which re f lects the heat dissipation of excess excitation energy) were also calculated at the steady state level of photosynthesis. Determination of Chlorophyll and Carotenoid Contents of Flag Leaves Chlorophyl l a and b as well as the carotenoid contents of leaf disks were determined using a Cary-100 UV-Vis spectrophotometer (Varian, Middelburg, Netherlands) after extrac t ion i n 80%acetone, according to the method of Lichtenthaler (1987). For each measurement, 5 x 0.2 g leaf disks (13 mm diameter) were collected from several (randomly selected) plants. The samples were stored at -80°C until extraction. Determination of Thiols in Flag Leaves The thiols were measured f rom f l ag leaves (5 (0.2g) after extraction in 0.1 M HCl (1:5). The total thiol content was determined after reduction with dithiothreitol (DTT) and derivatization with monobromobimane as described in Kocsy et al. (2000). For the detec t ion of oxidized thiols, the reduced thiols were blocked with N-ethylmaleimide, after which the excess of N-ethylmaleimide was removed with toluene (Kranner and Gril l ,1996). The oxidized thiols were reduced and derivatized as described for total thiols. Thiols were analyzed after their separation by Reverse-Phase High Performance Liquid Chromatography (RP-HPLC, Waters, Milford, MA, United States) using a W474 scanning fluorescence detector (Waters, Milford, MA, United States). Amounts of reduced thiols were calculated as the differences between the amounts of total and oxidized thiols. 小麦旗叶中氨基酸含量的测定 TABLE 1 | Characte r i stics of l i g h t r egime n s. Fluorescent white LED Pink LED Blue LED RedFR LED RedLL LED RedHL PPFD (400-700 nm) 249 248 250 253 253 499 (umol m-2s-1) PPF (400-750 nm) 5855 5700 5917 5322 5252 10007 (uW/cm2) Blue (400-500 nm) 1451 2215 4402 657 653 1274 Green (500-600 nm) 2280 690 23 1020 1022 2036 Red (600-700 nm) 1841 2443 1490 3346 3437 6424 Far-red (>700 nm) 283 352 2.4 299 140 273 Fraction (%) Blue 24.8 38.8 74.1 12.3 12.4 12.7 Green 38.9 12.1 0.4 19.2 19.5 20.3 Red 31.4 42.8 25.1 62.9 65.4 64.2 Far-red 4.8 6.2 0.4 5.6 2.7 2.7 Ratios Blue: Red 0.8 0.9 3.0 0.2 0.2 0.2 Red: far-red 6.5 6.9 59.6 11 25 24 Blue: far-red 5.1 6.3 176 2.2 4.7 4.7 Energy consumption (kW) 4.69 1.24 1.42 1.09 1.02 2.09 Th e Fluoresc e nt white ref e rs to a whit e light r e gimen provided by fluor e sc e nt lamps . The Pink regimen utiliz e d L ED s with a n e q ual blue and red ratio. In t h e Blu e L E D regimen, t he blue light was dominant and in t h e RedLL and RedHL regimens r e d light was dominant a t 250 pmo/ m-2s-1 a nd 500 umo/ m -2s -1 light i ntensiti e s, respective l y. I n the RedFR regimen red light was complemented with far -red l ight. The total P hotosynthetic Photon F l ux Density (PPFD) was determined with a L i-Cor quantum meter (Li -189, L I-COR, Inc., Lincoln, NE, United States). The spectral energy distribution was determined by a spectroradiometer (UBS4000, Ocean Optics Inc., United States) and the wavelength ratio was calculated with the assumption that blue l ight ranged between 400 and 500 nm, green light between 500-600 nm, red li g ht between 600-700 nm and far -red between 700-750 nm bandwidth integration. The energy consumption was calculated for the whole chamber with the same i lluminated area using a C.A 8230 power and quality analyzer (Chauvin Arnoux Ltd, Dewsbury, United Kingdom). Amino acids in 100 uL-a l iquots were injected into the column, and separated by stepwise gradient elution at 0.30 mL/min, using a Li +-citric buffer system. Colorimetric detection was accomplished at 570 and 440 nm (for Pro) after post-column derivatization with ninhydrin reagent. Determination of Biomass and Yield Production and of Flour Quality and Composition At harvest, the final plant height and total biomass weight, inc l uding straw, leaves and spikes, were determined f rom at least 25 randomly chosen plants in each treatment. The plants were dry with 15% average moisture content. I n addition, the number of spikes per plant and the grain number and weight per plant were determined. The harvest index (the percentage of grain y i eld in total biomass) and thousand weight of grains (TGW) were also calculated. The quality of grains was characterized from the flour milled by the use of a Chopin CD1 Laboratory mill after the seeds were conditioned to 15.5% moisture content . The flour samples were immediately cooled and stored at -20°C unt i l compositional analysis . Starch content of the flour was measured with a Foss Tecator 1241 instrument. The crude protein content was analyzed in duplicate with a Analyzer using the Kjeldahl method, which is consistent with International Association f or Cereal Science and Technolo gy ICC 105/2(1995). The g l uten content and gluten index (GI) were determined using a Perten Glutomatic 2200 instrument (International Association for Cereal Science and Technology ICC 137/1, 1995 and International Association for Cereal Science and Technolog y ICC 155, 1995). Gluten spread was measured according to the Hungarian standard MSZ 6369/5-87 (1987). This parameter provides information about the proteolytic activity of the samples by monitoring changes in the diameter of a gluten ball after 1 h at room temperature. The breadmaking quality of f lour was determined by the Ze l eny sedimentation test based on the sedimentation of flour in a lactic acid solution according to standard protocol International Association for Cereal Science and Technolo gy ICC 116/1, 1995. Size-Exclusion High Performance Liquid Chromatography (SE-HPLC) was used to determine the glutenin, gl i adin and albumi n +globul i n contents us i ng a modification of the Batey et al. (1991) method. Ten mg f lour was suspended i n 1 ml 0.5% (w/v ) sodium dodecy l sulfate (SDS) i n phosphate buffer (pH 6.9) and sonicated for 15 s. After centrifugation, the supernatant was filtered on a 0.45 um polyvinylidene fluoride (PVDF) filter. Analyses were performed on a Phenomenex BIOSEP-SEC 4000column in acetonitrile buffer (0.05%(v/v) trifluoroacetic acid and 0.05% (v/v) acetonitrile) with a running time of 10 min (2 ml/min flow rate). Proteins were detected by absorption at 214 nm. A modified RP-HPLC method of Marchylo et al. (1989) was used to determine the relative amounts of glutenin subunits. The gliadins were extracted with 70% (v/v) ethanol followed by 50% (v/v) 1-propanol. The glutenin polymers were then reduced with buffer [50% (v/ v) 1-propanol, 2M urea and 0.2M Tris -HCl, pH 6.6] containing 1% (w/v) DTT, and alkylated with 4-viny l pyridine. The high-molecular-mass (HMW) and low-molecular-mass (LMW) glutenin subunits were separated on a Supercosil LC-308 (300A, 3.5% carbon, 5 um, 5× 4.6) column. Statistics The measurements S and sample collec t ion ffor analytical investigations were performed on flag leaves or on seeds collected from several (randomly chosen) plants in each treatment. For physiological 1and analytical i investigations, a leastt 5biological repl i cates were used i n each measurement. Grain quality analyses were conducted in 3 biological replicates. In general, the eSPSS 22 statistical l program and Tukey ’s post hoc test were used to determine differences between treatments for all investigated traits. Di f ferent letters indicate significant differences at the P < 0.05 level. The free amino acid concentrations were also analyzed by hierarchical clustering (distance metric : Euclidian distance, li nkage method: average linking clustering) using the MultiExperiment Viewer v4.5program. RESULTS Plant Growth and Development Under Different Light Conditions Effects of light composition and intensity varied with the developmental stage of the plant. In the tillering period (Z20-29), only light intensity affected the numbers of tillers: higher numbers of t illers were observed i n plants grown at high l ight intensities (RedHL,~500 umol m-2s-l ) as compared to plants grown at approx i mately 250 umol m-2 s-1 light intensities (Fluorescent white, Pink, Blue, RedLL, RedFR), irrespective of light quality (Table 2). Later, during the stem extension period (Z30-49), both light spec t ral composition and intensity influenced plant elongation (jointing) and boot i ng. Plants under the Fluorescent white, Pink and RedHL regimens had the earl i est heading dates, followed by Red F R and RedLL and plants grown under the Blue regimen had the latest heading date (Table 2). Significant differences were found only between plants that exhibited the earlies t and latest heading dates. The l atest f lower i ng date a l so was recorded in plants grown under the Blue regimen -this was about 1 week later than that observed in plants grown under the Pink and Fl u orescent white regimens (Table 2). The flowering t i me of plants grown under RedLL did not differ from those grown under the Blue regimen and plants grown under the RedHL and RedFR regimens did not differ significantly from any other light treatments. The heights of plants were greatest when pl a nts were grown under the RedFR regimen and lowest when the plant s were grown under t he Blue regimen (Figure 1). Height differences were not accompanied by changes i n l eaf numbers (data not shown). During r i pening (Z71-89), differences in t he timing of development were not apparent under the different light sources, except under t he Blue regimen , where ri pening finished 4 days l a ter than in other cases (d a ta not shown). Physiological and Metabolic Response of Flag Leaves to Light Environment Effect of Light Conditions on Photosynthetic Activity and Chlorophyll Content of Flag Leaves Light quality and quant i ty affected t he pigment content of f lag leaves (Table 3). High contents of chlorophyll a and b were observed in plants grown under the Fluorescent white and RedHL regimens while significantly lower chlorophylls were found i n t he f lag l eaves of plants grown under al l of the other LED l i ght regimens. Among the low intensity LED light regimens, plants grown unde r the RedFR regimen had significantly lower levels of chlorophy l l a than plants grown under the Blue or RedLL regimens whi l e levels of chlorophyll b were not significantly different. Plants grown under the Fluorescent white and RedHL regimens also had significantly higher carotenoid contents in their f lag l eaves than those grown under the l ow i ntensity LED light regimens. These plants also di f fered in their ratios of chlorophy l ls to carotenoids. CO2 assimilation was also infl u enced by light intensity and quality (Figure 2). The highest CO2 assimila t ion rate was produced by flag leaves of plants grown at high l ight intensity TABLE 2 | The nu mber of tillers, head i ng date and f l o weri n g ti m e of plants grow n u nder di f fe r en t l ig h t co n ditio n s. Light regimen No. of tillers Heading date² (No. of days) Flowering time° (No. of days) Fluorescent white 3.86 86.9 93.2b Pink 4.08 87.0 94.3D Blue 4.2b 91.9 100.24 RedFR 4.03D 89.2ab 97.1ab RedLL 4.04 89.5ab 98.6a RedHL 5.24 88.2b 95.3ab 1Deter m ined after 33 d a ys o f cu ltivati o n in Phytotron chamber s . 2Age of plan t s w hen heads st a rt ed to e merge from t he "boo t ”(Z 50) in 50% of the spik e s. 3Ag e o f plants when a nth e sis s tart e d in the 50% of the main spikes (Z60). Valu e s a r e th e m e a n ± SD of a t l ea st 25 plants pe r light tr e atment . The diffe r ent lette r s i ndi c at e statistic a lly signific a nt differenc e s at P <0.05, using Tukey's post hoc t e st . FIGURE 1 | The a ve r ag e plan t h e i gh t du ri ng de velopment un der dif f e r en t lig ht regi m ens. Values r e p r esent t he mean ± S D of at l east 25 p la nt s pe r light treatment. The r esults of statistical analysis are presented in Suppleme n ta r y Table 2. TABLE 3|Chlorop h y ll a a n d b and carote n oid co n tent of fl a g leaves grown under different light co n di t ions. Chlorophyll a Chlorophyll b Chlorophyll a/b Chlorophyll a+b Carotenoid ChlorophylI/ Carotenoid Fluorescent white 2817±274a 698±70a 4.04±0.09a 3515±356a 594±80a 5.92±0.40a Pink 1890±142bc 463±35b 4.08±0.18a 2353±334bc 434±36bc 5.42±0.64ab Blue 2113±222b 508±56b 4.16±0.26a 2622±277b 478±59bc 5.49±0.77ab RedFR 1723±173c 464±57b 3.71±0.19b 2187±230c 414±40c 5.28±0.49ab RedLL 2045±91b 494±16b 4.14±0.36a 2539±105b 492 ±23b 5.16±0.65ab RedHL 2740±70a 694±31a 3.95±0.10ab 3434±98a 692±71a 4.96±0.60b T he values are means ± SD of 5 replicates per l ight treatment. Different l etters i ndicate statistically significant differences at P <0.05, using Tukey's post hoc test. FIGURE 2|CO2 assim il ation r ate (Pn) and stomatal cond u ctance (gs) meas ur ed on fl ag l eaves grown under different l i ght regimens. Values are the mean ± SD o f a t le ast 5 measu r ements p er l i ght t r eatment. T h e different letters i ndicate sta t istically significant diff er e n c e s at P <0.05, u sin g Tukey's post hoc test. (RedHL). At l ow light intensities the photosynthetic activity of leaves was highe r when the plants were grown under Pink, RedLL and RedFR regimens as compared to those grown under the Blue regimen. In spite of the low CO2 assimilation rate, stomatal conductance (gs) remained high when the plants were illuminated with Blue l ight, similar to levels observed under t he RedHL. However, t hei r values were not significantly higher t han those in Pink, and RedLL regimens. Low gs values were detected when plants were grown under the Fluorescence white regimen. Fluorescence quenching analyses revealed differences in the ac t ivity of PS II among the treatments (Table 4). The maximum quantum yield of PSII (Fv/Fm 1parameter) did not differ significantly (the average Fv/Fm was 0.785 ± 0.04), indicating that none of the growth conditions had photoinhibitory effects (data not shown). However, the actual quantum yield [Y(II),△F/Fm], the electron transport rate (ETR) and heat dissipation process (NPQ) changed depending on the l i ght quantity and quality. Not surprisingly , the lowest value of AF/Fm’ and the h i ghest values of ETR and NPQ were detected on f lag leaves in pl a nts grown under the RedHL regimen . In plants grown at low light intensit i es, higher Y(I I ) and ETR and lower NPQ were detected on f lag leaves illuminated with the Pink, TABLE 4|Flu o rescence quench i ng parameters , incl u d i ng t h e act u a l q u antum y iel d [Y(1)] of PS I l , t h e n on-photochemical qu enchi n g (NPQ) parameters an d t h e ele ct ro n tran sport rate (ET R) determin e d a t st e a dy sta t e of ph otosynt h esis of fla g l eaves u nder different l ight regimes. Light regimen Y(II) NPQ ETR Fluorescent 0.61±0.016b 0.29±0.013b 63.10±2.764c white Pink 0.64±0.027ab 0.24±0.024c 73.40±2.679b Blue 0.60±0.018b 0.31±0.022b 65.74±2.012c RedFR 0.69±0.031a 0.20±0.032c 74.27±2.995b RedLL 0.68±0.028a 0.22±0.039c 71.72±3.600bc RedHL 0.50±0.020c 0.49±0.045a 94.22±4.800a The values are means ± SD of 20 measurements per l ight treatment. Different letters i ndicate statistically significant differences at P <0.05, using Tukey ’s post hoc test . RedLL and RedFR than by the Blue and Fluorescent white regimens . Effect of Light Conditions on Thiol Levels of Flag Leaves The light regimens affected the thiol levels, including the amounts of cysteine, the precursor of glutathione (GSH), y-glutamylcysteine (yEC), an intermediate product in GSH synthesis, and glutathione in flag leaves. In spite of the fact that there were no signi fi cant differences in the reduced form of cysteine between the di f ferent light regimens, the tota l amount of cysteine was greater in plants grown under the RedFR regimen than in plants grown under Fluorescent white, Pink, Blue and RedLL regimens (Figure 3A). The cysteine level i n leaves of plants grown under RedHL regimen did not differ significantly from any other group (Figure 3A). The concentration of the oxidized form of cysteine was signi f icantly lower in RedFR regimen compared to Blue and RedHL ones. These changes resulted in an increase in the ratio of reduced and oxidized forms of cysteine i n leaves of plants grown under RedFR regimen. Among the t hree investigated thiols, the greatest light-dependent variation was detected for y-glutamylcysteine (yEC)(Figure 3B). The highest concentration of yEC was found in flag leaves from plants grown under the RedHL regimen and the lowest in those grown under Pink regimen. In addition, t he proportions of reduced and oxidized forms of yEC were affected by the l ight conditions. In plants subjected to Fluorescent white, FIGURE 3|E f f e cts of l i ght spectral dist r ibut i on and lig h t i ntens it y on t hiol l evels and forms. (A) Cyst ei ne. (B) y -glut a m yl cys te ine (y E C). (C) Gl u t a thione. V a lues ar e t he mean ± S D of 5 bio l ogical replicates per l i ght treatmen t . T he differe n t let t ers in dicate statis ti cally signif i cant dif f e r ences at P <0.05, u sing T u key's post hoc test. Blue, RedLL and RedHL regimens, this ratio was small , while in plants produced under the Pink and RedFR regimens i t was high. The l owest l evel of total glutathione was found in f lag leaves of plants grown under RedLL (Figure 3C). While the amount of reduced glutathione (GSH) was not significantly influenced by light regimens, the concentration of i ts oxidized form (GSSG) was significantly lower in the Pink and RedFR regimens as compared to the Fluorescent white and Blue regimens. However, the values did not differ signi fi cantly from the RedLL and RedHL regimens. The light-induced differences in oxidized glutathione contents led to significantly higher ratios of reduced and oxidized forms of glutathione (GSSG/GSH) in the Pink and RedFR regimens compared to the other ones. Effect of Light Conditions on Amino Acid Contents of Flag Leaves The light quality and quantity affected both the amount and the composition of the f ree amino acids i n flag leaves (Figure 4and Supplementary Table 3). Low amounts of free amino acids were detected in leaves of plants grown under the Blue and RedLL regimens, while the highest amounts of free amino acids were found in plants grown under high i ntensity l ight (RedHL). GABA, Ser, Asp and Ala were the most abundant amino acids in leaves, encompassing approximately 60% of all amino acids, and their proportions were similarly affected by the various light conditions. Based on hierarchical cluster analyses, free amino acid concentrations of flag leaves were the most di f ferent under the Blue regimen (Figure 4). In addition, under the Fluorescent white, Pink and RedHL treatments (grouped together) the amounts of Val, Leu, Thr, Lys, Ser and GABA in f lag leaves were greater than those of the other three light regimens. Amino acids belonging to the same family were differentially affected by spectrum since they clustered i nto different groups. For example, in t h e glutamate family (about 35% of total free amino acid content i s covered by this family) the concentration of Pro was high under the Blue regimen, while low values of Glu, Gln and Arg were found, but inversely, high amounts of Glu, Gln and a low amount of Pro were detec t ed under the RedFR regimen. Only amino acids belonging to the pyruvate family (Ala, Val, Leu) were similarly a f fec t ed by the same l ight condi t ions - high amounts of all three amino acids were detected in plants grown under Fluorescent white , Pink and RedHL regimens, while low amounts were found in pl a nts grown under Blue and RedLL regimens. Determination of Yield Components, Flour Quality and Composition Changes i n growth, development and metaboli s m V were manifested in the yield production and the quality of the flour (Table 5). The RedHL regimen had the greatest effec t s on biomass, grain number and grain yield when compared to pl a nts grown under lower light intensity, irrespective of light spectra (Table 5). The e le vated light intensity i n creased both the straw (biomass - grain y i eld) and grain production, result i ng in similar harvest index as was found for the F lu orescent white regimen. Since the high light intensity enhanced t illering, the high grain yield is mostly due to elevated spike number; however, the average number of gra i ns (32.6 ±6.3) per spike was a l so the highest under this regimen. Under low light intens i ties, the RedFR and Pink regimens resulted in the greatest grain number and the RedFR regimen resulted in the greatest weight. Re t ardation of growth in plants under the Blue regimen resulted in the lowest values of spike number, grain number and grain weight; however the difference is not always signi f icant from other light regimens (Table 5). Interesting l y, the plants grown under the Fluorescent white regimen produced a low number of grains with re la tively high weights, result i ng in a TGW that was similar to plants grown under the Red HL regimen (Table 5). Detai l ed analyses of compositional and processing quality traits of the grains revealed that the light quality significantly affected the composition and the quality of t he f lour (Figure 5). The starch content of flour was the lowest, while protein content was the highes t in plants grown under the Blue regimen (Figure 5). Plants grown under the Pink and RedLL regimens also had higher protein contents than those grown under Fluorescent white regimen (Figure 5B). Similarly, the gluten content of the flour was highest i n plants grown under the Blue regimen. Flour produced under the Pink and RedLL regimens also had higher gluten contents than that produced unde r the Fluorescent white regimen (Figure 6A). Light-i nduced differences were apparent in the processing properties of the flours as characterized by the gluten index, gluten spread and Zeleny sedimentation i ndex . The gluten index, relating to the quantity of the larger protein polymers TABLE 5|Biomass a n d y i e l d production of wheat grown un der di f fe r e nt l ig h t regimens. Light regimen Biomass (g/plant) Spike number per plant Grain number per plant Grain yield (g/plant) TGW Harvest-Index Fluorescent white 8.33±1.40bc 3.86±0.78bc 105.2±21.42cd 3.18±0.62bc 30.61±5.36a 38.68±4.64a Pink 8.94±1.62b 4.31±0.92b 118.2±33.01bc 2.95±0.71cd 24.27±4.21b 32.41±5.82b Blue 7.77±1.17c 3.64±0.69c 95.9±25.04d 2.56±0.55d 27.08±4.98b 32.69±4.39b RedFR 9.14±1.43b 4.83±0.80a 133.5±31.48b 3.45±0.81b 26.31±4.58b 37.35±7.91a RedLL 8.58±1.55bc 4.10±0.88bc 115.1±31.05c 2.73±0.68cd 24.21±3.91b 31.71±4.61b RedHL 12.03±1.68a 4.89±0.83a 159.4±28.59a 4.79±1.00a 30.24±5.10a 39.70±5.77a The values are means ± SD of at least 25 replicates per l ight treatment. Different letters indicate statistically significant differences at P < 0.05, using Tukey’s post hoc test. TGW, thousand weight of grain. FIGURE 5|Composit i onal proper t ies of wheat f l our produced u nder different light regimens. (A) Starch conten t (%). (B) Protei n content (%). Values are the mean ± SD of 3 bio l ogical replicates per light t reatme n t. T he diffe r e n t l et t ers i n dicate s t atist i cally signif i ca n t dif f erences at P <0.05, u sing Tukey's post hoc t e st. and dough strength, was higher when the plants were grown under the RedFR regimen and lowest under the Blue regimen Supplementary Figure 2). The spread of the gluten showed considerable variation. The RedLL regimen had the largest effect on the gluten spread, significantly increasing it compared to t he Fluorescent white regimen. The Blue, Pink and RedHL regimens also affected the spread of the gluten indicating greater dough extensibility/softening of these samples (Figure 6B). The Zeleny sedimentation provides an indication of the breadmaking quality of the flour and increased when the Zeleny sedimentations of flour from plants grown under the Blue, Pink and RedLL regimens were significantly higher than those grown under the Fluorescent whi t e or RedFR regimens (Figure 6C). These resu l ts suggest that starch, protein and gluten content can be modified and breadmaking quality can be improved by an appropriate selection of light. To understand the basis for changes in processing quality, flour protein composition was also i nvestigated (Figure 7). Signif i cant differences in t he ratios of the glutenins to gliadins were found only between the Pink and RedHL regimens, with the highest value in the case of the Pink regimen. The higher value is related to greater dough strength and better breadmaking quality of the f lour (Figure 7A). The proportions of water-soluble proteins (albumins and globulins) were significant l y higher in f lour from plants grown under the Pink, Blue and RedFR regimens than in those grown under other conditions (Figure 7B). Furthermore, the ratio of the high and low molecular weight glutenins (HMW/LMW) was higher in samples produced under the Blue regimen than those produced under the Fluorescent white, Pink and RedHL regimens (Figure 7C). DISCUSSION The Efficiency of LED Lighting on Cultivation of Wheat LED lighting offers several advantages over fluorescent lighting for controlled growth environments. First, higher light intensities can be utilized without generating excess amounts of heat. Second, LED light i ng results in ssignificantly less energy consumption, particularly when used at similar light intensities. The elevated light intensity provided by the LEDs resulted in increased biomass and yield, mainly due to the elevated photosynthetic activity of plants (Figure 2 and Table 5). Indeed, increases of 40% i n biomass and 60% in yield were obtained with 55% l ess energy consumption using LED rather than fluorescent lighting (Tables 1,5). However, energy savings were FIGURE 6| Processi n g qual i ty cha r acterist i cs o f flour . (A) Wet gluten content (%). (B) Gl ut en spread (mm). (C) Ze l eny sedimentat i o n (ml). Values are t he mean ± SD o f 3 biological replicates per l i gh t t rea tm e nt . The different letters i ndica t e stati s t i cally significant differe n ces at P <0.05, u si n g Tuk e y's post hoc tes t. even greater when LEDs were used at comparable light intensit i es (~250 wmol m-2s -1) as the fluorescent white lamps while biomass was similar or higher. These results clearly demonstrate the benefit of LEDs over conventional fluorescent white l i ght sources. The Effect of Light Quality and Quantity on the Plant Growth, Development and Metabolisms Growth and Development The l ight environment affects morphogenetic responses of plants, including shoot branching or tillering, stem elongation and induction of f lower i ng. These responses are mediated by several photoreceptors, such as phytochromes that are mostly sensitive to red/far-red ratios, blue receptors and photosynthetic pigments (De Salvador et al., 2008). Shoot branching is inhibited when tiller buds are shaded ei t her by l e af extension, plant density or crop canopy (Smith and Whitelam, 1997). This phenomenon is related to increases in the proportion of far-red light and mediated by the phytochromes (Kebrom et al., 2006; Finlayson et al ., 2010). Evers e t al. (2006) reported that when the red/far-red ratio decreased below a certain threshold, t iller appearance ceased in spring wheat. However, the threshold depended on the l ight intensity. In our experiments, at early developmental stages, light i ntensity was the dominant factor affecting shoot branching (Table 2). The high number of tillers contributed to a greater production of spi k es and resulted in a yield increase in plants grown under the RedHL regimen. Similarly, when effects of light intensity and spectral distribution were studied in ryegrass, the number of tillers were significantly higher in plants grown at high light i ntensities than those at low intensit i es regardless of the red/far-red ratio (Gautier et al., 1999). In these cases, the high light intensity provided FIGURE 7| P rotein compositio n of f lour. (A) Rat i o of t he gluteni n s t o gliadins . (B) R atio of (albu m in + glo b u l in)/(gluten i n+ gl i ad in ). (C) R atio of h i gh molecu l a r we i ght (HMW) gluteni n subunits to low mo lec ul ar weig h t (LMW) gl u tenin s u b u nits. Val u es are the m ean ± SD of 3 b i o l og i cal r ep li cates pe r light treatment. The diffe r e n t letters i ndicate statistically significant differences at P <0.05, using Tukey’s post hoc test . enough assimi l ates for intense development of t i llers f rom t i ller buds and it was not necessary to prioritize resources for elongating established shoots. However, at lower l i ght intensity the reduction in substrate availability reduced the number of ti l lers. We found that the spectral distribution did not cause significant differences in the number of tillers at early developmental stages of wheat (Table 2). It was possible tha t neither the plant density , nor the leaf extension shaded the plants enough to reach the threshold red/far-red ratio, even under the RedFR regimen. I t seems that the light-dependent cessation of t i llering is primarily determined by the light intensity rather than l i ght spectrum until plants can produce enough assimilates for growth. However, it is important to keep in mind that other environmental factors, such as temperature, water and nutrition availability also influence the development of tillers (Assuero and Tognetti,2010). The spectral composi t ion was more important than light intensity in stem elongation and resulted in greater variation in pl a nt height (Figure 1). Stem elongation is regulated by the ac t ion of several photosensors in a sequential and orchestrated manner (Folta and Childers, 2008). The red and far-red light sensing phytochromes (A and B), and the blue sensing phototropins and chryptochromes contribute to the rapid inhibition of stem elongation (Parks et al., 2001), while green light antagonizes t he blue- and red-induced inhibition of elongation (Folta, 2004). These effects were primarily studied on hypocotyl elongation during the transition from darkness to light (Appelgren, 1991). Consistent with these results, the RedFR regimen promoted stem elongation, while the Blue regimen inhibited stem elongation resulting in plants that were either the tallest or shortest in plant height (Figure 1). With the RedFR treatment, only the internodes were elongated and there was no difference in the number of internodes (data not shown), similar to the findings of (Kim S.J . et al.,2004). Interest i ngly, the Pink, RedLL and RedHL regimens resulted in plants of similar heights, indicating that the l i ght intensity and red light pl a y marginal roles in stem elongation. It should be mentioned, however, that the spec t rum of the Blue regimen cons i sted of blue and red light between 400-500 nm and 600-700 nm, respec t ively; while the intermediate region (between 500 and 600 nm) was absent (Supplementary Figure 1 and Table 1). In other radiation regimens, inc l u ding the Fluorescent white regimen, the spectra al s o contained the green region. These results confirm that the low fluence of blue light and high proportion of far-red light activate the typical shade avoidance syndrome during SI stem elongation. The antagonist effect of green light on growth inhibition was also observed. Light quality, quantity and duration control flowering through the interaction of numerous photoreceptors inc l uding phytochromes, chryptochormes and photosynthetic pigments. Some of them operate antagonistically as t h e detailed mechanisms are discussed by (Lin, 2000; Thomas, 2006). In this way , blue , red and far-red l ight af f ect flowering. In our experiments, we found that both heading date and f lowering time were delayed when plants were grown under the Blue regimen(Table 2), which may be due to a decrease in assimilate production. High l i ght intensity did not accelerate the flowering time, suggesting that l i ght quantity plays a lesser role in complex f lowering signals. The shortest f lowering times were detected in plants grown under the Fluorescent white and Pink regimens, where the blue and red ratio was around one, however they did not di f fer significantly from RedFR and RedHL regimens (Table 2). It is possible that the relative proportion of blue and red may also affect the flowering time. Pigment Composition and Photosynthetic Activity of Plants Photosynthetic pigments absorb and convert the light energy i n to chemical energy via complex photosynthetic machinery. Blue and red irradiations play an active role in photosynthesis and also stimulate chlorophy l l and carotenoid biosynthesis (Fan et al .,2013). In the present study, light intensity caused the largest effects on photosynthetic processes, which were manifested in elevated CO2 assimilation capac i ties, decreases in the conversion ratio of absorbed l ight energy to photochemistry in PS I I , as indicated by the low Y(II) value, and increases i n hea t dissipation as detected by t he high NPQ. However, spec t ral composi t ion also modif i ed both the CO2 assimilation and the electron transport processes at low light intensity. A relatively high photosynthetic activity (Pn) was achieved with high red irradiation contribution (at least 50%), without over-excitation of PS II , as the high Y(I I ) and low NPQ parameters indicated, especially when far-red irradiation was applied (Table 4). Similar resul t s were found by (Zhen and van Iersel, 2017). In contrast to red light application, low Pn and high NPQ values were detected when blue l ight was dominant. These data i ndicate that the high proportion of blue irradiation (above 70%) is not the most efficient for either CO2assimilation (i n spite of the fact that the stomata are opened), or photosynthe t ic electron transport processes. Blue light may overexc i te PSI I reac t ion centers resul t ing in lower photochemical util i za t ion of absorbed l ight energy (low Y(II)) and higher heat dissipation of excess l ight energy (high NPQ), similar to what is observed under high light intensi t y. A similar conclusion was obtained by Ho g ewonin g et al . (2010), when the effects of blue i rradiation were studied on cucumber plants grown under different combinations (0-100%) of red and blue l ight . In other studies , the high proportion of blue l ight also caused a decrease in CO2 assimilate (Kim H.H. et al., 2004; Ho gew oning et al.,2010). I t has l ong been known that bright, blue and red lights induce stomatal opening (Assmann, 1993); however, blue light i s more ef f icient than red (Kim H.H. et al., 2004). When different Arabidopsis mutant plants were used, Talbot t e t al . (2003) found that the blue light-speci fi c stomatal opening could be reversed eithe r by green light or by far -red l ight, which was mediated by phytochromes. We also found that the RedHL and Blue regimens induced stomatal opening, while the stomata were more closed unde r the RedFR and Fluorescent white regimens. It seems that neither the red/far-red, nor the blue/red ratio correlated to stomatal movements. Rather the low blue/far-red ratio, as calculated 2.17 for Fluorescent white and 2.77 for RedFR regimens, induced a slight stomatal closure (Table 1 and Figure 2). Interes t ingly , less photosynthetic pigments, chlorophylls (a +b) and carotenoids were synthesized when LEDs were used for illumination as compared to fluorescent white light, with the exception for RedHL. This phenomenon was also observed by Wa ng (2015). Simi l arly, the lowest chlorophyll (a and b) content were obtained under RedFR regimen as also found by Li and Kubota (2009), however, i t was not different signi f icantly from Pink regimen. The relat i ve proportion of chlorophy l l b was higher under the RedFR regimen, while the proportion of carotenoids increased in plants grown under the RedHL as compared to other LED regimens. These changes may correlate to phytochrome (PFr) mediated inhibi t ion of chlorophyll biosynthesis as found by Ina gak i et al. (2015) or to a l i ght-induced accumulation of carotenoids to protec t the photosynthetic apparatus under brigh t l ight (Steiger et al., 1999). Changes in Redox Homeostasis and Free Amino Acid Content Under Different Artificial Radiation Glutathione i s a central component in regulationand maintenance of cellular thiol redox homeostasis and plays important roles in plant development (Cejudo et al, 2014). Although the pool sizes of glutathione were slightly, but not signi f icantly affected by the various light regimens in our exper i ment, the ratios of reduced to oxidized forms were significantly higher in Pink and RedFR regimens than in other regimens. The high proportion of reduced glutathione ensures the e f fective removal of excess H2O2, which is one of the reactive oxygen species (Foyer and Noctor , 2011). Although plants grown under RedHL exhibited great format i on of yEC which is the rate l imiting step in GSH synthesis, a simultaneous great GSH accumulation was not observed, indicating its further metabolism. It seemed that among the ar t ificial radiation tested, the far-red i llumination affected mainly the ratio of reduced to oxic rms s of glutathione and y-glutamylcysteine. These results also proved that the spectral conditions af f ect the GSH/GSSG ratio. Its ma i ntenance is very important for the control of the cellular redox environment affecting many redox-dependent metabolic processes Ssuch c as the Calvin cycle, starch metabolism and lipid synthes i s, as indicated by Geigenberger and Fernie (2014). A direc t involvement of GSH in the control of physiological processes by light conditions is possible through a glutathione S-transferase i nteract i ng with t he far-red insensit i ve 219 protein since the expression of the gene encoding this glutathione S-transferase proved to be differential l y regul a ted by f ar-red l ight and other spectral components (Chen et al., 2007). In the light regul a tion of metabol i c processes, GSH is interconnected with other redox compounds such as t hioredoxins and glutaredoxins t hrough ferredoxins and NADPH and involved i n photosynthetic electron transport (Dietz and Pfannschmidt, 2011). Both past and present studies suggest t hat alterations in red/far-red ratios are very important in the control of these processes. Nitrate-assimilation and incorporation of N into amino ac i ds need both reducing capacity and energy derived from photosynthesis, therefore the effect of light conditions on metabolism can be monitored by measuring free amino acid levels. T hei r avai l ability i s i mportant for the synthesis of proteins and several other metabol i tes. The greater photosynthetic activity that was induced by the higher l ight intensity of the RedHL regimen was accompanied by a greater total free amino acid content. At low intensity, the high red/far-red ratios of the Blue and RedLL regimens were associated with lower total free amino acid contents compared to other spectral conditions. These results i ndicate that the amount and t he ava i lability of free amino acids for t he synthesi s of proteins and other metabolites depend on the quantity and quality of radiation. Interestingly, within biosynthetic fami l ies, the amounts of amino acids were affected differently by the light conditions. This also indicated the importance of the spectral conditions in the adjustment of the levels of the individual free amino acids. Their amounts can also regulate the levels of several metabolites synthesized from individual amino acids. Glu has a central role in metabolism as a precursor of GSH, Pro and polyamines through Arg. Accordingly , the greater Pro content was accompanied by lower Glu content in plants grown under the Blue regimen compared to the other spectral regimens except for Pro in RedHL and Glu in Fluorescent white regimens. The Pro level was greatly affected by light regimens as shown by its fourfold greater concentration in plants grown under the Blue regimen rather than the RedFR regimen. A similar large l ight-induced variation in Glu content was observed indicating a possible coordination of the metabolism of these two amino acids. The greatest Pro content in whea t was observed under the Blue regimen. Blue irradiation also i ncreased Pro content in tomato (Kim et al .,2013). Other evidence for t he regulatory role of light spectrum on Pro was found i n Arabidopsis i n which red light sensing phytochromes were found to control the Pro content (Yang et al., 2016). The light -dependent adjustment of Pro content during grow t h and development under various environmental conditions could be very important since it is a multifunctional amino acid part i cipating in the control of signaling, energy status, osmotic and redox condi t ions (Szabados and Savoure, 2010). The Effect of Light Quality and Quantity on the Flour Quality and Composition Previous studies showed that low light i ntensity can affect starch granules result i ng in a decline in the grain yield and starch content of the kernels (Li et al.,2008). Furthermore, B-type starch granules (<9.9 um) proved to be much more sensitive to shading during the grain filling period than A-type granules (>9.9 pm)(Li et al., 2008). Dong et al. (2014) showed that the soluble sugar content of the grain and the accumulation of carbohydrate decreased when narrow spectra such as red or red and blue l ights 一 were used. The accumulation of starch under the blue light was less in comparison with that i n the red light . The same authors also stated that white light can provide good quality and high yield . In this study i t was found that the Blue and Pink regimens had the greatest effect on f lour quality. The starch content of flour decreased probably due to the reduced CO2 assimilation capacity of leaves in plants grown under Blue regimen as compared to other light regimens, in agreement with previous studies (Figure 5A), (Dong et al., 2014). Protein accumulation was not in h ibited so much when the plants were grown under the Blue regimen, so the protein and gluten content and the Zeleny sedimentation increased (Figures 5B, 6). Furthermore, Pink and RedLL regimens also increased the protein and gluten content, gluten spread and Zeleny sedimentation as compared to the Fluorescent white regimen. Interestingly RedLL had the greatest effect on gluten spread. Gluten proteins have crucial importance in breadmaking performance of wheat flour as they determine dough strength and elasticity by forming a protein network. The quality of the gluten protein network affects the strength and extensibility of the dough, which determines i ts gas holding capacity and therefore defines bread volume. The more extensible dough has higher gluten spread, which also provides information about the proteolytic activity of the dough. Baking quality is characterized by the Zeleny sedimentation that shows how the flour sediments in a lactic acid solution after hydration and swelling of f lour components. As demonstrated by the Zeleny sedimentation, the Blue, Pink and RedLL regimens resulted in an improvement in breadmaking quality f rom milling (>35 ml) to premium (>45 ml) quality of flour (Figure 6C). Protein composition was also affected by light (Figure 7). The ratio of the HMW and LMW glutenins and the ratio of the soluble proteins related to insoluble proteins (Alb + Glob/Glu +Gli) increased in plants grown under the Blue regimen, while the Glu/Gli ratio increased under the Pink regimen, indicating that there were positive changes in the protein composition and processing quality of wheat. Although both the strength and the extensibility of the dough increased as suggested by the HMW/LMW, Glu/Gli and the gluten spread values, they ultimate l y contributed to the improvement of breadmaking quality, as i ndicated by the Ze l eny sedimentation. The RedLL regimen moderatel y i nfluenced the composition and quality traits of the grain by increasing protein and gluten content, gluten spread and the Zeleny sedimentation as compared to Fluorescent white regimen. Interestingly, in spite of the fact that the high light intensity provided by LEDs with RedHL regimen resulted in elevated biomass and yield produc t ion, the RedHL regimen caused the smallest effect on the studied compos it ional and processing qual i ty traits compared to grain of plants grown under Fluorescent white l ight. These results indicated that the light quality may also be an important factor determining grain composition. CONCLUSION The decreasing price of LEDs allows the modernization of plant growth chambers with different LED light sources. This paper demonstrated the efficiency of LED technology in wheat cultivation under ar ti f icial light conditions and also specified the dominant light factors affecting wheat development and metabol i sm. In our exper i ments, the light intensity primarily determined the photosynthetic activity and yield production of plants and was the main factor during the t i llering phase. Light quality affec t ed stem elongation, which was influenced by blue, green and far-red l i ght antagonistically. The f lowering time was delayed when the Blue regimen was appl i ed, while the shortest flowering time was achieved when the blue and red ratio was around one. Light quality and quantity also changed the metabolism of l eaves. In spite of the f act that the Blue regimen st i mulated stomatal opening, the CO2 assimilation capacity of flag l eaves remained low. The redox states of thiols were affected mainly by the RedFR regimen through modifying the ratio of reduced and oxidized forms of redox sensitive metabolites, such as y-EC, cysteine and glutathione. The Blue regimen stimulated prol i ne metabolism. Appl i cation of LEDs, especial l y when Blue, Pink and RedLL regimens were applied, improved the milling quality of flour via modi f ication of strength and t he REFERENCES Appelgren, M. (1991). Short communication e f fects of light quality on stem e l ongation of Pelargonium i n vitro. Sci. Hort i c . (Amsterdam) 45, 345-351. doi:10.1016/0304-4238(91)90081-9 Assmann, S . M. (1993). Signal transduction in guard cells. Plant Trop. 9, 345-347. doi : 10.1146/annurev.cb.09.110193.002021 Assuero, S. G., and Tognet t i , J. A. (2010). Tillering regulation by endogenous and environmental factors and its agricultural management . Am. J . Pla n t Sci . Biotechnol . 4,35-48. Batey, I. L ., Gupta, R. B., and MacRitchie, F . (1991). Use of size-excusion high-perfrmance liqui d chromatographic prcedure in the study of wheat flour proteins: an improved chromatographic procedure. Cereal Chem. 68,207-209. Ce j udo, F. J ., Meyer, A. J., Reichheld , J. P., Rouhier , N., and Traverso, J. A.(2014). Thiol-based redox homeostasis and signaling. Front . Plant Sci. 5:266. doi : 10.3389/fpls.2014.00266 Chen, I . C., Huang, I, Liu, M. J, Wang, Z. G., Chung, S. S., and Hsieh , H. L.(2007). Glutathione S-t ransferase interac t ing w i th far -red insensitive 219 is involved in phytochrome A-media t ed signal i ng in Arabidops i s. Plant Physiol .143, 1189-1202. doi : 10.1104/pp.106.094185 Chen, L. J ., Zhao, F. F ., Zhang, M., Lin, H. H., and Xi, D. H. (2015). Effec t s of light quality on t he i nteraction between cucumber mosaic virus and nicot i ana t a bacum. J. Phytopathol. 163,1002-1013. doi : 10.1111/jph.12408 extensibili t y of the dough and solubility of prote i ns including the gluten content. Taken together, these results demonstrate that the utilization of LED lighting technology is desirable for indoor plant cultivation. The modification of radiation conditions during development makes it possible to optimize growth conditions for wheat and to obtain desired traits and pr o ducts . AUTHOR CONTRIBUTIONS IM, MA, and ED developed plant materials. MH and NH control l ed the light conditions. IM, GK, MR, GS, MP, DT, LS-S, SA, and ED carried out experimentation and data evaluation. GG, ED, and GK established background for research. ED, GK, MR, IM, SA, and GG wrote the paper. FUNDING This work was funded by the Nationa l Research, Development and d Innovation Office ((K111879,K112226, ANN117949, TET _15_IN-1-2016-0028, and TET _15_AT-1-2016-0048). ACKNOWLEDGMENTS The authors are grateful to Eva Levai for t echnical assistance and to Dr. Tibor Janda for his critical comments SUPPLEMENTARY MATERIAL The Supplementary Materia l for this ar t icle can be found online at : https://www.frontiersin.org/ar t icles/10.3389/fpls.2018.00605/full#supplementary-material Chen, M., Chory, J ., and Fankhauser, C. (2004). Light s ignal t ransduc ti on in higher plants. Annu. Rev. Genet. 38, 87-117. d o i: 10.1146/annurev.genet.38.072902.092259 Colquhoun, T. A., Schwieterman , M. L ., Gilbert , J . L., J a worski, E . A., Lange r , K. M., J ones, C. R., e t al . (2013). Light modulation of volatile organic compounds from petunia f lowers and select fruits. Postharvest Biol. Technol. 86, 37-44. doi: 10.1016/j .postharvbio.2013.06.013 arko, E, Heydarizadeh, P., Schoefs, B B..,, a a n n d d S S a a b b z z a alian, M. R. (2014). Photosynthesis under artific i al light : the shift in primary and secondary metabolism. Philos. Trans.R.Soc. 369:20130243.doi : 10.1098/rstb.2013.0243 De Salvador, F. R., Scarascia Mugnozza, G., Vox, G., Schettini , E., Mastror i lli, M., and Bou J aoude, M. (2008). Innovative photoselective and photoluminescent plastic films for protected cultivation. Acta Hortic . 801(PART 1), 115-121. doi: 10.17660/ActaHort i c.2008.801.7 Die t z, K. J., and Pfannschmidt,T . (2011). Novel regulators in photosynthetic redox control of plant metabolism and gene expression. Plant Physiol. 155, 1477-1485. doi : 10.1104/pp.110.170043 Dong, C ., Fu, Y ., Liu, G., and Liu, H. (2014). Grow t h, photosynthetic character i stics, antioxidant capacity and biomass yield and quality of wheat (Triticum aestivum L.) exposed to LED light sources with different spec t ra combinations . J. Agron. Crop Sci. 200, 219-230. doi: 10.1111/jac.12059 Evers, J. B., Vos, J., Andrieu, B., and Struik , P. C. (2006). Cessation of t i llering in spring wheat in relation to light interception and red:far-red ratio. A nn. Bot . 97,649-658. doi : 10.1093/aob/mcl020 Fan , X., Zang, J ., Xu, Z., Guo, S., J i ao, X., L i u, X., et al. (2013). Effects of di ff erent l ight qual i ty on growth, chlorophy l l concentration and chloroph y l l biosynthesis precursors of non-heading Chinese cabbage (Brassica campestris L.). Acta Physiol. Plant. 35, 2721-2726. doi: 10.1007/s11738-013-1304-Z Finlayson, S . A., Kr i shnareddy, S. R., Kebrom, T. H., and Casal, J. J . (2010). Phytochrome regulat i on of branching in Arabidopsis. Plant Physiol. 152,1914-1927. doi : 10.1104/pp.109.148833 Folta , K. M. (2004). Green l i ght stimulates early stem elonga t ion, antagonizing light-mediated growth inhibition. Plant Physiol. 135, 1407-1416. doi : 10.1104/pp.104.038893 Folta, K. M., and Childers, K. S. (2008). Light as a growth regulator : controlling plant biology with narrow -bandwidth sol i d-state l ight i ng systems. HortScience 43, 1957-1964. doi : 10.1186/1471-2164-12-360 Foyer, C. H., and N o ctor, G. (2011). Ascorbate and glutathione: t he heart of t he redox hub. Plant Physiol. 155,2-18. doi: 10.1104/pp.110.167569 Franklin, K. A., and Whitelam, G. C. (2007). Light-quality regul a tion of f reezing tolerance in Arabidopsis thaliana. Nat . Genet . 39, 1410-1413. doi : 10.1038/ng.2007.3 Gautier, H., Varlet -Granche r , C., and Hazard, L. (1999). T i ller i ng responses to the light environment and to defol i ation in populations o f perennial ryegrass (Lolium perenne L.) sel e cted for contras t ing leaf l ength. Ann. Bot. 83, 423-429. doi : 10.1006/anbo.1998.0840 Geigenberger, P., and Fernie, A . R. (2014). Metabolic control of redox and redox control of metabolism in plants. Antioxid. Redox Signal . 21,1389-1421. d oi : 10.1089/ars.2014.6018 Gierczik, K., Novak, A., Ahres, M., Szekely, A., Soltesz, A., Boldizsar, A, e t al.(2017). C i rcadian and l ight regul a ted expression of CBFs and thei r upstream signalling genes in barley. Int . J. Mol. Sc i. 18:1828. doi : 10.3390/i jms18081828 Goins, G. D., Yorio, N . C., Sanwo, M. M., and Brown, C. S. (1997). Photomorphogenesis, photosynthesis, and seed y i eld of wheat plant s grown under red light-emi tt ing diodes (LEDs) with and without supplementa l blue l i ghting. J . Exp. Bot. 48, 1407-1413. doi: 10.1093/jxb/48.7.1407 Hogewoning, S. W., Trouwbors t , G., Maljaars, H., Poorter, H., van Ieperen, W., and Harbinson, J. (2010). Blue l ight dose-responses of lea f photosynthesis, morphology , and chemical composit i on of Cucumis sat i vus grown under di f ferent combinations of red and blue light . J . Exp. Bot . 61, 3107-3117. doi : 10.1093/jxb/erq132 Inagaki, N., Kinoshita, K., Kagawa, T ., Tanaka, A., Ueno, O., Shimada, H., et al (2015). Phytochrome B mediates the regulation of chlorophyll biosynthesis through transcriptional regulation of ChlH and GUN4 in rice seedlings. PLoS One 10:e0135408. doi: 10.1371/journal .pone.0135408 Internati o nal Association for Cereal Science and Technology ICC 105/2. (1995). Determination of Crude Protein in Cereals and Cereal Product s for Food and for Feed. Avail a ble at: https://www.icc.or .at/standard _method s /105.2 International Association for Cereal Science and Technology ICC 116/1.(1995). Determination of the SedimentationValue (according to Zeleny) as an Approximate Measure of Baking Quality . Available a t : https://www.i cc.or .at/standard _methods/116.1 Internat io nal Assoc i ation for Cereal Science and Technology ICC 137/1.(1995). Mechanical Determination of t he Wet Gluten Content of Wheat Flour. A vail a ble at: https://www.icc.or.at/standard _methods/137.1 International Associat i on for Cereal Sc i ence and Technology ICC 155. (1995). Determination of Wet Gluten Quant i t y a nd Qualit y (Gluten Index ac . to Pert e n) of Whole Wheat Meal and Wheat Flour (Triticum aestivum). A vailable at :https://www.icc.or.at/standard _method s /155 Kebrom, T. H., Burson, B. L .,and Finlayson,S. A. (2006). Phytochrome B represses Teosinte Branched1 expression and induces sorghum ax i llary bud outgrowth in response to l ight signals . Plant Physiol . 140, 1109-1117. doi : 10.1104/pp.105.074856 Kim, H. H., Goins, G. D., Wheeler, R. M., and Sager , J . C. (2004). Stomatal conduct a nce of lettuce grown under or exposed to dif f erent l ight qualities. Ann. Bot. 94, 691-697. doi: 10.1093/aob/mch192 Kim, S. J ., Hahn, E. J ., Heo, J. W., and Paek, K. Y. (2004). Effects of LEDs on net photosynthetic rate , growth and leaf stomata of chrysanthemum plantlets in v i tro. Sci. Hortic. (A msterdam). 101, 143-151. doi: 10.1016/j.scienta.2003.10.003 Kim, K., Kook, H. S., Jang, Y . J ., Lee, W. H., Seralathan, K. K., Chae, J . C., et al .(2013). The effect of blue-l i ght-emitting diodes on antioxidant properties and resistance to Botry t is c i nerea in tomato. J . Plant Pathol. Microbiol. 4:203. doi :10.4172/2157-7471.1000203 Kocsy, G., Szalai, G., Vagujfalv i , A., Stehli, L., Orosz, G., and Gal i ba , G. (2000) Genet i c study of glutathione accumulat i on during cold hardening in wheat. Pl a nta 210, 295-301. doi: 10.1007/PL00008137 Koga,R., Meng, T., Nakamura, E., Miura, C., Irino, N., Devkota, H. P., et al .(2013). The effect of photo-i rradiation on the growth and i ngredient composi t ion of young green barley (Hordeum vulgare). Agric . Sc i . 4, 185-194. d o i : 10.4236/a s .2013.44027 Kranner, I., and Gr i ll, D. (1996). Determination of glutathione and g l utathione disulphide i n l ichens: a comparison of frequent l y used methods. Phytochem. Anal. 7, 24-28. doi: 10.1002/(SICI)1099-1565(199601)7:1<24::AID-PCA277>3.0.CO;2-2 Lethin, J ., and Bankestad, D. (2016). Growth and Development of Cereals in a Controlled Env i ronment with Sole Source LED Lighting. Available at:https://www .he l iospectra.com/sites/defaul t /f iles/growth _and _development _ of _cereals _in _a _controlled _environment _with _sol e _source _led _lighting.pdf Li , H., Tang, C., Xu, Z., Liu, X., and Han, X. (2012). Effects of di f ferent l ight sources on the growth of non-heading Chinese cabbage (Brassica campestr i s L.). J . Agric . Sc i . 4, 262-273. doi: 10.5539/jas.v 4n4p262 Li, Q., and Kubota, C. (2009). Effects of supplemental light quality on growth and phytochemicals of baby leaf lettuce. Environ. Exp. Bot. 67, 59-64. doi:10.1016/j .envexpbot .2009.06.011 Li , W. Y., Yan Ping, Y., Yan, S. H., Dai, Z. M., Li , Y., Liang, T . B., et al . (2008). Effect of shading after anthesis on starch accumulation and act i vit i es of the related enzymes in wheat grain. Acta Agron. Sin. 34, 632-640. doi : 10.3724/SP.J.1006.2008.00632 Lichtenthaler, H. K.(1987). Chlorophylls and carotenoids: pigments of photosynthetic biomembranes. Methods Enzymol . 148,350-382. doi : 10.1016/0076-6879(87)48036-1 Lin, C. (2000). Update on development photoreceptors and regulation o f f lowering time 1. Plant Physiol. 123,39-50. doi: 10.1104/pp.123.1.39 Marchylo, B. A., Kruge r , J . E., and Hatcher, D. W. (1989). Quantitative reversed -phase high-performance liq u id chromatographic analy s is of wheat storage proteins as a potent i al q u a li t y predic t ion t ool . J . Cereal Sci. 9, 113-130. doi :10.1016/S0733-5210(89)80012-8 Morrow, R . C. (2008). LED l ighting in horticulture. HortSc i ence 43, 1947-1950. Novak, A ., Bold i zsár, A, Gierczik , K., Vágújfalv i , A., Adám, E , Kozma-Bognar, L ., et al . (2017). Light and temperature signa l ling at the level of CBF14 gene expression in wheat and barley. Plant Mol. Biol . Report. 35,399-408. doi:10.1007/s11105-017-1035-1 Olle, M., and Vir s ile, A. (2013). The ef f ec t s of light-emitt i ng diode lighting on greenhouse p l ant growth and quality. Agr i c. Food Sci . 22, 223-234. Available at : https://journal .fi/afs/art i cle/view/7897 Parks, B. M., Folta, K. M., and Spalding, E. P. (2001). Photocontrol of stem growth Curr. Opin. Plant Biol . 4,436-440. doi : 10.1016/S1369-5266(00)00197-7 Samuoliene, G., Brazaityte, A., Sirtautas, R., Novickovas, A., and Duchovskis, P.(2011). Supplementary red-LED lighting affects phytochemicals and nitrate of baby leaf lettuce. J. Food Agric . Envirnment . 9, 271-274. Samuoliene, G., Brazaityte, A., Sirt a utas, R., Noviekovas, A., and Duchovskis, P.(2012). The effect of supplementary LED lighting on the antioxidant and nutr i tional proper t ies of lettuce . Acta Hortic . 952, 835-842. doi : 10.17660/ActaHortic.2012.952.106 Schettini,E . (2005). Lighting equipment for a crop growing system in microgravity condi t ions f or space mission. Acta Hortic . 1, 217-224. doi: 10.17660/ActaHort i c.2005.691.25 Schettini , E., de Sal v ador, F. R., Scarascia-Mugnozza , G., and Vox, G.(2011). Radiometric properties of photoselective and photoluminescent greenhouse plastic fi l ms and their effec t s on peach and cherry tree growth. J. Hortic . Sc i . Biotechnol. 86, 79-83. doi : 10.1080/14620316.2011.11512729 Singh, D., Basu, C., Meinhardt -Wollweber, M., and Roth, B. (2015). LEDs for energy e f fic i ent greenhouse l ighting. Renew. Sustain. Energy Re v . 49,139-147. doi: 10.1016/j .rser.2015.04.117 Smith, H., and Whitelam, G. C. (1997). The shade avoidance syndrome: mul t iple responses mediated by multiple phytochromes. Plant Cell Environ. 20, 840-844. doi : 10.1046/j .1365-3040.1997.d01-104.x Steiger, S., Schafer, L ., and Sandmann, G. (1999). High-l ight-dependent upregulation of carotenoids and their antioxidative properties in the cyanobacterium Synechocyst i s PCC 6803. J. Photochem. Photobiol. B Biol. 52,14-18. doi: 10.1016/S1011-1344(99)00094-9 Szabados, and Savoure, A. (2010). Proline: a multifunctional amino O aci d d .Trends F Plant Sc i . 15, 89-97. d oi :10.1016/j .tplants.2009.11.009 Talbott, L . D., Shmayevich, I . J ., Chung, Y., Hammad, J. W., and Zeiger, E.(2003). Blue light and phytochrome-mediated stomat a l opening in the npql and phot1phot2 mutant s of Arabidopsis. Plant Physiol. 133,1522-1529. doi: 10.1104/pp.103.029587 Thomas, B. (2006). Light signals and f lowering. J . Exp. Bot. 57, 3387-3393. doi:10.1093/jxb/erl071 Wang, Z. (2015). LED l ight spectrum affect s t he photosynthet i c performance of Houttuynia cordata seedlings. Am. J . Opt . Photonic s 3, 38-42. doi : 10.11648/j. ajop.20150303.12 Yang, D., Seaton, D. D., Krahmer, J ., and Halliday, K . J . (2016). Photoreceptor e f fects on plant biomass, resource allocation, and metabolic state. Proc. Natl . Acad. Sci. 113,7667-7672. doi : 10.1073/pnas.1601309113 Yeh, N., and Chung, J . P. (2009). High-brightness LEDs-energy ef fi cien t l ight i ng sources and their potent i al in indoor p l ant cul t ivation. Renew. Sustain. Energy Rev. 13,2175-2180. doi : 10.1016/j .rser .2009.01.027 Zadoks, J., Chang, T ., and Konzak, C. (1974). A dec i mal growth code for the growth st a ges of cereals. Weed Res . 14, 415-421. doi : 10.1111/j .1365-3180.1974. tb01084.x Zhen, S., and van I ersel, M. W. (2017). Far -red light is needed for efficient photochemistry and photosynthes i s. J . Pl a nt Physiol. 209, 115-122. doi : 10.1016/j.j plph.2016.12.004 Conflict of Interest Statement: The authors declare that the research was conducted in t he absence of any commerc i al or f inanc i al relationships t hat could be construed as a potential conf l ict of interest . Copyright @ 2018 Monostor i , Heilmann, Kocsy, Rakszegi, Ahres , Altenbach, Szalai, Pal, Tol d i, Simon-Sarkadi, Harnos, Galiba and Darko. This is an open-access article distributed under the terms of the Creative Commons Attribution License (CC BY). The use, distribution or reproduction in othe r forums i s permitted, provided the original author(s) and the copyright owner are credited and that t he original publication in this journal is cited, in accordance with accepted academic practice . No use, dist r ibution or reproduction i s permitted which does not comply with t hese terms.
确定
还剩14页未读,是否继续阅读?

产品配置单
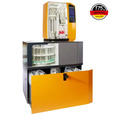


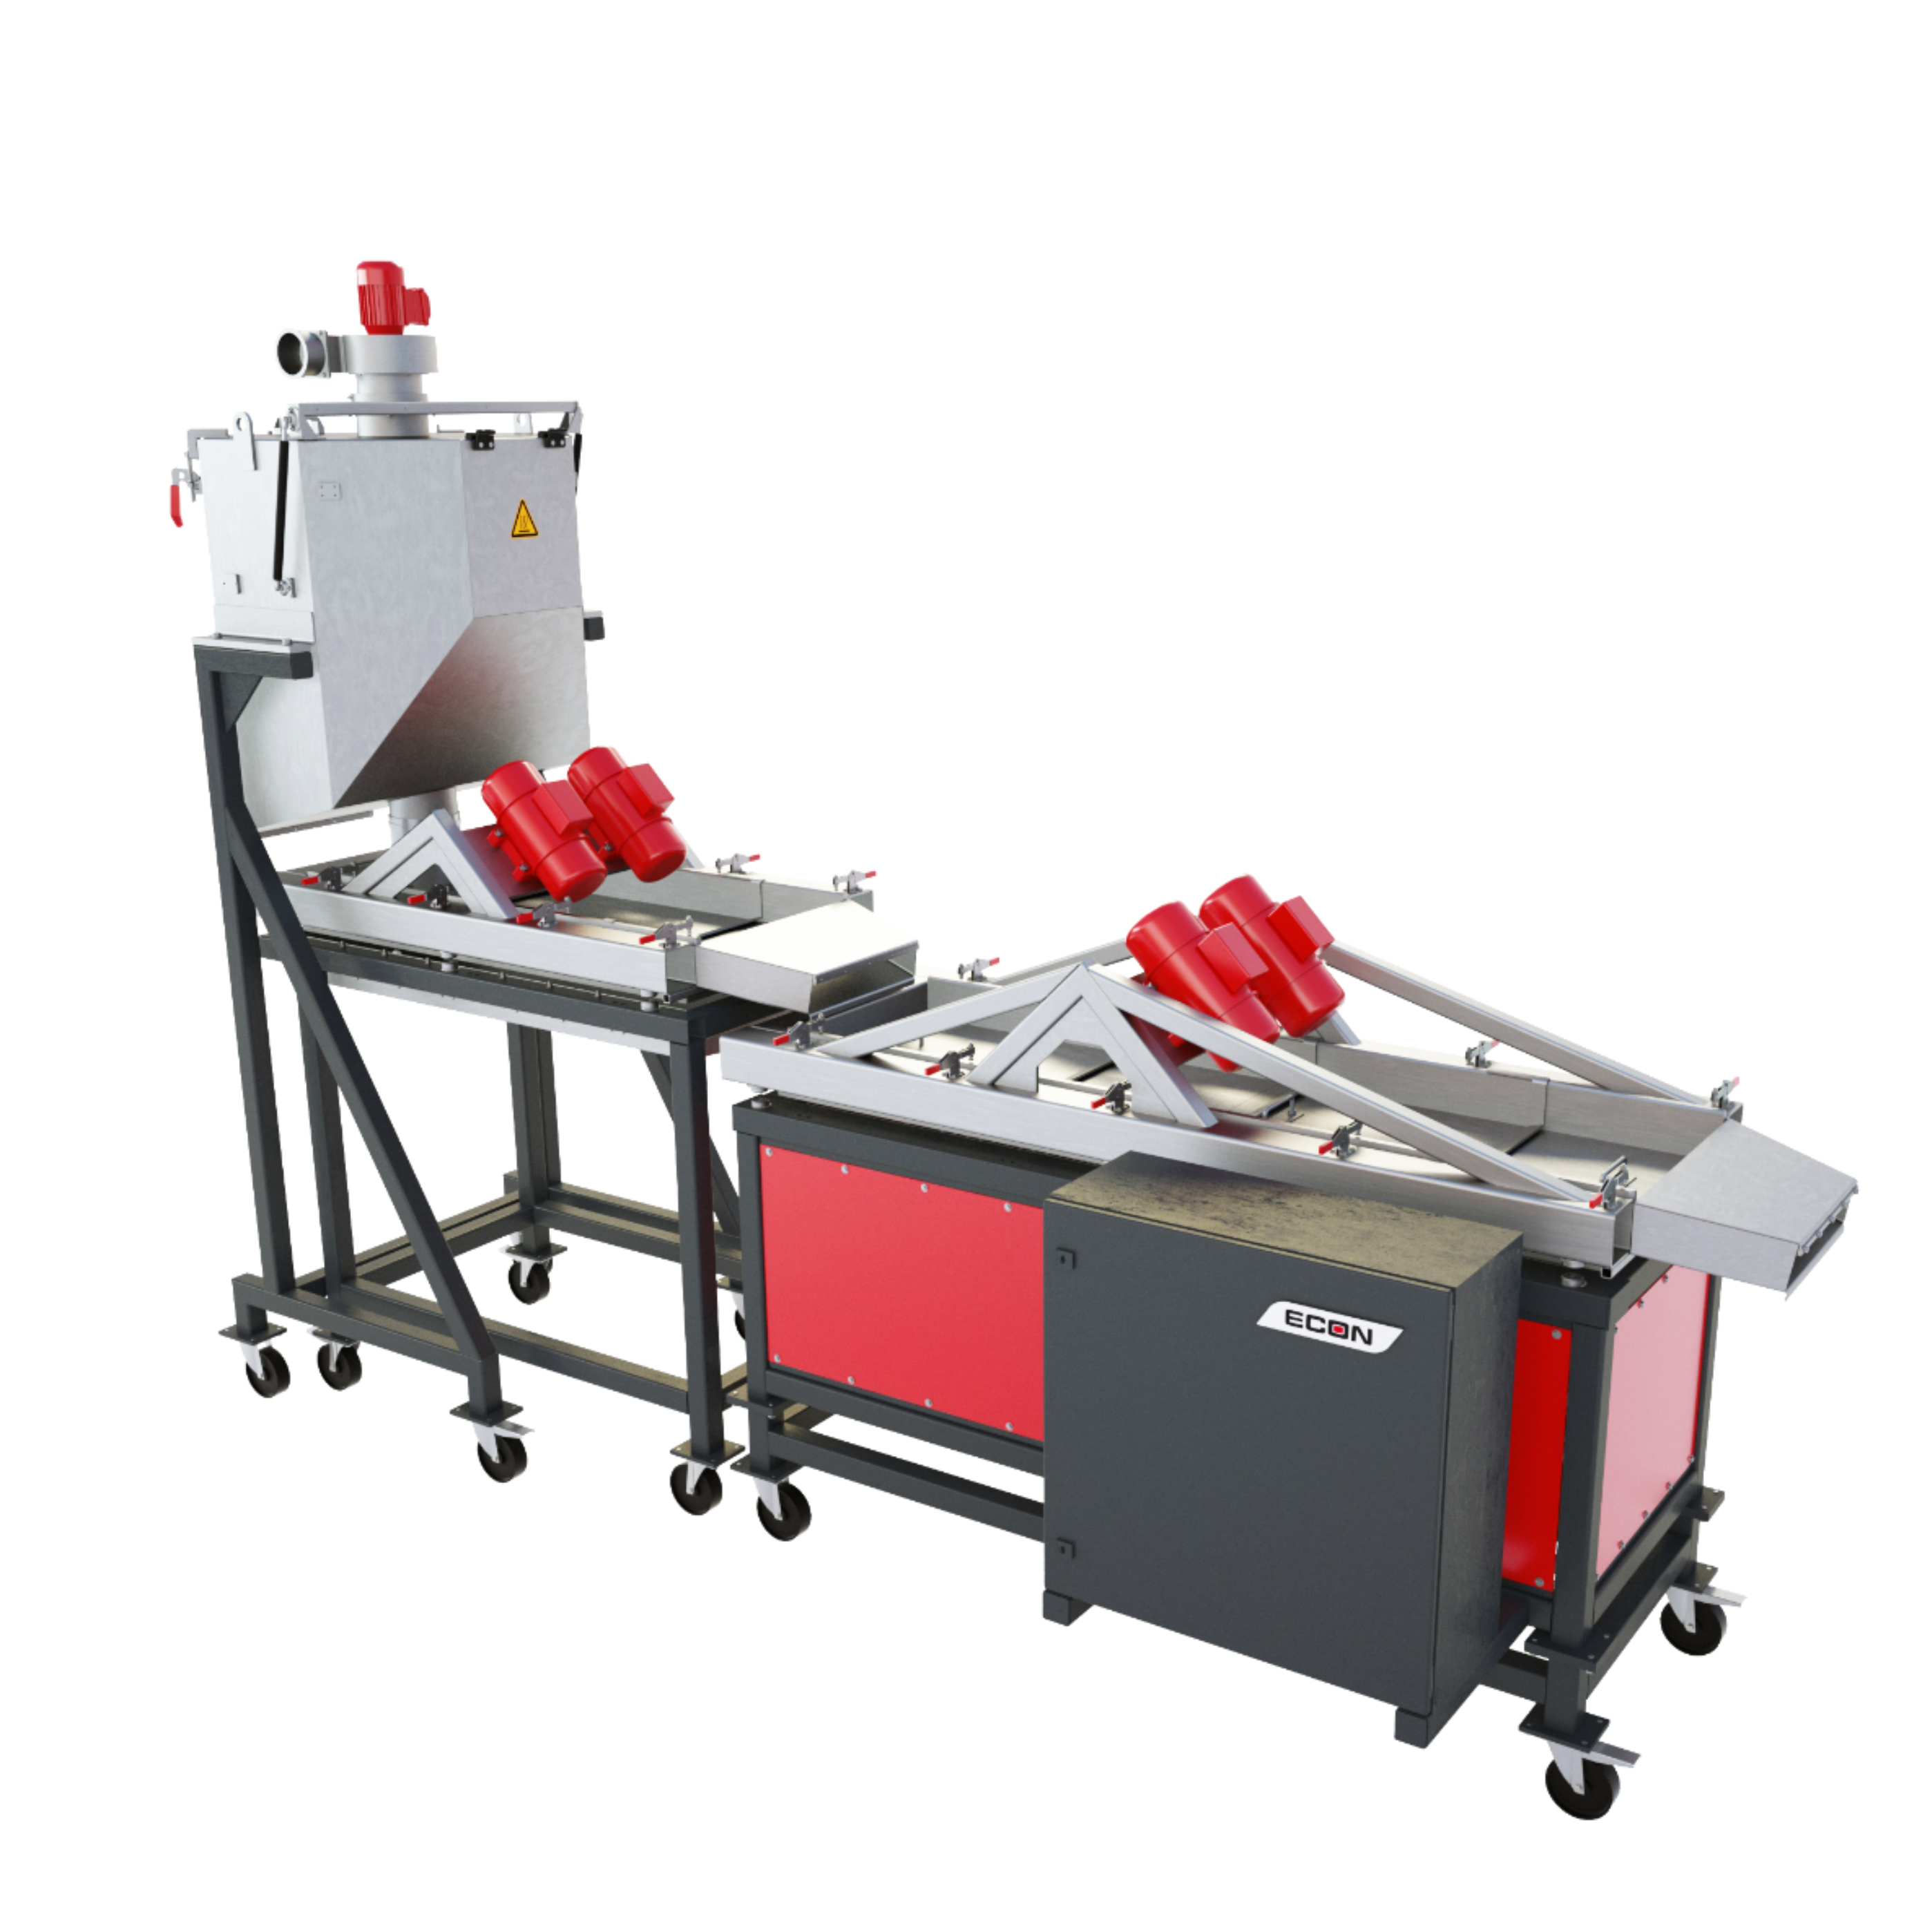
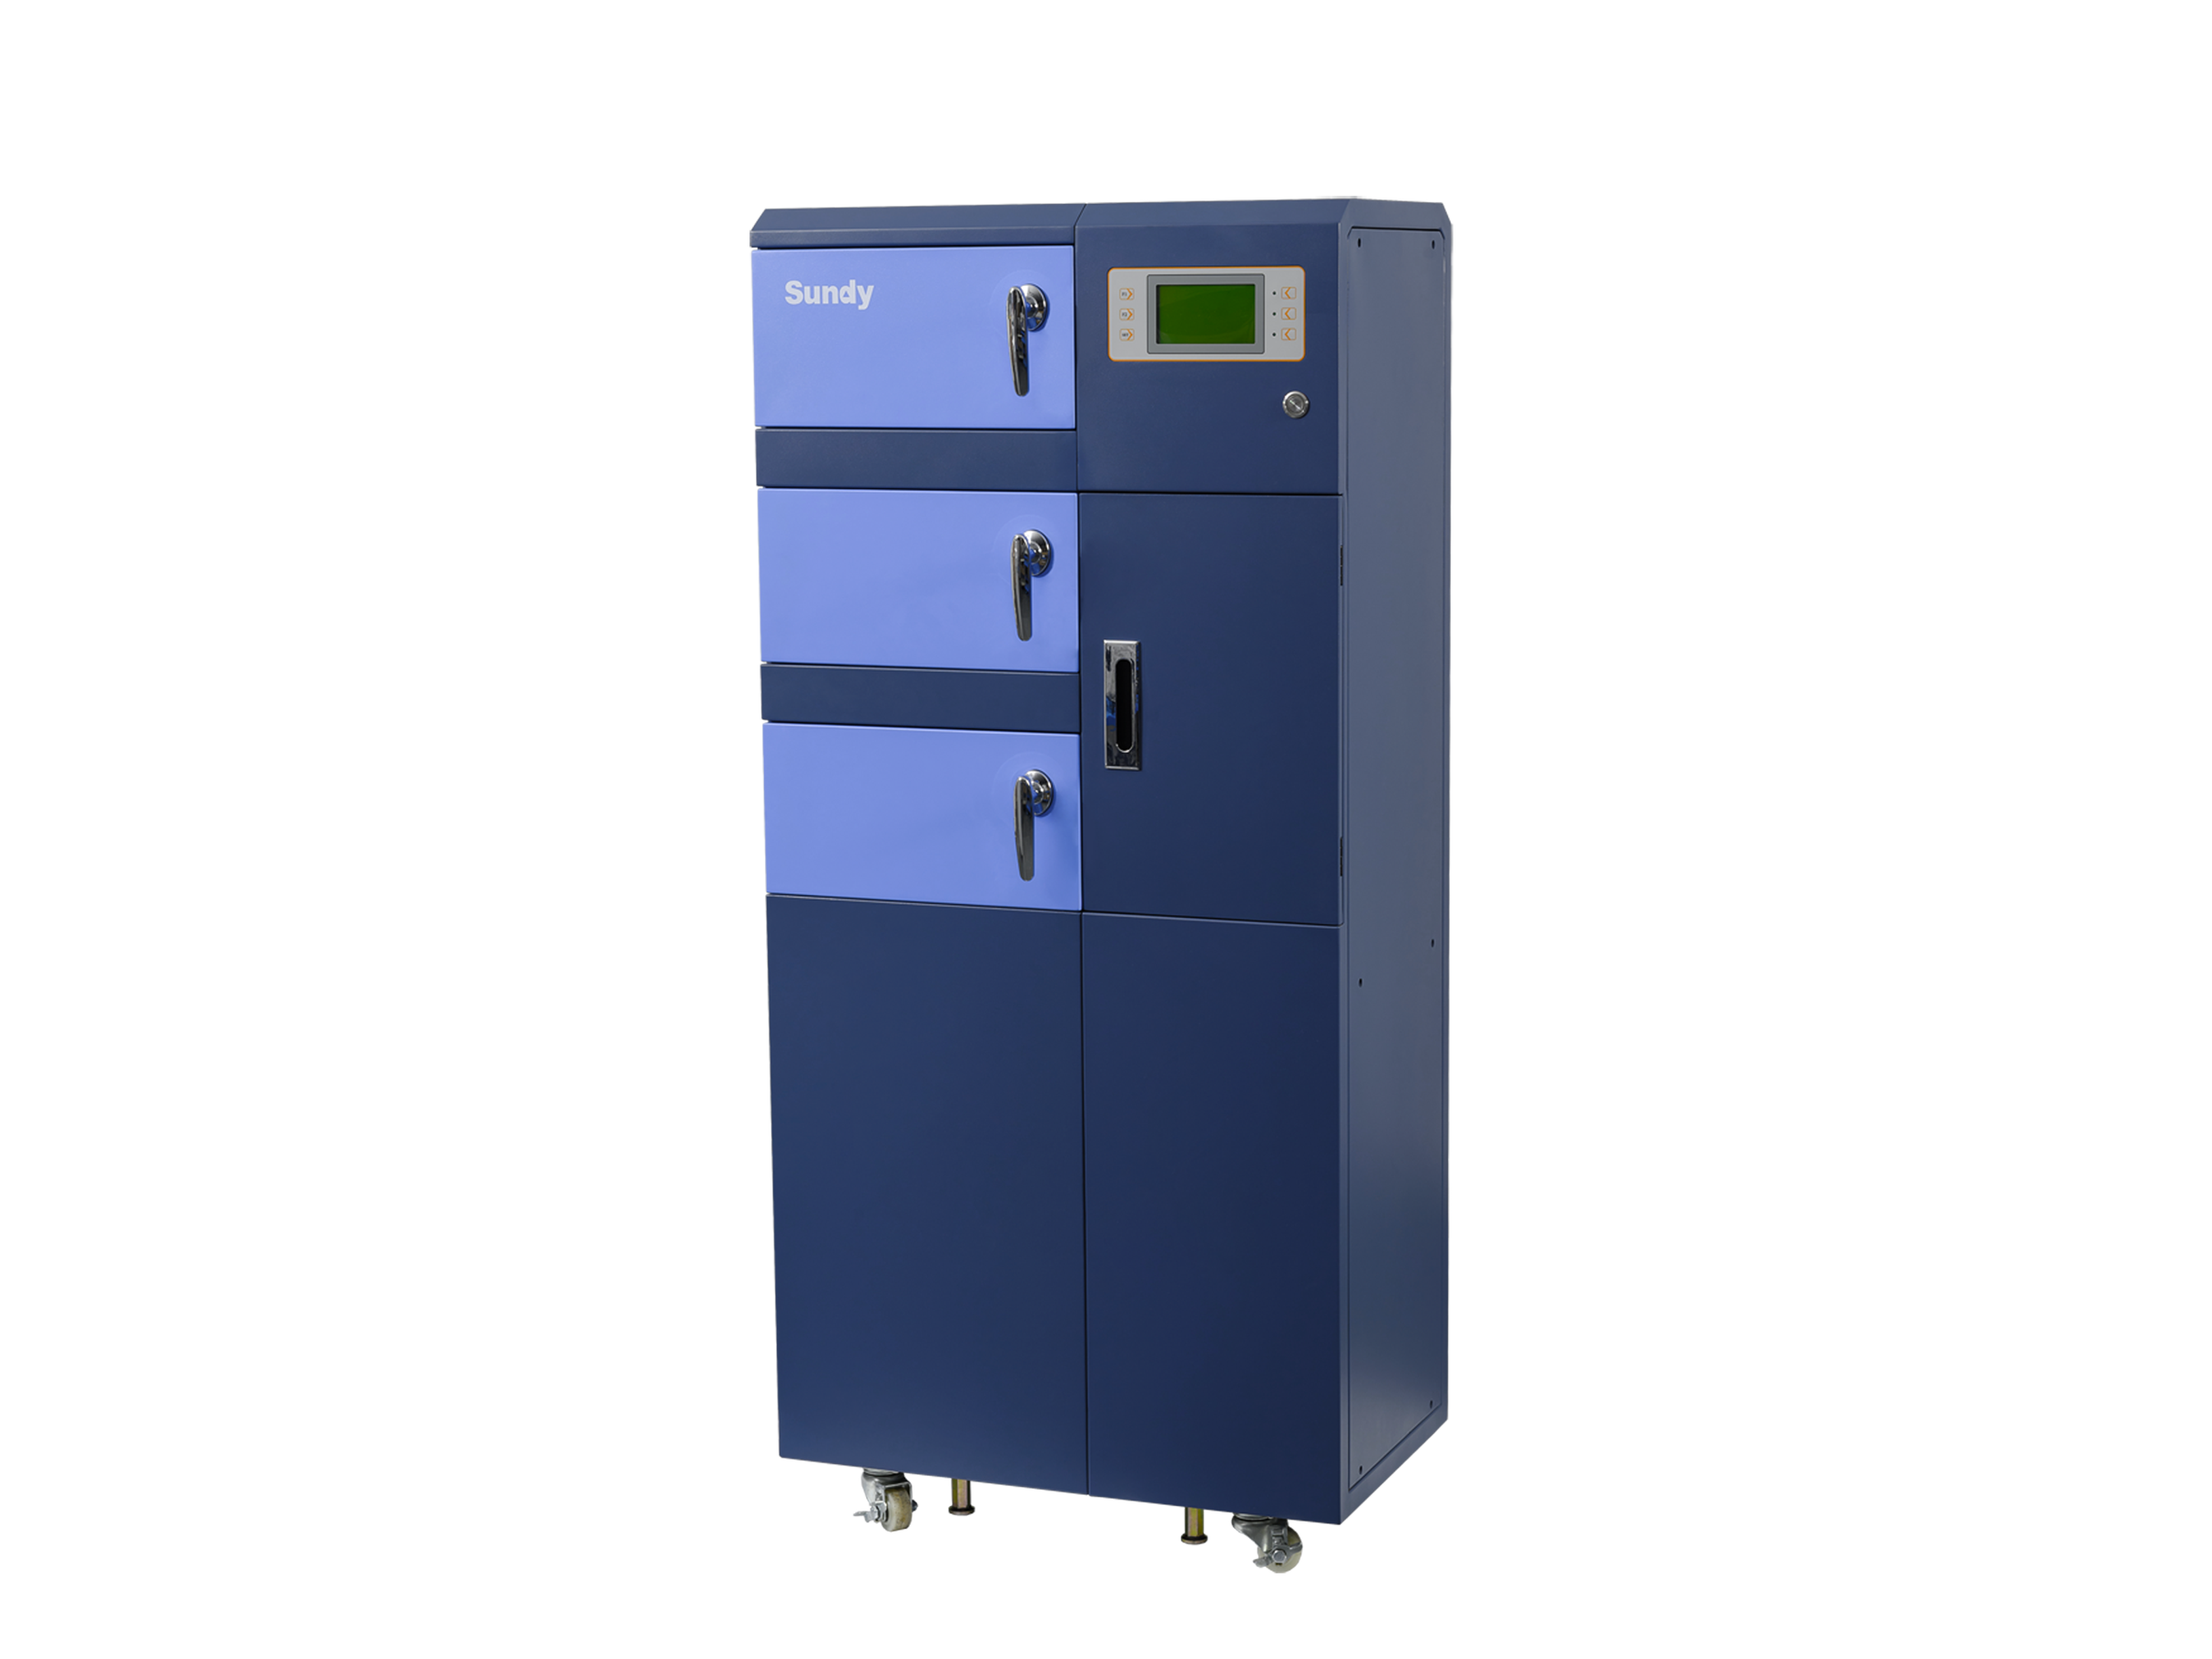
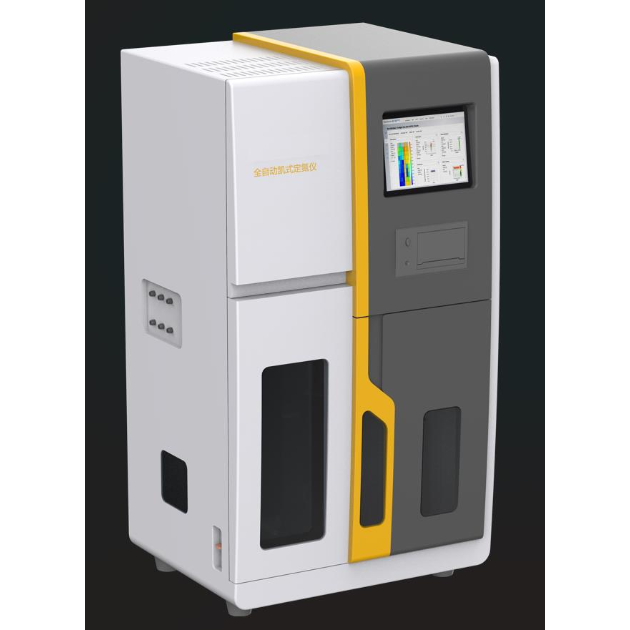
中国格哈特为您提供《小麦旗叶中氨基酸含量的测定》,该方案主要用于小麦粉中营养成分检测,参考标准--,《小麦旗叶中氨基酸含量的测定》用到的仪器有格哈特强力高重现振荡器LS500/RO500、格哈特自动升降凯氏定氮电热消解仪KT-L 20s、格哈特快速干燥仪STL56、格哈特带自动进样器凯氏定氮仪VAP500C、格哈特维克松废气实验室废物处理系统涤气VS、德国移液器MM、凯氏定氮催化剂5.0g K2SO4+0.5g CuSO4 x 5H2O


相关方案
更多
该厂商其他方案
更多