


方案详情
文
本应用说明详细介绍了混合气体分析所需的软件程序和各种气室。
方案详情

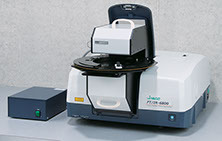
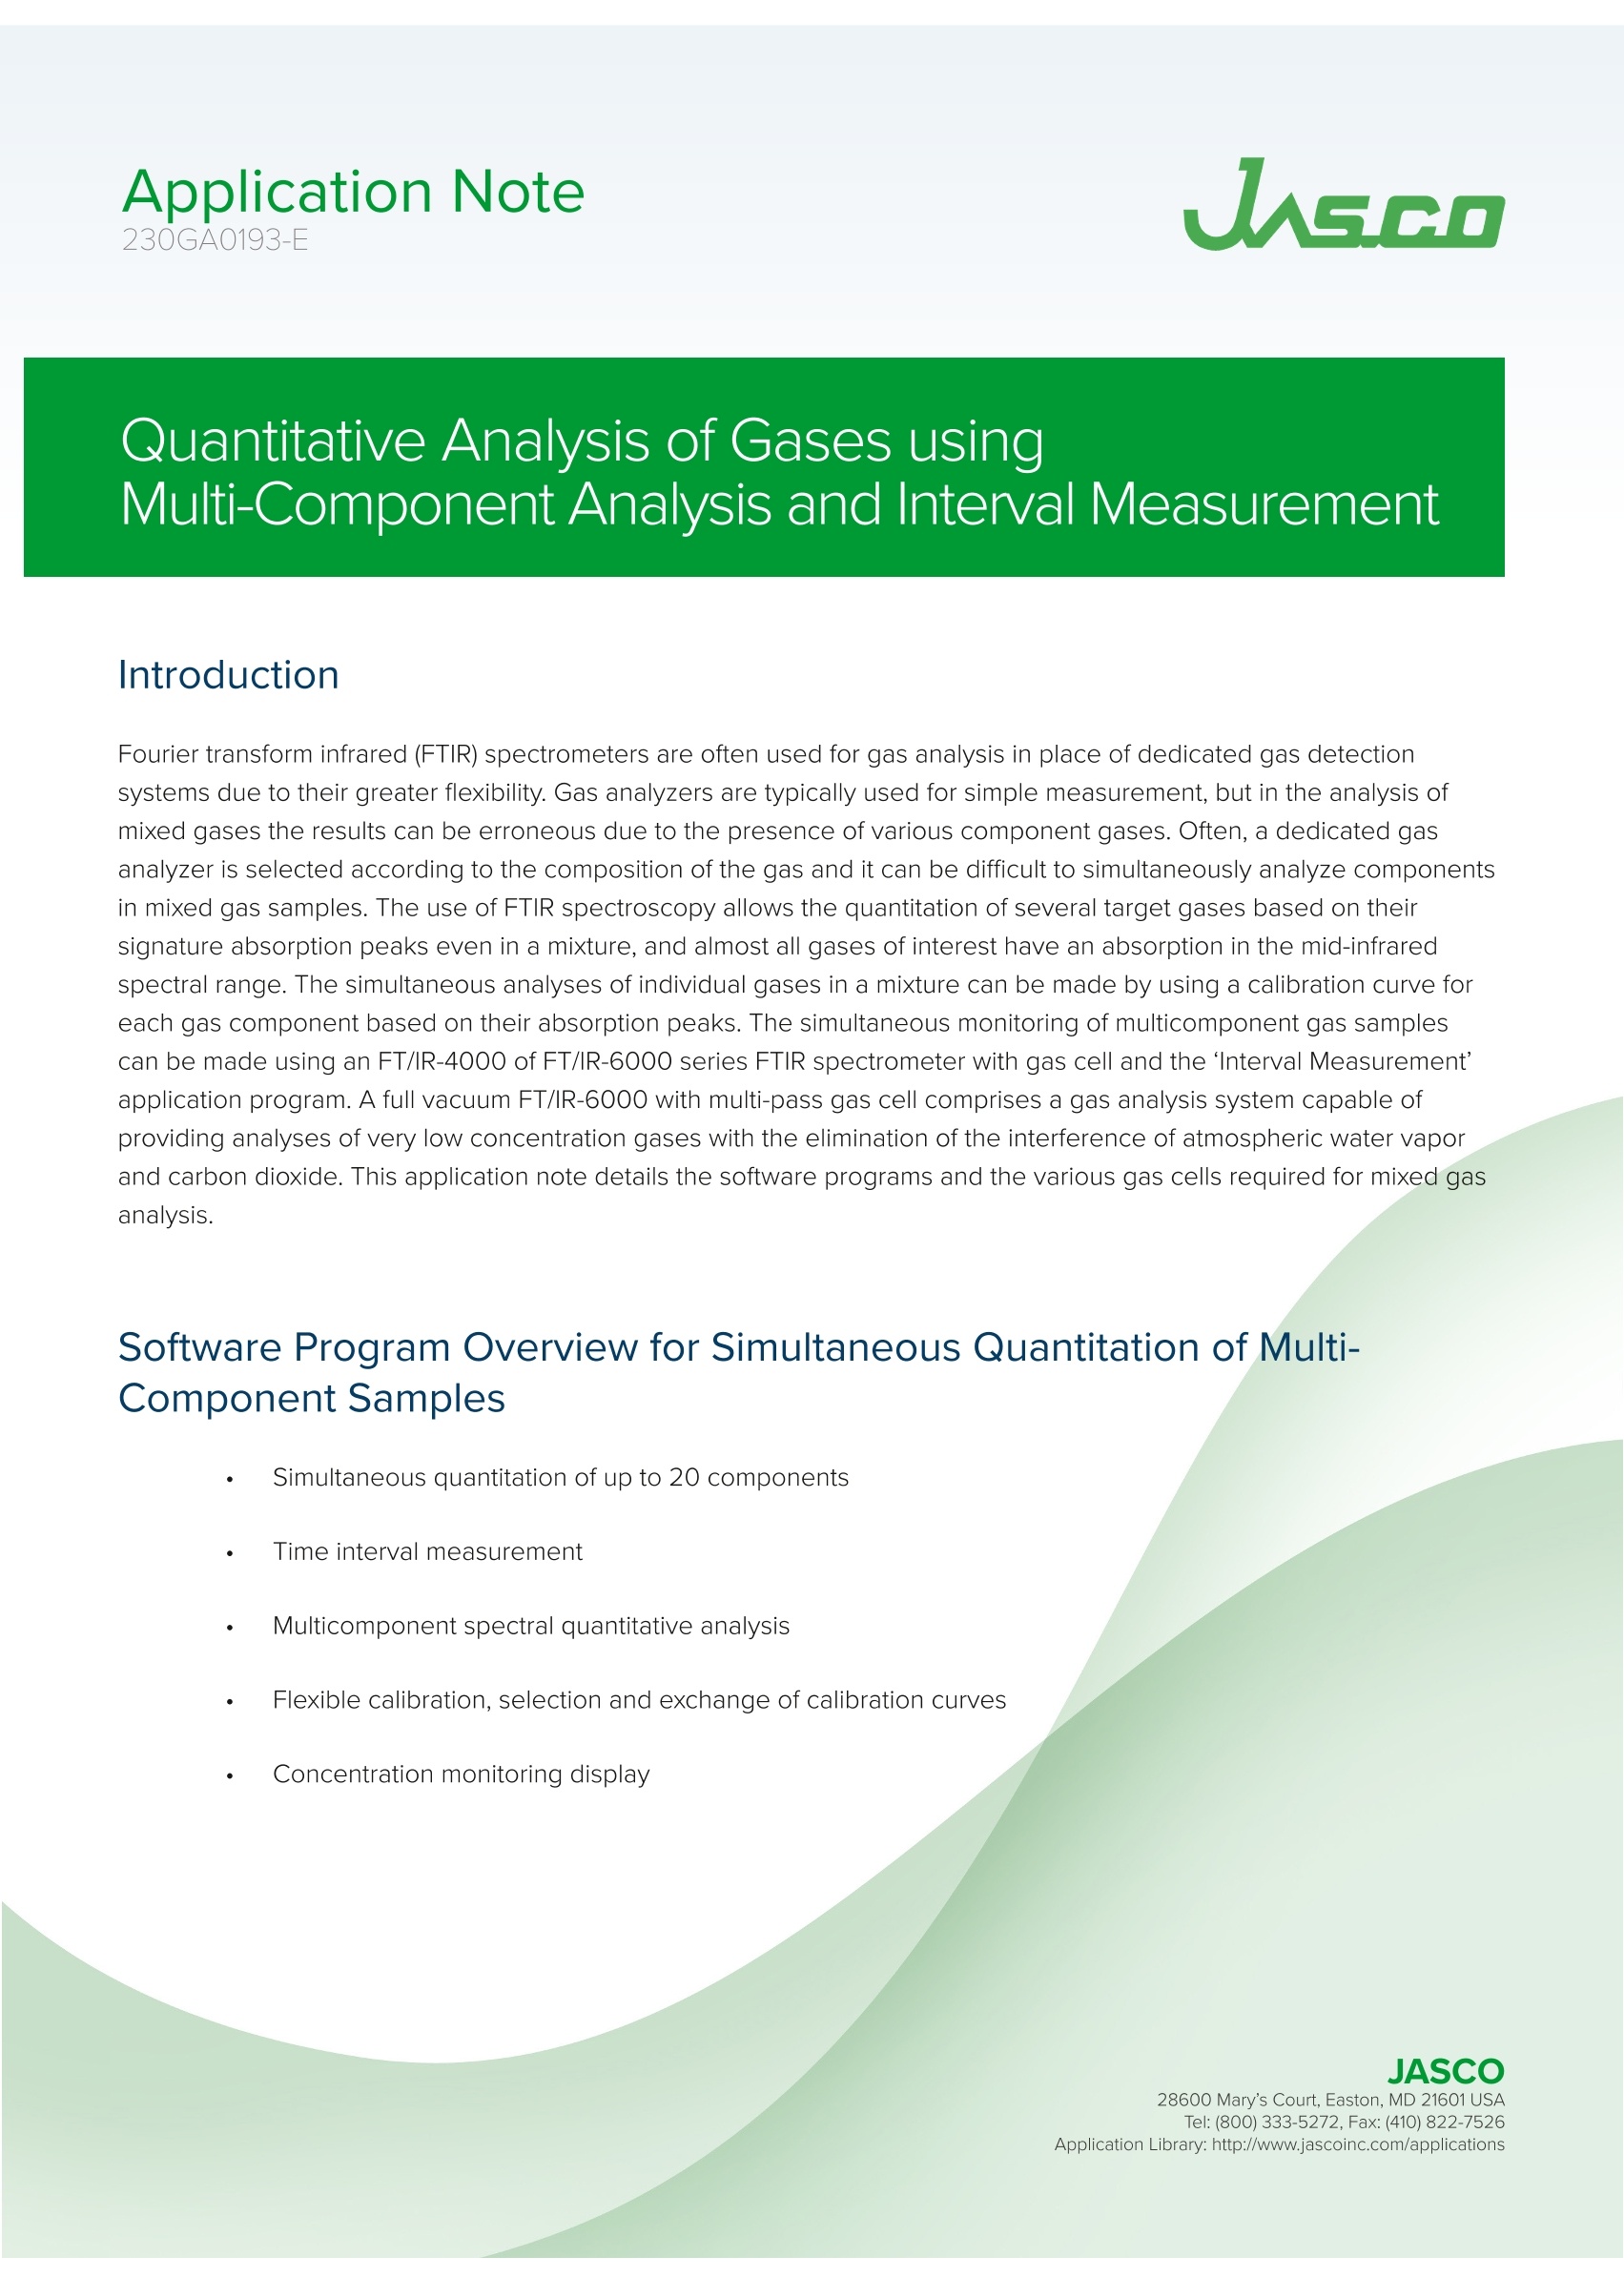
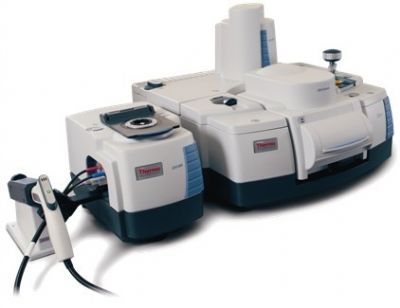
傅立叶变换红外(FTIR)光谱仪由于其更大的灵活性而经常用于气体分析,以代替专用的气体检测系统。气体分析仪通常用于简单的测量,但在混合气体的分析中,由于存在各种组分气体,结果可能是错误的。通常,根据气体的成分选择专用的气体分析仪,并且很难同时分析混合气体样品中的成分。FTIR光谱的使用允许基于几种目标气体的特征吸收峰对其进行定量,即使在混合物中也是如此,并且几乎所有感兴趣的气体都具有中红外光谱范围内的吸收。混合物中单个气体的同时分析可以通过使用基于其吸收峰的每个气体组分的校准曲线来进行。多组分气体样品的同时监测可以使用带有气室的FT/IR-6000系列FTIR光谱仪的FT/IR4000和“间隔测量”应用程序进行。具有多程气室的全真空FT/IR-6000包括气体分析系统,该气体分析系统能够提供非常低浓度气体的分析,同时消除大气水蒸气和二氧化碳的干扰。本应用说明详细介绍了混合气体分析所需的软件程序和各种气室。多组分样品同时定量的软件程序概述 •最多可同时定量20种成分 •时间间隔测量 •多组分光谱定量分析 •校准曲线的灵活校准、选择和交换 •浓度监测显示Application Note230GA0193-E 2/3Quantitative Analysis of Gases usingMulti-Component Analysis and Interval MeasurementApplication Note Quantitative Analysis of Gases using Multi-Component Analysis and Interval Measurement Introd u ction F o u ri e r tr ansform i n f rared (F T IR) spectrometers are ofte n u sed for gas ana l ysis i n p lace o f dedica t ed gas detect i on systems due to their greater flex i bil i ty. Gas analyzers are typically used fo r simple measuremen t , but i n the analysis of mixed gases the results can be erroneous due to t h e presence of various compone n t gases. Often, a dedicated gas analyz e r is sel e cted according t o the composit i on of t h e ga s an d it can be dif f icult to s imul t a n e ou s ly a n alyze com p onen t s in mixed gas samples. The u s e of FTIR spect r oscopy al l ows the quant i ta t io n of s e veral targe t g ases based on their signature absorption peaks even in a m i xture, and almost a l l gases of i n terest have an absorption in the mid -i nfrared spectral range. The simultaneous analyses of individual gases i n a m ixture can be made by using a cal i bration curve for eac h g a s component b ased on t h eir absorptio n peaks. T h e sim ultan eous monitor i n g of m ult i compone n t g a s samp l es can b e mad e u s ing an FT/IR-4000 of FT/IR-6000 s e ri es FTIR sp e ctrom e ter wit h gas ce l l and the ‘I nt er val Measur e ment 'applicat i on program. A full vacuum FT/IR-6000 wit h mult i -pass gas cell comprises a gas analysis system capable of prov i ding ana l yses of very l ow co n centration gases with the el i mi n at i on of the interference of atmospheric water vapo r and carbo n dioxide. Th is appl i catio n n ote details the software programs and th e various gas cells required for m ixed gas an a lys i s. Software Prog ram Overview for S i mul t aneous Quantitat i on of M ult i -Component Samp l e s Simultan e ous quantitat i on of up to 20 componen t s Time i nterval measureme n t Multicomponent spect r al quantitative analysis Flexible cali b ration, select i on and exc h ange of cal ib ratio n curves Conc e ntr a t i on monitoring d i s p lay JASCO Gas concentration mo n i t ori n g software Figure 1. Examp l e of mu l t i componen t measure m en t u si n g a sim ul taneo u s q ua nt i tation progr a m Fig ur e 1 Example of the simultaneous quant i tati v e analysis p rogram for measurement of a mixed gas sample . The time cou r se monitor of each component gas is simultaneously displayed. F i gures 2 and 3 i llust r ate two dedicated gas monitor i ng i n strument systems. Figure 2. V I R F i eld r u gged F T IR wi t h 8m gas ce l l Figure 3. FT/IR-6600-FV vacuu m FTIR s p ect r o m ete r w i th 10m gas cell Cr e ation and Sel e ction of C ompo ne nt Calib r a t ion Cu rves The mul t i-component qua nti tative a n alysis software al l ows the m easurement of up to 20 compone n ts . For each quant i tative analysis, a calibratio n cu r ve i s selected f r om th e calibrat i on c u rves that h ave been created. Figu r es 4 a n d 5 s how the cr ea t i on and s e le ctio n dialogs. Figur e 6 shows a m e thane sp e c tr u m an d an e xampl e of a cal i bratio n curv e m ade us in g an 8m gas cel l. The detection limits are dependent on the i n dividual compone nt gas, sample m a tri x a n d m easu r ement cond i tio n s, includi n g the reso l ut i on ,n umbe r of accumulations and detector. Exam p les of typica l quantitation r anges with respect to gas cell pat h l engt h are shown below. [These are typical detect i o n l i mi t s only and should be ver i f i ed by actual ex p er i mental da ta accordi n g to tes t req u i r ement .] Figure 4. G as c om pone n t regi st ration d i a log Figure 5. Gas compone n t se l ec ti o n d i alog 10 c m cel l : several %-100 p p m 3 m e t e r ce ll : several h u n d r eds-1ppm 8 meter cel l : sever a l t ens ppm-0.2 p pm Figure 6. C a lib ra tio n c u rve an d meth a ne spectrum
确定


还剩1页未读,是否继续阅读?

产品配置单

佳士科商贸有限公司为您提供《使用多组分分析和区间测量对气体进行定量分析》,该方案主要用于工业气体中多组分气体分析检测,参考标准--,《使用多组分分析和区间测量对气体进行定量分析》用到的仪器有JASCO傅立叶变换红外光谱仪FT/IR-6000
推荐专场
相关方案
更多
该厂商其他方案
更多