


方案详情
文
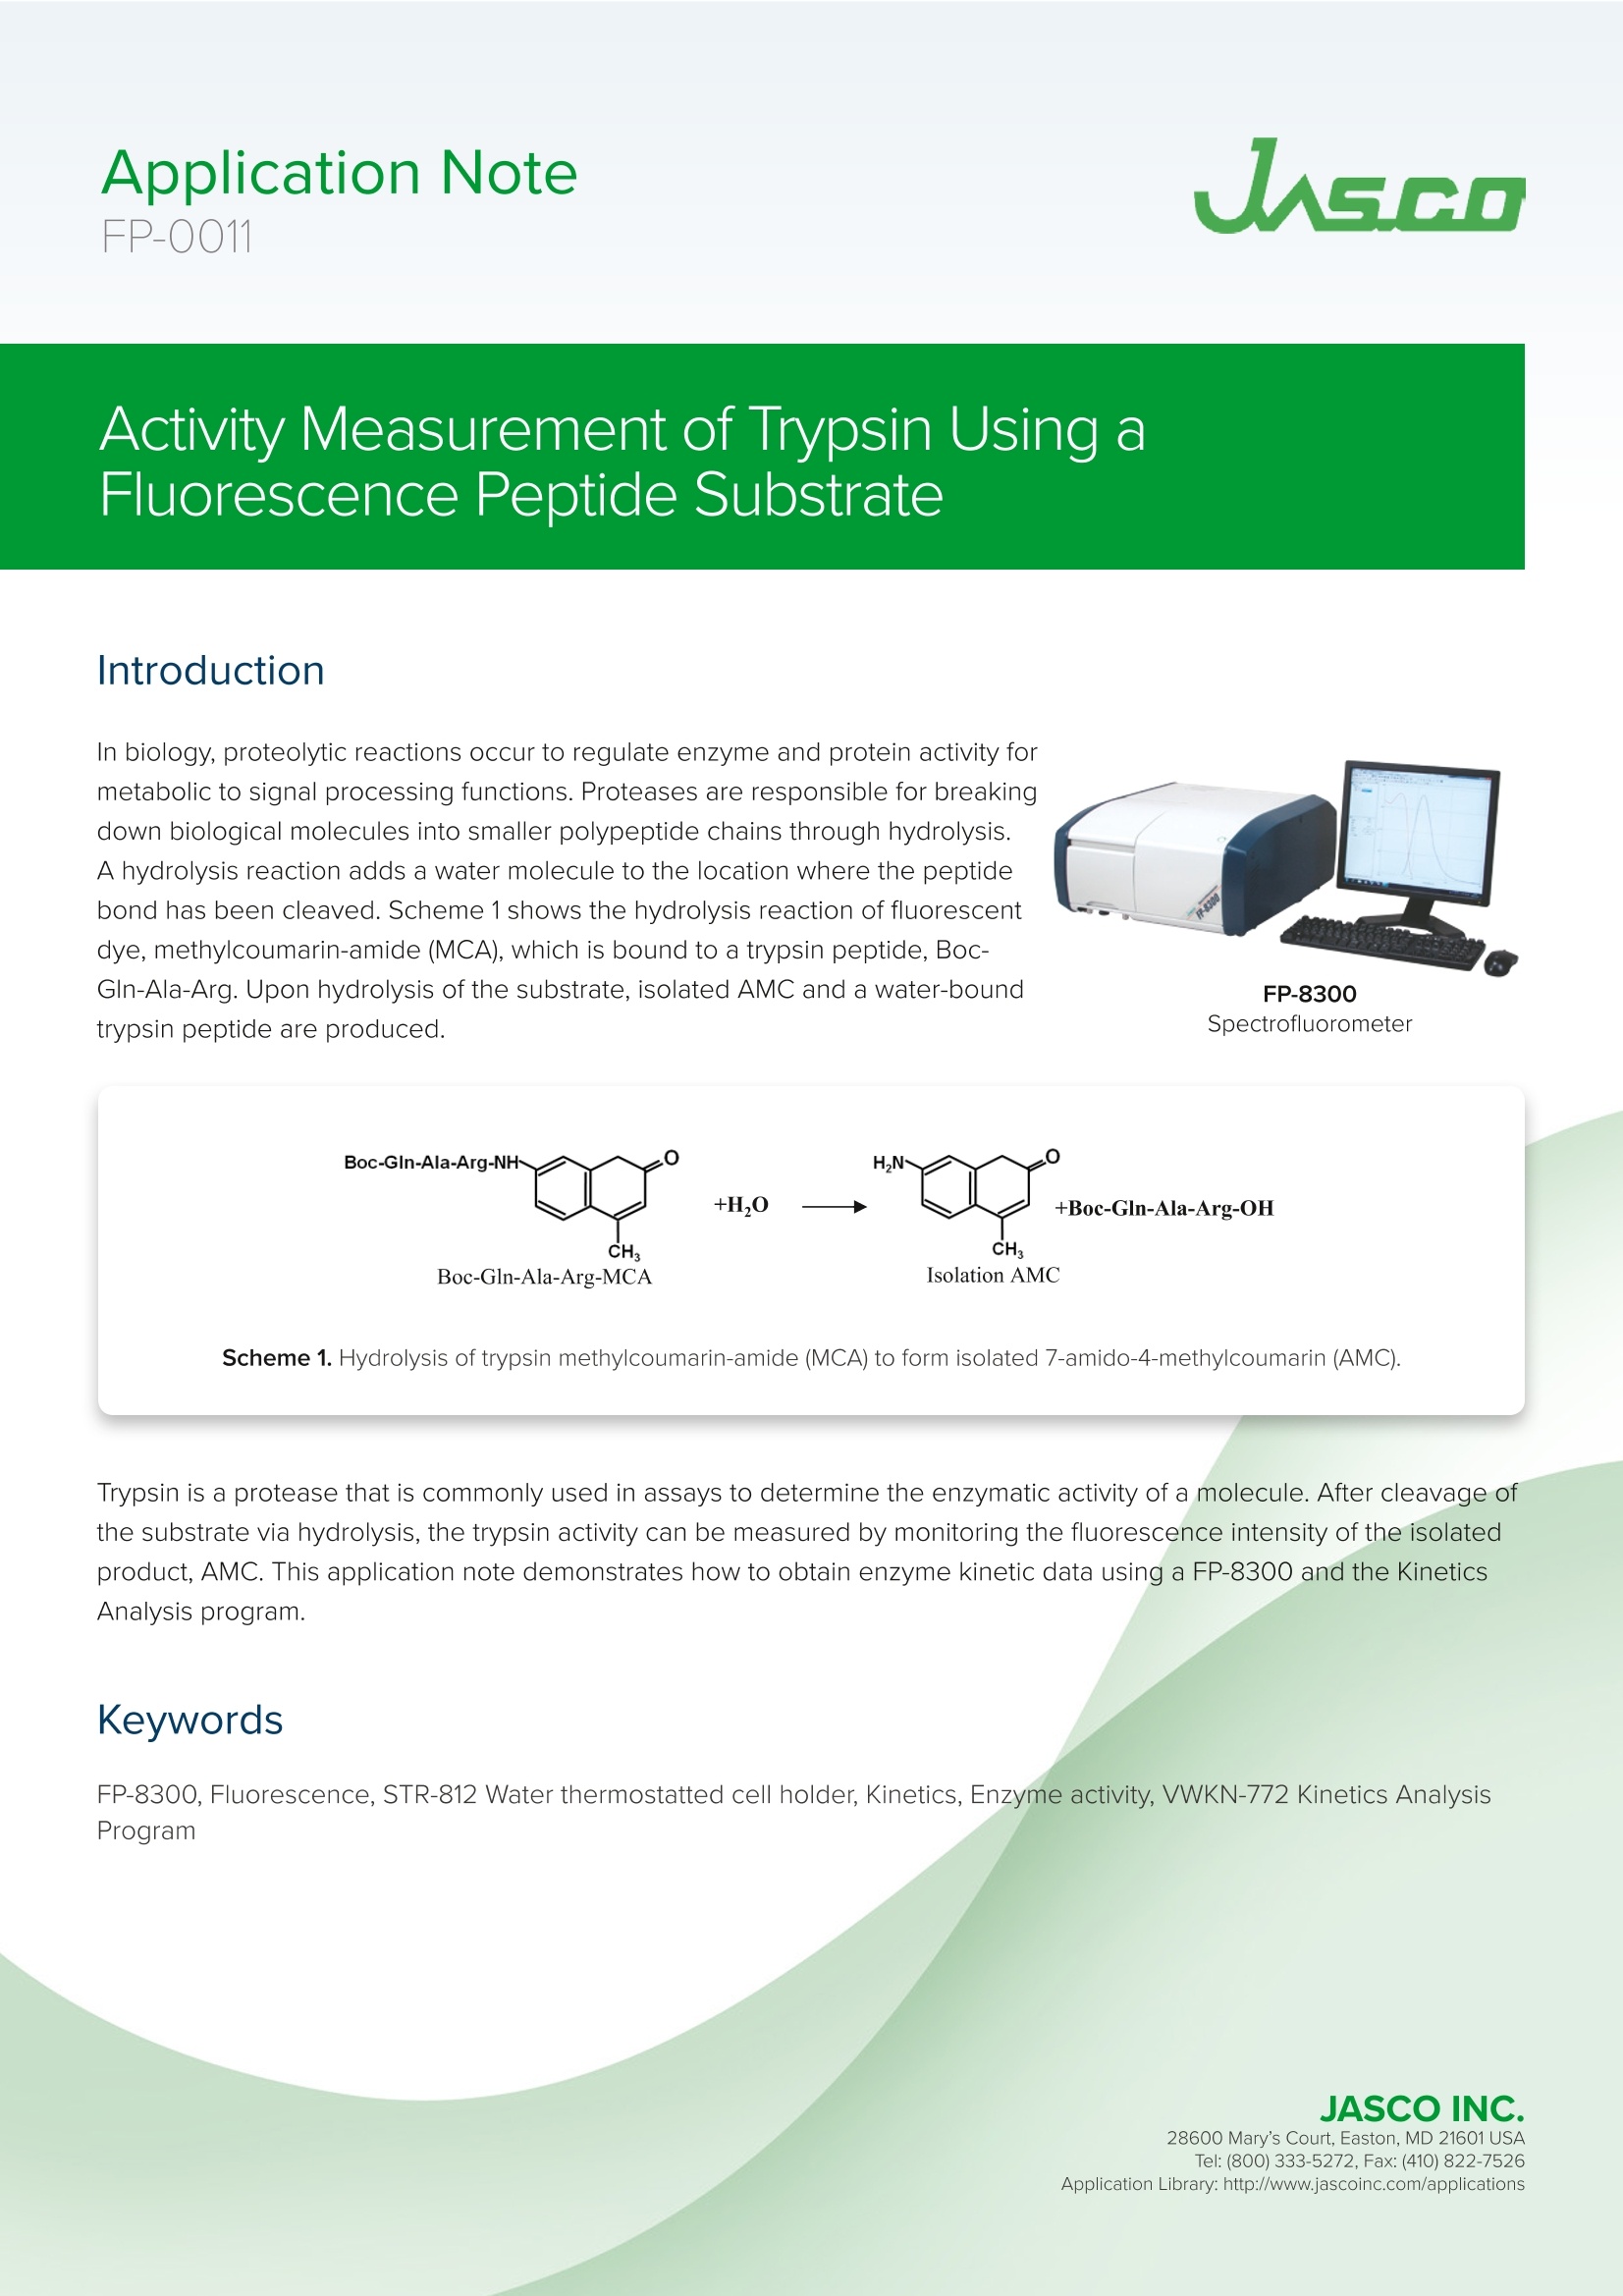
本申请说明演示了如何使用FP-8300和动力学分析程序获得酶动力学数据。
关键词:FP-8300,荧光,STR-812水恒温样品池支架,动力学,酶活性,VWKN-772动力学分析程序
方案详情

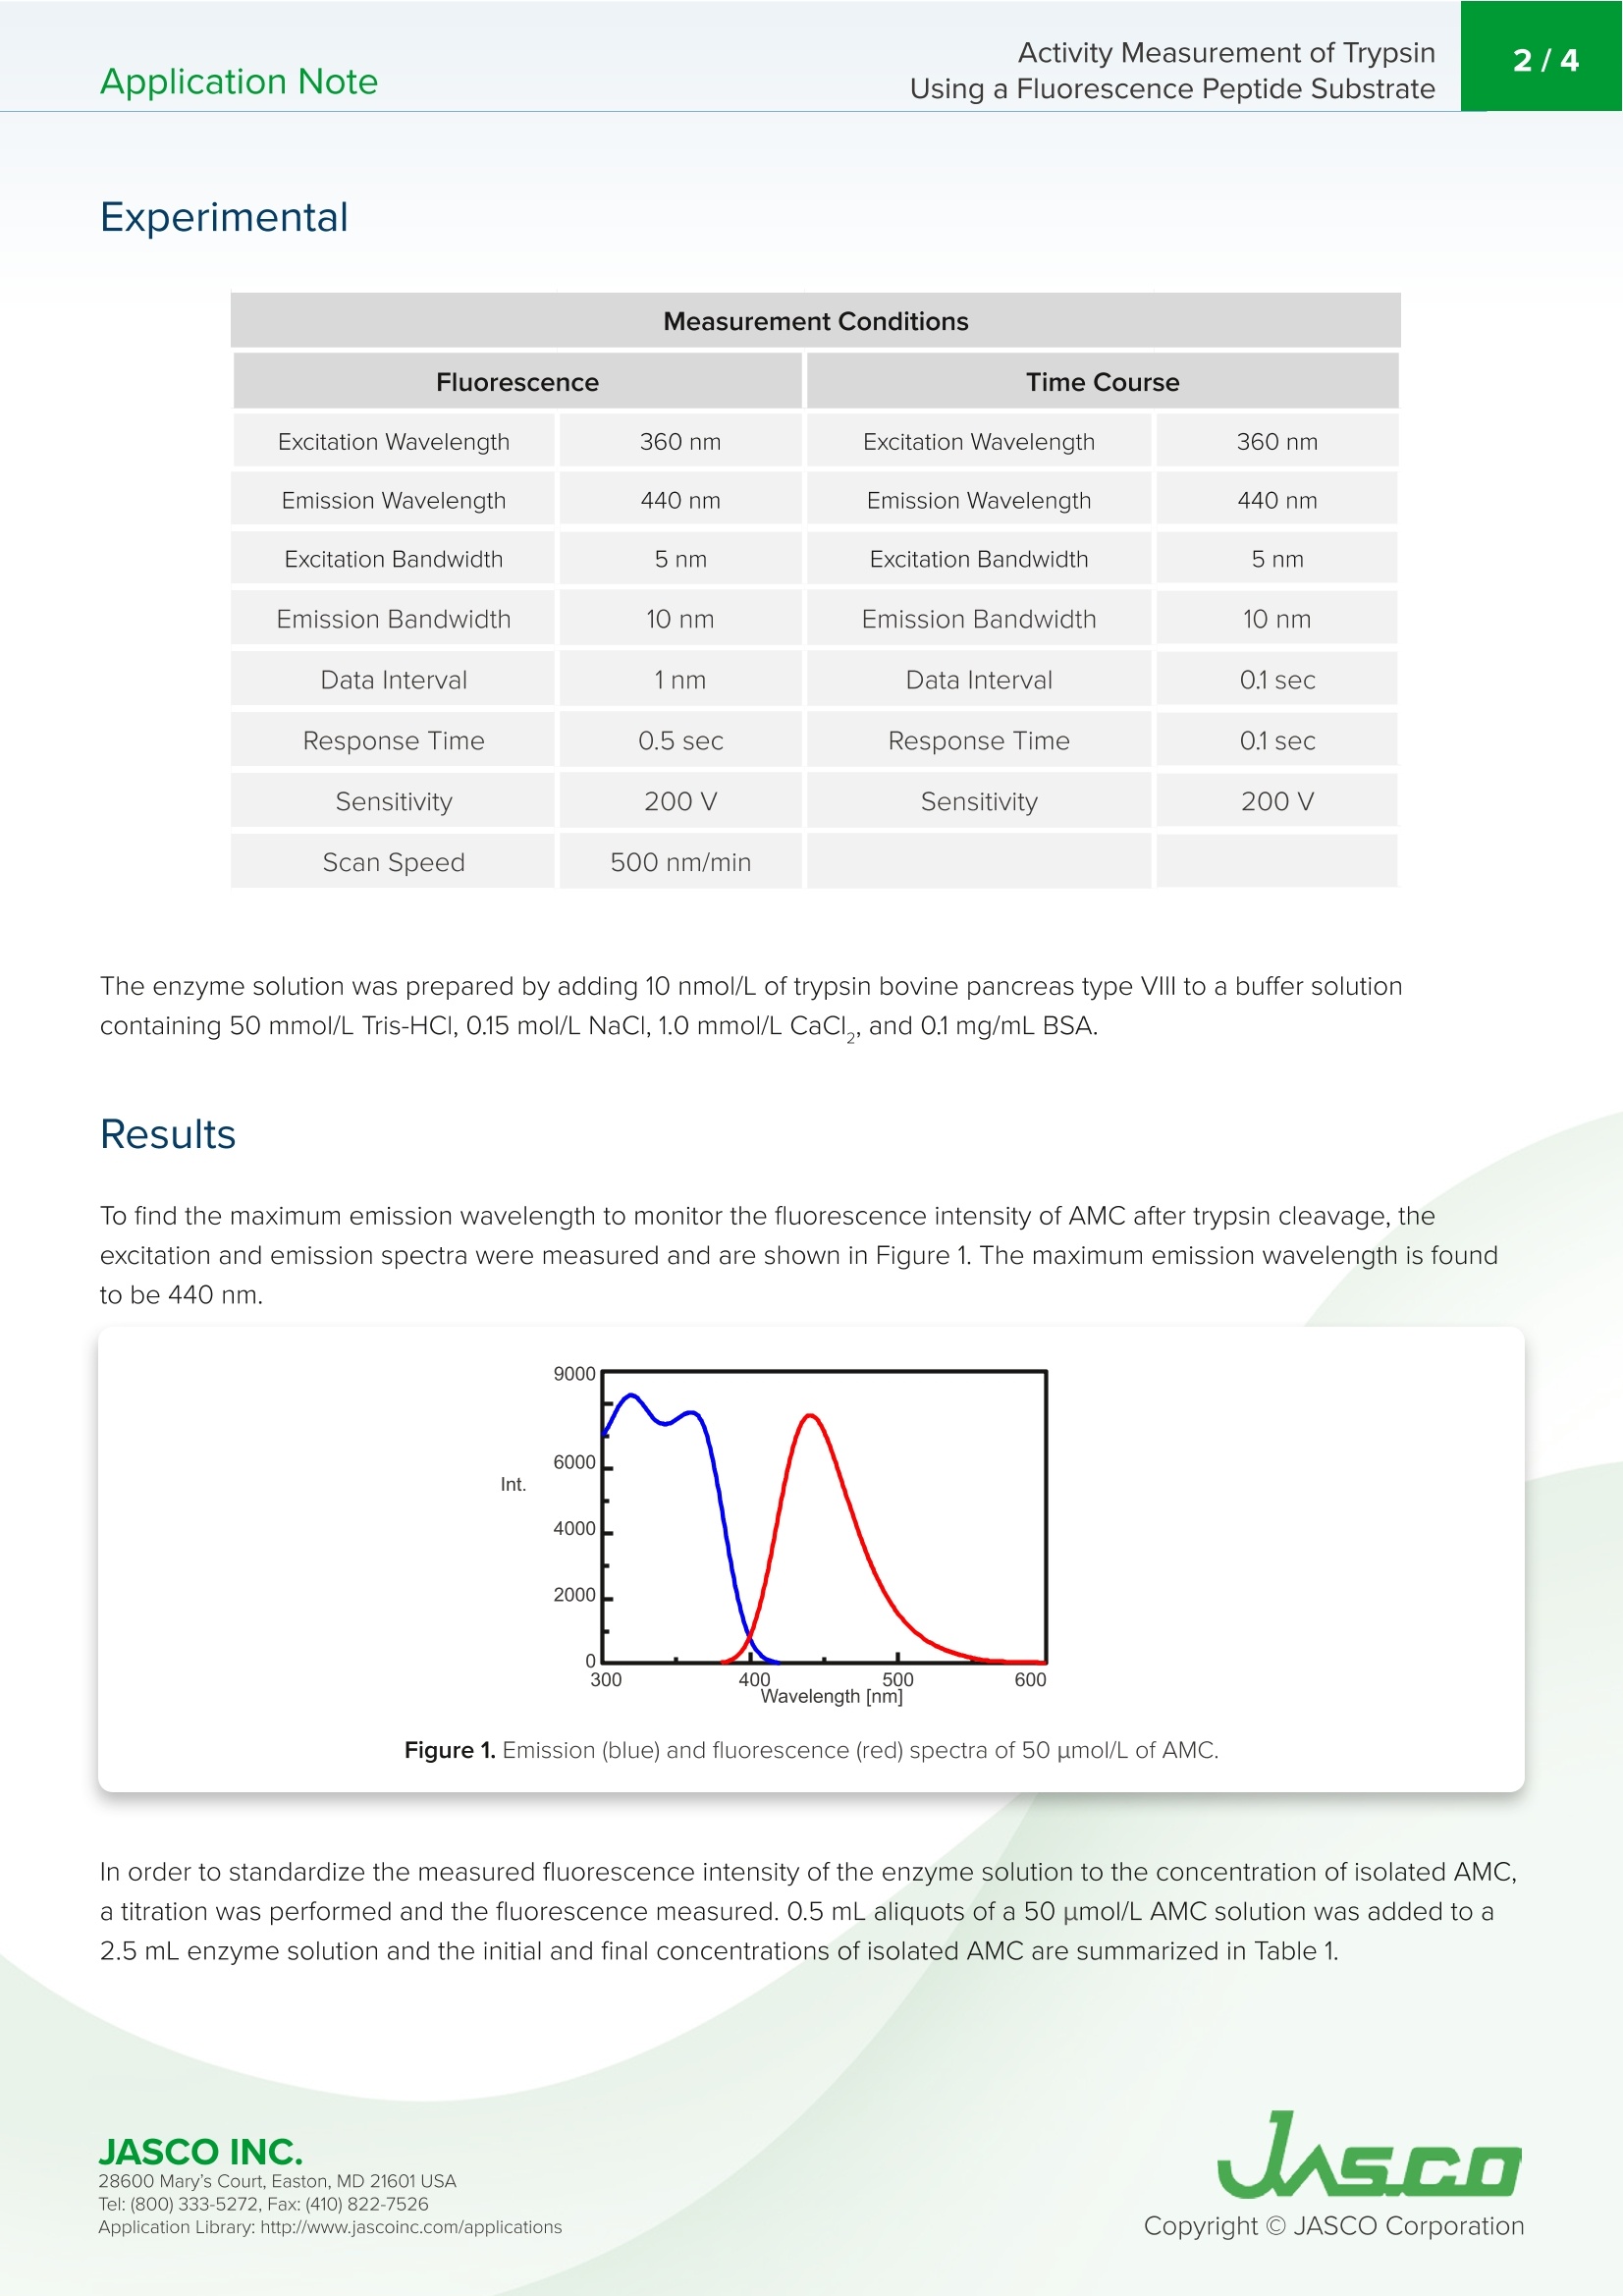
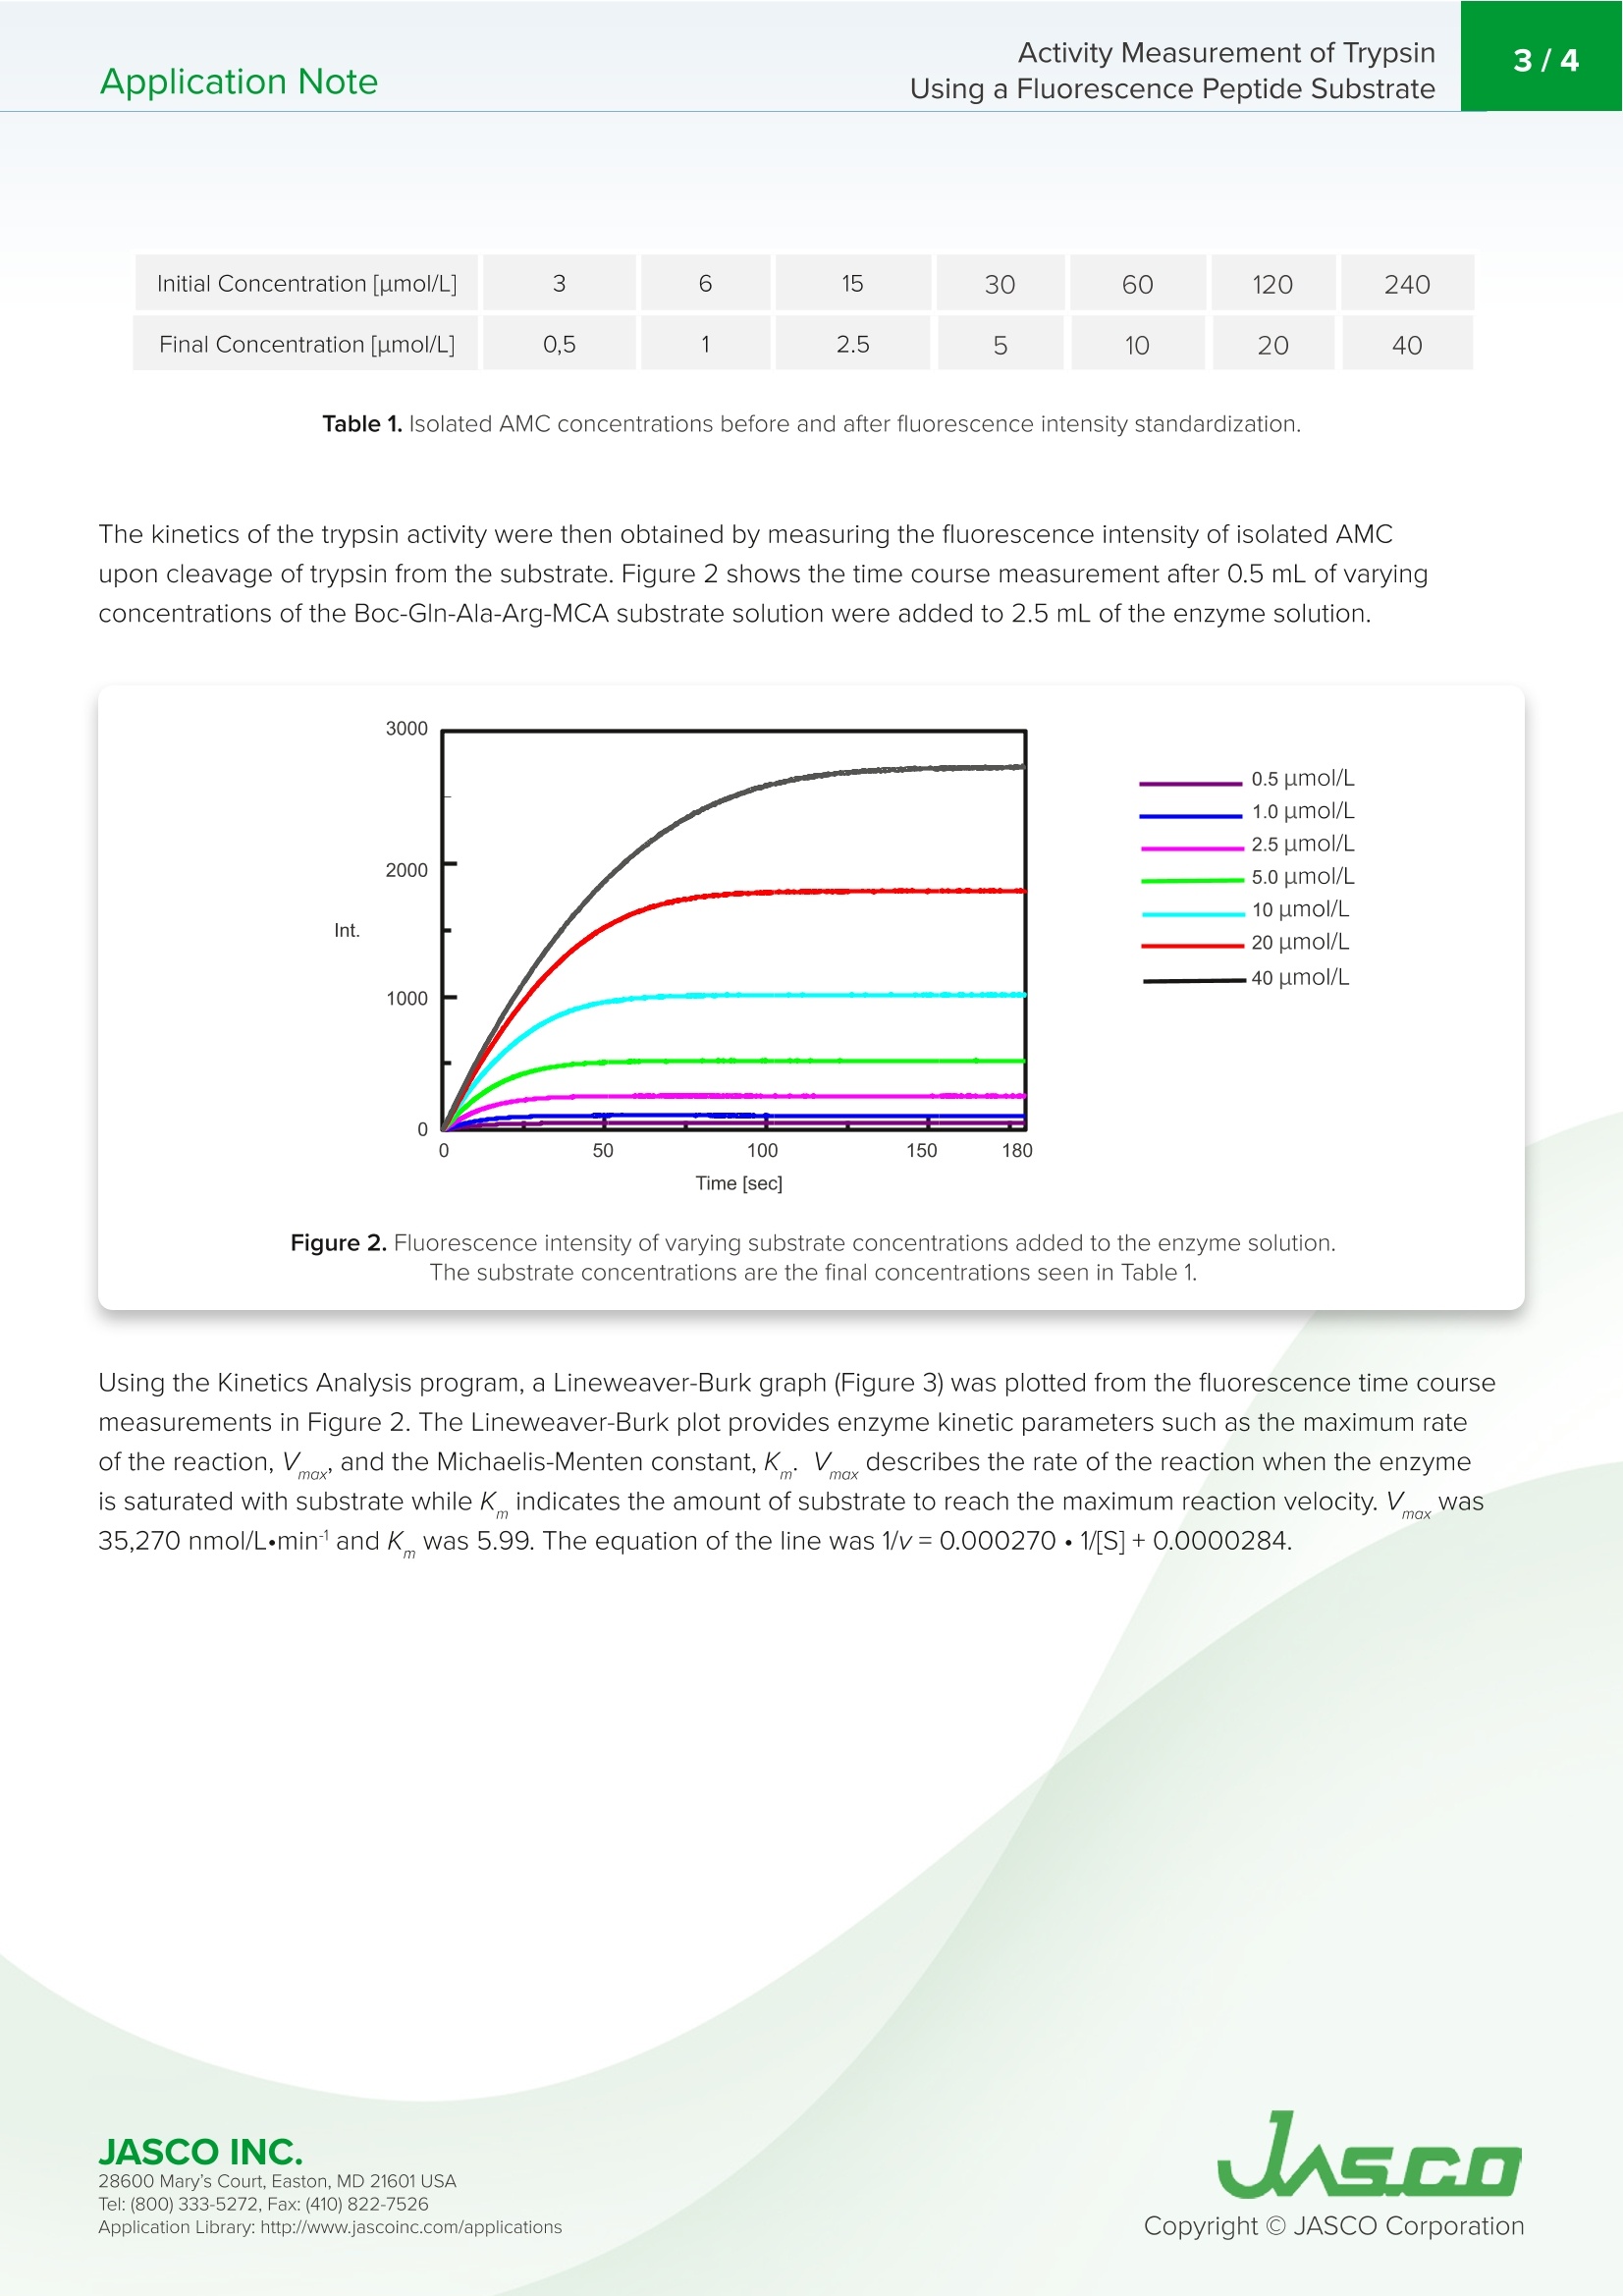
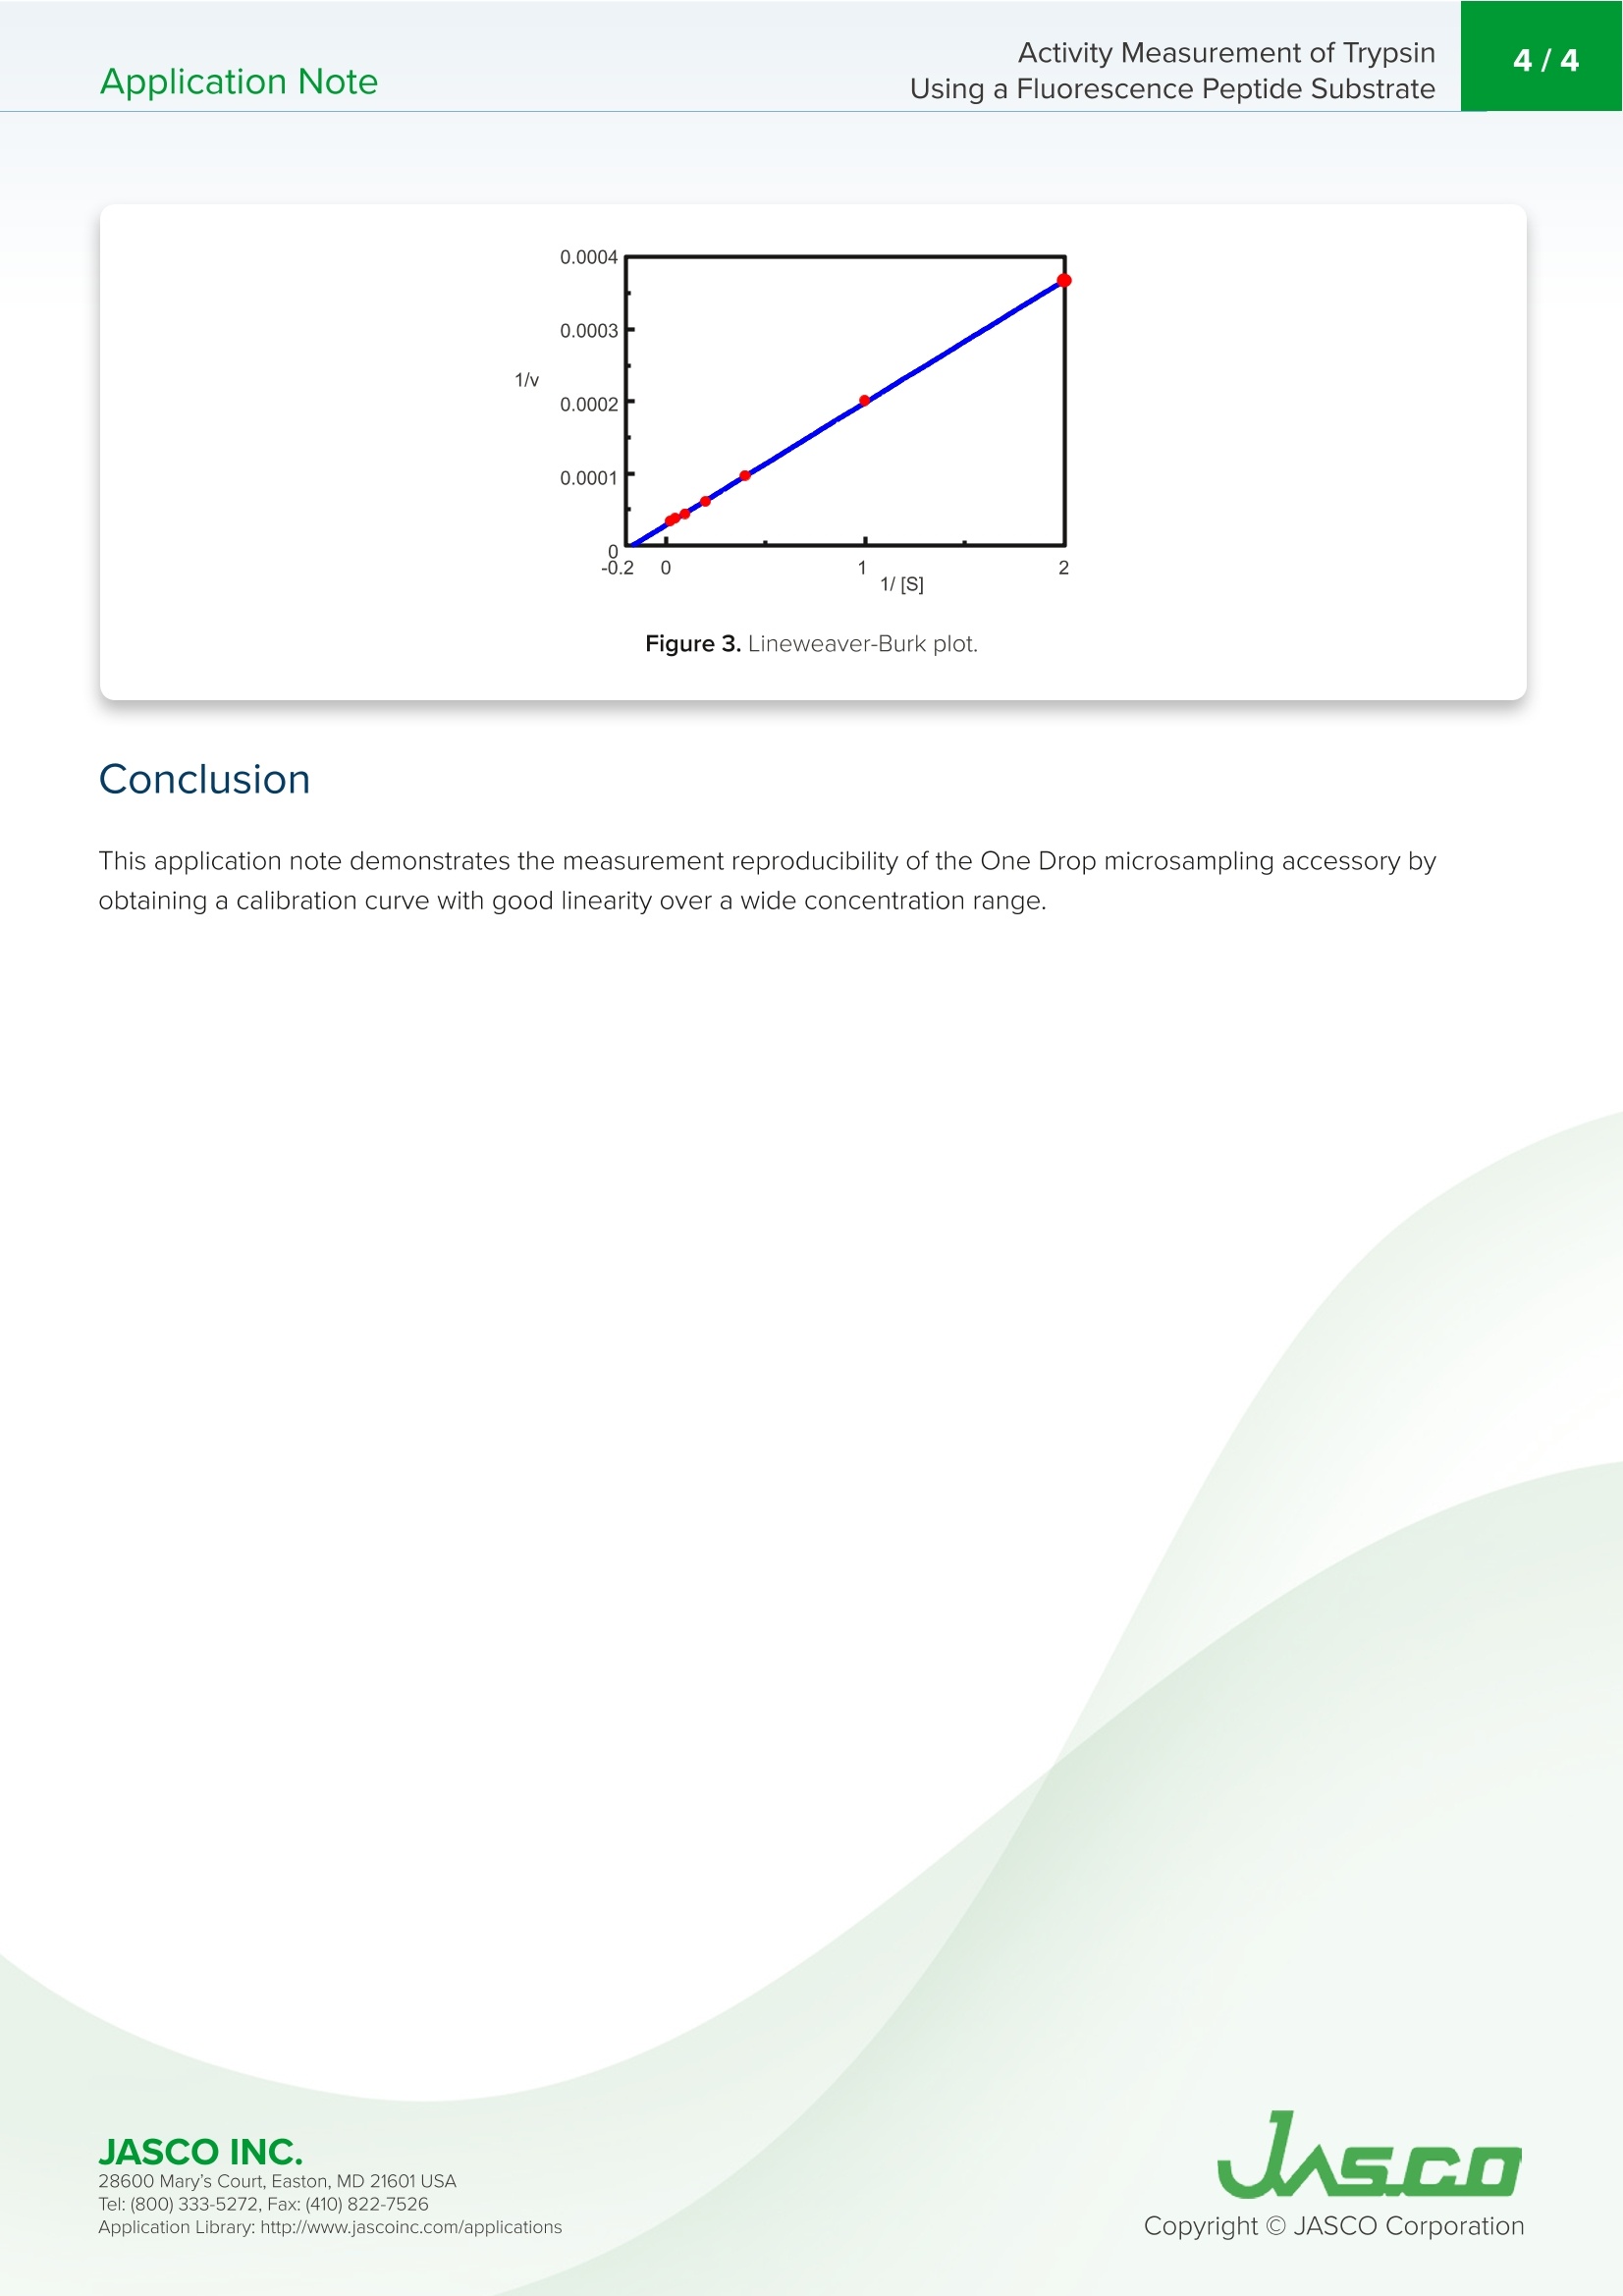
在生物学中,蛋白质水解反应发生调节酶和蛋白质活性,代谢到信号处理功能。蛋白酶负责通过水解将生物分子分解成更小的多肽链。水解反应将一个水分子添加到肽键被裂解的位置。胰蛋白酶是一种蛋白酶,通常用于测定一个分子的酶活性。底物经水解裂解后,可以通过对胰蛋白酶活性的监测和分离产物AMC的荧光强度来测定。Application NoteFP-0011 Activity Measurement of TrypsinUsing a Fluorescence Peptide Substrate2/4Application Note Activity Measurement of Trypsin Using a Fluorescence Peptide Substrate Introdu c tio n I n bio l ogy, proteolytic reactions occur to regulate enzyme and protein act i vity for metabolic to signal processing funct i ons. Proteases are responsible for breaking down biological molecules into smaller p olypept i de chai n s t h roug h h yd r olysis.A hydrolysis reaction adds a water molecule to the location where the peptide bond has been c l eaved. Scheme 1 shows the h yd r olysis r eaction o f fluorescent dye, met h y l coumarin-amide (MCA), which is bou n d to a t rypsin p ept i de, Boc-GI n -Ala-Arg . Upon hydrolysis of the subst r ate, isolated AMC a n d a water -bound tryps i n p e p t i de are produced. FP-8300 Spec t ro fl uorometer Scheme 1. Hyd r ol y s i s o f tryp s i n met hyl co u m ar i n -ami d e (MCA) to f o rm i solated 7-a m ido -4-met h y lcouma ri n (AM C ). T r ypsin is a prot e ase that is commonly u s e d in a s says t o det ermi n e th e e n z ymatic ac ti vi t y of a molecule . After cl e avage of the su b st r ate via hyd r o l ysis, th e t ryps in ac t ivity can be measur e d b y mon it oring the f l u orescence in tensity of the i solated p rodu ct , AMC. Th i s application note demonstrates how to o b tai n e n zyme ki n etic da t a using a FP-8300 and the Kinetics Analysis program. F P -8300, F lu o res c en c e ,S TR-812 Wat e r t h e r mo st a t t ed c el l h ol d e r , Kin eti c s , En z yme activity, VWKN-772 Ki n e tic s Analysi s Pr o g ram Exp e rimental Measurement Conditions Fluorescence Time Course Excitation Wavelength 360nm Excitation Wavelength 360nm Emission Wavelength 440 nm Emission Wavelength 440 nm Excitation Bandwidth 5nm Excitation Bandwidth 5nm Emission Bandwidth 10 nm Emission Bandwidth 10 nm Data Interval 1nm Data Interval 0.1sec Response Time 0.5 sec Response Time 0.1 sec Sensitivity 200V Sensitivity 200V Scan Speed 500 nm/min The e n z yme solu t ion was pr e p a r ed by adding 10 nmol/L of tryps in bovin e pa n creas type VI l l to a b uff er solu ti on contai n ing 50 mmol/L T r i s-HCI , 0.15 mol /L NaCl , 1.0 mmol/L CaCl,, and 0.1 mg/mL BSA. R esu l ts To find the maximum emission waveleng th to moni t or t h e f luorescen c e i ntensity of AMC after t r ypsin c l eavage, the e xcitation a nd e mission s p ec t ra were m e asured a n d are shown in Fig u re 1. T h e maximum emission wav e length i s f ound to b e 440 n m. Figure 1. E missio n (b l u e) and fl u o re sc e n c e (re d) s pe c t ra of 50 u mol /L o f AM C . I n orde r to sta n dardize the measured f luorescence intensity of t he enzyme solution to the co n centrat i on of i solated AMC,a t it r at i o n was performed a n d the f luorescence measured. 0.5 mL aliquots of a 50 umol/L AMC solution was added to a 2.5 mL enzyme solu ti on a n d the init i al and f i nal conce n trations of isolated AMC are summarized in Table 1. 28600 Mary's Cour t , E a s to n , M D 21601US A Initial Concentration [umol/L] Final Concentration [umol/L] 30 60 120 240 5 10 20 40 Table 1. Iso l ated AM C co n cen t rat i o ns b efore and a ft e r f l uorescence in ten si ty st andardizat i o n The kinet i cs o f the trypsin activ i ty were then o b tai n ed by measuring t h e fluorescence intensi t y of isolated AMC upon c l eav a ge o f tryps in from the substrate. Figu r e 2 shows the t i me course measurement after 0.5 mL of varying concentrations of the Boc -GIn-Ala -Arg-MCA substra t e solution we r e added to 2.5 mL of the enzyme solution. 0.5 um ol /L 1.0 umol/L 2.5 umol/L 5.0 u m ol/L 10 u mol/L 20 u mol /L .40 u mol/L Figure 2. Fl u o r e s cen c e i n ten si ty o f v ary i n g s u bs t r a te concen tr a tion s add e d to t h e enzy me so lu t ion .Th e subs t ra te co n c en trations a re t he fi n al co n c en tration s s ee n i n T a b le 1. Using the K i netics Analysis program, a L i neweaver -Burk g r a p h (F i gure 3) was plott e d from t he f luorescence t ime course measureme n ts in Figure 2. Th e L i neweaver -Burk plot provides enzyme k in e t i c pa r ameters such a s t he maximum rate of the reaction, V, and t h e Mic h ael i s-Me n ten co n sta n t , K.V descr ib es th e rate o f t h e r eaction when the enzyme is saturated wit h substrate while K i n dicates t h e amou n t of substrate to reach the maximum r eac t ion velocity. V was 35,270 nmol /L·minand K was 5.99. T h e equation of the l i ne was 1/v =0.000270·1/[S ]+0.0000284. JASCO INC. 28600 Mary's Cour t , E a s to n , M D 21601US A Figure 3. L i n e w e a ver-B ur k p lo t . C onclusion This application note demo n strates the measuremen t r eproducibility of the One Drop microsam p l i ng accessory by obtaining a calibration curve with good linea ri ty over a wide concentration range. 28600 Mary's Cour t , E a s to n , M D 21601US A
确定
还剩2页未读,是否继续阅读?

产品配置单

佳士科商贸有限公司为您提供《用荧光肽底物测定胰蛋白酶的活性》,该方案主要用于天然高分子材料中动力学分析、酶活性、荧光检测,参考标准--,《用荧光肽底物测定胰蛋白酶的活性》用到的仪器有JASCOFP-8000系列荧光光谱仪
推荐专场
相关方案
更多
该厂商其他方案
更多