


方案详情
文
作为PARAFAC成分分析的一个例子,本申请说明显示了混合样品(色氨酸、腐殖酸和黄腐酸)的3D荧光测量和成分分析结果。
关键词:FP-8300,荧光,PARAFAC(平行因子分析),EEM(激发发射矩阵),CDOM(显色溶解有机物),IFE(内滤效应)
方案详情

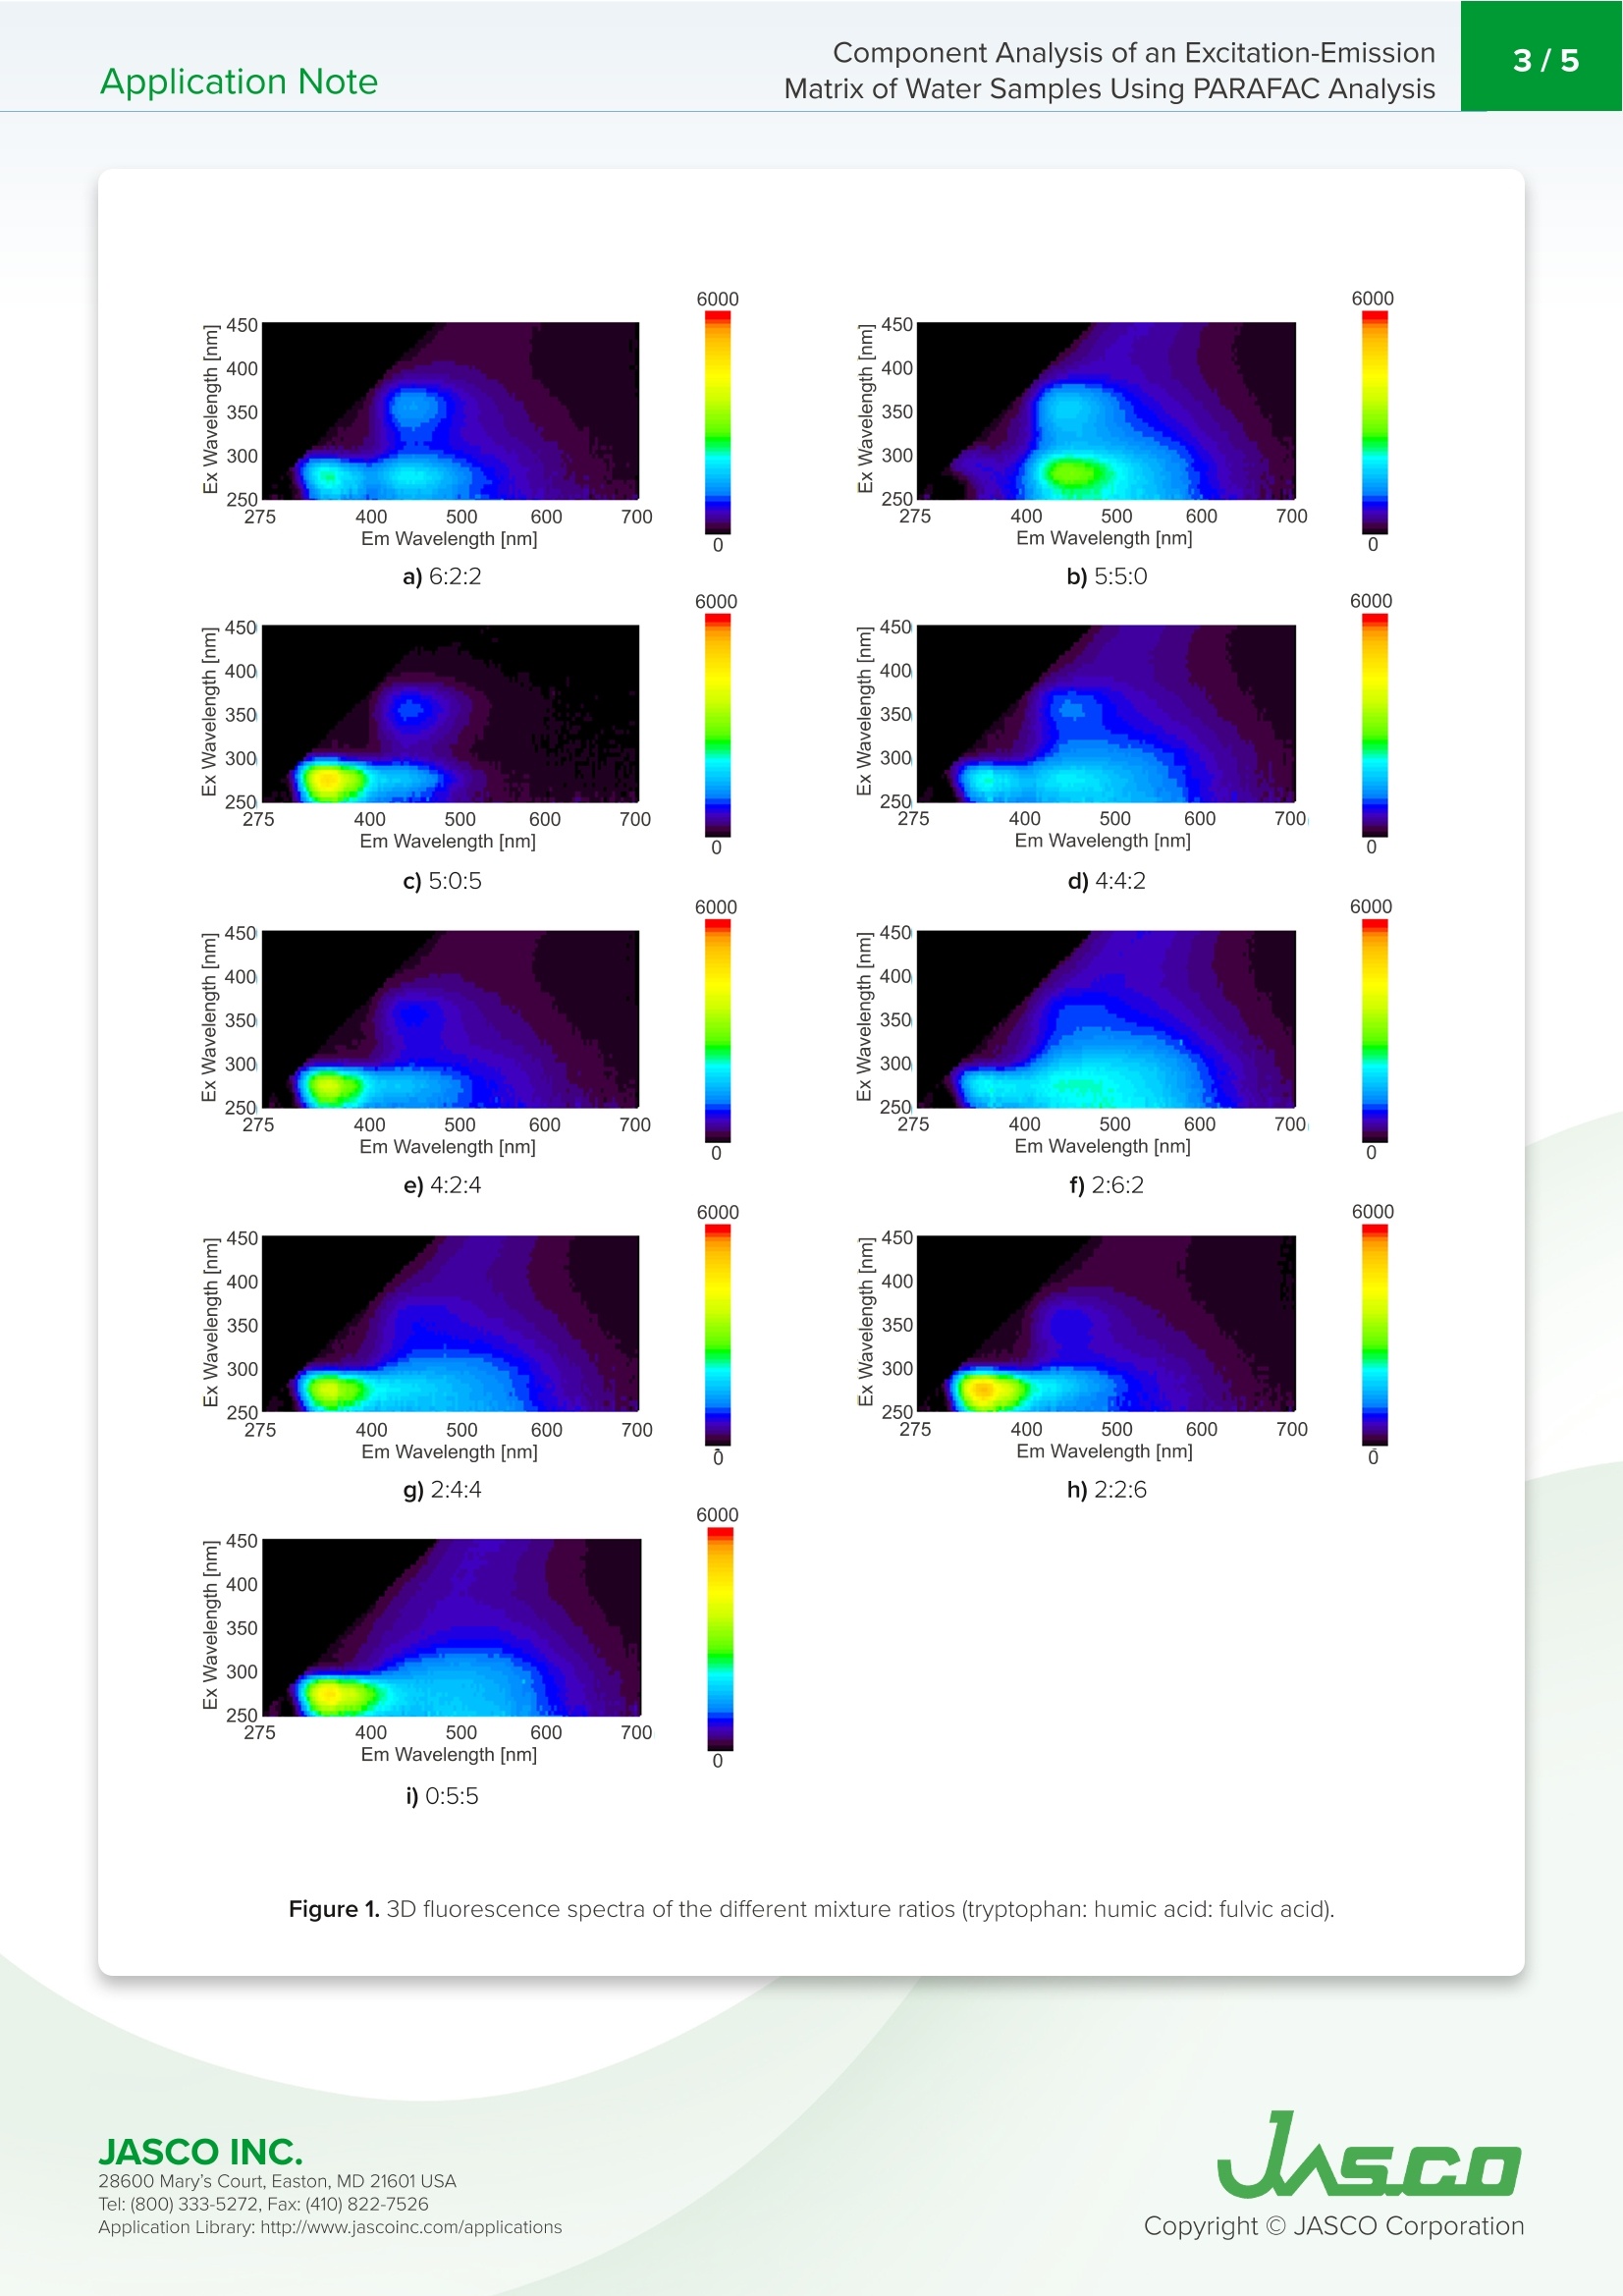
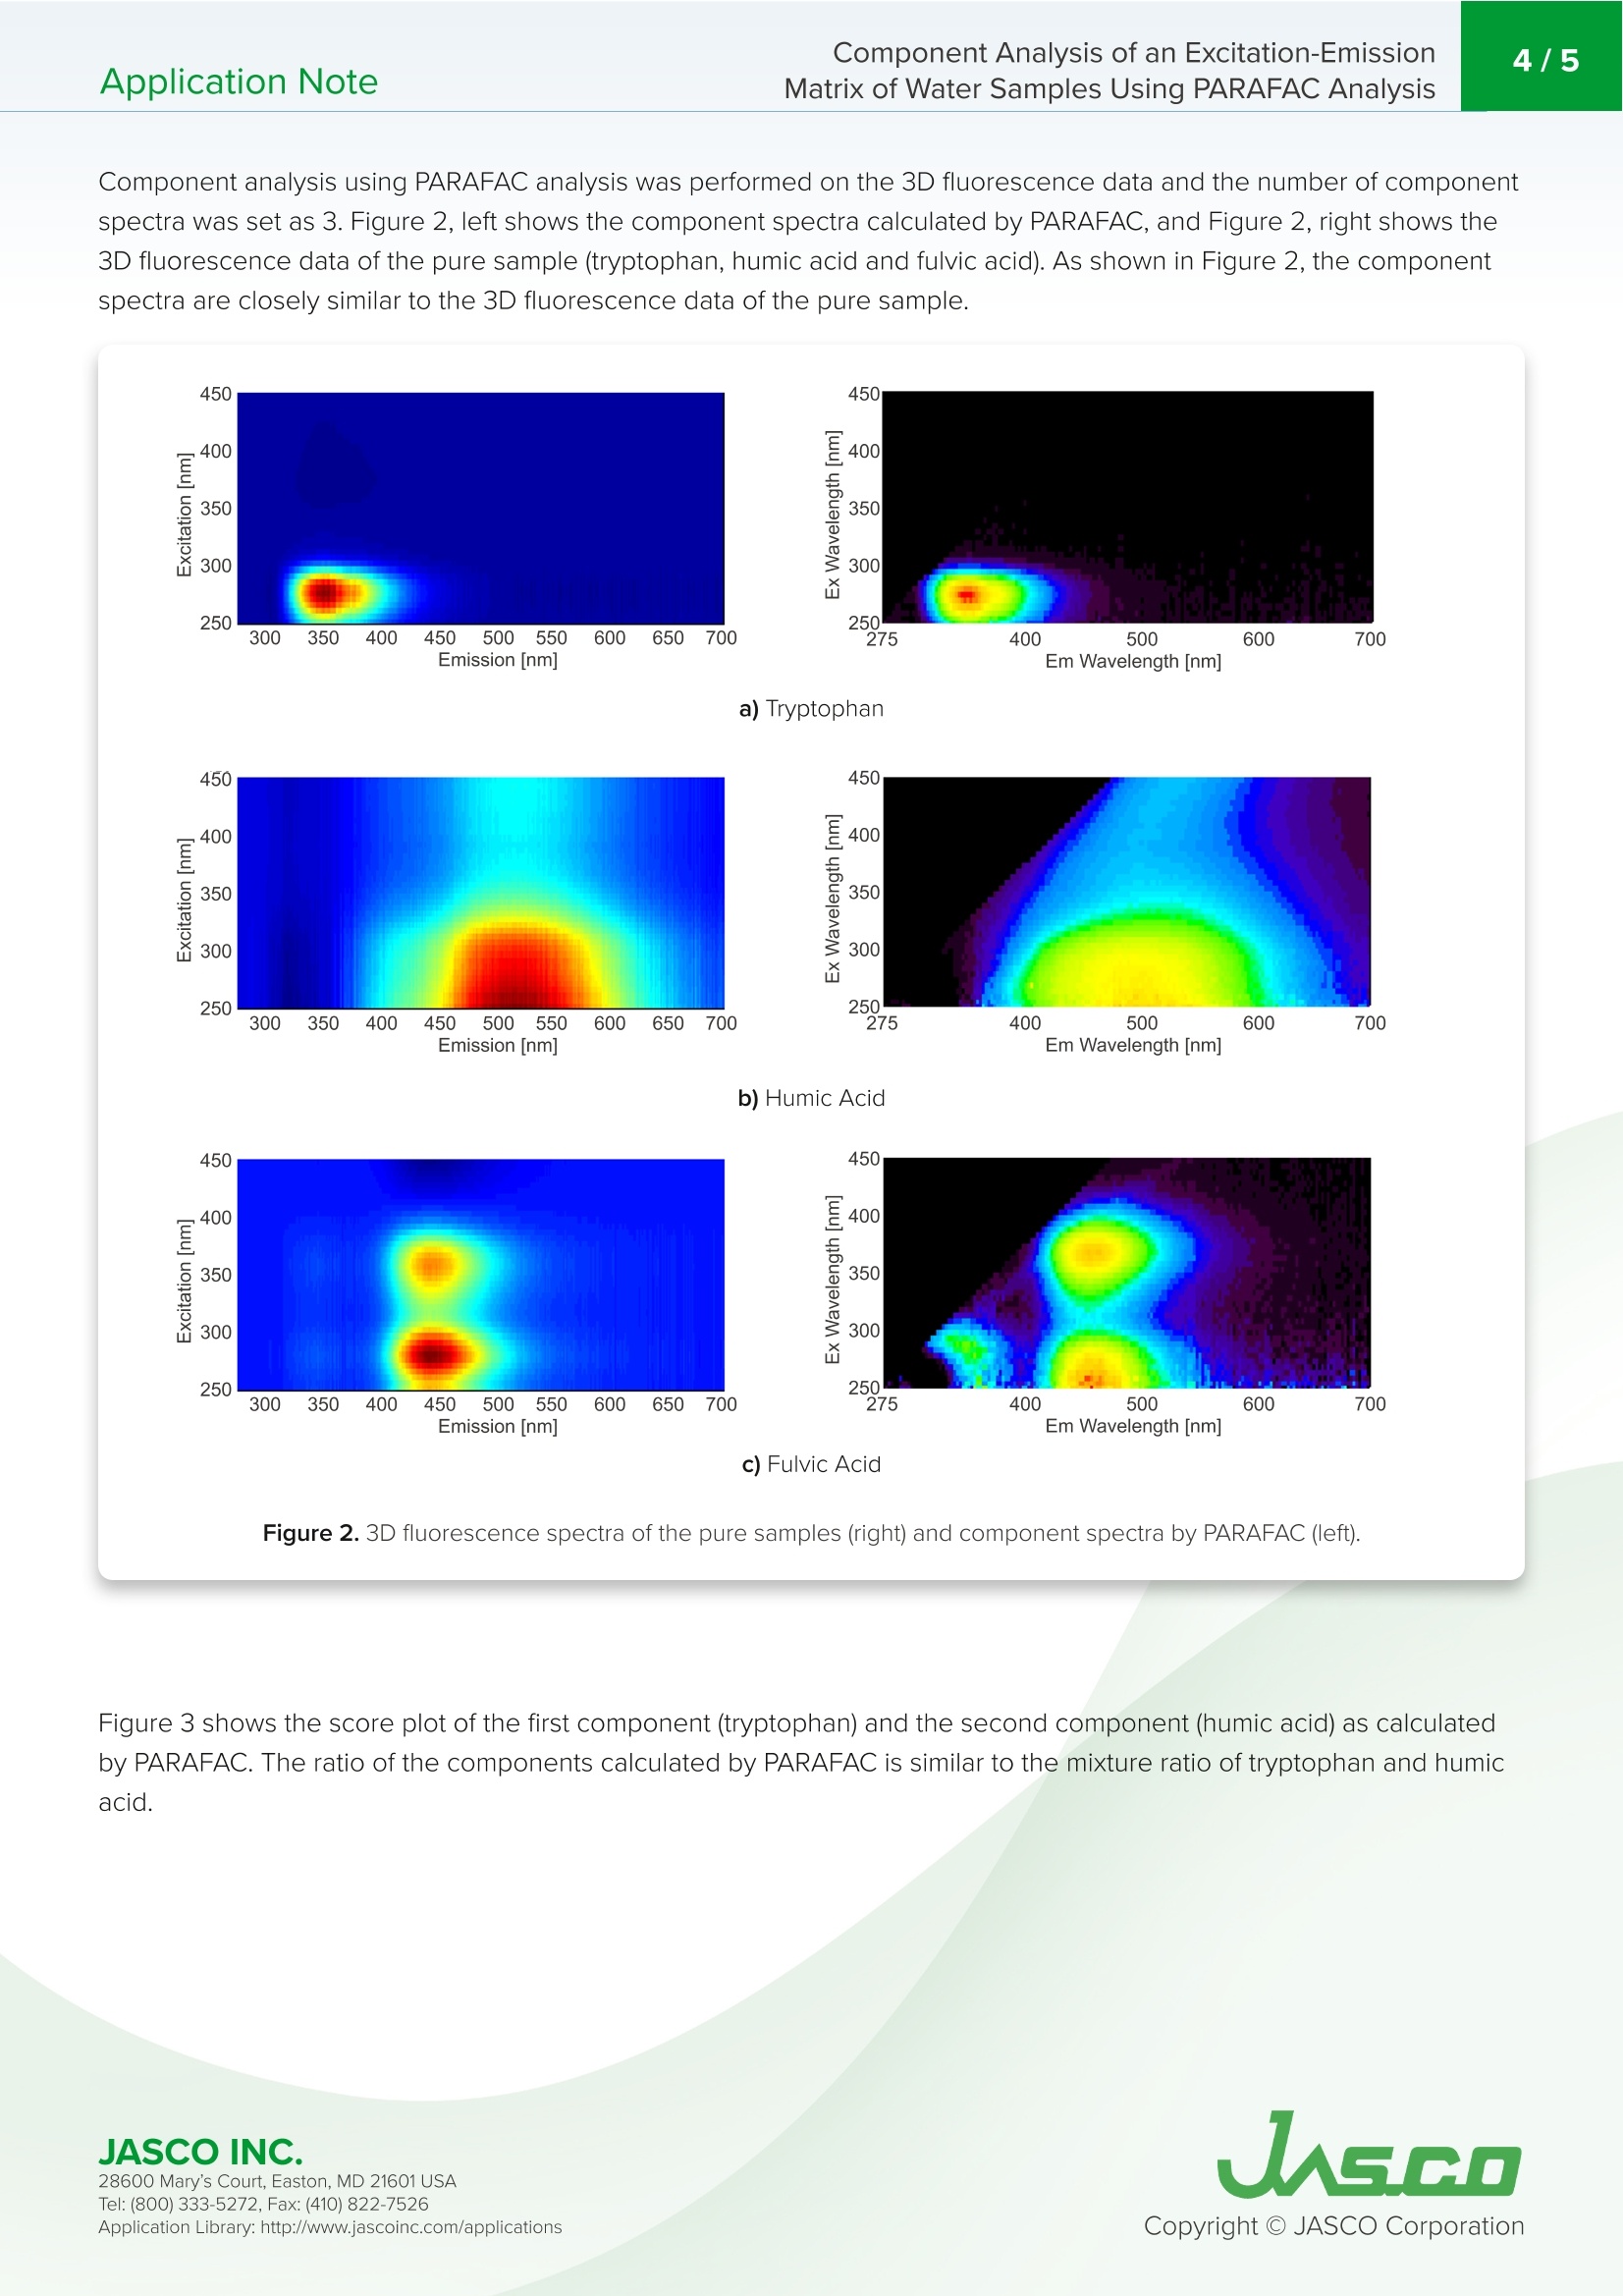
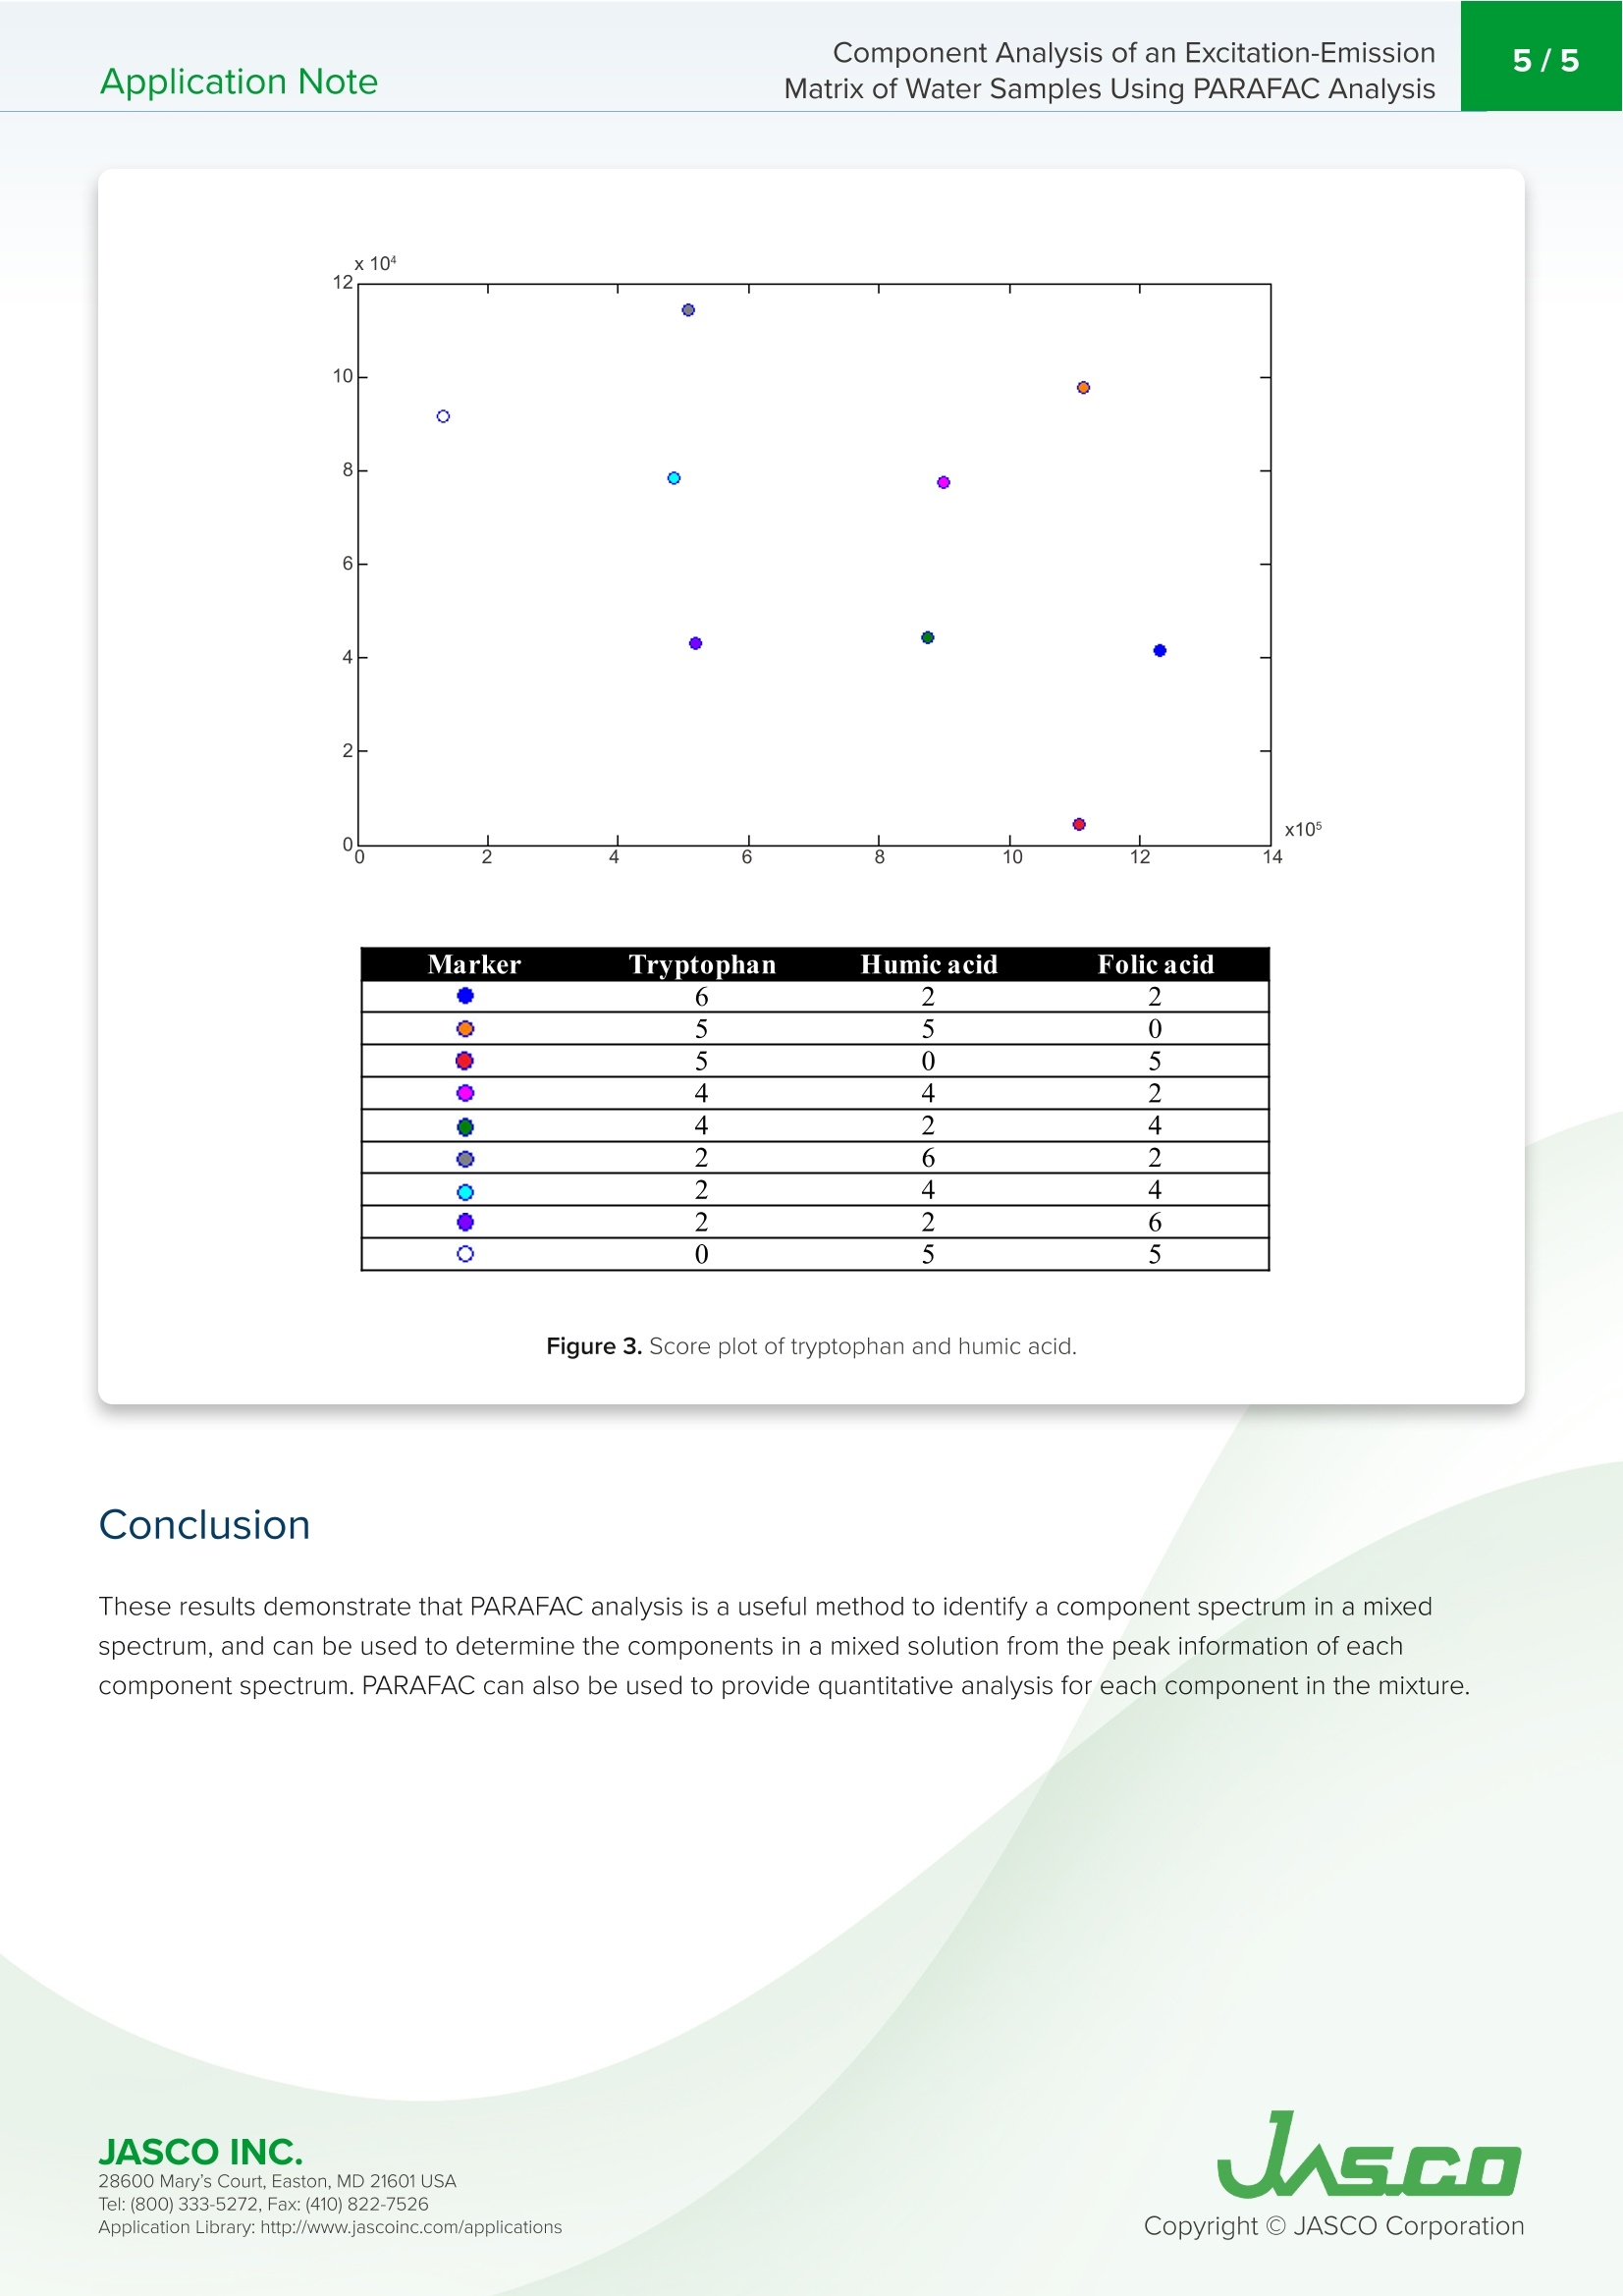
激发发射矩阵(EEM)可以用于各种各样的应用,特别是在环境水的分析中。EEM提供以下信息:(1) 确定环境水和发色溶解有机物(CDOM)的来源;(2)监测受气候模式或当地天气等影响的成分变化。环境水通常含有多种荧光物质(腐殖酸、黄腐酸、蛋白质、氨基酸、叶绿素、合成化合物等),使用EEM的分析包括几个荧光峰,导致可能难以解释的非常复杂的数据。并行因子分析(PARAFAC)是一种多变量分析,可用于从混合的三维荧光数据中提取成分。JASCO使用PARAFAC开发了一种先进的解决方案,可以帮助解释EEM中发现的复杂数据。Application NoteFP-0020 2/5 Component Analysis of an Excitation-EmissionM atrix of Water Samples Using PARAFAC Analysis Introductio n Excitation-Emission Matrix (EEM) can be used in a wide variety of applications, especially i n the analysis of envi r onmental water. EEM provides the fol l owing informat i on; (1) determining of the or i g in of environmenta l water and chromophoric dissolved organ i c matter (CDOM), (2) monitor i n g of the component variation f r om i nfluences s u ch as climate patter n s or local weat h er. Env i ronmental wate r typically contains a va ri ety of f l uorescent materials (humic ac i d , fulvic acid, protein, amino acid, chlorophyll, synt h e t ic compou n ds etc.)and analysis using EEM includes seve r al f l uorescence peaks, r esulting in very compl i cated data wh i c h may be di f ficult to interpret . FP-8300 Spectrof l uorometer Parallel F actor Analysis (PARAFAC) is a type of multivar i able analysis, which can be used to extract the components from m i xed 3D f l uorescence da t a. JASCO has developed a n advanced sol u tion using PARAFAC,which can help to interpret the compl i cated da t a found i n the EEM. As a n example of component analys i s by PARAFAC, this applicat i on n ote shows t h e 3D fluoresce n ce measurement and componen t analysis results of a mixed sample (Tryptopha n , humic acid and fu l vic a c id). Keyword s 28600 Ma r y 's C ou r t, Easton, M D 21601 US A Component Ana l ysis of an Excitation-Emission Appl i c a t i on Note Matr i x of Wate r Samples Usi n g PARAFAC Analysis E xp e rimental Excitation Bandwidth 5nm Emission Bandwidth 10nm Response Time 50 msec Scan Speed 500 nm/min Sensitivity High Data Interval 1nm Solu t ions of tr yptophan (0.0175 mg/L), humic ac i d (0.5 mg/L ) a n d fulvic acid (1 mg/L) were prepared in t h e fol l owing mixture ratios (tryptophan: humic ac i d : fulvic acid): 6:2:2, 5:5:0, 5:0:5, 4:4:2, 4:2:4,2:6:2,2:4:4, 2:2:6,0:5:5. Th e e xc i tation and e missio n s p ec t ra were obtain e d and co r r e ct e d for using cal i brat e d light sou r c e s (Wl an d D,). R esu l ts The 3D f luorescence spectra o f u l t ra pure water and sample were obtained and cor r ected for using the calibrated exc i tation emissio n spectra. T he ultra pu r e water spec t ra were t he n subtracted f r om t h e sample spect r a to remove the wate r Raman p eaks. The subtracted sample spect r a a r e shown in Figure 1. 28600 Mary's Cour t , E a s to n , M D 21601US A Component analysis using PARAFAC analysis was performed on the 3D fluorescence data and the n umber of component spectra was set as 3. Figure 2, lef t shows t he compone n t spectra calculated by PARAFAC, and Figu r e 2, r i ght shows the 3D fluorescence data of the pure sample (tryptophan, hum i c ac i d a n d fulv i c acid). As shown in Figure 2, the component spectra are closely similar to the 3D f l u orescence data of the pure sample. Figure 2. 3D fl u or e sc en ce sp e c t ra o f t he pu r e sa m p le s (r i g h t ) an d c omp on ent s p e c t r a by P ARAFAC (lef t). Figure 3 shows the score plot of the f ir st component (tryptopha n ) and the second component (humic ac i d) as calculated by PARAFAC. The r atio of the components ca l culated by PARAFAC i s similar to the mixture ratio of tryptophan and humic acid. 28600 Mary's Cour t , E a s to n , M D 21601US A UASGO Figure 3. S core p lo t of t r y ptoph an an d h u mi c a c id. Conclusion These results demonstrate that PARAFAC analys i s i s a useful met h od to ide n ti f y a compone n t spectrum in a mixed spec t rum, and ca n b e used to determine t h e components in a mixed solu ti o n fr om the peak i nformation of each compon en t spectrum. PARAFAC can also be us e d to provide quant it a ti ve anal y s i s f or each component in t h e mixture. JASCO INC. 28600 Mary's Cour t , E a s to n , M D 21601US A UASGO T el : (800) 333-5272, Fa x : (410) 822-7526 A ppli c a tio n Lib r ary: htt p://www.jas co in c .c o m/a pp l icatio n s
确定
还剩3页未读,是否继续阅读?

产品配置单

佳士科商贸有限公司为您提供《基于PARAFAC分析的水样激发-发射矩阵的分量分析》,该方案主要用于天然高分子材料中激发-发射、分量分析检测,参考标准--,《基于PARAFAC分析的水样激发-发射矩阵的分量分析》用到的仪器有JASCOFP-8000系列荧光光谱仪
推荐专场
相关方案
更多
该厂商其他方案
更多