


方案详情
文
在本申请说明中,几个样品的荧光光谱将使用积分球获得,量子产率将使用绝对法计算,并与文献值进行比较。
关键词:FP-8500,ILF-835,FWQE-880,积分球,荧光,量子产率,绝对法
方案详情

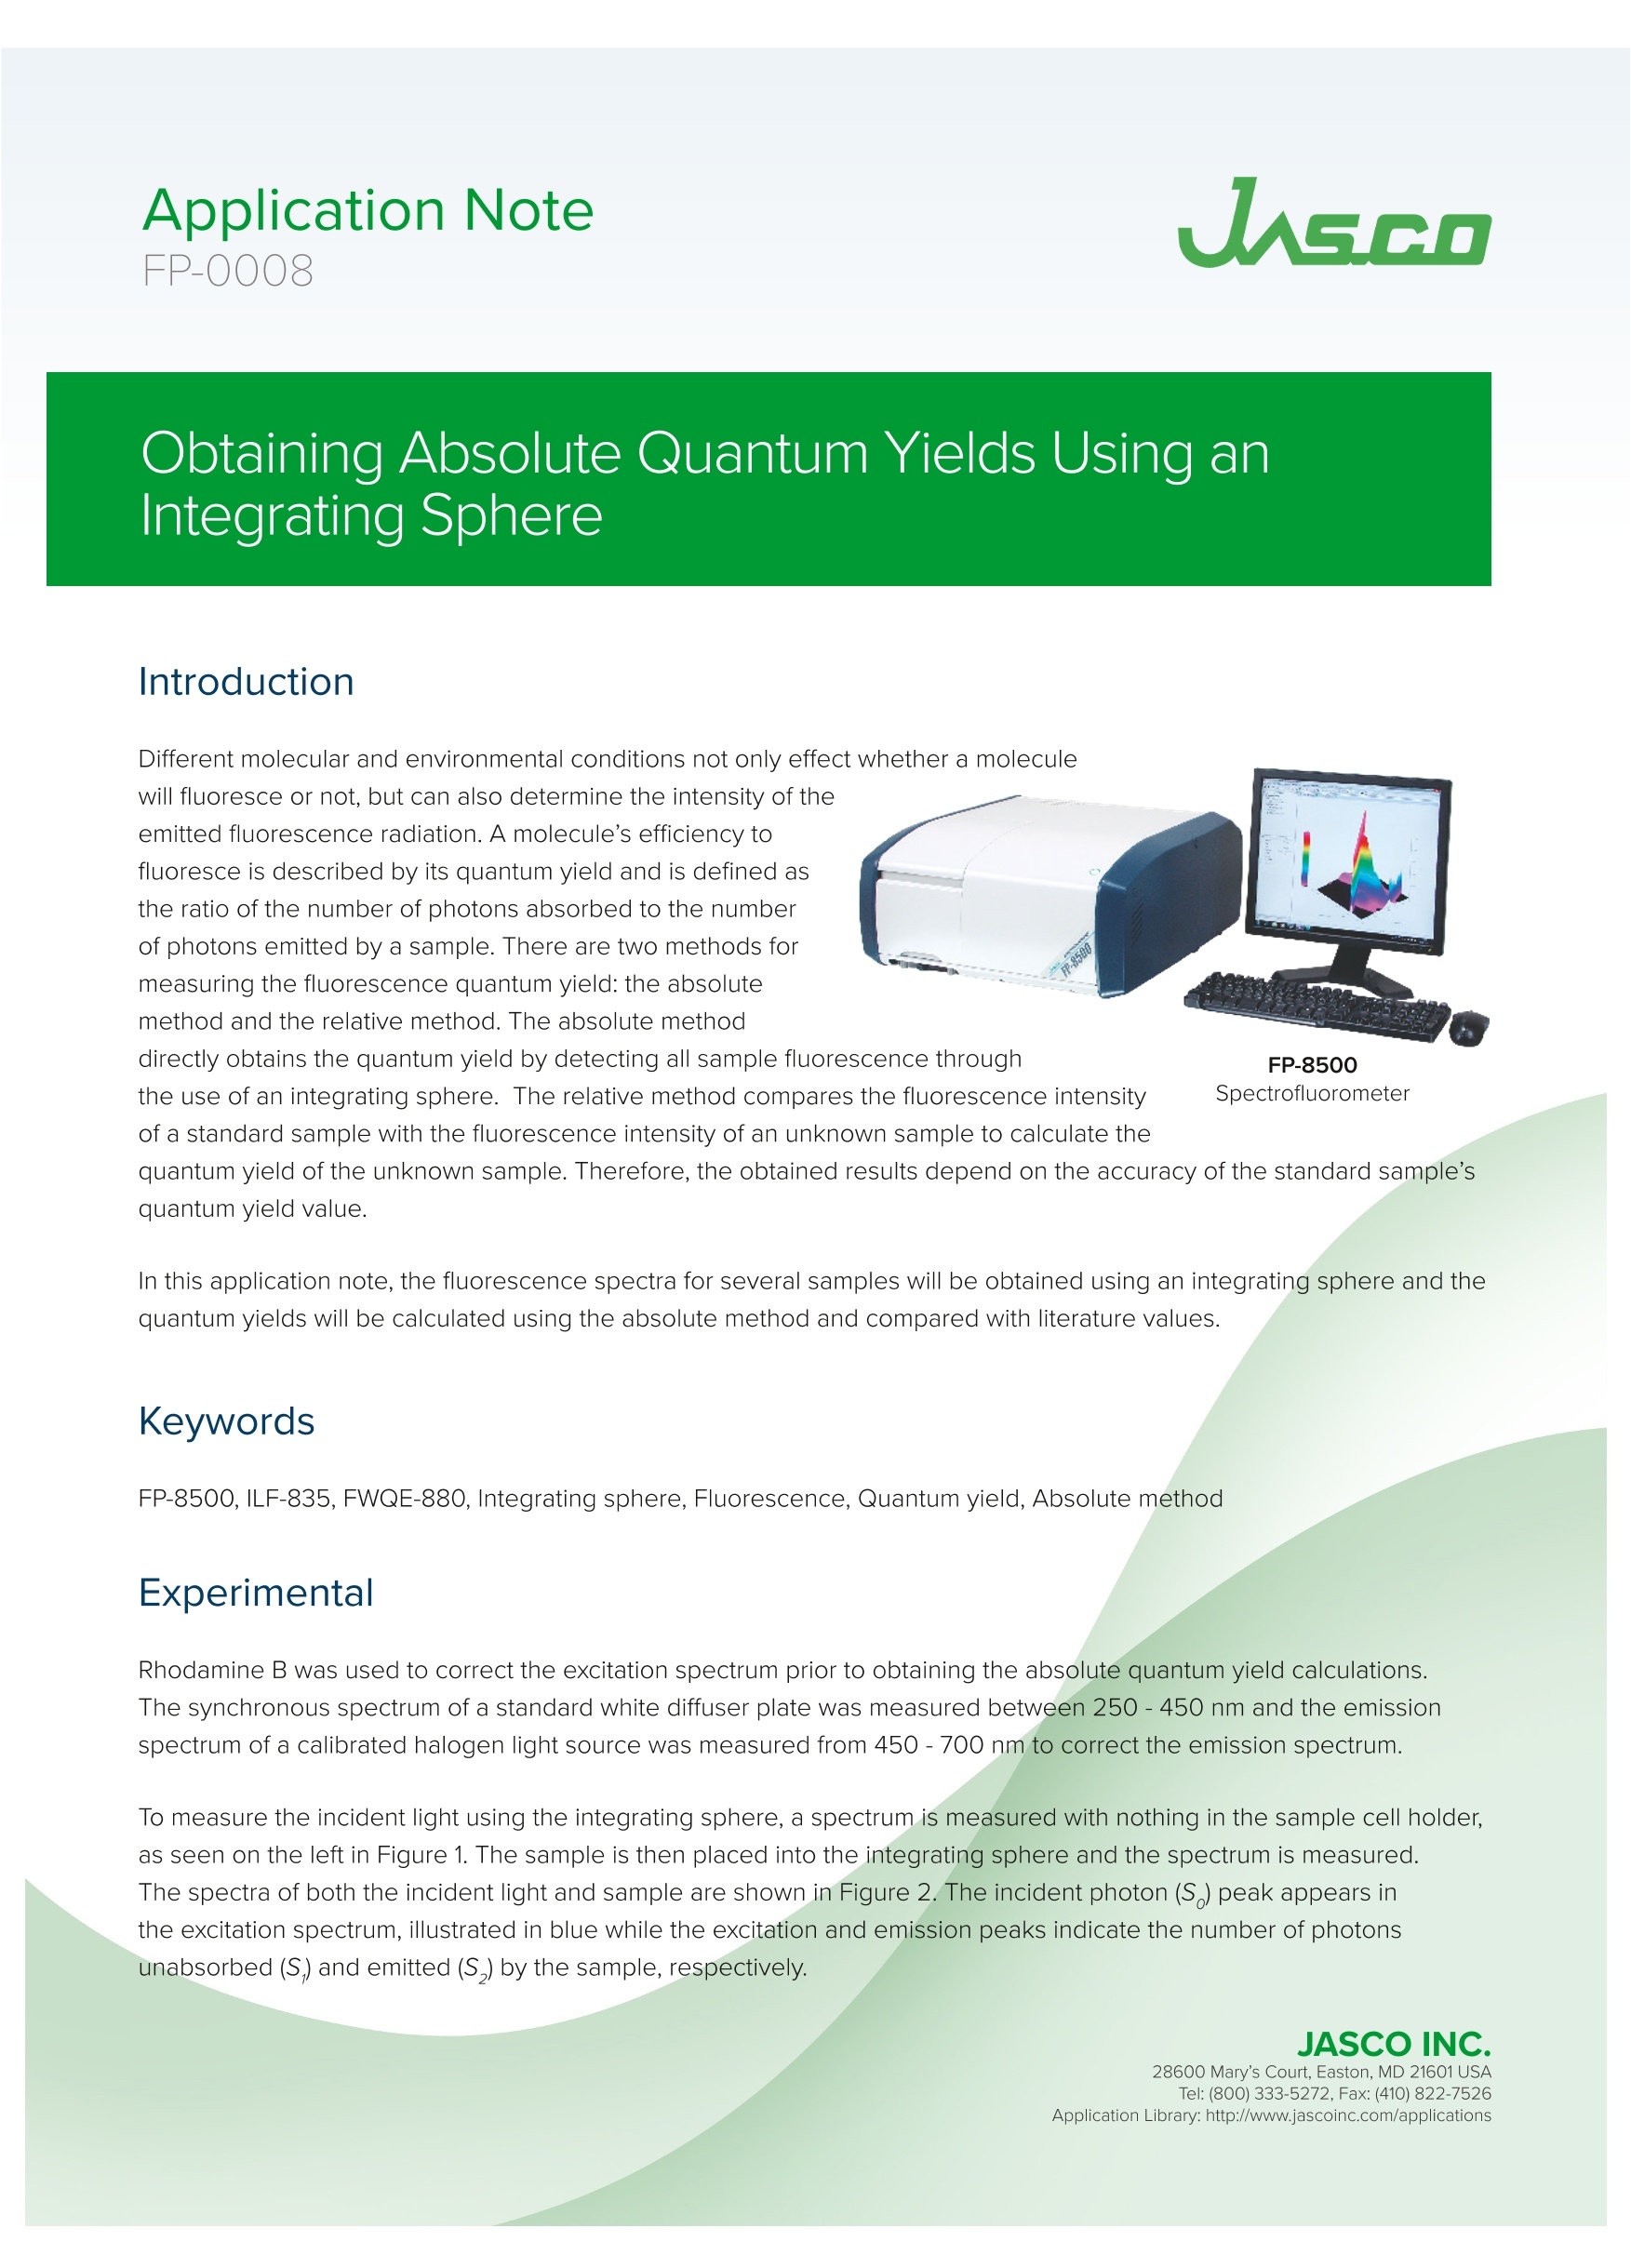
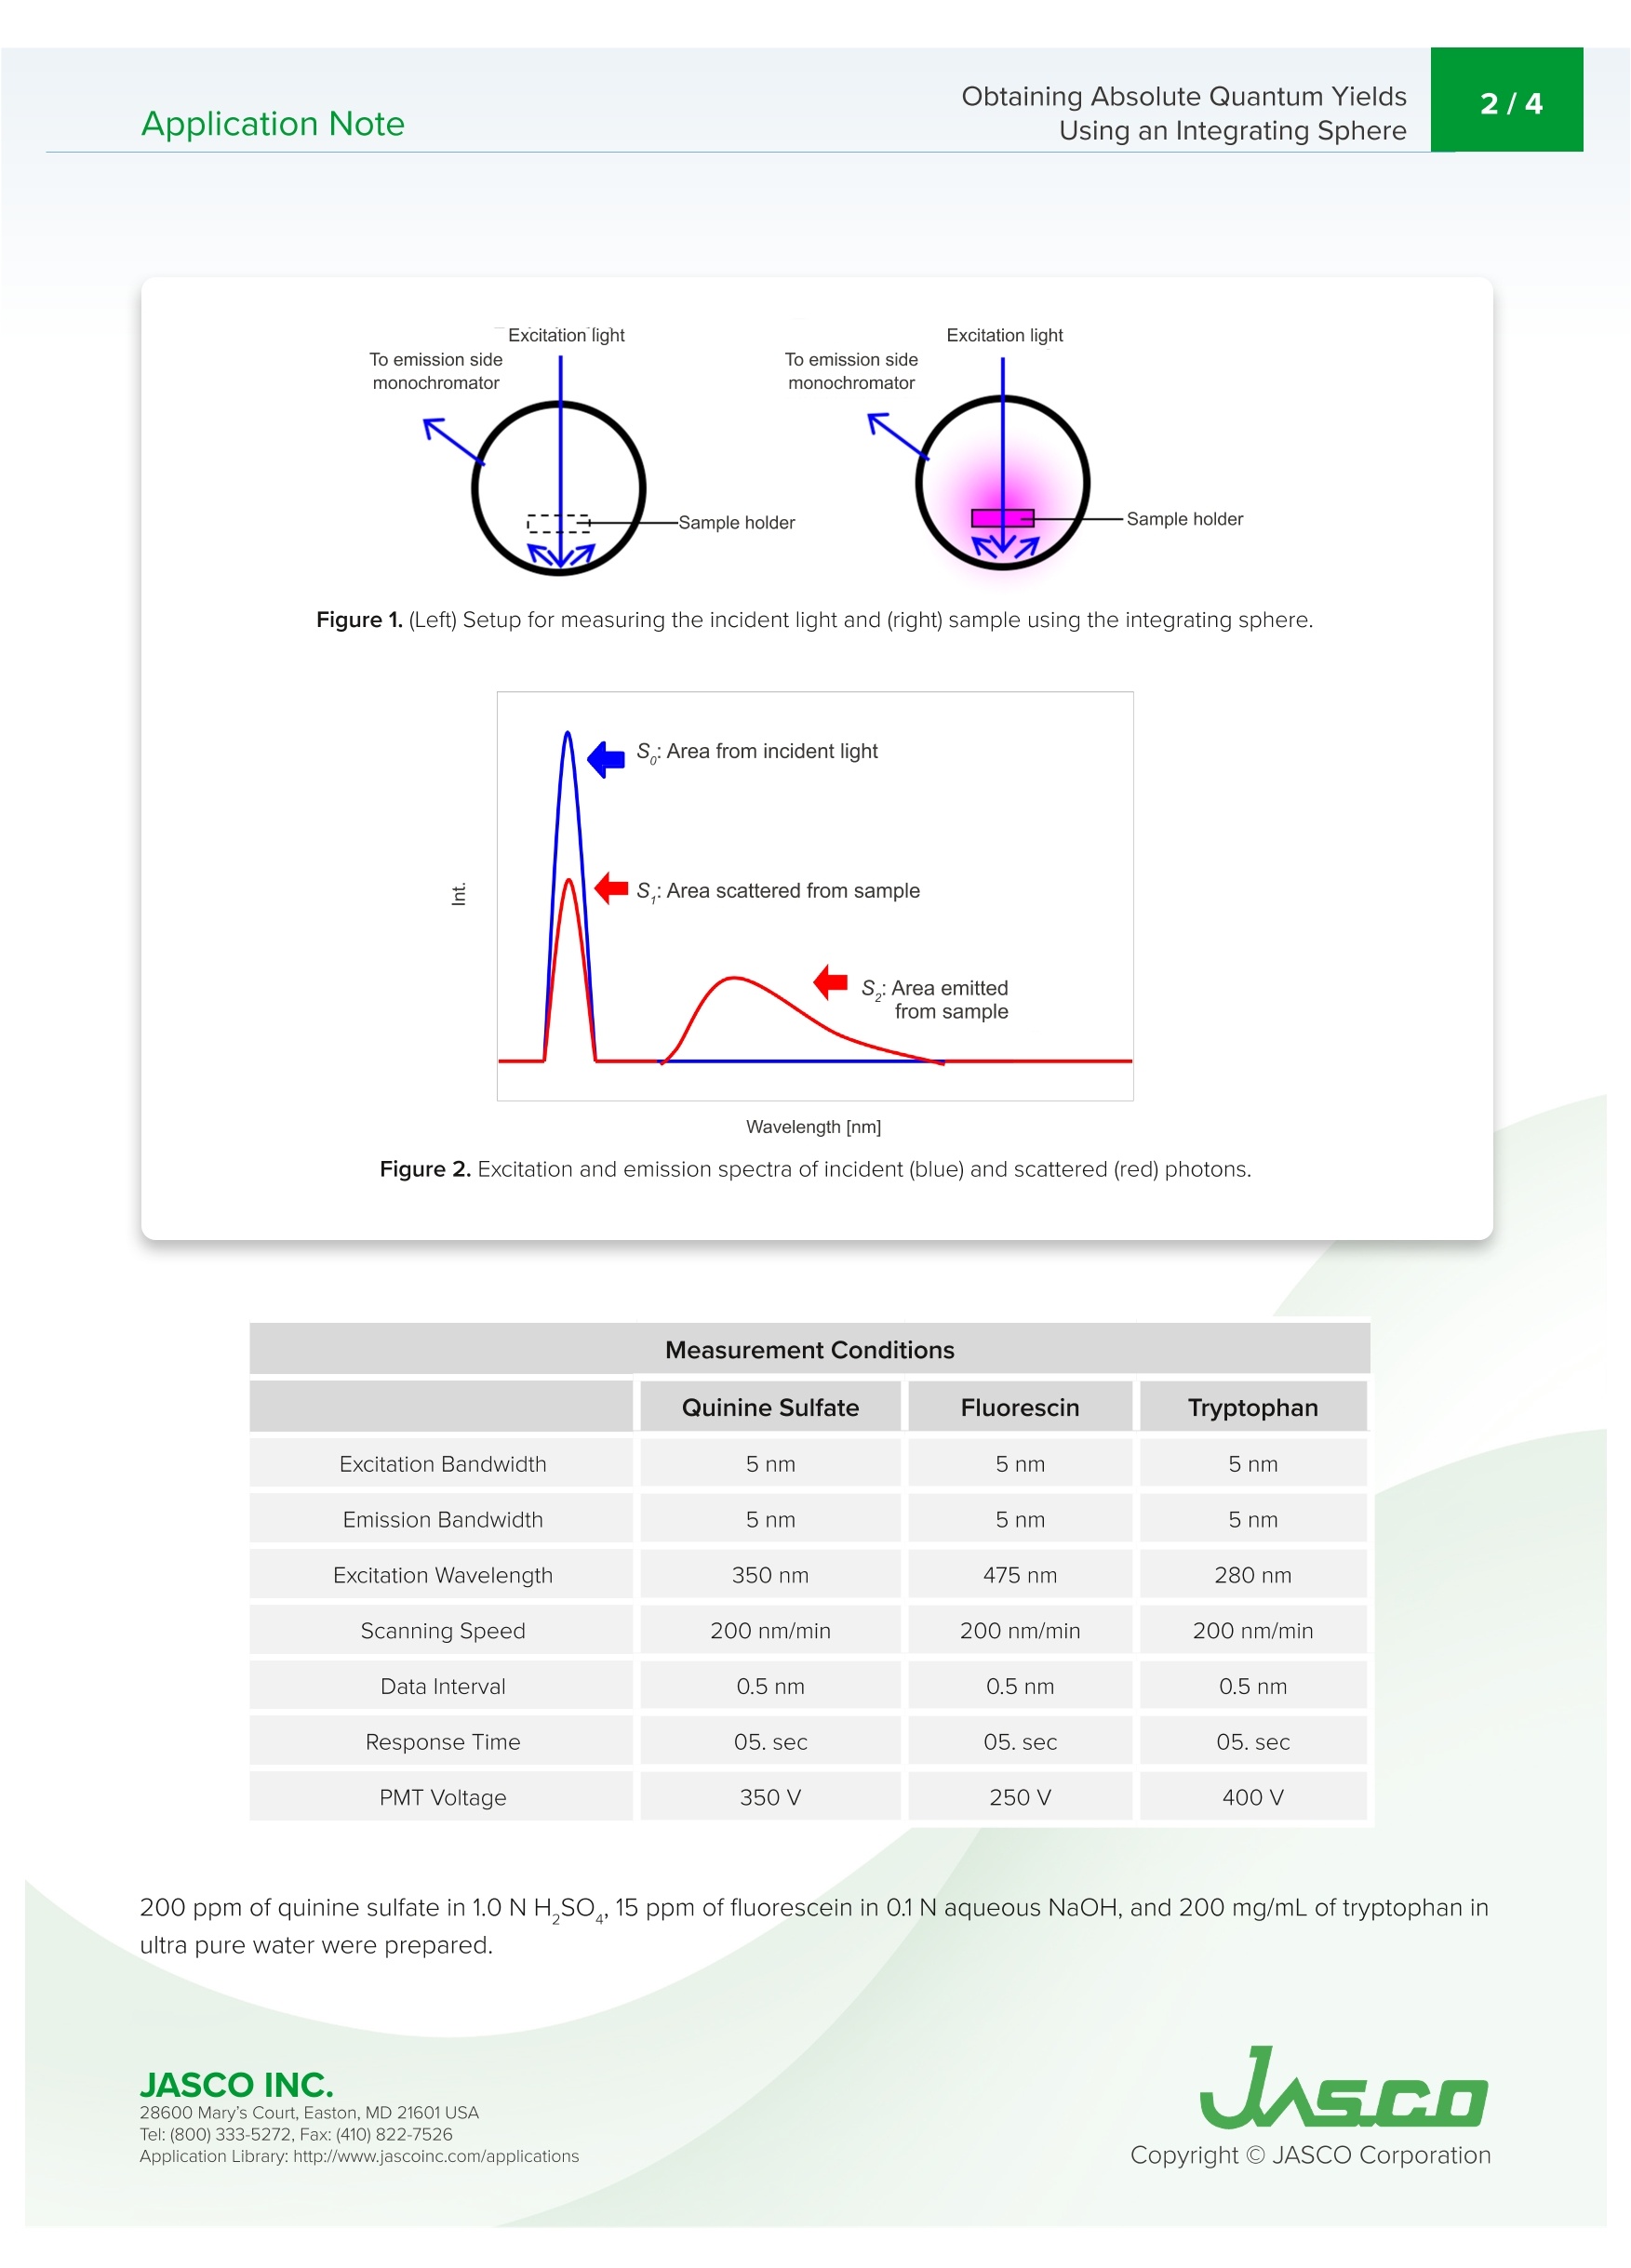
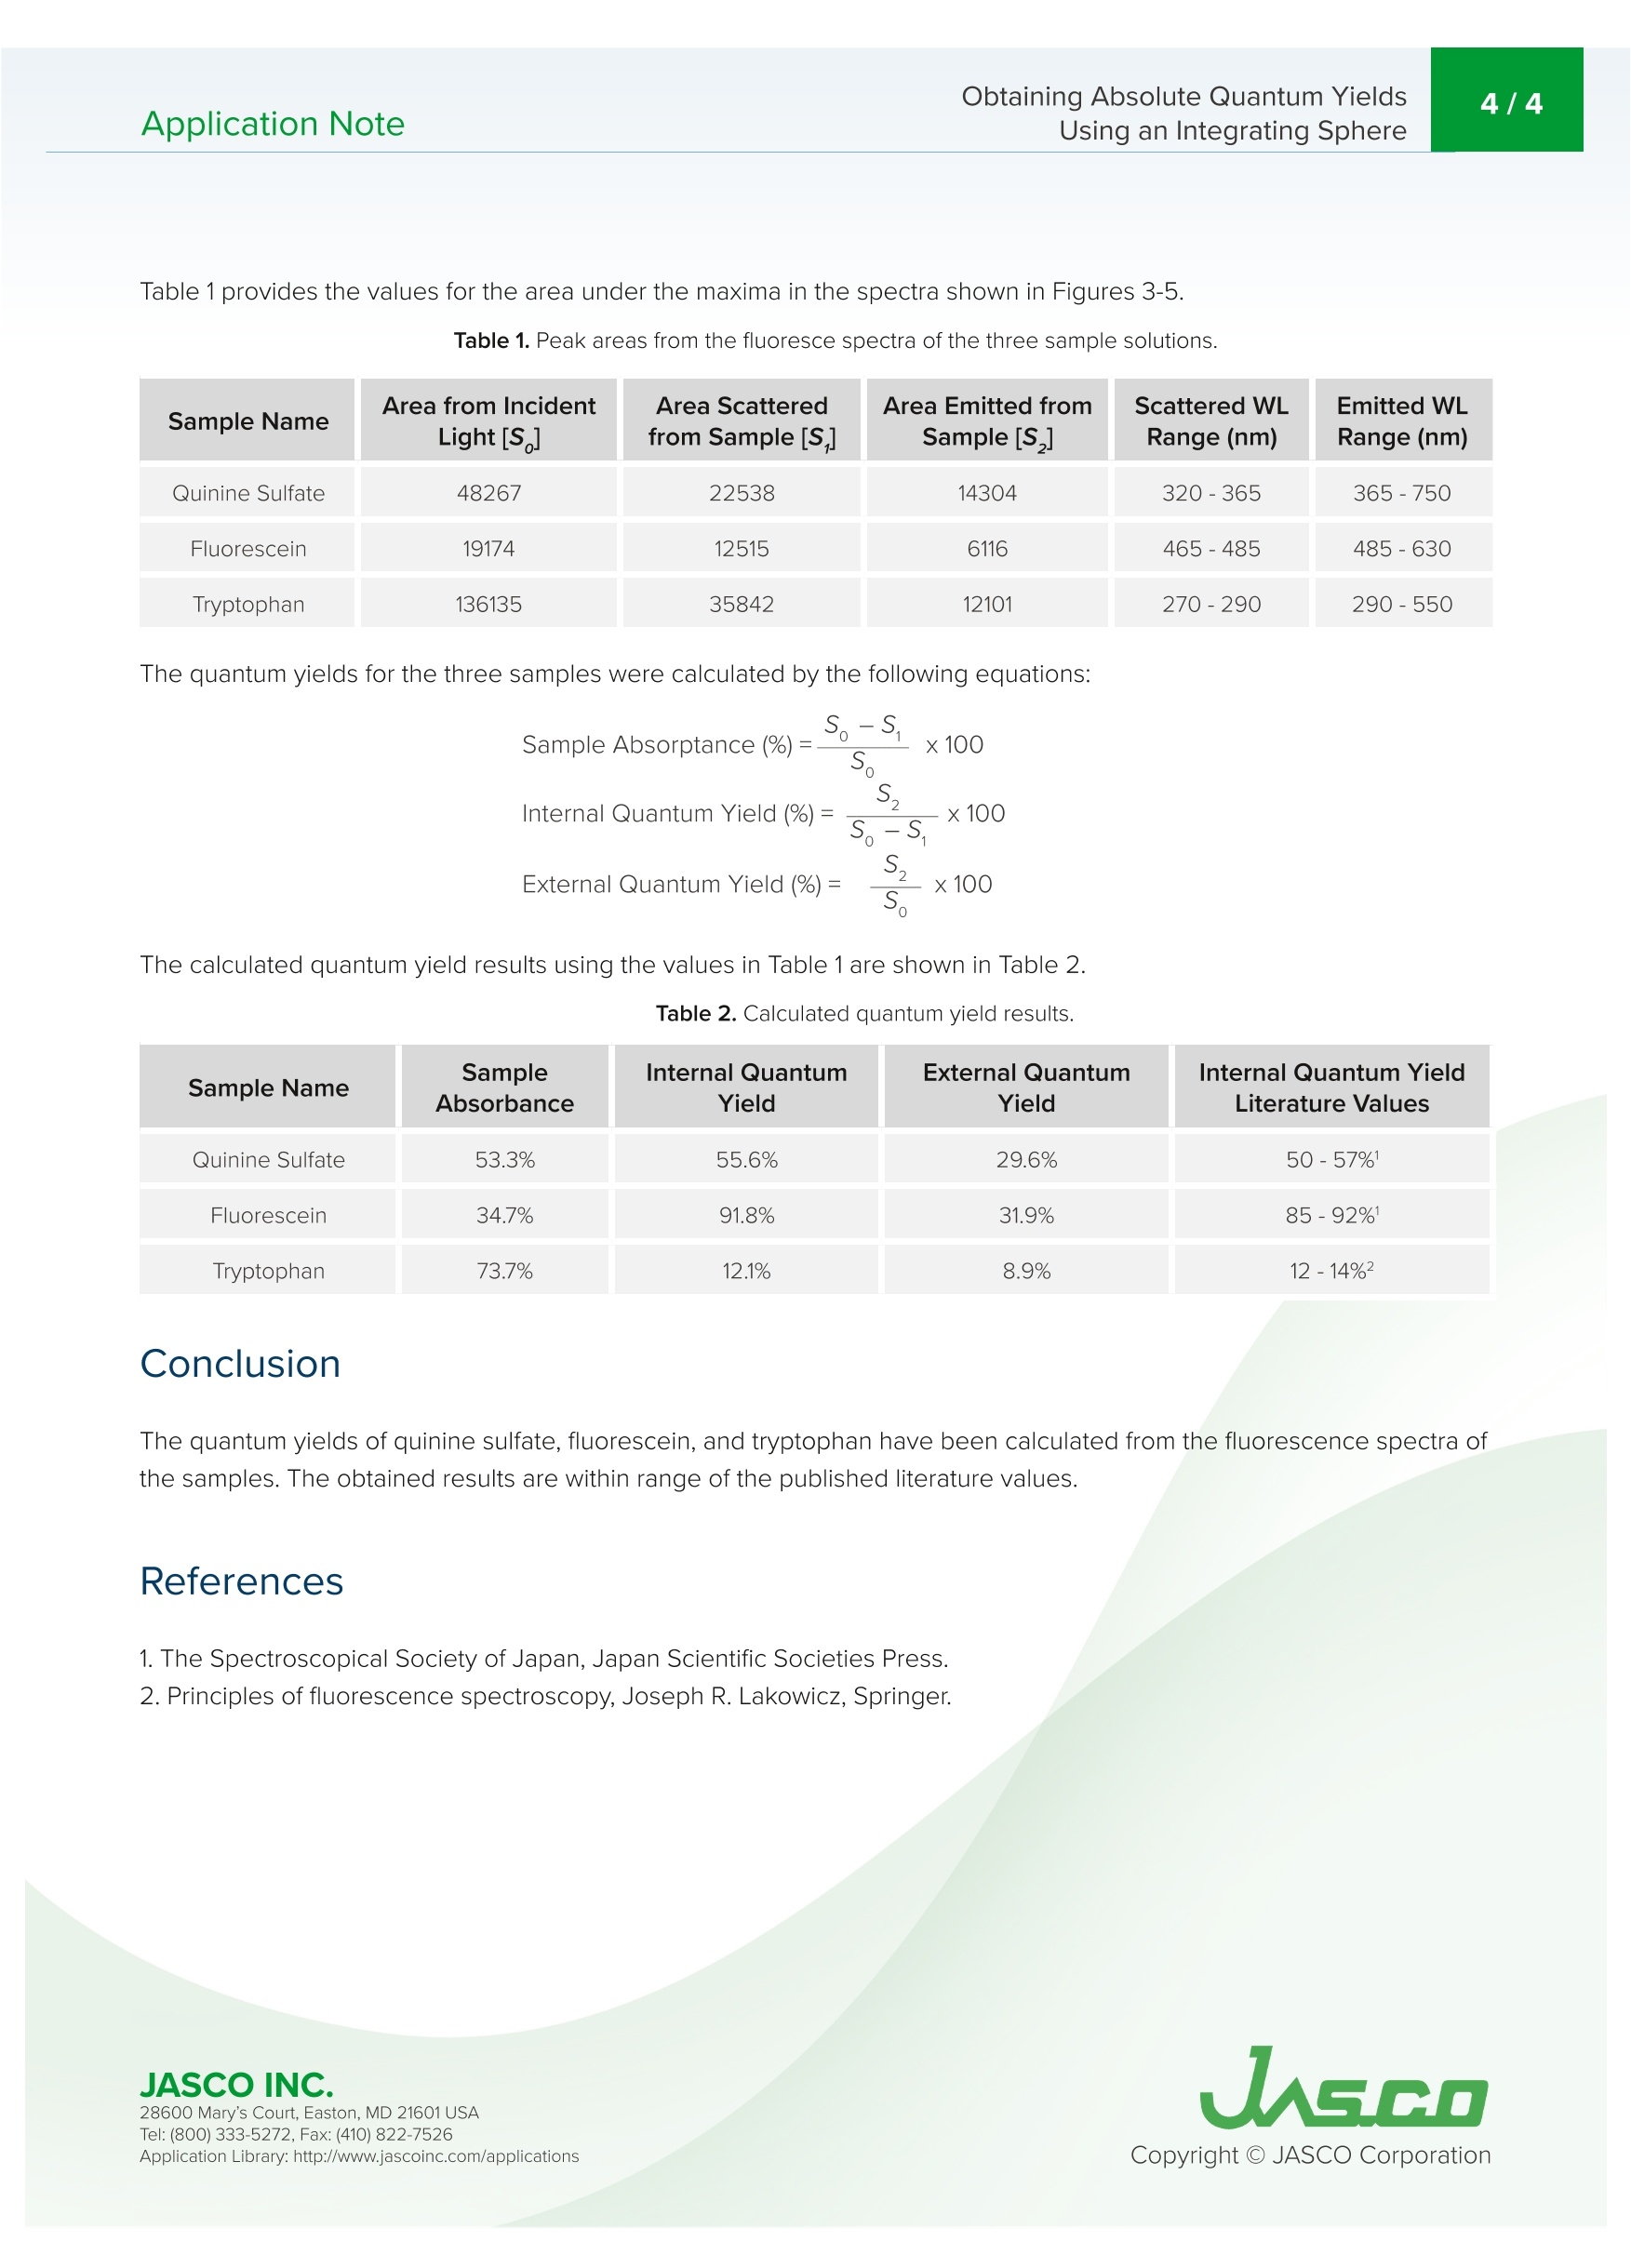
不同的分子和环境条件不仅影响分子是否会发出荧光,还可以决定发射的荧光辐射的强度。分子发出荧光的效率由其量子产率来描述,并定义为吸收的光子数量与样品发射的光子数量的比率。测量荧光量子产率的方法有两种:绝对法和相对法。绝对法通过使用积分球检测所有样品的荧光,直接获得量子产率。相对方法将标准样品的荧光强度与未知样品的荧光密度进行比较,以计算未知样品的量子产率。因此,所获得的结果取决于标准样品量子产率值的准确性。Application Note Obtaining Absolute Quantum Yields2/4Application NoteUsing an Integrating Sphere FP-Q008 Obtaining Absolute Quantum Yields Using an Integrating Sphere I ntrodu c tion Diff e r e nt mol e cular and e nviro n me n tal co n ditio n s not only eff e ct wh e th er a mo le c u l e wi l l fl uo r esce or n ot , bu t can also dete rm ine t h e i n tensity of t h e emitted fl u orescence r ad i a t i on . A m olecule ’s effic i ency to f luoresce is described b y its quantum yield and i s def i ned a s t h e rat i o of the nu m ber of photons abso r bed to t h e n umber of photons e mitt e d b y a sample. T h e r e are two methods for m easur i ng t h e f l u orescence qu an tum yie l d: the absolu t e method and t he re l at i ve method. T h e abso l u t e method di r ectly o b t a ins t h e quant u m yield b y det e cting al l sa m pl e f luorescence t h ro u gh FP-8500S p ectrof l uo r ometer the use o f an integrating sphere. T h e r e l at i ve method compares the fl uoresce n ce intensity of a standard sample with the f luor e scence i n tensity of an unknown sample to calc u la t e the quantum y i eld of t h e unknown sample. T h erefore , the obtai n ed r esults depe n d on t h e accuracy of the standard sample's quantu m y i eld va l ue. I n t h is applicat i on note, th e fluoresce n ce spect r a for seve r al samples will be obtai n ed usi n g an i n t egrat i ng sphe r e and the q u antu m y i e l ds will be calculat e d u s i n g t he a b so l ut e m e thod and co m par e d with lit e rat u r e valu e s. K eywords FP-8500, ILF -835, FWQE -880, I n tegrating sp h ere, F lu orescence, Quantum yield, Abso lute method Experime n ta l Rhoda m ine B wa s u sed to correc t the excitation spectrum p rior to obtai n ing the absolute quantum yield calculations.T h e sync h ro n ous spectrum of a sta n dard whi t e dif f user p late wa s measured between 250 -450 nm and the emissio n sp e ctrum of a calibrated halogen light source was m e asur e d fro m 450-700 nm to correct the emission spectrum. To m e a s ure t h e inc i dent ligh t u sing th e i nt egrating sph e r e , a spec t rum i s measured with nothing in the sample ce l l holder,as seen on t h e left i n Figu r e 1. T he sample is the n p l aced i n to t h e i n tegrat i ng sphere and the spectrum i s measured.T h e spectra of b ot h the i n cide nt lig h t and sample are shown i n Figure 2. The i ncident photon (S ) peak appears in t he e xc i tat i on spect ru m , il l u st r at e d in b l u e whi le t h e e xcitation and emission peaks i ndicate the number o f photons unabsorbed (S,) and e m itted (S,) by t he sample, respectively. Figure 1. (Left) Setu p for m easuri n g th e i n cide n t l i ght an d (right ) sa m p le u s ing the integ ra t i n g s ph e r e. Wavelengt h [n m] Figure 2. E xc i tatio n a n d emissio n s pe ctra of i n c id e nt (b lue ) and scat te r e d (r e d ) p h otons. Quinine Sulfate Fluorescin Tryptophan Excitation Bandwidth 5nm 5nm 5nm Emission Bandwidth 5nm 5nm 5nm Excitation Wavelength 350nm 475 nm 280 nm Scanning Speed 200 nm/min 200 nm/min 200 nm/min Data Interval 0.5nm 0.5nm 0.5 nm Response Time 05. sec 05. sec 05. sec PMT Voltage 350V 250V 400V 200 ppm of quini n e sulfate i n 1.0 N H ,SO , 15 ppm of fl u orescein in 0.1 N aqueous NaOH, and 200 mg/mL of t r yptopha n in ultr a pure wate r were pre p ared . Resu l ts The fl uoresce n ce spectra of qui n ine s u l fa te, f l uorescei n , and t ry p top h an a r e s h own i n Figures 3, 4, a nd 5, r espec t i v ely. Figure 3. E m i ssi on s p ec t ra of t he i n ci den t light (b lu e) a n d quin i ne s u lf a te (red). Figure 4. Em i ssion spectra o f th e i ncide n t light (blu e ) a n d fluo r escein (red ). Figure 5. E miss i on s p ectra of t h e incident l ig h t (b l ue) and tr yptoph a n (red ). Table 1 p rov i des the values f or the area unde r the maxima i n the spectra shown i n Figures 3-5. Table 1. Peak areas fro m th e f l uo r esce spectra of t h e t h r ee sample so l utions. Sample Name Area from IncidentLight [S] Area Scatteredfrom Sample [S,] Area Emitted fromSample [S,] Scattered WLRange (nm) Emitted WLRange (nm) Quinine Sulfate 48267 22538 14304 320-365 365-750 Fluorescein 19174 12515 6116 465-485 485-630 Tryptophan 136135 35842 12101 270-290 290-550 The quantum yields for the t h ree samples were ca l c u lated by the fol l owing eq u at i ons: The calculated quantum yield r esults usi n g t h e val u es i n Table 1 are shown i n Table 2. Table 2. Calcul a ted qua n t u m yie l d res u lts. Sample Name SampleAbsorbance Internal QuantumYield External QuantumYield Internal Quantum YieldLiterature Values Quinine Sulfate 53.3% 55.6% 29.6% 50-57% Fluorescein 34.7% 91.8% 31.9% 85-92% Tryptophan 73.7% 12.1% 8.9% 12-14%2 Conclus ion The quantum yields of qui ni ne sul f ate, f l uorescei n , a n d tryptophan h ave been calcu l ated fr om t he f l uorescence spec t r a of the samples. The obtained results are w i thi n range of the published l iterature val u es. Refe r ences 1. The Spectroscopical Society of Japan , J apan Scient i fic Societies Press. 2. Pr i n ciples of f l uorescence spectroscopy, Joseph R. Lakowicz, Spri n ger JASCO INC. JS.CO
确定
还剩2页未读,是否继续阅读?

产品配置单

佳士科商贸有限公司为您提供《利用积分球获得绝对量子产率》,该方案主要用于光学材料中积分球、量子产率、绝对法检测,参考标准--,《利用积分球获得绝对量子产率》用到的仪器有JASCOFP-8000系列荧光光谱仪
推荐专场
相关方案
更多
该厂商其他方案
更多