


方案详情
文
本申请说明将描述如何创建Lowry、Biuret和紫外-可见吸收分析方法的校准曲线,以确定蛋白质浓度。
关键词:V-630,紫外-可见光/NIR,校准曲线,定量,生物化学
方案详情

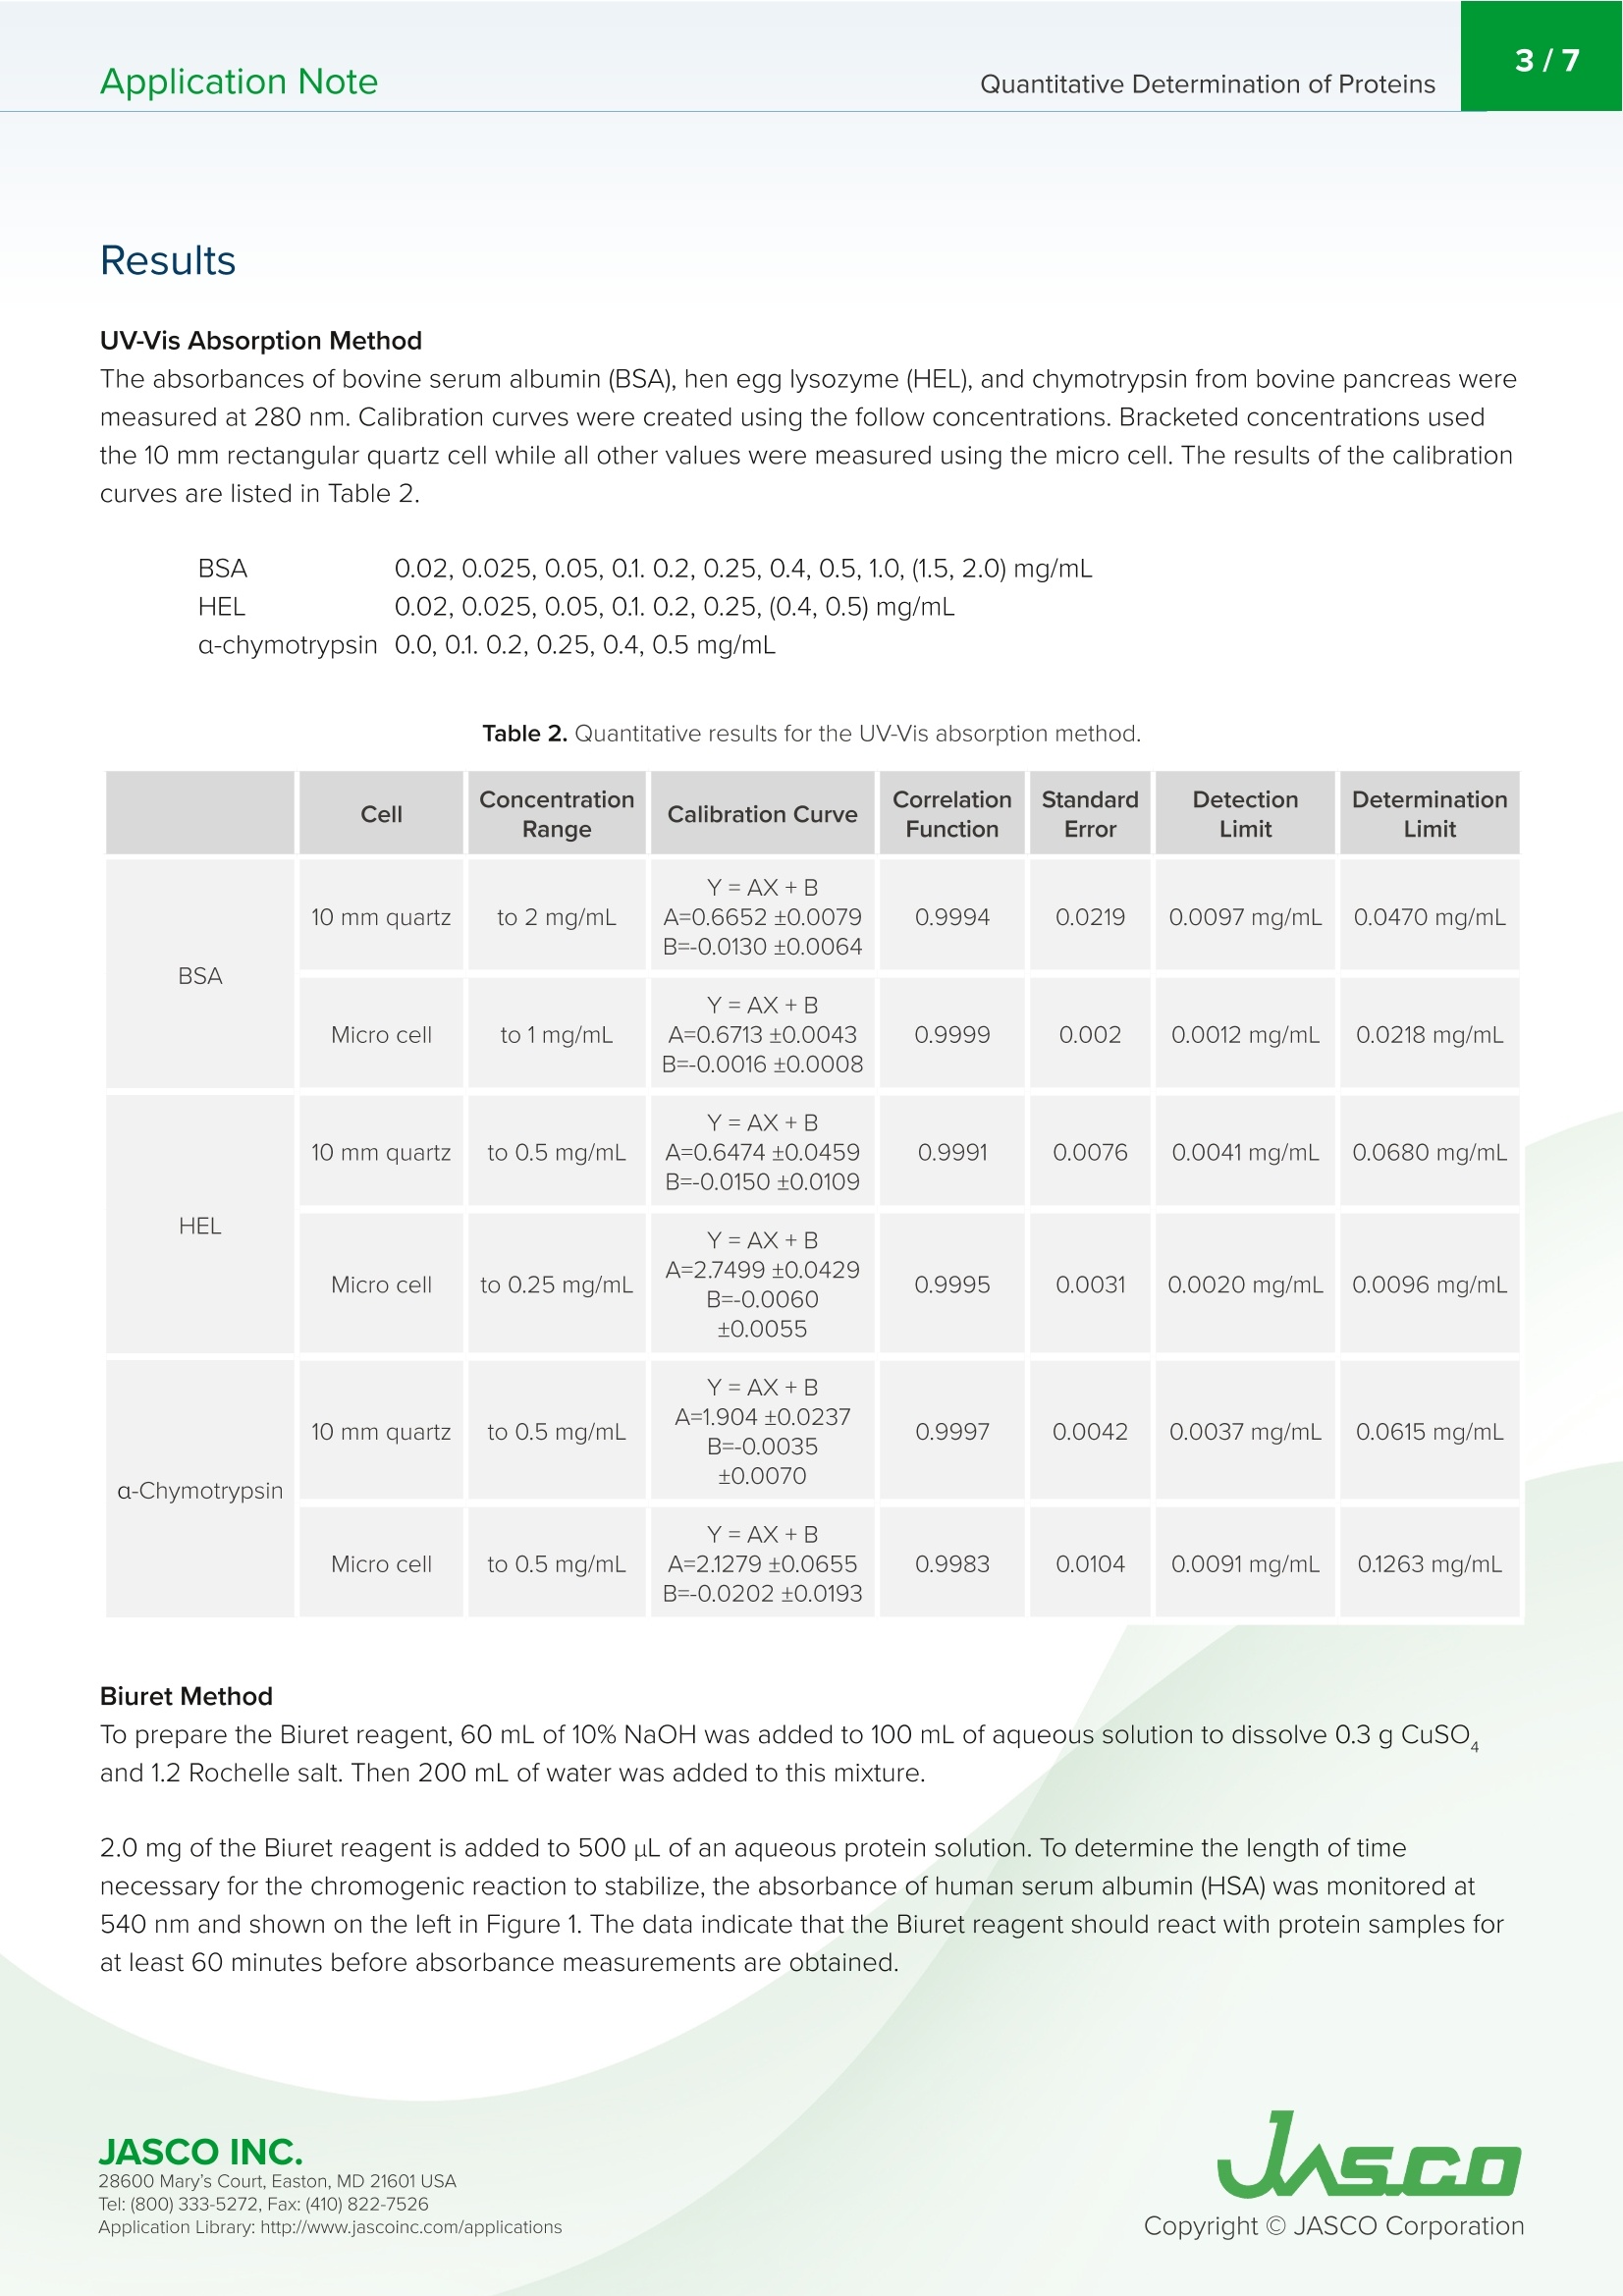
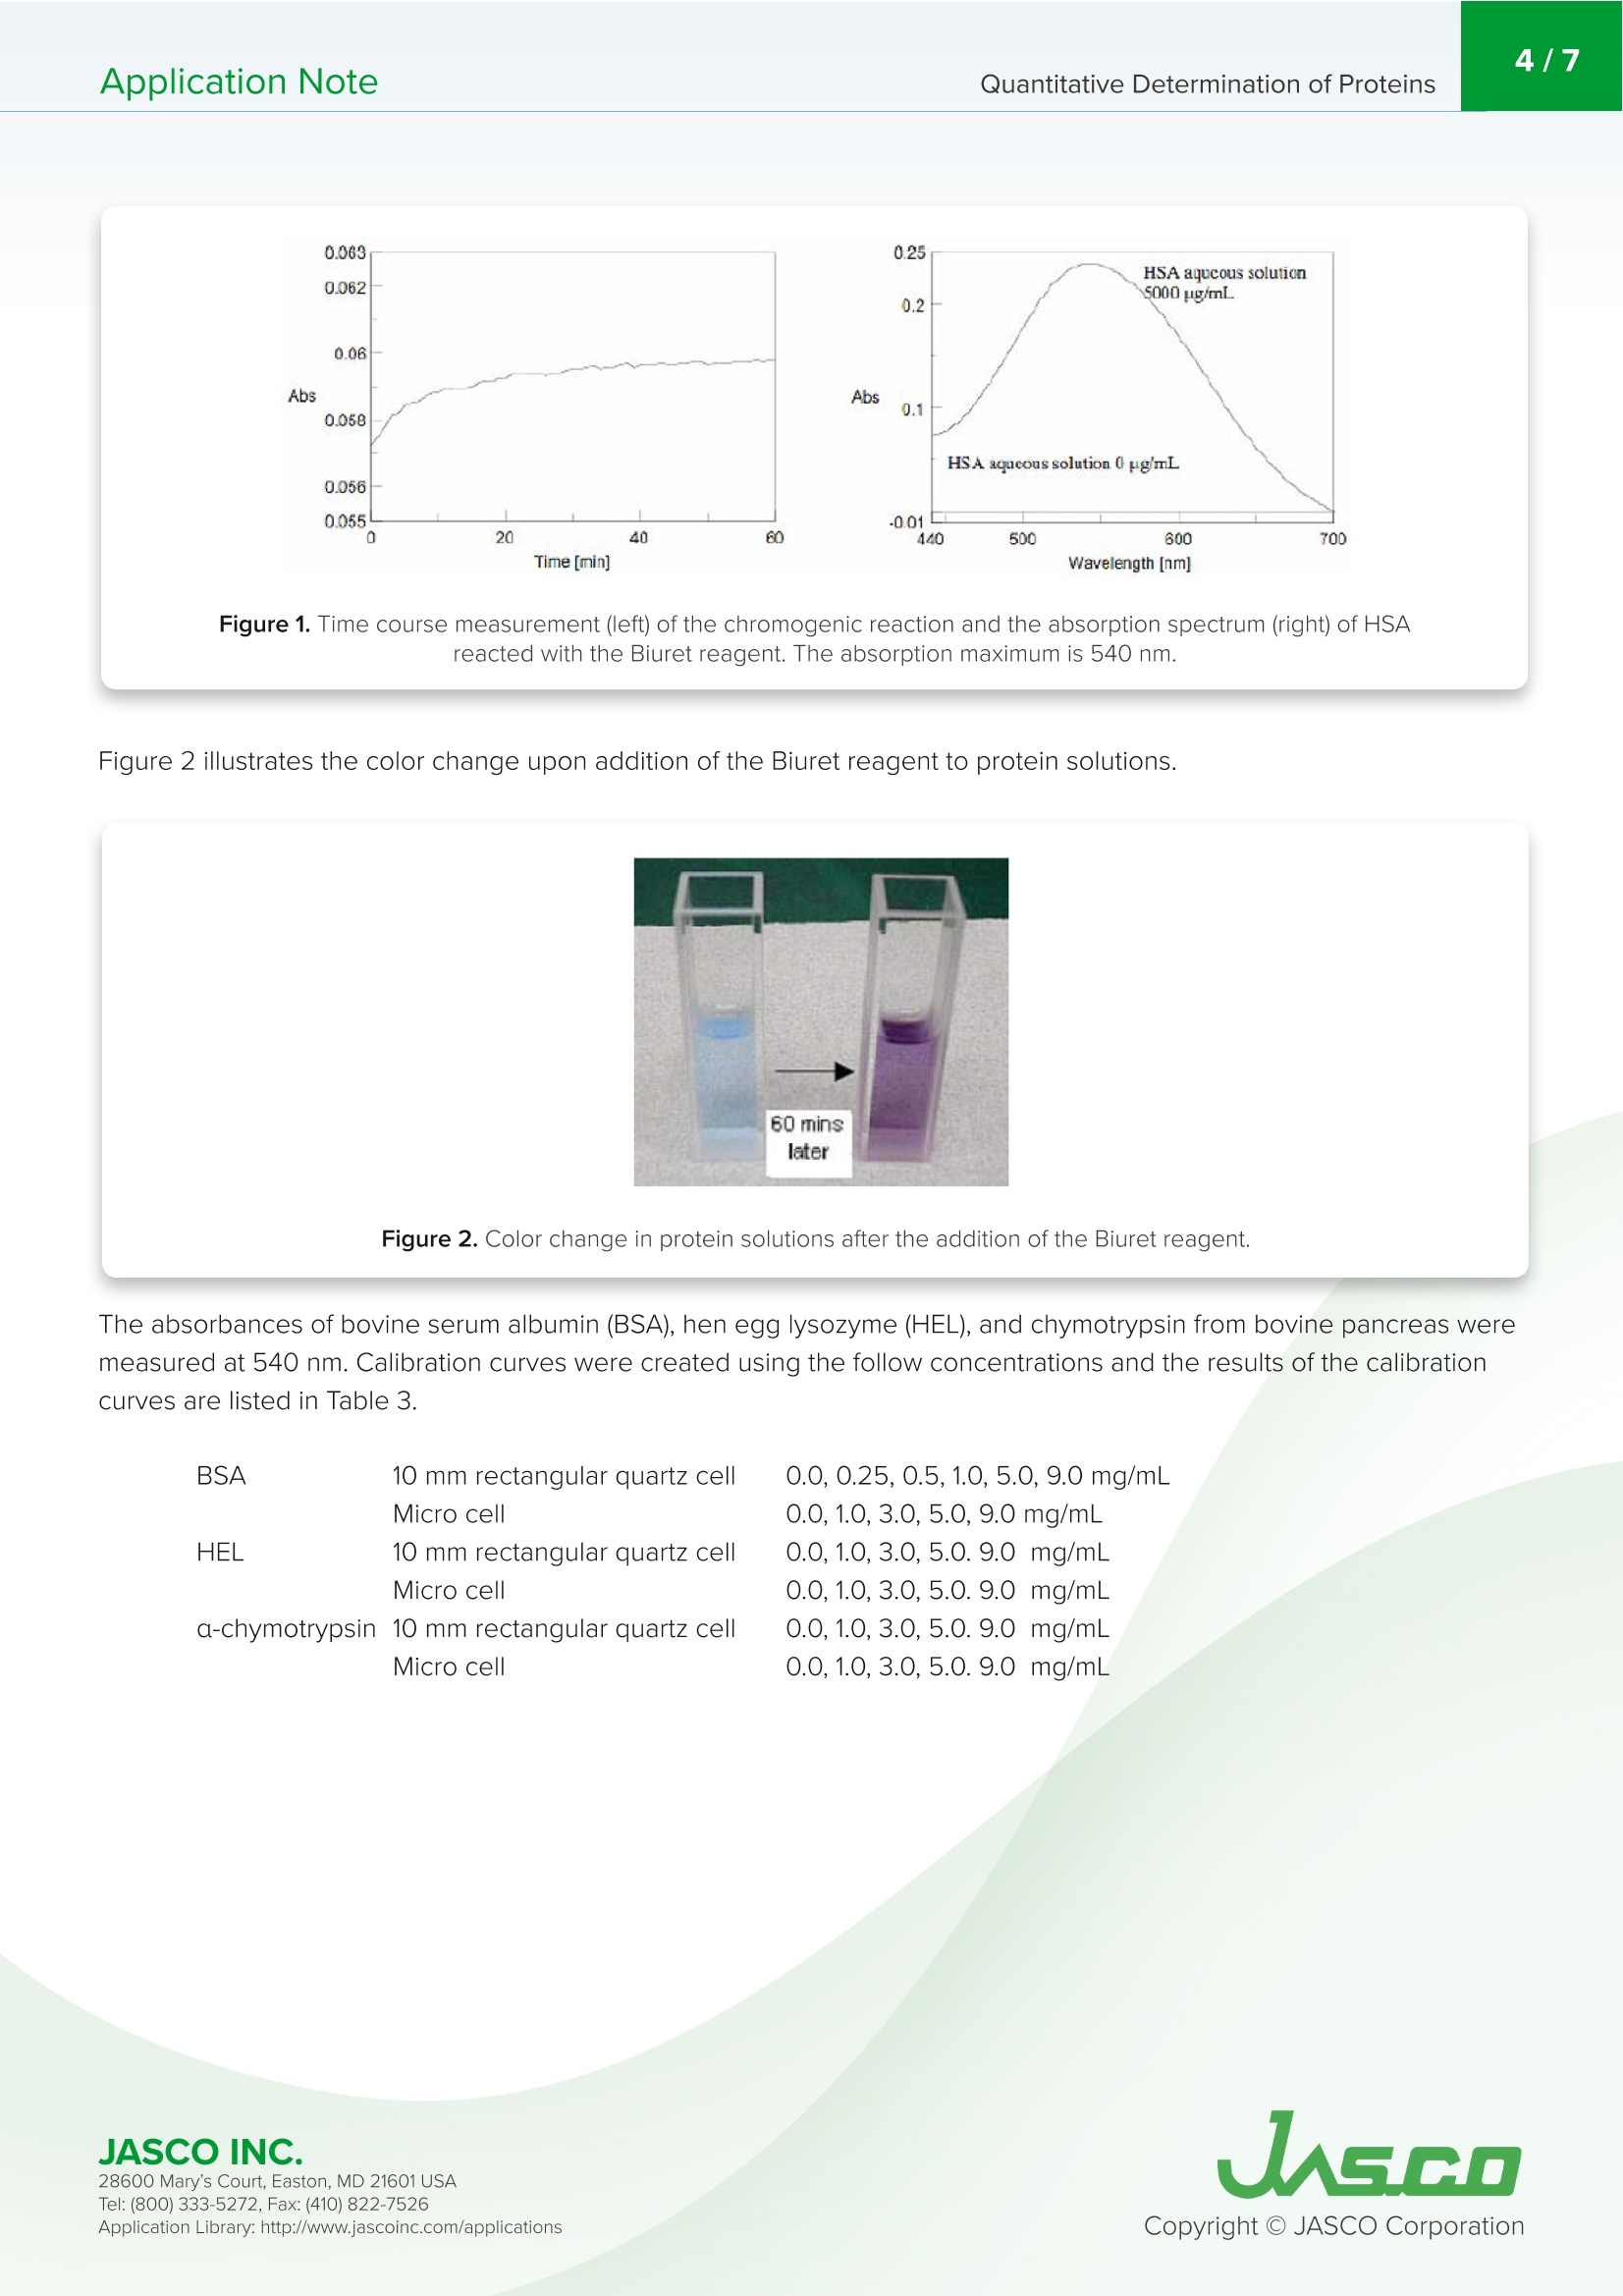
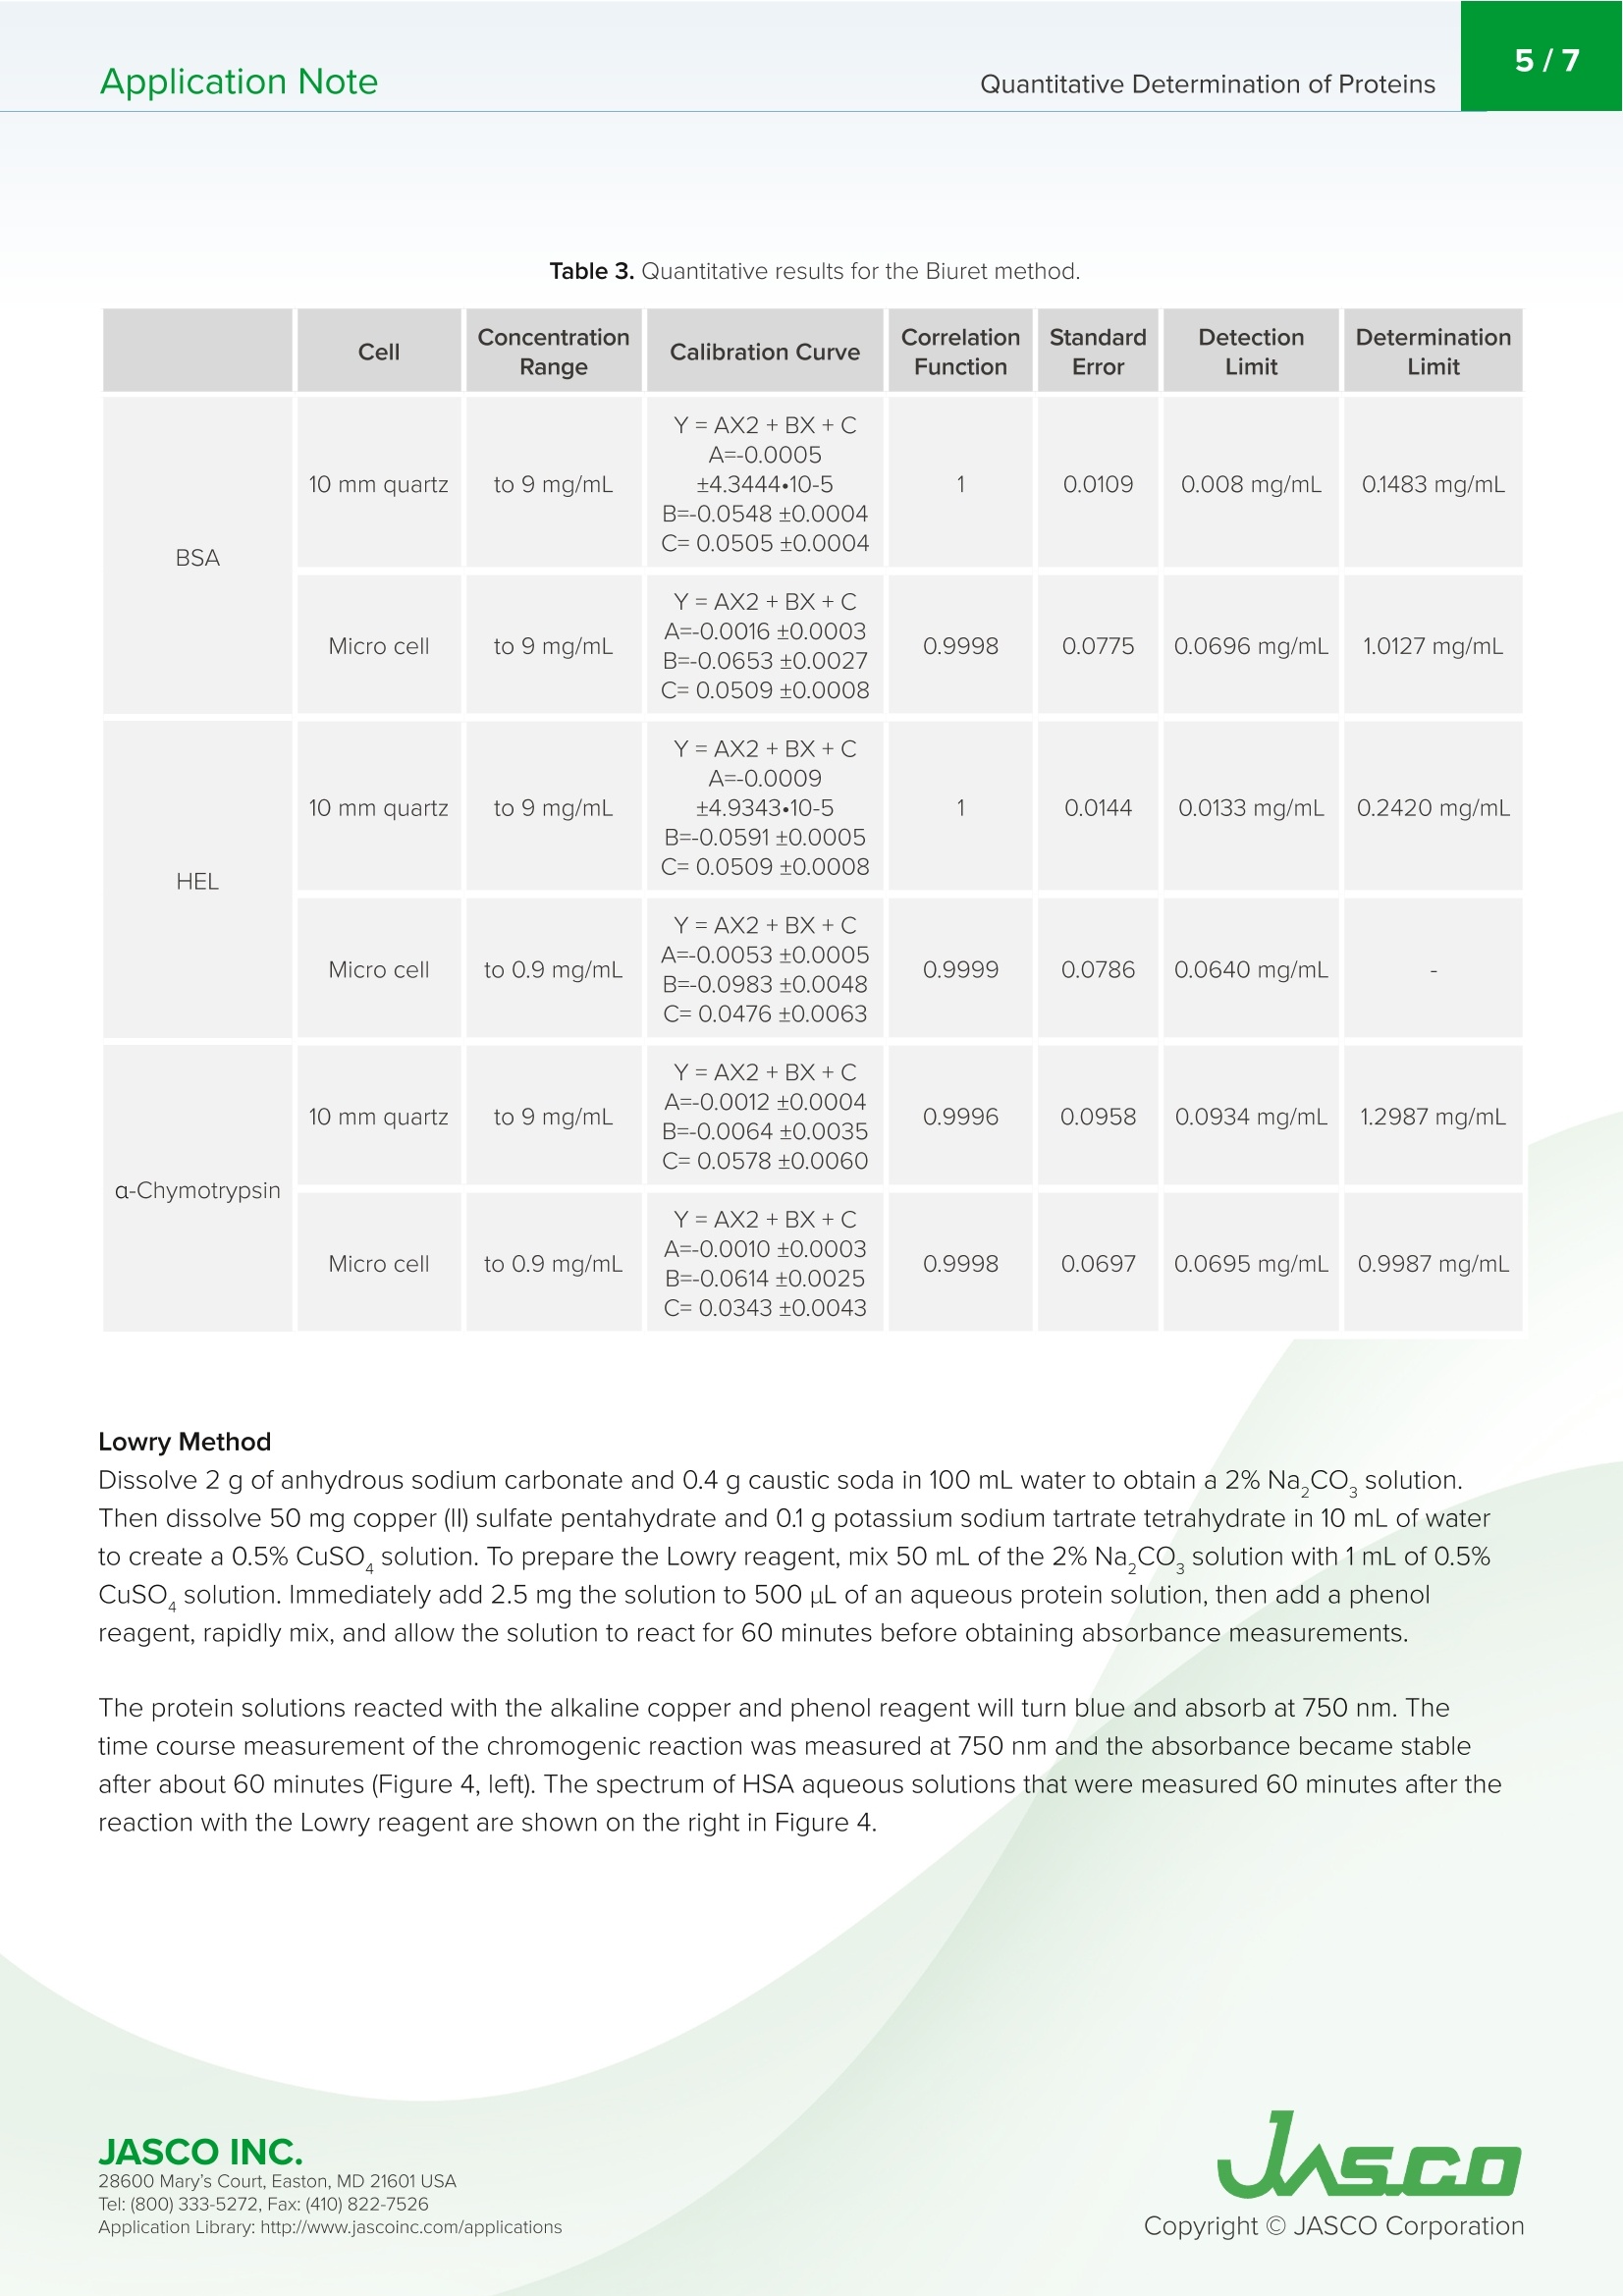
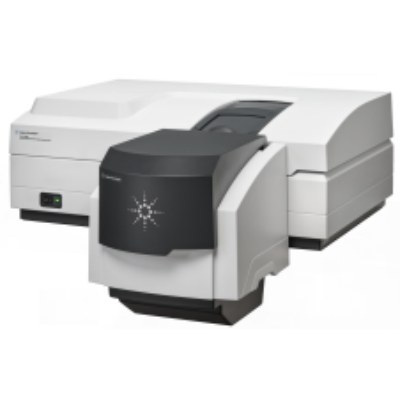
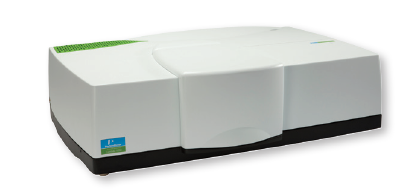
测定蛋白质浓度最简单、最准确的光谱工具之一是紫外-可见分光光度计。V-630设计用于生化分析,并配备了6条基于紫外吸收分光光度法的定量校准曲线,包括Lowry、Biuret、BCA、Bradford和WST方法。Application NoteUV-O003 2/7Application NoteQuantitative Determination of Proteins Quantitative Determination of Proteins In t ro d uc t ion One of the easiest and most accu r ate spectroscopic tool for determ i ning protein concentration is by UV-Visible spectrophotometers. The V-630 is designed for biochemical analysi s and equipped with 6 quantitative calibration c u rves based on UV absorpt i o n spectrophotomet r y i ncluding Lowry, Biu r et, BCA, Bradford, and WS T methods Table 1 shows the features of eac h of the six quantitation met h ods. The preferred method can be selected based on the desired concentrat i on range and whether any contam i nants or agents present in the sample will in fluence the quant i tation r esu l ts. V-630 UV-Visible Spectro p hotometer Five of the quantitative analysis methods utilize a chromogen i c reaction . While reagent manufacturers produce chromogenic k its for BCA, Bradford, and WST methods, as well as an i nstruction manual explai n ing the measurement procedures, the Lowry and Biuret methods r equire the reagent to be prepa r ed by the user. Therefore, the measurement procedures for the Lowry and Biu r et methods can differ and the quantita t ive results will depe n d on the types of prote i ns a n d differences in the concent r ation ranges used . This application n ote will descr i be how to create ca l i brat i on curves for the Lowry, Biuret, a n d UV-Visi b le absorption analysis met h ods to determi n e p rotein co n cent r a t ion. Keyword s V-630, U V -V isibl e /NIR , Ca li bra ti o n curve, Qua n titat i ve , Bio c hemi str y 28600 Ma r y 's C ou r t, Easton, M D 21601 US A Methods Principle ConcentrationRange* Advantages Disadvantages UV Abs The absorption maximum at 280 nmcorresponds to the response of thetyrosine and tryptophan residues used forthe analysis method. 50-2000 ug/mL Simple method, sample can be usedafter measurement. Absorbance differs for eachprotein. Collagen and gelatindo not have absorptionat 280 nm and cannot be measured.Nucleic acids withUV absorption can obscuremeasurement. Biuret An alkaline solution of Biuret reagent including copper sulfate and Rochellesalt is added to a protein solution, whichturns purple after the polypeptide chainchelates with a copper ion. Uses theabsorption maximum at 540 nm. 150-9000 pg/mL Simple procedure, chromogenic rate is constant for mostproteins. Low sensitivity. Samplewith low protein concentration cannot bemeasured. Chromogenicreaction is influenced by high concentrations oftrisaminomethane, aminoacids, and NH* Lowry An alkaline copper solution is added tothe protein solution. Tyrosine, tryptophan,and cysteine reduce the molybdenum acidand phosphotungstic acid of the phenolreagent, turning the solution blue. Usesthe absorption maximum at 750 nm. 5-20 pg/mL High sensitivity,widely used. Complicated procedurewith long preparation time.Chromogenic reaction occurs via reduction reaction socontamination of reductionmaterial interferes withquantitative determination. Chromogenic rate differs foreach protein. BCA Combines the Biuret and Bicinchoninicacid (BCA) methods. When a proteinreacts with 2 molecules of BCA, a copper ion is formed and turns the solutionpurple. Uses the absorption maximum at560nm. 20-2000 pg/mL Simple procedure, high sensitivity,wide concentrationrange. Thio, phospholipid, andammonium sulfate interferewith measurements. Bradford The absorption maximum shifts from 465to 600 nm when the protein binds toCoomassie Brilliant Blue G250. Uses theabsorption maximum at 600 nm. 10-2000 pg/mL Simple operation,little influence fromblocking agents. Chromogenic rate differs foreach protein. Contaminationby the surfactant can interferewith chromogenic reaction. WTS WST-8 reduces upon interaction with highpH proteins, turning the sample solutionblue. Uses the absorption maximum at650 nm. 50-5000 pg/mL Simple operation,little influence fromsurfactant. Chromogenic rate differs foreach protein. R esu l ts UV-Vis Absorption Method The absor b ances of b ovine s e rum albumin (BSA), hen egg lysozyme (HEL ), a n d chymotry p sin f rom bovine panc r e as were m e asur e d at 280 n m. Calibration c u rves we r e creat e d us in g t h e follow conc e nt r atio n s. Bracket e d con c e n trat i ons u s e d t h e 10 m m recta n gu l ar quartz cell while all other va l ues were meas u red usi n g t h e micro cell. T h e results of t h e cal ib ra t ion c u rves are listed in Table 2. BSA 0.02,0.025,0.05,0.1.0.2,0.25,0.4,0.5,1.0,(1.5,2.0) mg/mL H E L 0.02, 0.025, 0.05,0.1.0.2,0.25,(0.4,0.5) mg/mL a -c h ymotryps in 0.0, 0.1.0.2, 0.25,0.4, 0.5 mg/mL Table 2. Quan t ita t iv e r e s ul ts f o r t he U V-V i s a b sorp t ion m e t hod. Cell ConcentrationRange Calibration Curve CorrelationFunction StandardError DetectionLimit DeterminationLimit BSA 10 mm quartz to 2 mg/mL Y=AX+BA=0.6652 ±0.0079 B=-0.0130±0.0064 0.9994 0.0219 0.0097 mg/mL 0.0470 mg/mL Micro cell to 1 mg/mL Y=AX+BA=0.6713±0.0043B=-0.0016 ±0.0008 0.9999 0.002 0.0012 mg/mL 0.0218 mg/mL HEL 10 mm quartz to 0.5 mg/mL Y=AX+B A=0.6474±0.0459B=-0.0150±0.0109 0.9991 0.0076 0.0041 mg/mL 0.0680 mg/mL Micro cell to 0.25 mg/mL Y=AX+BA=2.7499±0.0429B=-0.0060±0.0055 0.9995 0.0031 0.0020 mg/mL 0.0096 mg/mL 10 mm quartz to 0.5 mg/mL Y=AX+BA=1.904±0.0237B=-0.0035±0.0070 0.9997 0.0042 0.0037 mg/mL 0.0615 mg/mL Micro cell to 0.5 mg/mL Y=AX+B A=2.1279 ±0.0655 B=-0.0202±0.0193 0.9983 0.0104 0.0091 mg/mL 0.1263 mg/mL Biuret Method To prepare the Biuret reagent , 60 mL o f 10% NaOH wa s added to 100 mL of aq u eous solution to dissolve 0.3 g CuSO and 1.2 Roc h e ll e salt . Then 200 m L of wa t er was add e d to t h is mixtur e . 2.0 mg of the Biuret reagent is added to 500 uL of an aqueous protein solution. To determine the l ength of time necessa r y for the chromogenic reaction to stabi l ize, the absorbance of human serum albumin (HSA) was monitored at 540 nm and shown on the l eft i n Figu r e 1. The data indicate t h at the Biuret r eagent should react with protein samples for at leas t 60 minutes before absorbance measurements are obtained. 28600 Mary's Cour t , E a s to n , M D 21601US A 60 Figure 1. Ti m e co u r s e me as ur e men t (l e f t) of t h e c hromo genic react ion a n d t h e abs o r ption s pec t r um (r ig h t) o f HS A rea c t e d w it h t h e B i ur e t r eag ent. T he a bsor pt ion ma xi mum i s 540 nm. Figure 2 i l l ustrates the color c h ange u p on addit i on of the Biur e t reagent to prot e in solut i ons. Figure 2. Color c h a ng e i n prot ei n sol u t i o n s a fter t h e a dd it ion o f t he Bi u r e t r e agent . The absorbances of bovine serum albumin (BSA), hen egg lysozyme (HEL), and chymotryps in from bovine pancreas were measured at 540 nm. Calibration curves were created us i ng the follow concentrations a n d the results of the cal i bration cu r ves are l i sted in Table 3. BSA 10 m m r ectang ul a r q u artz cel l Micro cell HEL 10 mm r ectangu l ar quartz cell Micro cell a-chymotrypsin 10 mm rectangular quartz cell Micro cell 0.0,0.25,0.5,1.0, 5.0, 9.0 mg/mL 0.0,1.0,3.0,5.0, 9.0 mg/mL 0.0,1.0,3.0,5.0.9.0 mg/mL 0.0,1.0,3.0,5.0.9.0 mg/mL 0.0,1.0,3.0,5.0.9.0 mg/mL 0.0,1.0,3.0,5.0.9.0 mg/mL 28600 Mary's Cour t , E a s to n , M D 21601US A USGO Table 3. Qu an tit ati v e results f or t he Bi ur et m e thod . Cell ConcentrationRange Calibration Curve CorrelationFunction StandardError DetectionLimit DeterminationLimit BSA 10 mm quartz to 9 mg/mL Y=AX2+BX+CA=-0.0005±4.3444-10-5 B=-0.0548 ±0.0004C=0.0505 ±0.0004 1 0.0109 0.008 mg/mL 0.1483 mg/mL Micro cell to 9 mg/mL Y=AX2+BX+CA=-0.0016 ±0.0003B=-0.0653±0.0027C=0.0509±0.0008 0.9998 0.0775 0.0696 mg/mL 1.0127 mg/mL 10 mm quartz to 9 mg/mL Y=AX2+BX+CA=-0.0009±4.9343-10-5 B=-0.0591±0.0005 C=0.0509 ±0.0008 1 0.0144 0.0133 mg/mL 0.2420 mg/mL Micro cell to 0.9 mg/mL Y=AX2+BX+CA=-0.0053±0.0005B=-0.0983±0.0048C= 0.0476 ±0.0063 0.9999 0.0786 0.0640 mg/mL 10 mm quartz to 9 mg/mL Y=AX2+BX+CA=-0.0012±0.0004B=-0.0064±0.0035C=0.0578±0.0060 0.9996 0.0958 0.0934 mg/mL 1.2987 mg/mL Micro cell to 0.9 mg/mL Y=AX2+BX+CA=-0.0010±0.0003B=-0.0614±0.0025C=0.0343 ±0.0043 0.9998 0.0697 0.0695 mg/mL 0.9987 mg/mL Lowry Method Dissolve 2 g of anhydrous sodium carbonate a n d 0.4 g caustic soda i n 100 mL water to obtain a 2% Na,CO, solu t i on.Then dissolve 50 mg copper (II) sulfate pentahydrate and 0.1 g potassium sod i um tartrate tet r ahydrate i n 10 mL of water to create a 0.5% CuSO solution. To prepare the Lowry r eage n t , mix 50 mL of the 2% Na ,CO, solution wi t h 1 mL of 0.5%CuSO, solution . I m mediately add 2.5 mg th e solution to 500 u L of an aqueous prot e in solution, t h e n add a phenol reage n t , ra p idly mix, a n d al l ow the solu t io n to reac t for 60 min utes b efore o b tai n ing absor b a n ce measurements. The protein so l utions reacted wi th the alkaline copper and phenol reagent wil l tu r n blue and absorb at 750 nm. The time course measurement of the c h romogenic react i on was measured at 750 nm and the absorbance became stable after about 60 m i nutes (Figure 4, left). The spectrum of H SA aqueous solutions t hat were measured 60 minutes after the reaction with the Lowry reagent are shown on the r i ght i n Figure 4. JASCO INC. Figure 3. C olor c h ang e i n protei n sol u tio n s a ft e r t h e a ddi t ion o f t he L ow r y r e a g en t . Figure 4. T ime cour se m eas u r emen t (lef t) of t he c h r omo gen i c r eactio n an d t h e a b s or pt ion spect r um (r igh t) o f HS A r eacted w i t h t h e Lo w ry r ea ge n t. Th e a b sorp t ion m axi m u m i s 750nm . The absorbances of bovine serum albumin (BSA), hen egg lysozyme (HEL), and chymotryps in from bovine pancreas were measured at 750 nm in bot h the 10 mm m i c r o cell and r ectangular cell. Calibra t ion curves were c r eated using the follow concentrations and the results of the calibrat i on curves are li sted in Table 4. BSA 0.0,2.0, 290,50, 100, 200 mg/mL a-chymotrypsin 0.0,2.0,20, 50, 100, 200 mg/mL JASCO INC. 28600 Mary's Cour t , E a s to n , M D 21601US A Table 4. Q u a nt i t a tive res u lt s f o r the Lowr y met h od. Cell ConcentrationRange Calibration Curve CorrelationFunction StandardError DetectionLimit DeterminationLimit BSA 10 mm quartz to 200 mg/mL Y=AX2+BX+CA=-4.4663·10-6±5.5049-10-7B=0.0041±0.0001 C=0.0250±0.0034 0.9999 1.2336 0.8385 mg/mL 3.9441 pg/mL Micro cell to 200 mg/mL Y=AX2+BX+CA=-4.0578-10-6±1.3689.10-6B=0.0041±0.0003 C=0.015-±0.0097 0.9994 2.5325 2.3903 mg/mL 10.1765 pig/mL 10 mm quartz to 200 mg/mL Y=AX2+BX+CA=-5.6033·10-6±7.2903.10-7B=0.0049±0.0001 C=0.0293±0.0037 0.9998 1.3861 0.7598 mg/mL 3.5722 pg/mL Micro cell to 200 mg/mL Y=AX2+BX+CA=-4.8873-10-6±8.2675·10-7 B=0.0047±0.0002C=0.00076±0.0042 0.9997 1.6514 0.8911 mg/mL 4.1471 pg/mL 10 mm quartz to 200 mg/mL Y=AX2+BX+CA=-1.0948·10-5±4.3250·10-7B=0.0061±8.8164.10-5 C=0.0112±0.0027 1 0.685 0.4371 mg/mL 7.6764 pg/mL Micro cell to 200 mg/mL Y=AX2+BX+CA=-8.8298·10-6±8.8527.10-7 B=0.0054±0.0002 C= 0.0167±0.0055 0.9999 1.3341 1.0214 mg/mL 16.3006 pg/mL
确定


还剩5页未读,是否继续阅读?

产品配置单
佳士科商贸有限公司为您提供《蛋白质的定量测定》,该方案主要用于天然高分子材料中蛋白质浓度、校准曲线、定量检测,参考标准--,《蛋白质的定量测定》用到的仪器有jasco紫外可见分光光度计 V-700
推荐专场
相关方案
更多
该厂商其他方案
更多