


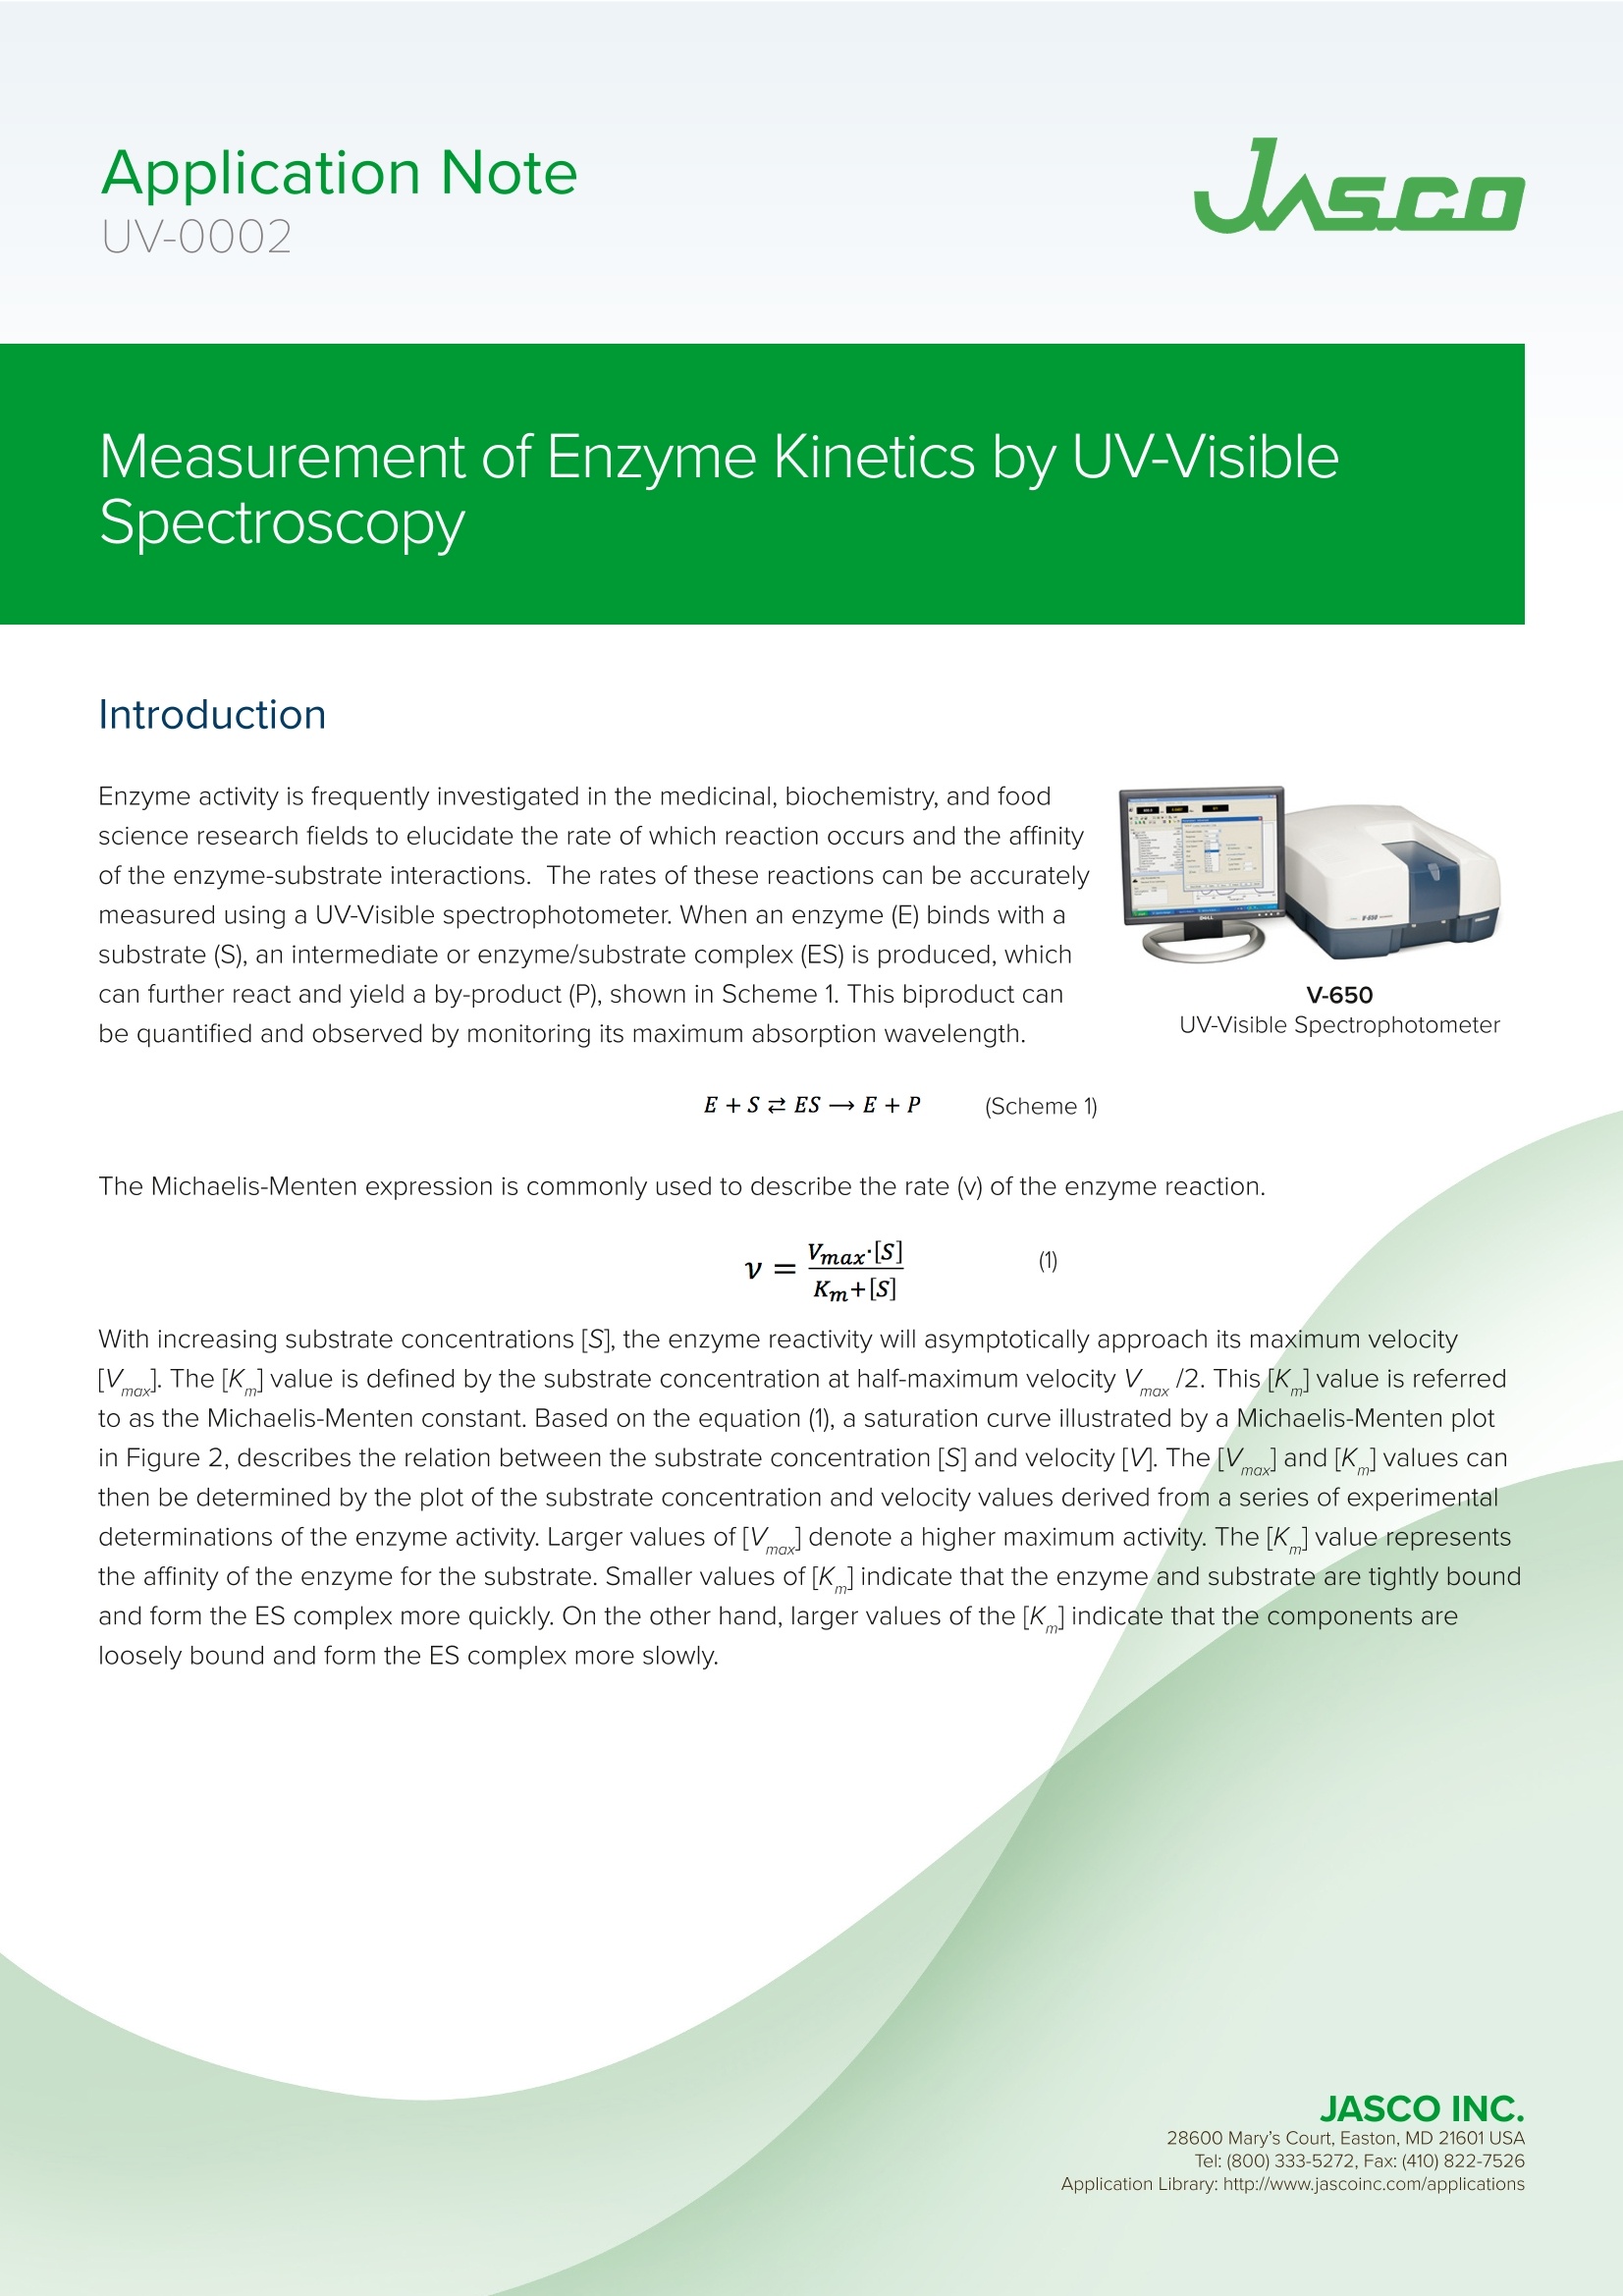
本应用说明将描述如何使用对硝基苯酚的最大吸收量来确定底物浓度[S]和速度v。
关键词:V-650,紫外可见/NIR,校准曲线,定量,生物化学,动力学,酶,STR-707水恒温样品池架与搅拌器,CSP-478样品架
方案详情

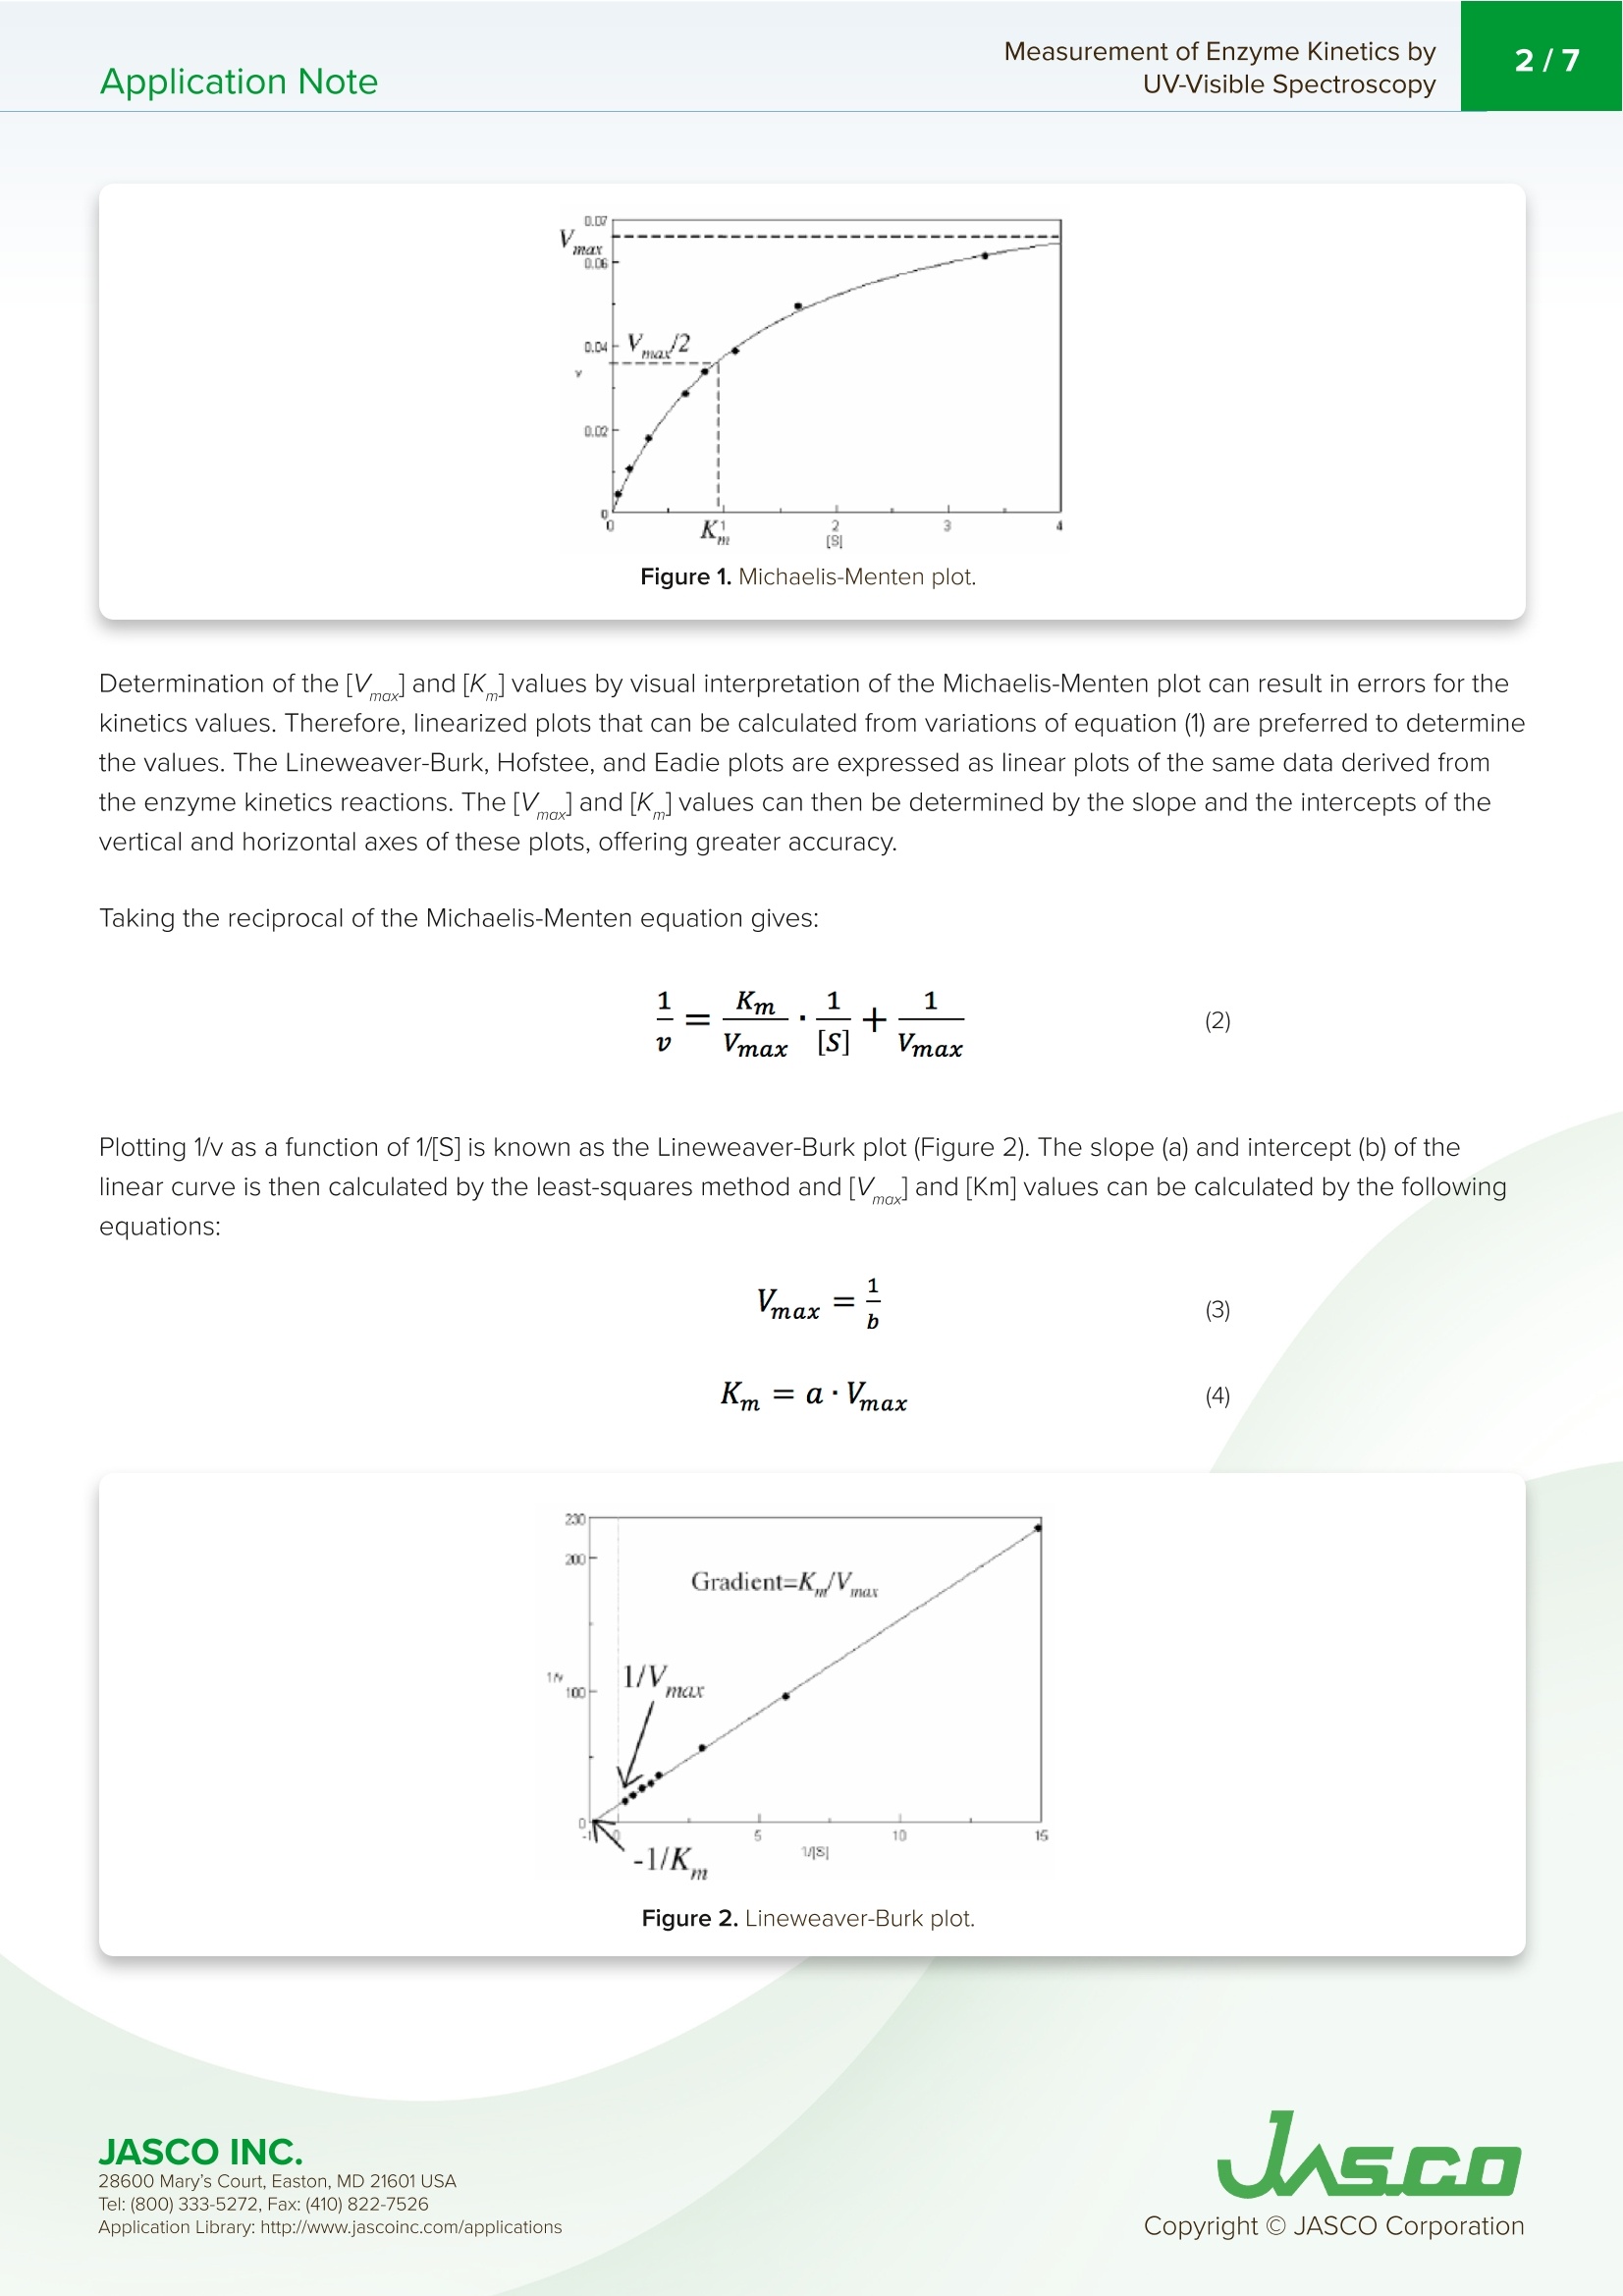
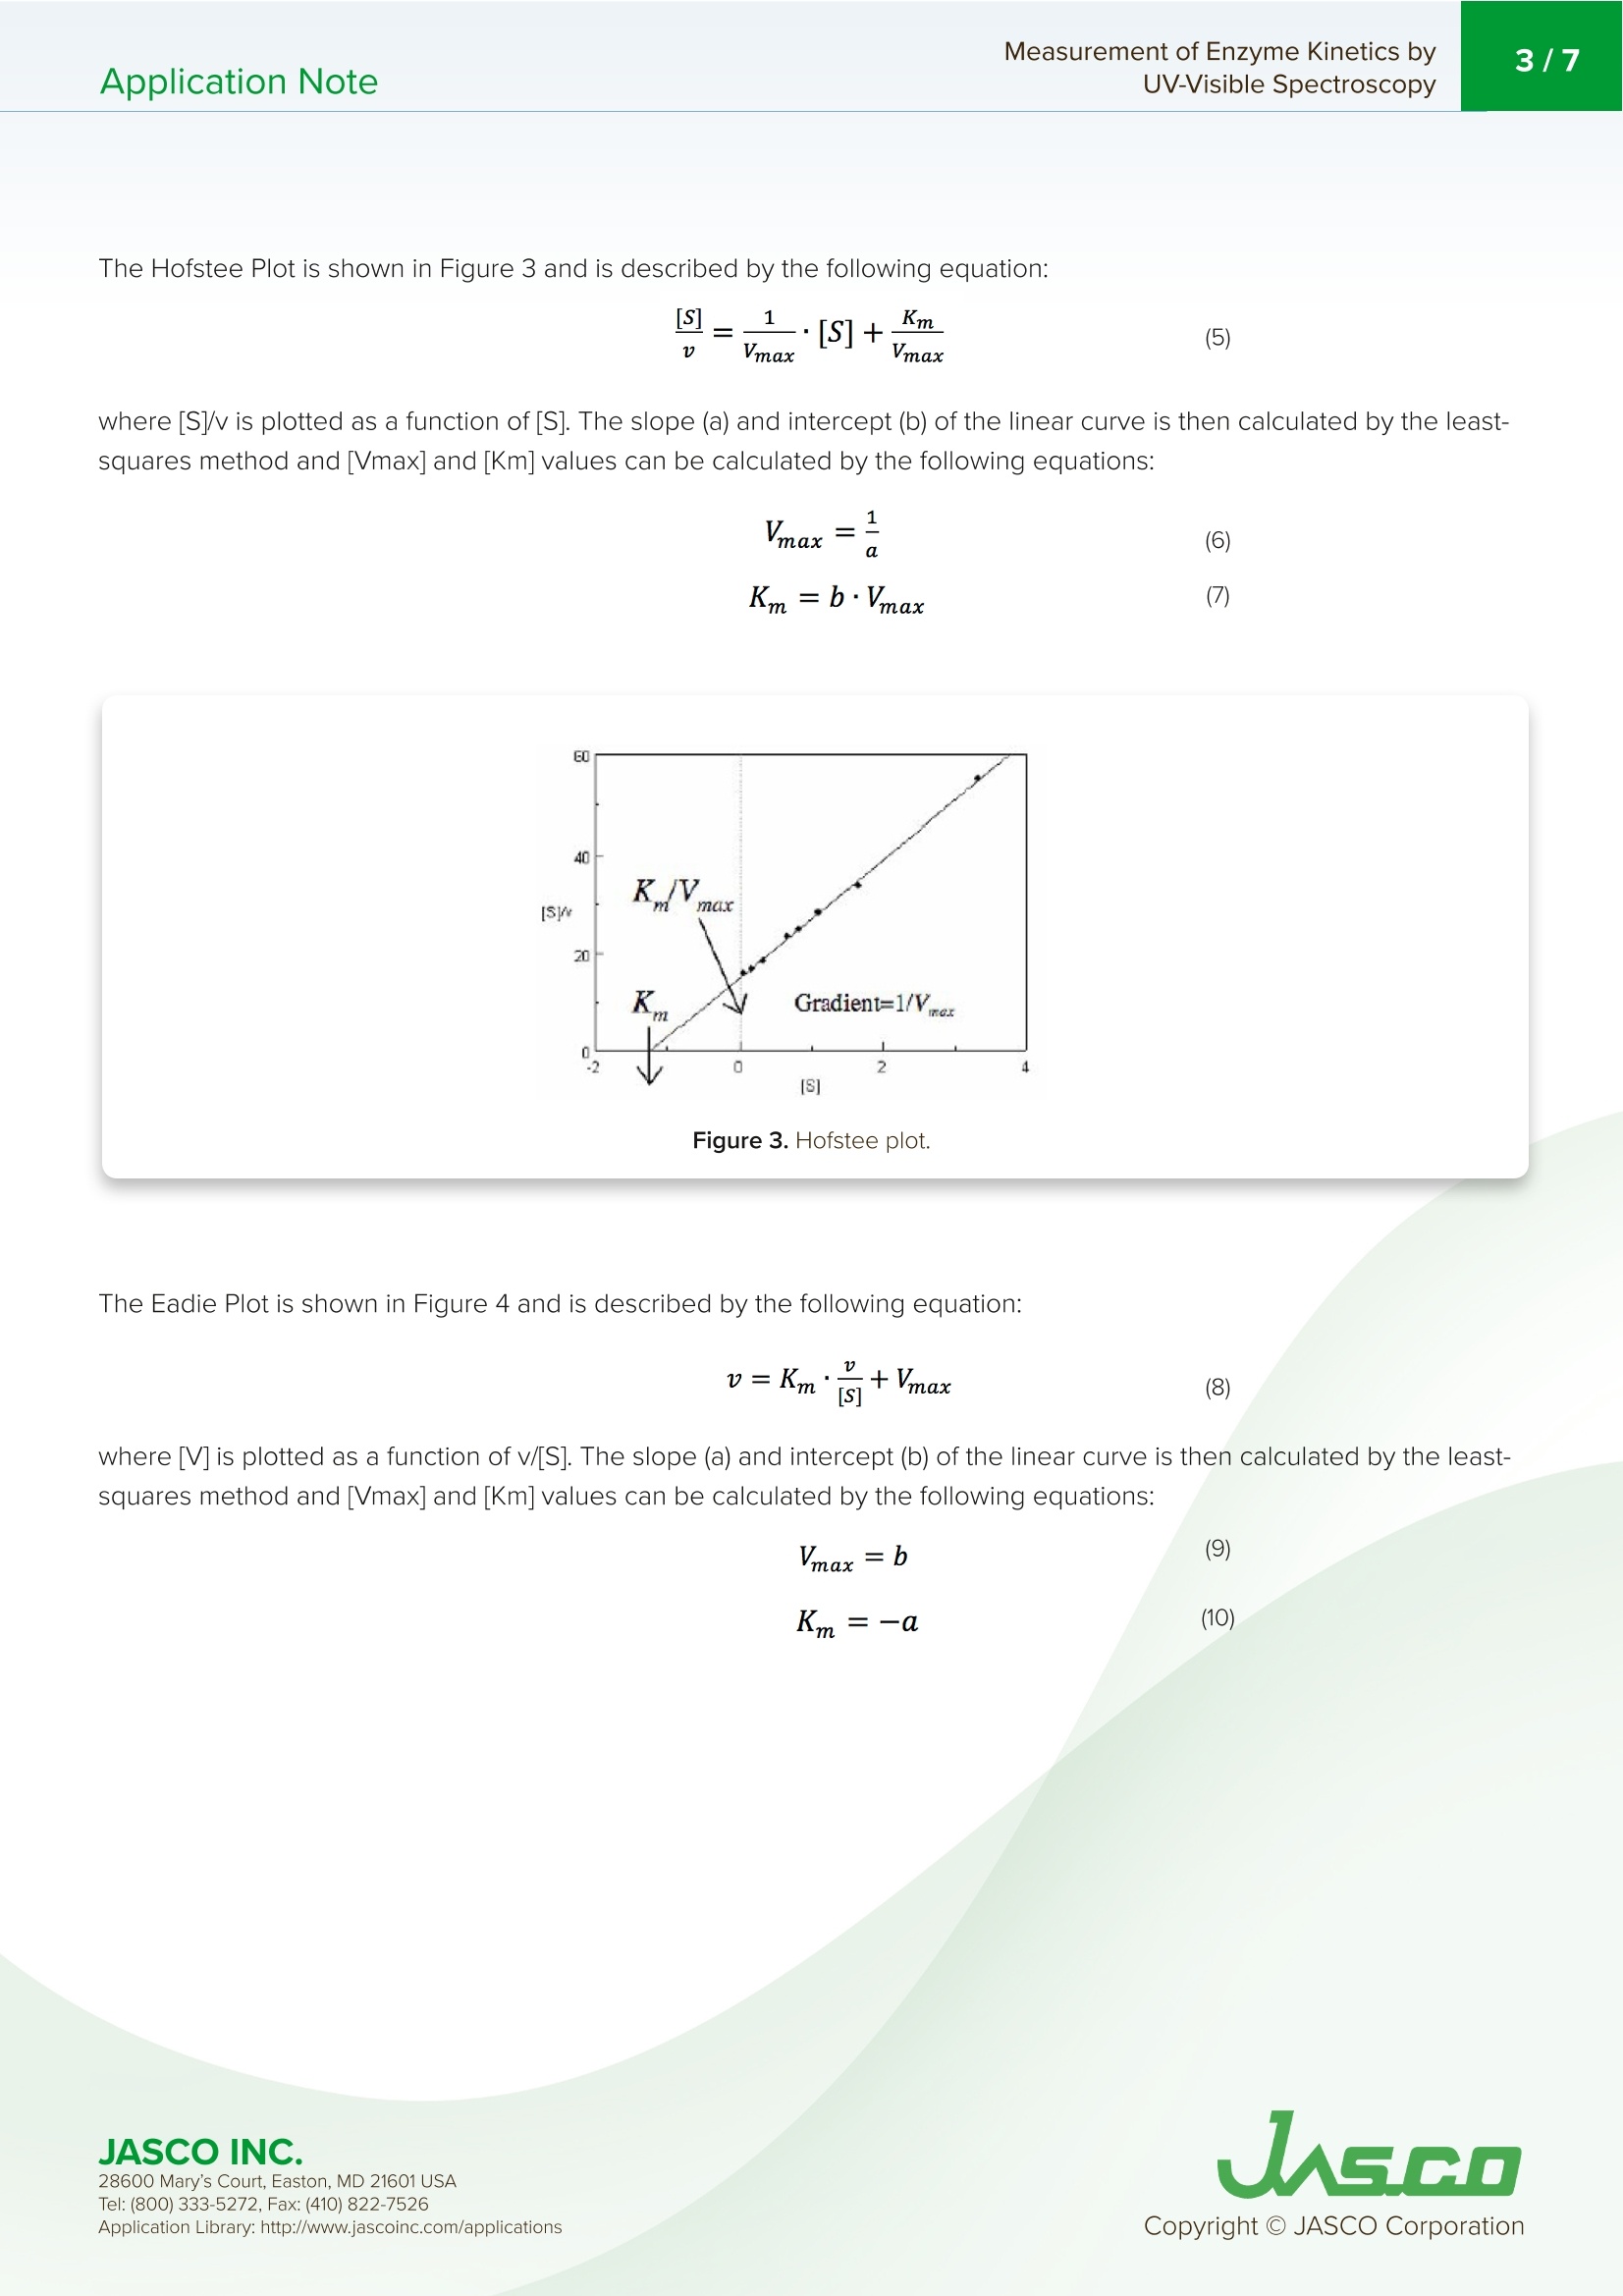
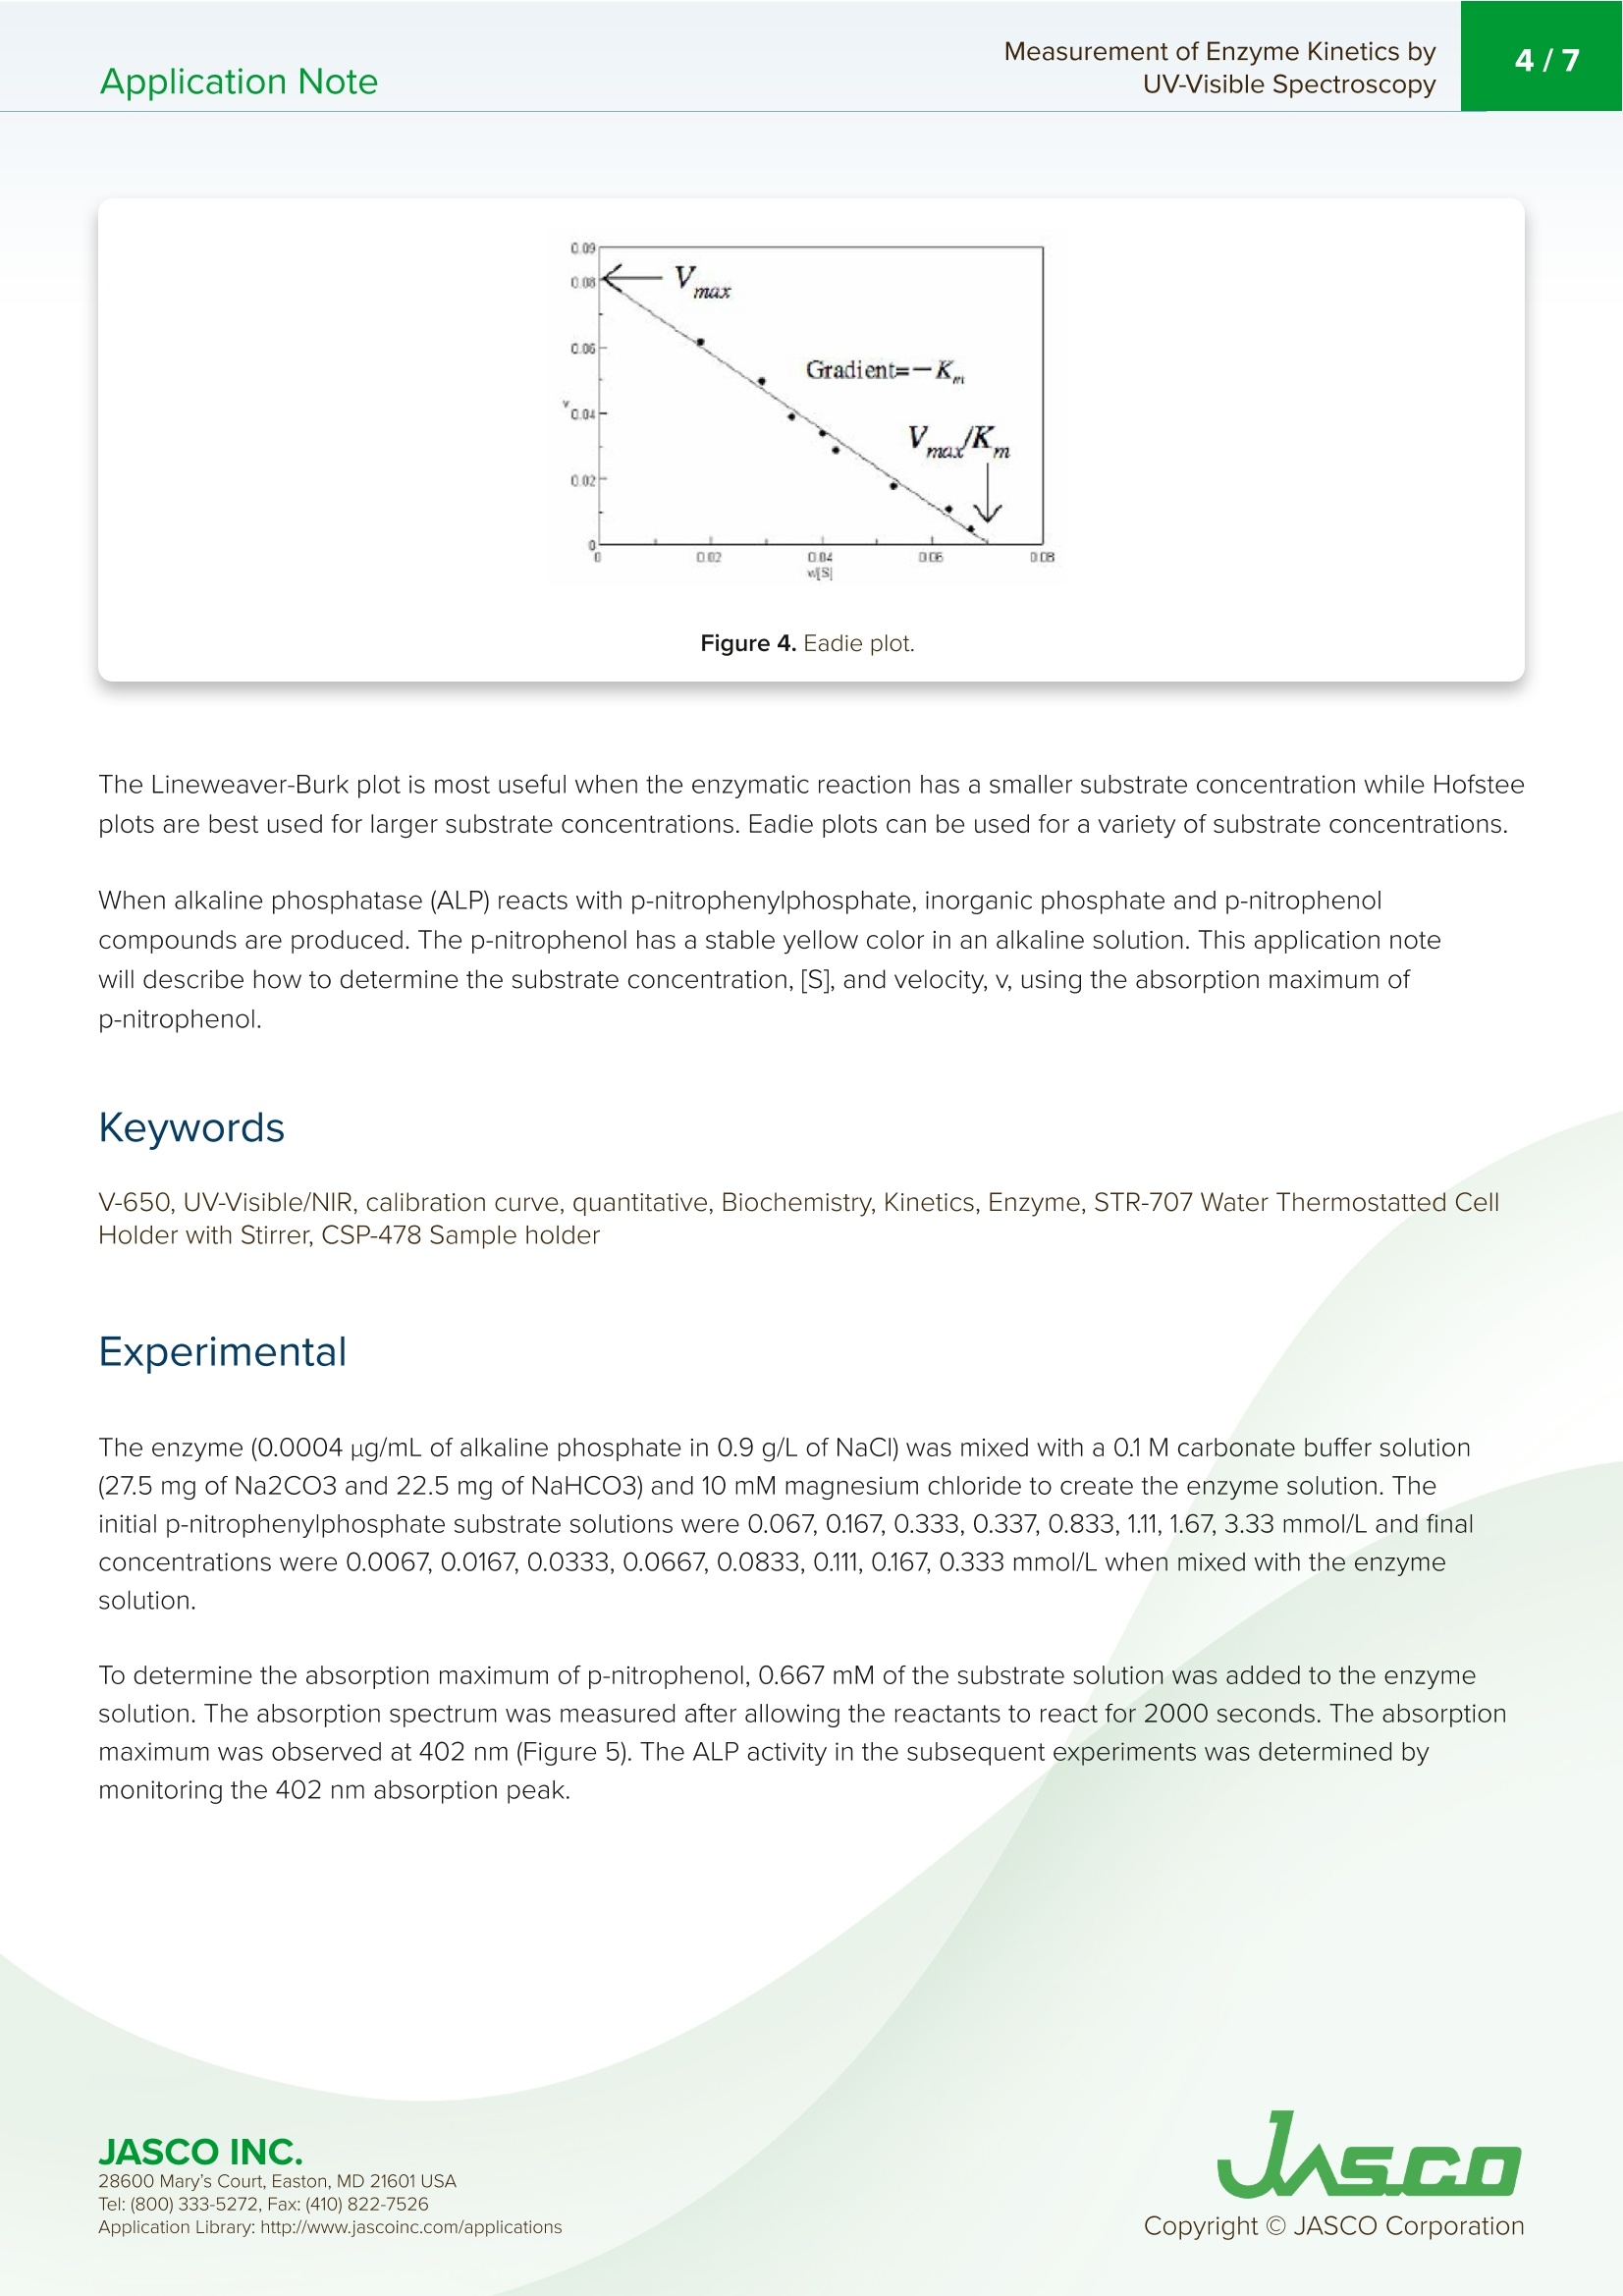
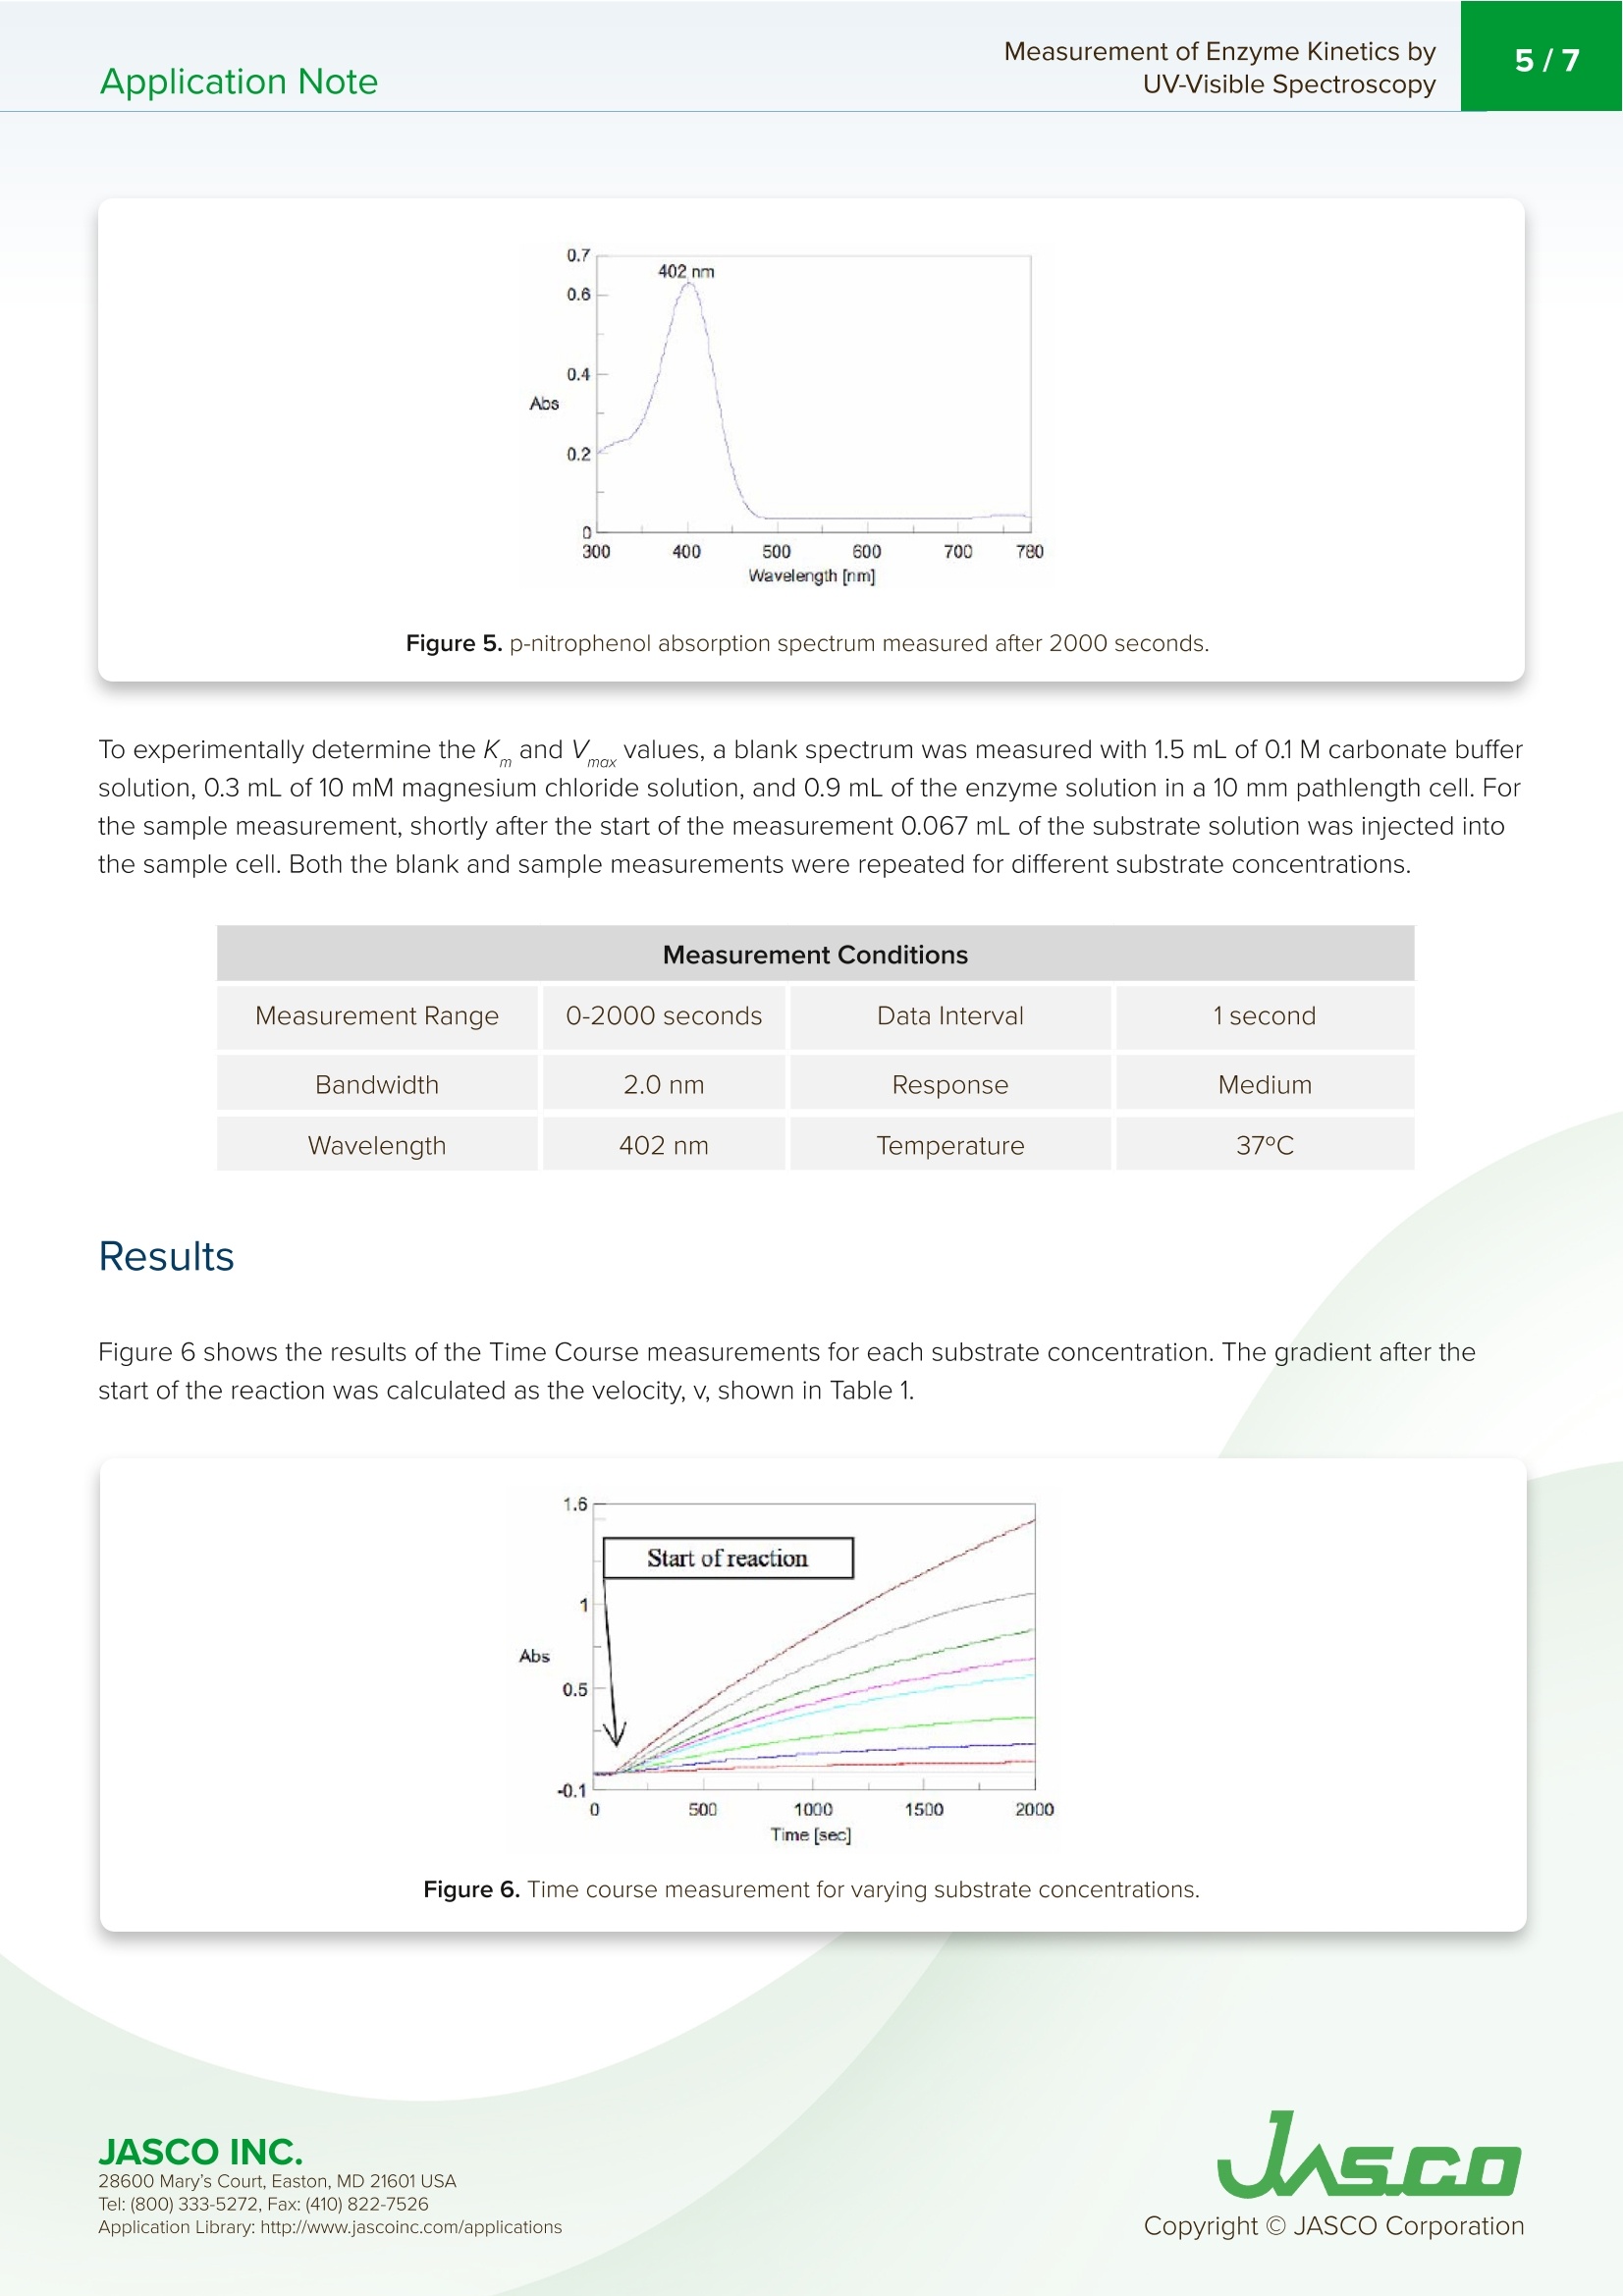
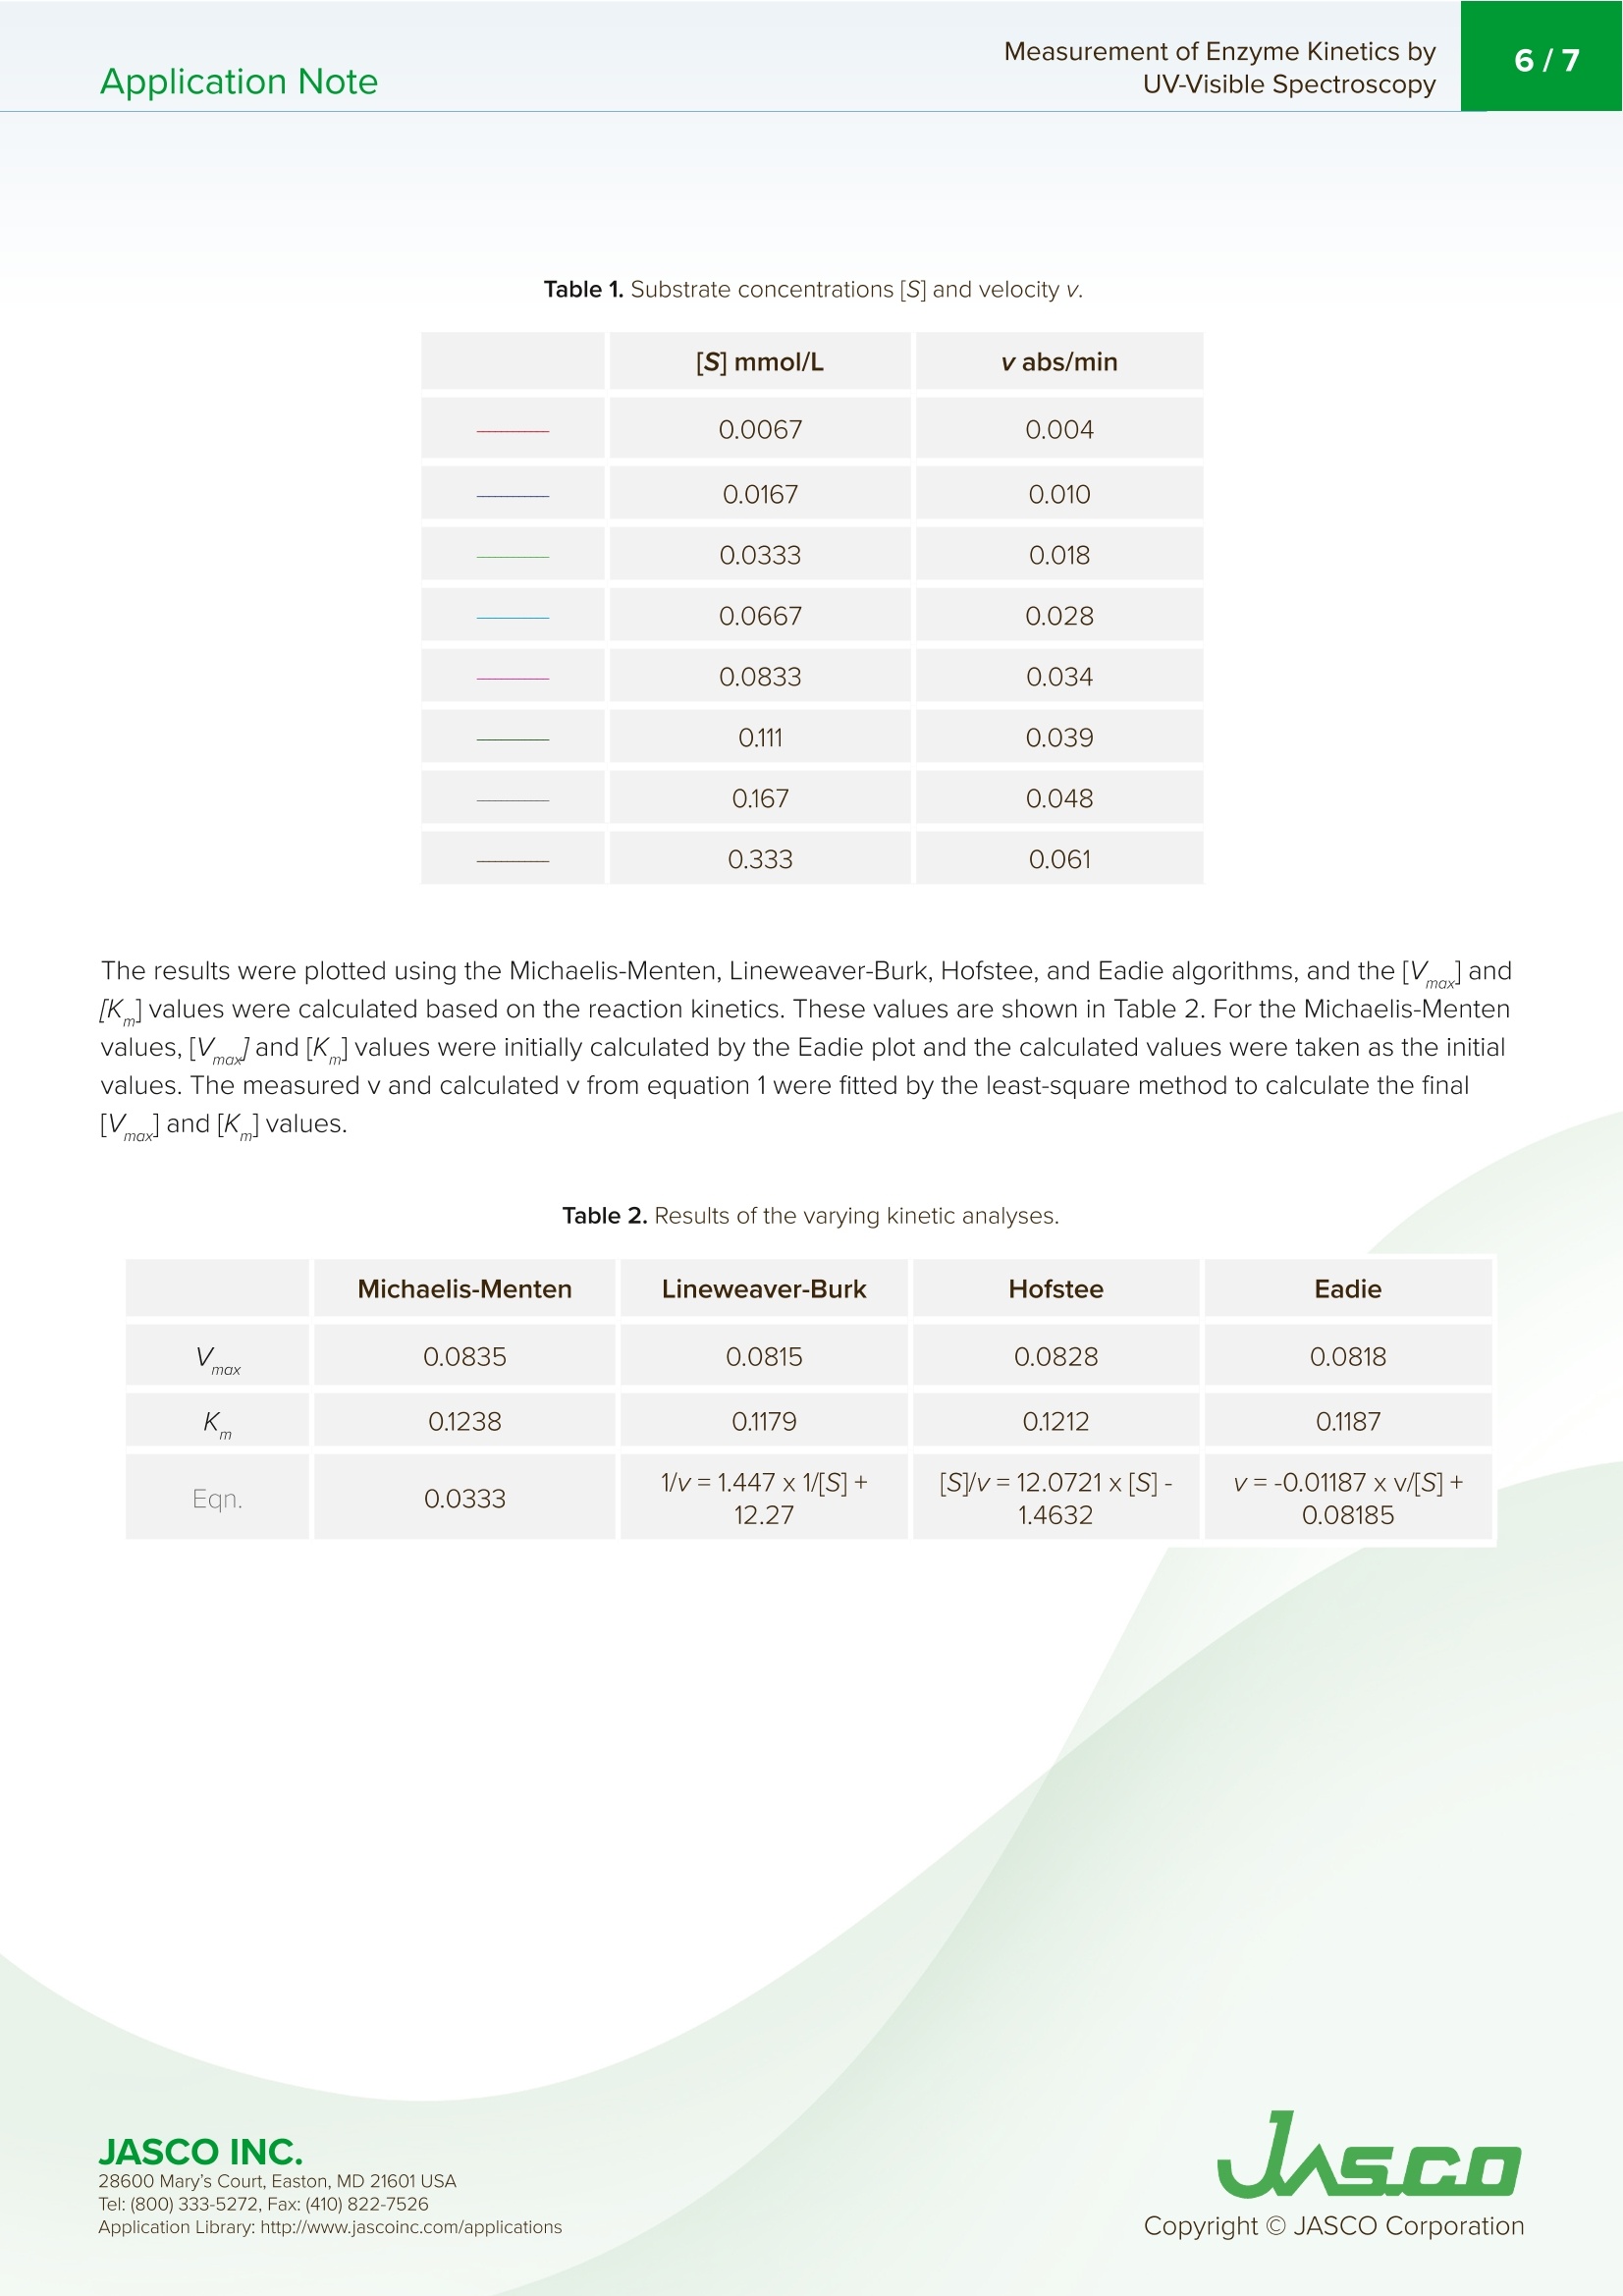
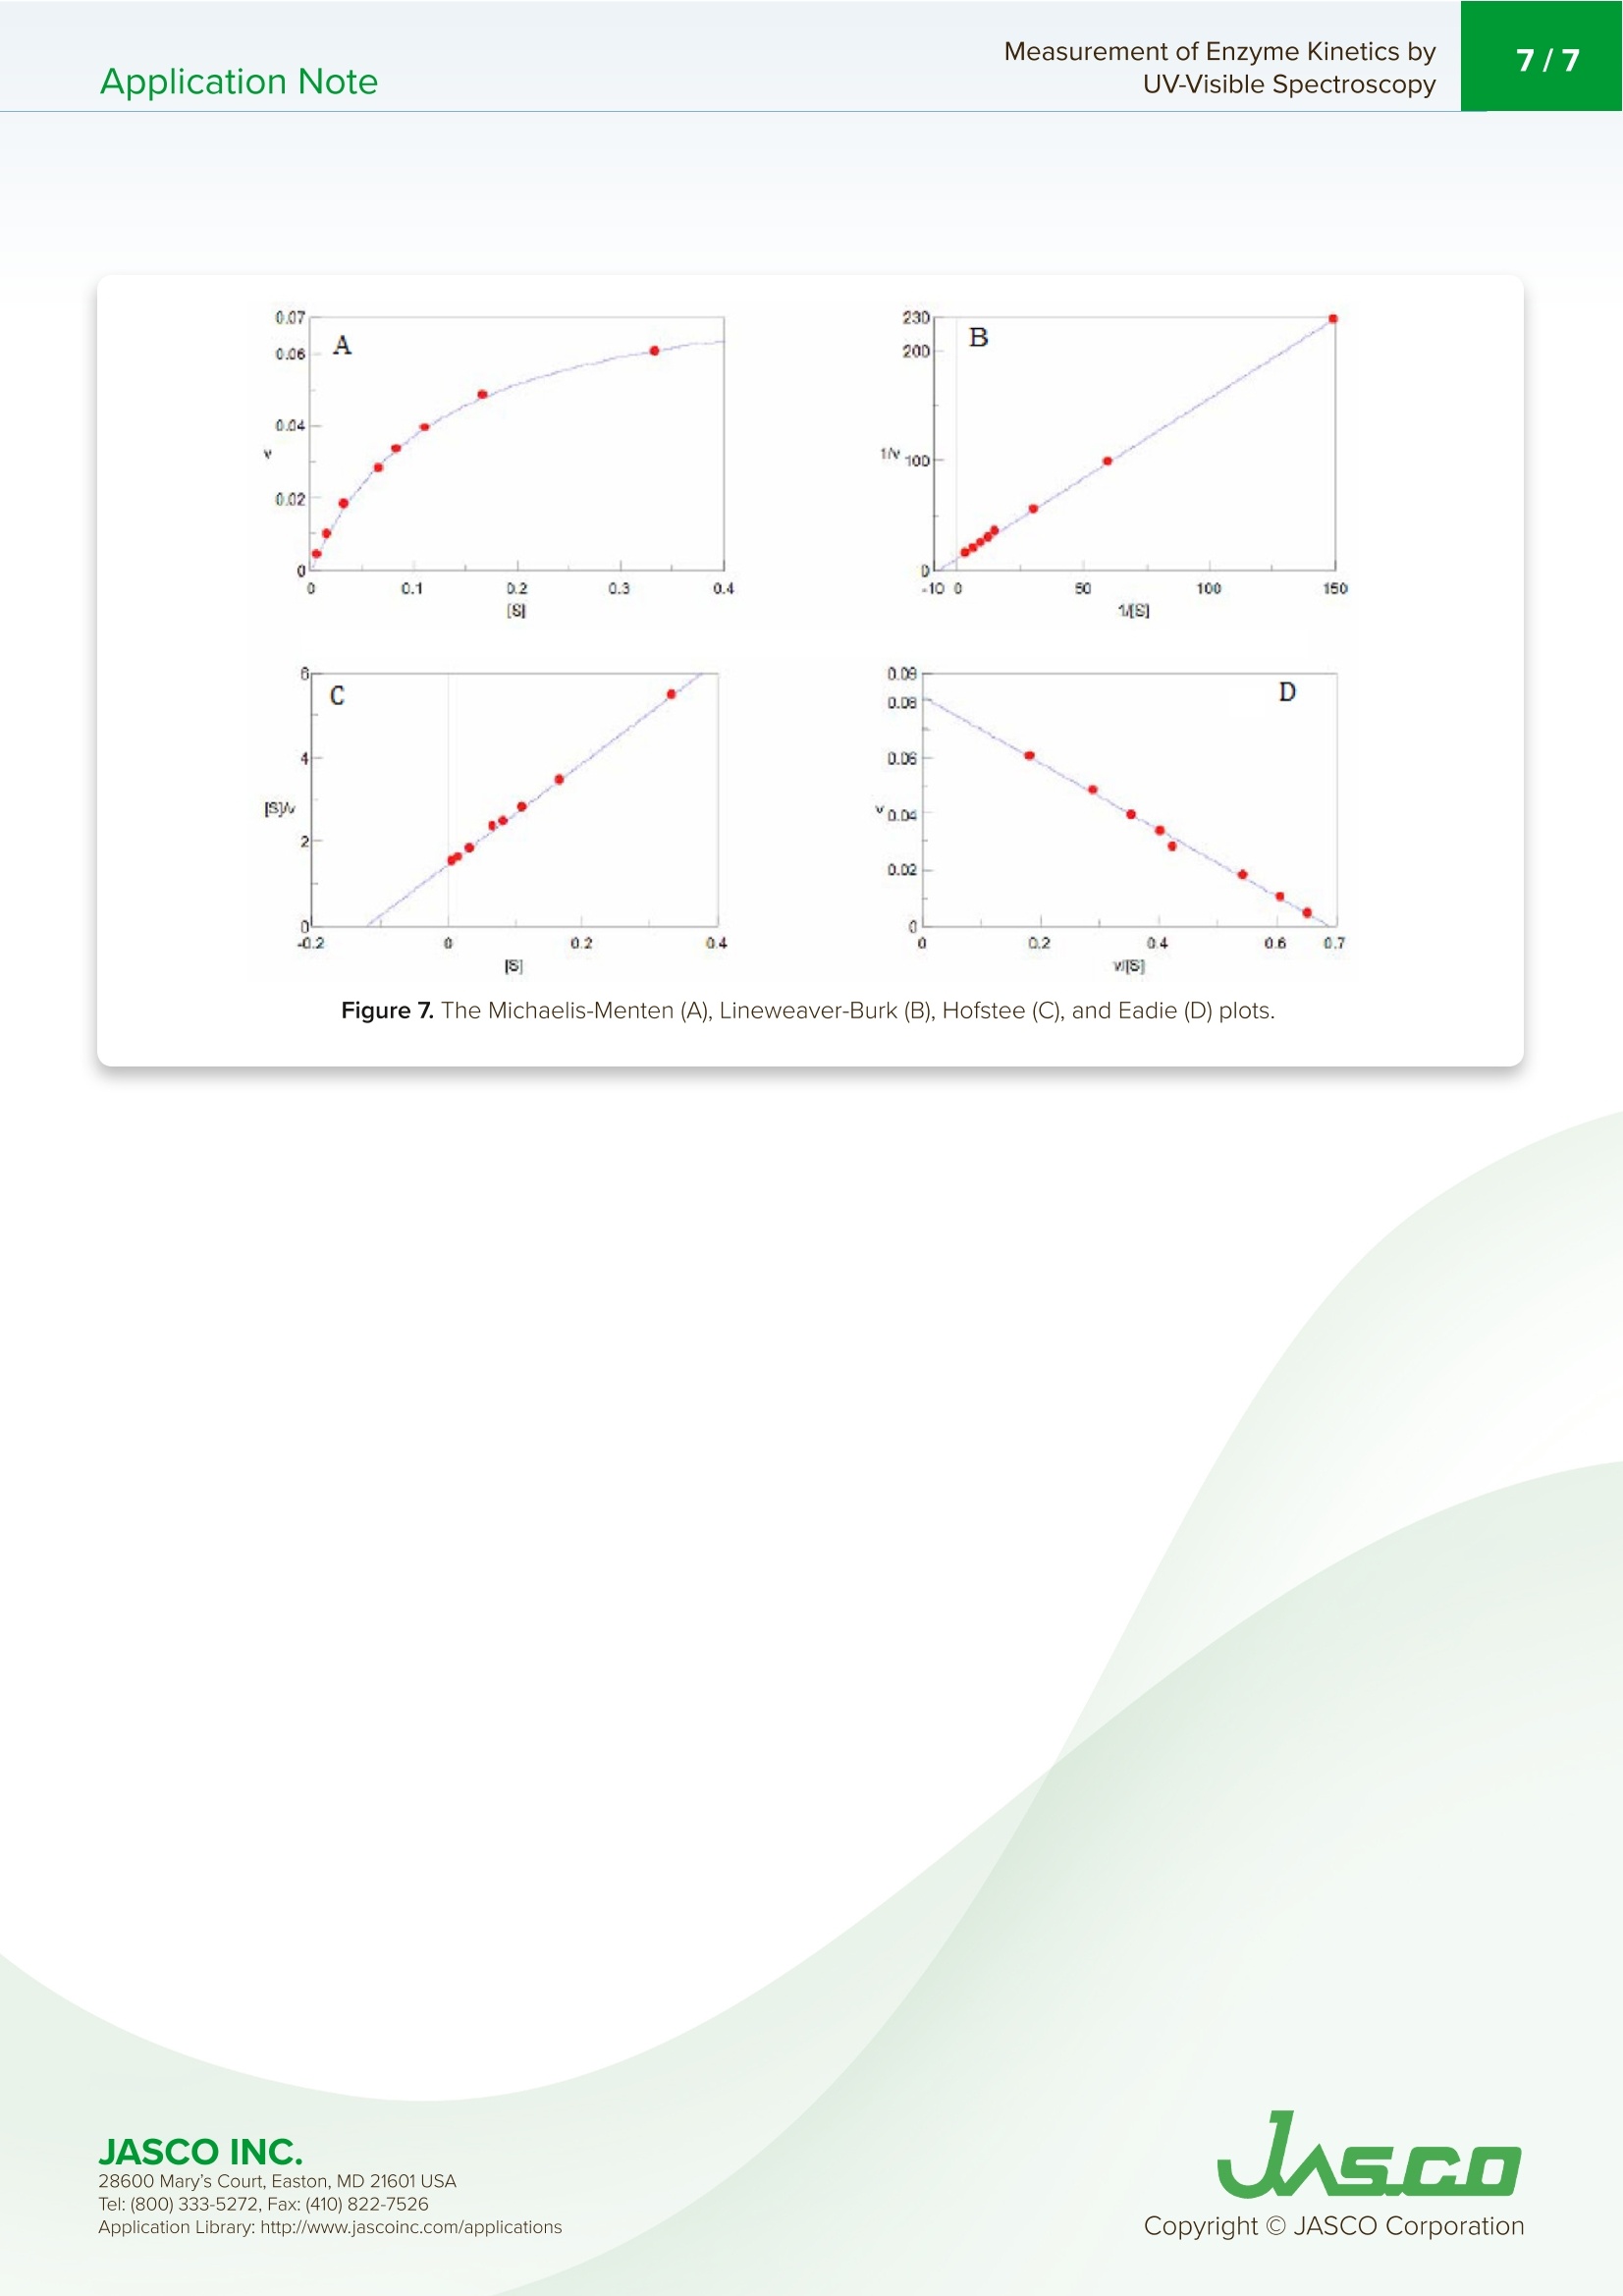
酶活性经常在医学、生物化学和食品科学研究领域进行研究,以阐明反应发生的速率和酶-底物相互作用的亲和力。这些反应的速率可以用紫外-可见分光光度计准确地测量。Application Note Measurement of Enzyme Kinetics byUV-Visible Spectroscopy2/7Application Note Measurement of Enzyme Kinetics by UV-Visible Spectroscop y In tr od u c t ion Enzyme activ i ty i s frequently i nvest i gated in the med i c i nal, bioc h emistry, and food sc i ence researc h fields to eluc i date the r ate of wh i ch r eaction occurs and the affinity of the enzyme-substra t e i n teractions. The rates o f these reac ti ons can be accurately measured using a UV-Visib l e spect r ophotometer. When a n enzyme (E) binds wit h a subst r ate (S), an intermediate or enzyme/substrate complex (ES) is prod u ced, wh i c h can f u r ther react and yie l d a by-product (P), s h own i n Scheme 1. This biproduct can be quant i f i ed and observed by mo n itor i ng its maximum absorption wavelength. V-650 UV-Visi b le Spect r o p hoto m ete r The Micha e lis-Menten expression is commonly u sed to d e scribe the rate (v) of t h e enzyme r eaction. Wit h i ncreasi n g substrate concentrations [S], the enzyme reac t ivity will asymptotically appro a ch its maximum velocity [V ]. T h e [K ] value is defi n ed b y t h e s ub strate co n cent r ation at hal f-maximum velocity Ⅴ/2. This [K ] value is referred to as the Michaelis-Menten constant. Based on th e eq u ation (1), a saturat i on curve illus tr ated by a Michael i s-Me n ten plot i n Figu r e 2, describes the relation between the subst ra te conce n trat i on [S] a nd velocity [M . The[V]and[K ] v a lues ca n then b e deter mi ned by the plot of the s u bs tr ate concentrat i on and ve l oc i ty values derived from a series of exper i mental determina ti ons of the en z yme ac t ivity. Larger values of [V ] denote a higher maximum activity. T he [K ] value represents the af f inity of t he e n zyme f or the s u bst r a t e . Smal l er valu e s of [K ]i nd icate th a t th e enzyme and substrate are t ightly bound and f orm t h e ES complex mor e quick l y. On th e othe r h and, larger va lu es o f th e [K ] in dicate that t h e components are loos e ly bound a n d for m th e ES compl e x mor e slowly. Figure 1. Mi cha e l is -M e n t e n p lot. Determ i nation of the [Vo x ]and [K ]values by visual interpretation of the Michaelis-Men t en plot can result in errors for t h e kinet i cs values. Therefore, linearized plots that can be calcu l ated f rom variat i ons of equation (1) a r e prefer r ed to determine the va l ues. The L i neweave r -Burk, Hofstee, and Eadie plots are expressed as linear plots of t h e same data derived f r om the e n zyme kinetics react i ons . The [V]a n d [K ] va l ues can the n be determined by the slope and the i n tercepts of the vertical and h orizontal axes of these plots, offer i ng greater accu r acy. Taking t h e reciprocal o f the M i c h ael i s-Menten equat i on gives: Plotting 1/v as a fu n ction of 1/[S] is known as the Lineweaver-Burk plot (Fig u re 2). The slope (a) and intercept (b) of the li n ear curve is the n calcu l ated by the least-squares method and [V]and [Km ] values can be calculated by the fol l owing equa t ions : Figure 2. L i n e w ea ver-B ur k p l o t . 28600 M a ry's Co u rt , E a st o n , M D 21601 US A USGO The Hofstee Plot is shown in Fig ur e 3 a n d is described b y the f ollowing equa ti on: where [S]/v is plotted as a function of [S]. The slope (a) a n d i n tercept (b) of the linear curve i s then calculated by the least-sq u ares method and [Vmax] and [Km] values ca n be ca l culated by the f ollowing equations: K=b.Vmax (7) Figure 3. Ho f stee p l ot. The Ead i e Plot i s shown in F i gu r e 4 and is described by t h e fol l owing equation: where [V] i s plotted as a f u n c t ion of v/[S]. The s l ope (a) and i n t ercept (b) of t h e line a r curve i s t h en ca l culated by t h e least -sq u ares method and [Vmax] and [Km] values ca n be ca l c u lated by the f ollowing equations: JASCO INC. 28600 M a ry's Co u rt , E a st o n , M D 21601 US A Figure 4. E a d i e p l o t . The Lineweaver-Burk plot is most useful whe n the enzymatic reaction h as a smaller su b strate concent r ation whi l e Hofstee plots are best used for l arger substrate co n cent r ations. Eadie plots ca n be used for a variety of substrate concen tr ations. When alkaline phosphatase (ALP) reacts with p-nitropheny l phosphate, i norgan i c phosphate and p-nitrophenol compounds are produced. The p-n i trophenol has a stable yellow color in an alkaline solution. This application note will describe how to determine t he substrate concent r ation, [S], and velocity, v, using the absorption maximum of p-n itrophenol . Keyword s V-650,UV-Vi s i bl e/N I R, ca l ibra ti on c u rve , quan ti t ative, Bio c h em i stry , Kinet i cs , Enz y me , ST R -707 Water T her mo sta tt ed Cel l H o ld er wit h S t i rr er , C S P-478 Sa m p l e h o l d e r Exper i mental The enzyme (0.0004 ug/mL of al k al in e phosphate i n 0.9 g/L of NaC I ) was mixed with a 0.1 M carbonate buffer solution (27.5 mg of Na2CO3 a n d 22.5 mg of NaHCO3) and 10 mM m agnesium c h loride to create t h e enzyme sol u tion. The initial p -nitrophenylphosphate substrate so l utions were 0.067,0.167, 0.333, 0.337, 0.833, 1.11, 1.67, 3.33 mmol /L and f inal concentrat i ons wer e 0.0067, 0.0167, 0.0333,0.0667, 0.0833, 0.111, 0.167, 0.333 mmol/L wh e n mixed wit h the enzyme solut i o n . To determine the absorpt i on maximum of p-nit r ophenol, 0.667 mM of the subst r ate solution was added to the enzyme solutio n . T h e absorption spectrum was measured after allowing t he reactants to react fo r 2000 seconds. The absorption maximum was observed at 402 nm (Figure 5). The ALP act i vity i n the subsequent experiments was determined by monitoring the 402 n m absorpt i on peak. JASCO INC. 28600 M a ry's Co u rt , E a st o n , M D 21601 US A A pp l i c a ti o n Lib r a r y: h t t p://w ww .j a s co in c .c o m/ap pl i cat i o n s Figure 5. p-ni t roph e n ol ab so r pt i o n s p e c t r u m m e asu red a f ter 2000 se cond s . To exper i mentally determine the K and Vvalues, a b lank spectrum was measured with 1.5 mL of 0.1 M carbo n ate buffer solu t ion, 0.3 mL of 10 mM magnesium chloride sol u tion, and 0.9 mL of the enzyme solution in a 10 mm pathleng th cell. For the sample measurement, s h ortly after the sta r t of the measu r ement 0.067 mL of the subst r ate sol ut ion was i n jected into the sam p le cell . Both t he blank and sample measurements were repeated for di f f erent substra t e co n cent r ation s . Measurement Conditions Measurement Range 0-2000 seconds Data Interval 1 second Bandwidth 2.0nm Response Medium Wavelength 402 nm lemperature 37°C R esul t s Figure 6 shows the resul t s of the Time Cou r se measu r ements for eac h substrate concen tr ation. The gradient after t he sta r t of the react i on was calculated as the velocity, v, s h own i n Table 1. Figure 6. T i m e c o ur se m e as u re m e n t fo r v ary i n g s ub s t ra te co n ce n tr at ion s. 28600 M a ry's Co u rt , E a st o n , M D 21601 US A Table 1. Subs t ra te co n c e n tra t ions [S] and v e l o ci ty v. v abs/min 0.0067 0.004 0.0167 0.0333 0.0667 0.0833 0.111 0.039 0.167 0.048 0.333 0.061 The results were p lotted using the Michaelis-Mente n , Li n eweaver-Burk, Hofstee, and Eadie algorit h ms, and the [Vmox]and [K] valu e s we r e calculated based on th e r e action k ine t ics. T h e se values are s h own in T able 2. For th e Micha el is -Men t e n val u es,[V]a n d[K ]values we r e i n itially ca l c u lat e d b y t he Ead i e p lot a n d the calculated valu e s were tak e n as t h e i n itial values. T he m eas u red v and calcul a ted v f rom equ a t i o n 1 we r e f itted by the least -squ a re method t o calculate the f ina l Vm ax and [K ] values. Table 2. R es u l ts o f t h e va r y i n g k i n et i c a n al y s es. Michaelis-Menten Lineweaver-Burk Hofstee Eadie max 0.0835 0.0815 0.0828 0.0818 K 0.1238 0.1179 0.1212 0.1187 Eqn. 0.0333 1/v=1.447×1/[S]+12.27 [S]/v=12.0721x[S]-1.4632 v=-0.01187xv/[S]+0.08185 28600 M a ry's Co u rt , E a st o n , M D 21601 US A Figure 7. The M i c h a e l i s -M en t en (A), L in eweave r -B u r k (B ), H o f s t ee (C), a nd Ead i e (D) p lo t s. 28600 M a ry's Co u rt , E a st o n , M D 21601 US A UASGO
确定
还剩5页未读,是否继续阅读?

产品配置单
佳士科商贸有限公司为您提供《用紫外-可见光谱法测定酶动力学》,该方案主要用于生物医用材料中酶动力、生物化学、检测,参考标准--,《用紫外-可见光谱法测定酶动力学》用到的仪器有jasco紫外可见分光光度计 V-700
推荐专场

相关方案
更多
该厂商其他方案
更多